Data Access and Engineering Modeling KAMM Regional Training

Welcome message from author
This document is posted to help you gain knowledge. Please leave a comment to let me know what you think about it! Share it to your friends and learn new things together.
Transcript

Data Access and Engineering
Modeling
KAMM Regional Training

Overview
Study Area Identification
Study Method Factors
Floodplain Mapping Process Overview
Available Methodology and Analysis
General Requirements, Guidelines and
Standards
Important Terms
Method Examples and Selection Process
Data Sources

Study Area Identification and
Study Method Factors

Identifying Study Areas
CNMS status is Unverified
New Data
Topographic -LiDAR
Hydrologic – Gages, regression equations,
design storm changes
Unmapped areas affected by flooding
1 square mile of drainage area
Physical changes
Recent or planned development
Stream changes – fill, migration, deposition,
channelization, dredging
Structure changes – culverts added or
removed, road construction, flood control
structure changes
Modeling Errors
Software upgrades (i.e. HEC-1 to HEC-HMS)
Study Method Factors
Budget
Population Affected
Risk
Community Request

Study Method Factors Cont.
Previous Effective
Zone/Mapping, up and
downstream models
Nature of Overbank and
Channel Flow (1-D versus 2-D)
Flow analysis – depth and/or
velocity vary with time
Data available
Hydraulic structures
In general, the simplest model that can
solve the problem with accuracy should be
the one selected.


Floodplain Mapping Overview
Data Required
Topographic Data
Flow Data – multiple
recurrence intervals
Channel delineation
and flow direction
Cross Section Data


Available Riverine Hydrology Study Methods
Compute hydrograph from
spatial and temporal rainfall
data, calibration
Sub-basins connected through
system of stream reaches
Statistical analysis of stream
gage data
Analysis based on regional
regression equations for rural
or urban watersheds
Increasing Level of Detail
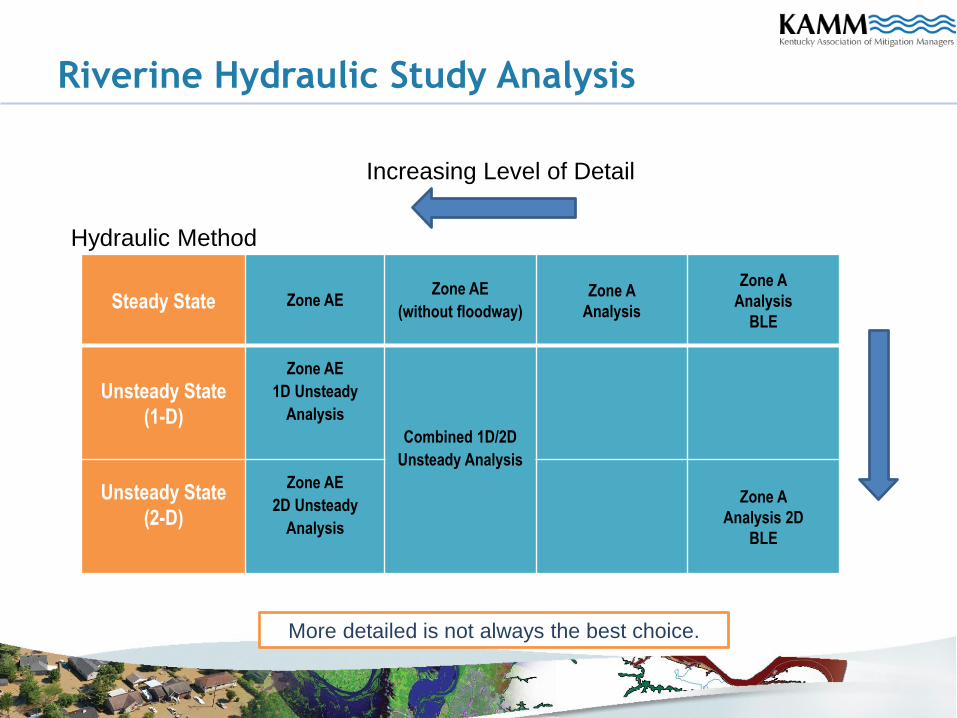
Riverine Hydraulic Study Analysis
Steady State Zone AE Zone AE
(without floodway)
Zone A
Analysis
Zone A
Analysis
BLE
Unsteady State
(1-D)
Zone AE
1D Unsteady
Analysis
Combined 1D/2D
Unsteady Analysis
Unsteady State
(2-D)
Zone AE
2D Unsteady
Analysis
Zone A
Analysis 2D
BLE
Increasing Level of Detail
Hydraulic Method
More detailed is not always the best choice.

General Requirements, Guidelines
and Standards

Topographic Data Requirements and Considerations
Updated topographic data is required to update flood data.
Consider the following:
Contour interval — should be 4 feet or better (2 feet in flat terrain).
Currency of data—whether significant changes (e.g., hydraulic
structures, significant channel modification, development near
channel) have occurred since the data was acquired. If significant
changes not included, supplement with field survey.
SID #44 requires all elevation data to be processed to the bare earth
terrain in the vicinity of floodplains that will require hydraulic
modeling.
Additionally, SID #50 requires that digital terrain model input for a two-
dimensional model must cover the entire 2-D study area and the
derivation or development of the grid must be clearly documented.
See Elevation Guidance

Hydraulic Modeling Guidance
Cross sections must be placed perpendicular to flood flow and
extend beyond the most extreme event modeled.
Cross sections must be spaced so that the geometry and hydraulic
roughness of the reach between adjacent cross sections varies
gradually and that variation can be estimated as linear.
Not required but generally spaced 1,000 feet or less for AE
analysis.
Cross Section Guidance being prepared will include cross section
and structure survey guidance.
See General Hydraulics Considerations Guidance Document and
Hydraulics 1D or 2D guidance.
General Hydraulic Standards
SID # 54 - Where flood elevations are produced
from a hydraulic model, they can be published
as BFEs unless the responsible engineer
documents why they should not be issued.
SID # 74 - The hydrologic, hydraulic, and coastal
analyses and the final regulatory products must
be certified by a registered professional
engineer.

Riverine Model Requirements SID #90 - The methods and models used to evaluate the flood
hazard must be technically reliable, must be appropriate for
flood conditions and produce reasonable results.
Software list available on fema.gov includes: HEC-RAS
3.1.1 and up, HEC-2 4.6.2.1, XP-SWMM 8.52 and up, ICPR
2.20, FLO-2D 2007.06/2009.06, etc.
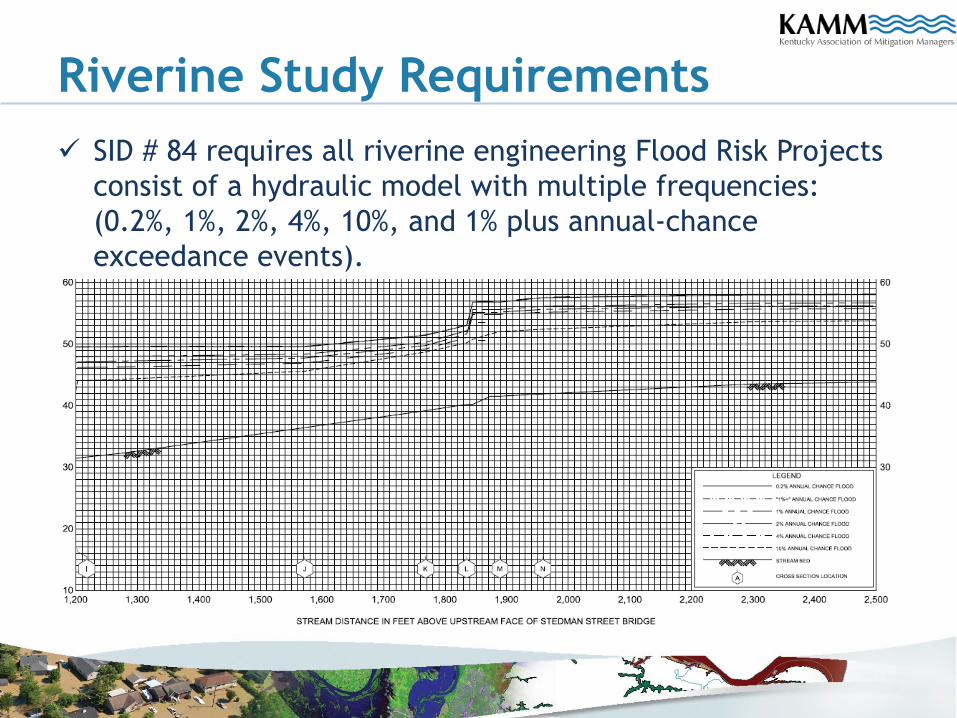
Riverine Study Requirements
SID # 84 requires all riverine engineering Flood Risk Projects
consist of a hydraulic model with multiple frequencies:
(0.2%, 1%, 2%, 4%, 10%, and 1% plus annual-chance
exceedance events).

1% +
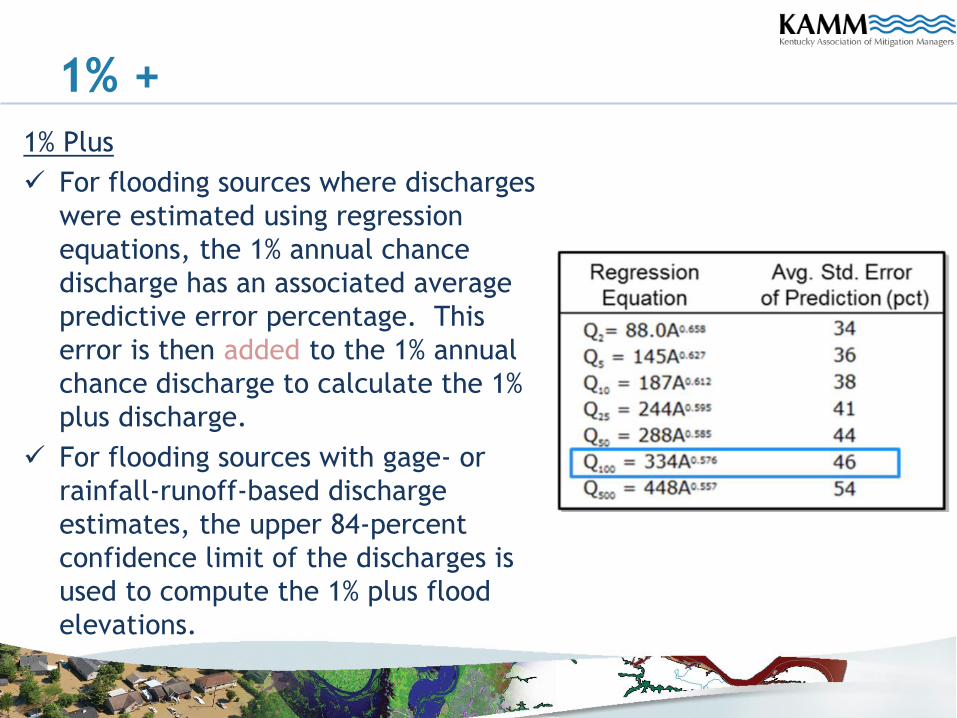
1% Plus
For flooding sources where discharges
were estimated using regression
equations, the 1% annual chance
discharge has an associated average
predictive error percentage. This
error is then added to the 1% annual
chance discharge to calculate the 1%
plus discharge.
For flooding sources with gage- or
rainfall-runoff-based discharge
estimates, the upper 84-percent
confidence limit of the discharges is
used to compute the 1% plus flood
elevations.

1% -1% Minus
This error is then subtracted
from the 1% annual chance
discharge to calculate the 1%
minus discharge.
These calculations help provide a
confidence range within which
the actual 1% annual-chance
discharge at a location is likely
to fall.
If falls within the 68-percent
confidence interval of the gaged
data, then considered
reasonable.
Often used with automated
engineering for CNMS checks.

Future-Conditions 1%Future-Conditions Communities experiencing urban growth may use
future conditions hydrology and hydraulics.
For example increase in impervious area, structures
modifications, future land-use determinations
Some communities regulate based on future
conditions.
When requested by community officials, FEMA allows
inclusion of future conditions on FIRMs and FIS
usually shown as shaded Zone X.
Pros: Eliminates two sets of maps for communities
who enforce future condition regulations, increases
ownership of FIRMs, provides CRS credit, reduction
in future losses, and better partnership with FEMA.
Cons: projected conditions, increase in appeals, and
greater expense.
Not used for flood insurance purposes.

Steady vs. Unsteady Flow
Steady Unsteady
Gradually varying flow Flow attenuation
No flow attenuation Reversed flow during flooding
Rapidly varied flow
Depth of flow/velocity vary with time
Inflow entered as hydrographs

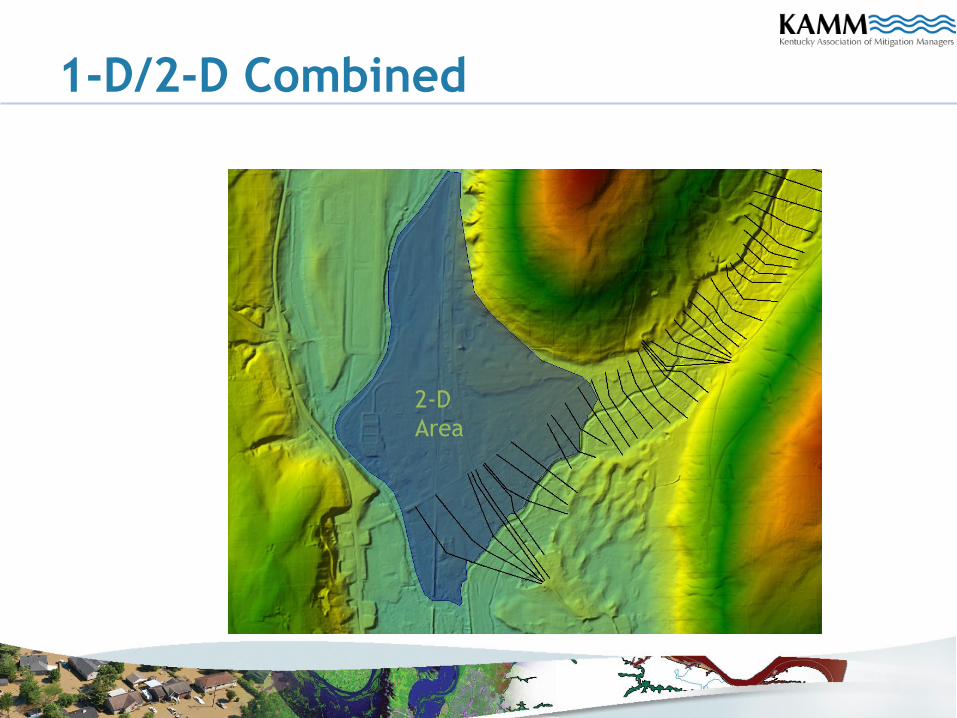
1-D vs 2-D
Majority of studies are steady-state flow, 1-D hydraulic
models
Increasing number of unsteady flow, 1-D and 2-D
hydraulic models being prepared
1-D 2-D
Confined flow Unconfined, split/diverted flows
Flow generally in one direction Flow moving in multiple directions
Wide and flat floodplains
Shallow flooding
High resolution topographic data
required
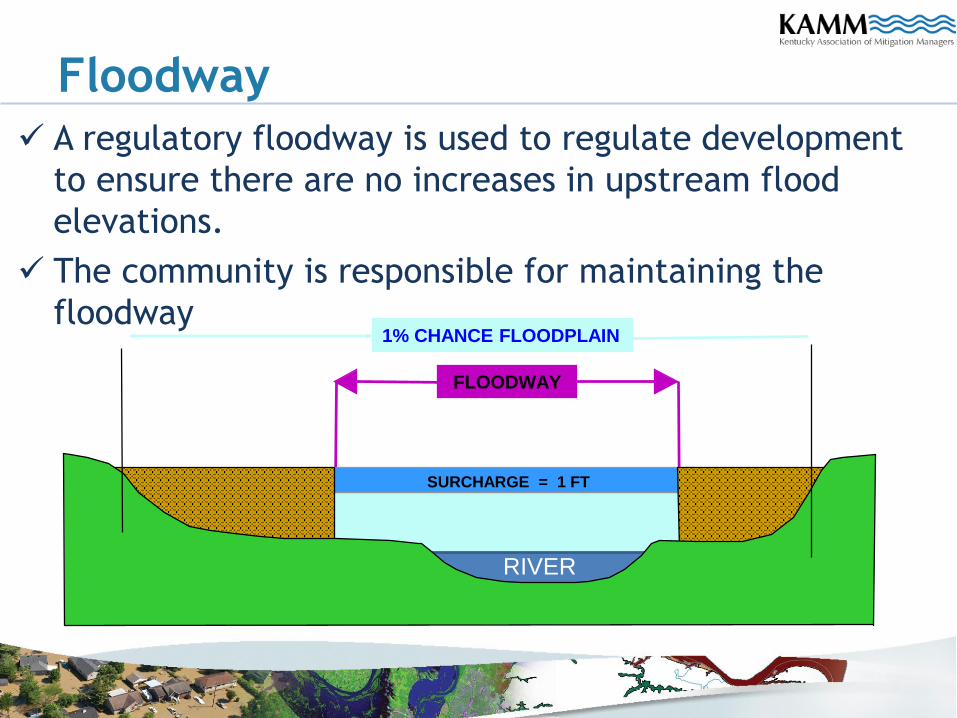
Floodway
A regulatory floodway is used to regulate development
to ensure there are no increases in upstream flood
elevations.
The community is responsible for maintaining the
floodway
RIVER
SURCHARGE = 1 FT
1% CHANCE FLOODPLAIN
FLOODWAY
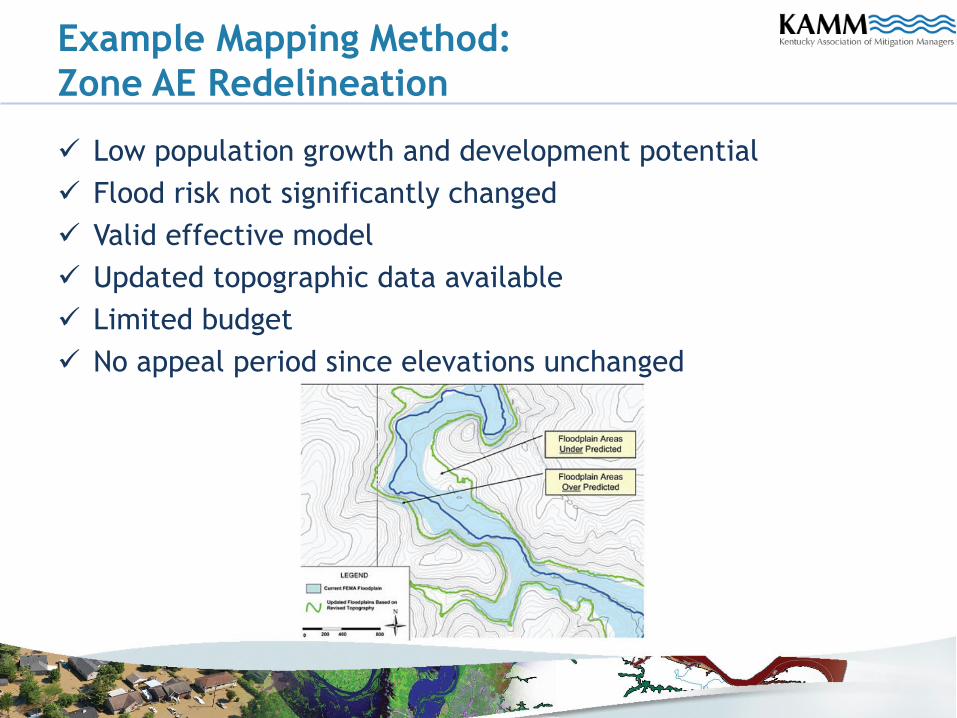
Example Mapping Method:
Zone AE Redelineation
Low population growth and development potential
Flood risk not significantly changed
Valid effective model
Updated topographic data available
Limited budget
No appeal period since elevations unchanged

Example Method of Analysis:
Zone A
Existing rural, low
population, sparsely
developed area
Minimal future population
growth and development
Lower risk area
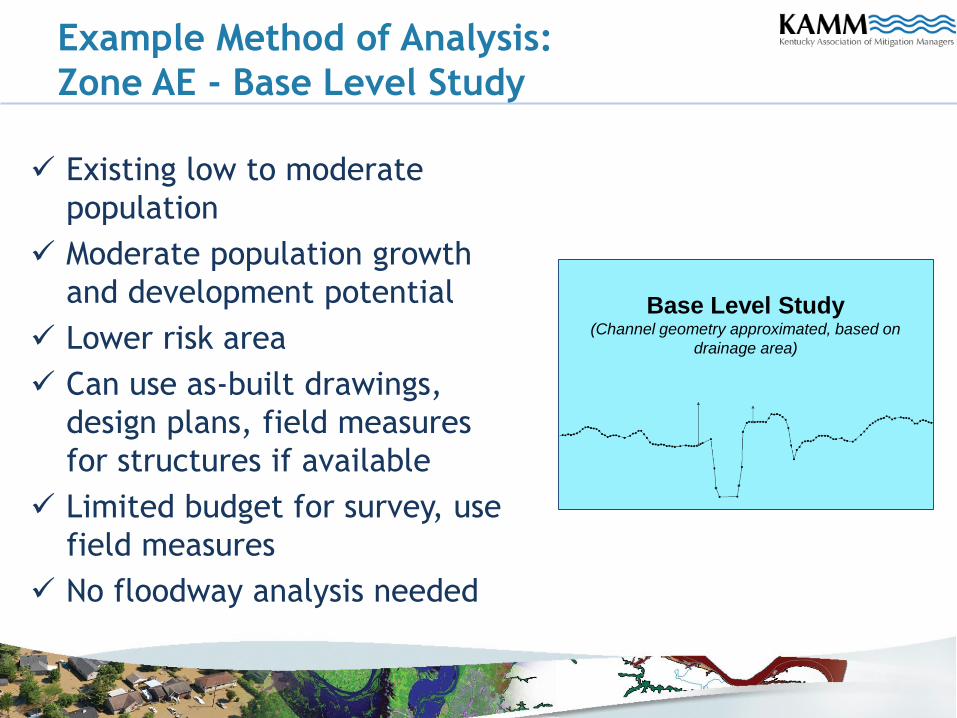
Example Method of Analysis:
Zone AE - Base Level Study
Existing low to moderate
population
Moderate population growth
and development potential
Lower risk area
Can use as-built drawings,
design plans, field measures
for structures if available
Limited budget for survey, use
field measures
No floodway analysis needed
Base Level Study(Channel geometry approximated, based on
drainage area)

Example Method of Analysis:
Zone AE – Enhanced Study
Dense population and
urban environment
Moderate to large
population growth and
development potential
Higher risk area
Budget for channel and
structure survey
Floodway analysis
needed
Enhanced Study(Channel geometry obtained by tradition survey
methods)

Example Method of Analysis:
Zone AE 2-D Analysis
Dense population and urban
environment
Moderate to large population
growth and development
potential
Higher risk area
Flat topography
Detailed risk data needed
Water surface elevation
computed for every grid cell
Delineation of maximum
water surface computed

2-D FEMA Guidance
Please review the Hydraulics: Two-Dimensional Analysis Guidance
Decision Process outlines whether a 2-D model is appropriate:
Standard Engineering Factors to consider
Cell size, computation time, model stability, calibration,
Factors which impact FEMA products
Population density, regulatory floodway, community expertise and
ease of reporting
Technical (qualitative or quantitative assessment)
Will a 2-D analysis (as oppose to 1-D analysis) result in more
accurate flood elevations on NFIP maps given the conditions on
the ground?
Programmatic (qualitative or quantitative assessment)
What are the benefits to the community and property owners
from a 2-D analysis
Sections on Maintenance and Floodway will be more detailed in future
cycles

Riverine Hydraulic Study Analysis
Steady State Zone AE Zone AE
(without floodway)
Zone A
Analysis
Zone A
Analysis
BLE
Unsteady State
(1-D)
Zone AE
1D Unsteady
Analysis
Combined 1D/2D
Unsteady Analysis
Unsteady State
(2-D)
Zone AE
2D Unsteady
Analysis
Zone A
Analysis 2D
BLE
Increasing Level of Detail
Hydraulic Method
More detailed is not always the best choice.


Risk MAP Portal Statewide floodplains in a single map
Displays the same floodplain as the FEMA
GeoPlatform Map
Phase I: Zone A BFE (80 counties)
1% annual chance BFE
determinations in the A Flood Zones
with a simple click on the stream
centerline
Hydrologic & Hydraulic reports and
models available for download
FIS and Shapefiles also available
Phase II and Beyond
Hydraulic models and BFE
determination available statewide
Depth grids and other RiskMAP
products
Dam safety information
http://watermaps.ky.gov/RiskPortal/

Questions?
Mike Greene
Project Manager
859-422-3079
Katherine Osborne
Project Engineer
859-422-3047
Related Documents