1 3DS.COM © Dassault Systèmes | Q1 2012 Earnings Presentation 3DS.COM © Dassault Systèmes | Q1 2012 Earnings Presentation Dassault Systèmes Presentation A Strategic Move Towards Natural Resources Thibault de Tersant, Senior EVP and CFO

Welcome message from author
This document is posted to help you gain knowledge. Please leave a comment to let me know what you think about it! Share it to your friends and learn new things together.
Transcript
1
3DS
.CO
M ©
Das
saul
t Sys
tèm
es
| Q1
2012
Ear
ning
s P
rese
ntat
ion
3D
S.C
OM
© D
assa
ult S
ystè
mes
| Q
1 20
12 E
arni
ngs
Pre
sent
atio
n
Dassault Systèmes Presentation
A Strategic Move Towards Natural Resources
Thibault de Tersant, Senior EVP and CFO

4
3DS
.CO
M ©
Das
saul
t Sys
tèm
es
| Q1
2012
Ear
ning
s P
rese
ntat
ion
Delivering 18% increase ex FX in new licenses revenue
Demonstrating established PLM business continues to strongly progress
Customers sharing enthusiasm for 3DExperience platform
Announcing new GEOVIA brand, Gemcom Software International acquisition and
Natural Resources as new target industry
Updating 2012 objectives for the full amount of Q1 over-performance and updating
currency assumptions
Q1 2012 Highlights

5
3DS
.CO
M ©
Das
saul
t Sys
tèm
es
| Q1
2012
Ear
ning
s P
rese
ntat
ion
1 Q1 2012 Business & Strategy Review
2 New GEOVIA brand & Gemcom Acquisition
3 Q2 & FY12 Financial Objectives
4 Financial Information Appendix
Agenda
6
3DS
.CO
M ©
Das
saul
t Sys
tèm
es
| Q1
2012
Ear
ning
s P
rese
ntat
ion
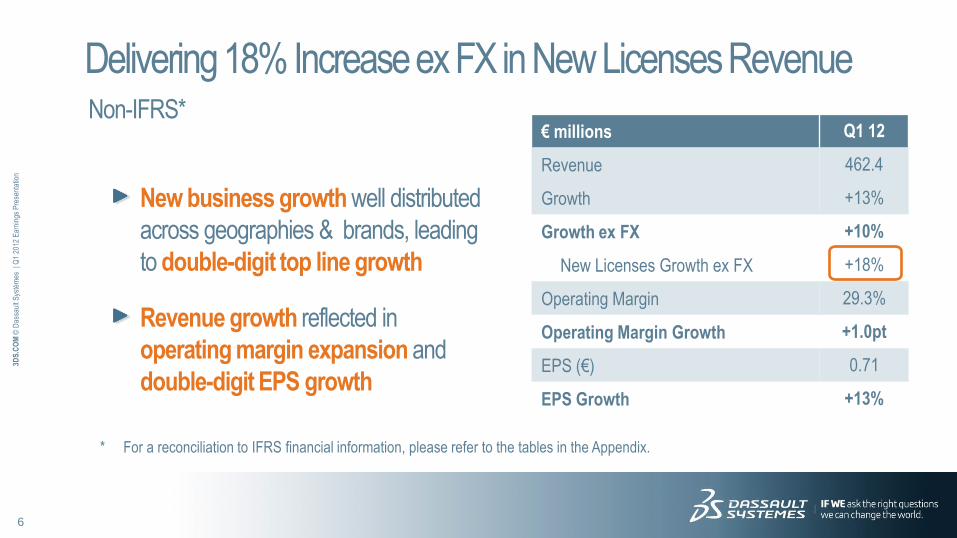
Delivering 18% Increase ex FX in New Licenses Revenue Non-IFRS*
* For a reconciliation to IFRS financial information, please refer to the tables in the Appendix.
New business growth well distributed
across geographies & brands, leading
to double-digit top line growth
Revenue growth reflected in
operating margin expansion and
double-digit EPS growth
€ millions Q1 12
Revenue 462.4
Growth +13%
Growth ex FX +10%
New Licenses Growth ex FX +18%
Operating Margin 29.3%
Operating Margin Growth +1.0pt
EPS (€) 0.71
EPS Growth +13%

7
3DS
.CO
M ©
Das
saul
t Sys
tèm
es
| Q1
2012
Ear
ning
s P
rese
ntat
ion
Q1 new business growth demonstrates relevance of DS diversified portfolio
Strong ENOVIA new business growth supported by V6 platform deployments
Good SolidWorks performance showing continued dynamic for DS market
Revenue by Product Line Non-IFRS*
Q1 12
PLM +9%
CATIA +6%
ENOVIA +17%
Other PLM SW +12%
SolidWorks +13%
Total Software +10%
Software Revenue Growth ex FX by Product Line
* For a reconciliation to IFRS financial information, please refer to the tables in the appendix

8
3DS
.CO
M ©
Das
saul
t Sys
tèm
es
| Q1
2012
Ear
ning
s P
rese
ntat
ion
Improved revenue growth in Americas
Continued good performance in Europe after 2 years of sustained investments
Asia driven by strong performance in China, good quarter in India & Korea and better dynamic in Japan
Revenue by Region Non-IFRS*
Q1 12
Americas +8%
Europe +8%
Asia +15%
Total Revenue +10%
Revenue Growth ex FX by Region
* For a reconciliation to IFRS financial information, please refer to the tables in the appendix
9
3DS
.CO
M ©
Das
saul
t Sys
tèm
es
| Q1
2012
Ear
ning
s P
rese
ntat
ion
Demonstrating Established PLM Business
Continues to Strongly Progress
Further Increasing V6 Footprint

10
3DS
.CO
M ©
Das
saul
t Sys
tèm
es
| Q1
2012
Ear
ning
s P
rese
ntat
ion
Beginning of a new product cycle with V6
V6 online platform adoption: more than 1,000 V6 large customers
Start of CATIA migration cycle: CATIA V6 R2012X released in December 2011
Q1 2012
ENOVIA non-IFRS software revenue growth: +17% ex FX
Total V6 new licenses revenue: ~15% of PLM new licenses revenue
Further Increasing V6 Footprint

11
3DS
.CO
M ©
Das
saul
t Sys
tèm
es
| Q1
2012
Ear
ning
s P
rese
ntat
ion
Context Leading automotive supplier of components, integrated systems and modules, in
particular for the reduction of CO2 emissions
2011 revenue: ~€11bn - 68,000 employees
Challenges Develop new complex products putting together electronics, software and
mechanical components
Foster worldwide collaboration across 185 sites
Targeted achievements Provide a fully integrated solution for mechatronics
Enable more than 12,000 worldwide users to access on-line a single product
data repository
Valeo Selecting ENOVIA V6

12
3DS
.CO
M ©
Das
saul
t Sys
tèm
es
| Q1
2012
Ear
ning
s P
rese
ntat
ion
Demonstrating Established PLM Business
Continues to Strongly Progress
Further Increasing V6 Footprint
Broadening Industry Coverage and Diversification
13
3DS
.CO
M ©
Das
saul
t Sys
tèm
es
| Q1
2012
Ear
ning
s P
rese
ntat
ion
Broad-based growth across 11 targeted industries in Q1 2012
Excellent performance in automotive
Continued strengthening of new industries especially in consumer goods and
consumer packaged goods
Broadening Industry Coverage and Diversification
* New industries: High Tech, Consumer Goods, Consumer Packaged Goods, Life Sciences, Energy, Construction, Business Services

14
3DS
.CO
M ©
Das
saul
t Sys
tèm
es
| Q1
2012
Ear
ning
s P
rese
ntat
ion
Context
Lenovo, leading high tech company
2011 revenue: $22bn - ~1,700 engineers in 46 labs
Challenges
Create high quality and reliable strong notebook while keeping cost and product development time down
Achievements
Selected SIMULIA to perform flexibility analysis, weight optimization, keystroke feel improvement
SIMULIA providing close correlation with physical testing
Expanding in High Tech with Lenovo
Keystroke feel:
Simulated the effects of keystroke
pressure on the central component
that provides each key with
resistance and spring back

15
3DS
.CO
M ©
Das
saul
t Sys
tèm
es
| Q1
2012
Ear
ning
s P
rese
ntat
ion
Demonstrating Established PLM Business
Continues to Strongly Progress
Further Increasing V6 Footprint
Broadening Industry Coverage and Diversification
Deepening Regional Market Diversification
16
3DS
.CO
M ©
Das
saul
t Sys
tèm
es
| Q1
2012
Ear
ning
s P
rese
ntat
ion
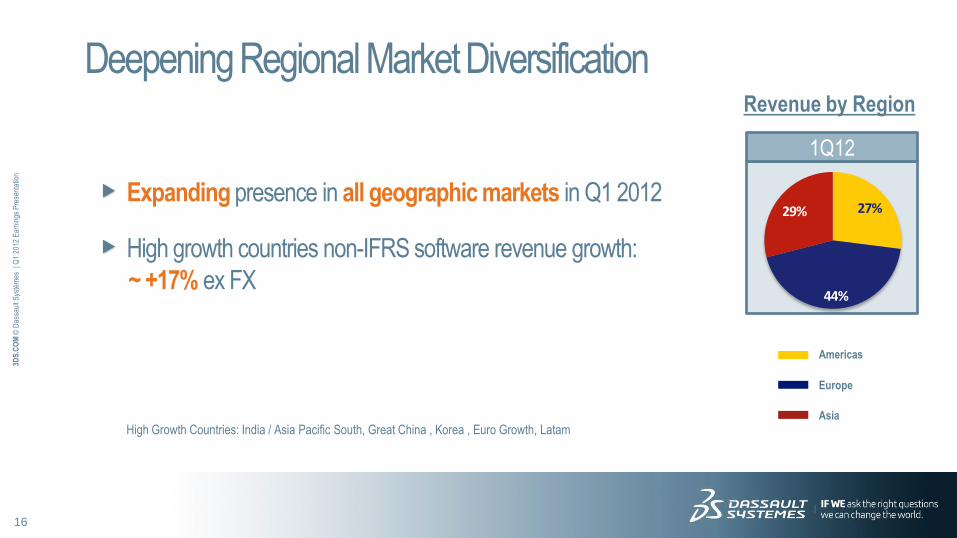
Expanding presence in all geographic markets in Q1 2012
High growth countries non-IFRS software revenue growth:
~ +17% ex FX
Deepening Regional Market Diversification
High Growth Countries: India / Asia Pacific South, Great China , Korea , Euro Growth, Latam
1Q12
27%
44%
29%
Americas
Europe
Asia
Revenue by Region

17
3DS
.CO
M ©
Das
saul
t Sys
tèm
es
| Q1
2012
Ear
ning
s P
rese
ntat
ion
Context Hisense Electric, leading High Tech company headquartered in China - Subsidiary of Hisense Group
Flat screen television leader in China
2010 Hisense Group revenue: ~$10bn - Employees: 60,000
Challenges Adapt to important television market changes, viewers turning to online video make television set more intelligent & interactive
Achievements Selected ENOVIA V6
Enhanced reuse and reduced development costs by 70%
Avoid unnecessary and costly purchases due to incorrect data
Diversifying in China with Hisense

18
3DS
.CO
M ©
Das
saul
t Sys
tèm
es
| Q1
2012
Ear
ning
s P
rese
ntat
ion
Demonstrating Established PLM Business
Continues to Strongly Progress
Further Increasing V6 Footprint
Broadening Industry Coverage and Diversification
Deepening Regional Market Diversification
Expanding User Universe
19
3DS
.CO
M ©
Das
saul
t Sys
tèm
es
| Q1
2012
Ear
ning
s P
rese
ntat
ion
Connecting the dots with 3DExperience, enlarging users to:
Engineering
Marketing
R&D
Sales
Executives
Expanding User Universe

20
3DS
.CO
M ©
Das
saul
t Sys
tèm
es
| Q1
2012
Ear
ning
s P
rese
ntat
ion
Context
PSA, leading automotive OEM
2011 revenue: €60bn - ~400,000 vehicles sold
Challenges
Introduce innovation while complying with production schedule
Achievements
Extending DELMIA to powertrain division
DELMIA supporting now: assembly simulation, painting, factory layout, stamping, powertrain
400 new users in 7 production sites from process engineers to shop floor workers
Expanding to Manufacturing with PSA

21
3DS
.CO
M ©
Das
saul
t Sys
tèm
es
| Q1
2012
Ear
ning
s P
rese
ntat
ion
Change in Net Financial Position IFRS
Note: Net financial position is defined as Cash and Cash Equivalents + Short Term Investments – Long-term debt
The Q4 2011 and Q1 2012 net financial position are also net of the €200 million financial debt which has been reclassified from long-term to short-term debt as of December 31, 2011
+73+38
+55
-14 -191,294
1,151
-23
+33
Net Financial Position Q4 2011
Net Income Non cash P&L items Change in working capital
Capital expenditure Acquisitions and other investing
DS stock option exercise
FX Impact Net Financial Position Q1 2012
Operating cash flow: +€166M, compared to +€134M in Q1 11
22
3DS
.CO
M ©
Das
saul
t Sys
tèm
es
| Q1
2012
Ear
ning
s P
rese
ntat
ion
1 Q1 2012 Business & Strategy Review
2 New GEOVIA brand & Gemcom Acquisition
3 Q2 & FY12 Financial Objectives
4 Financial Information Appendix
Agenda

23
3DS
.CO
M ©
Das
saul
t Sys
tèm
es
| Q1
2012
Ear
ning
s P
rese
ntat
ion
Dassault Systèmes’ Purpose

24
3DS
.CO
M ©
Das
saul
t Sys
tèm
es
| Q1
2012
Ear
ning
s P
rese
ntat
ion
A New Brand to Advance in Fulfilling our Purpose
Creation of the brand GEOVIA to model & simulate our Planet
Model and simulate Nature to improve predictability, efficiency,
safety and sustainability
25
3DS
.CO
M ©
Das
saul
t Sys
tèm
es
| Q1
2012
Ear
ning
s P
rese
ntat
ion
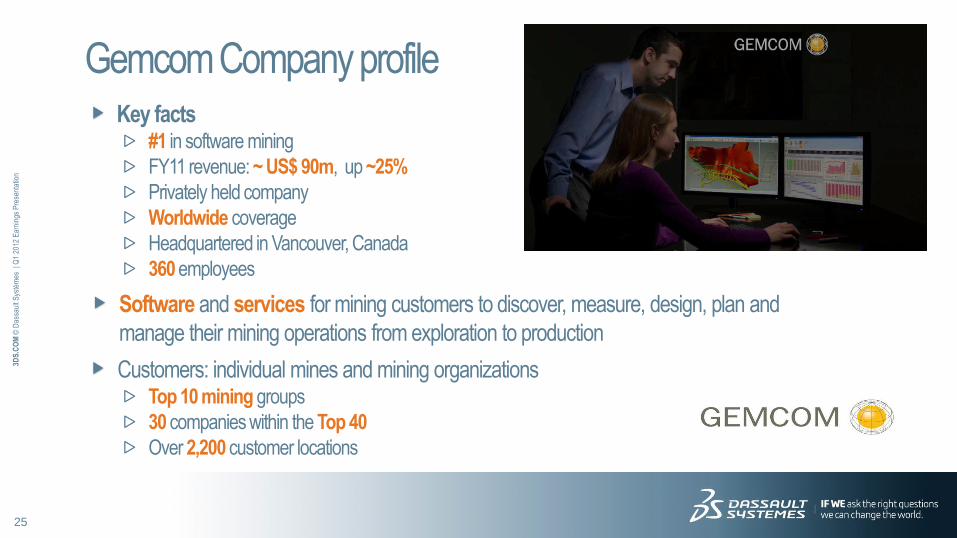
Key facts #1 in software mining
FY11 revenue: ~ US$ 90m, up ~25%
Privately held company
Worldwide coverage
Headquartered in Vancouver, Canada
360 employees
Software and services for mining customers to discover, measure, design, plan and
manage their mining operations from exploration to production
Customers: individual mines and mining organizations Top 10 mining groups
30 companies within the Top 40
Over 2,200 customer locations
Gemcom Company profile

26
3DS
.CO
M ©
Das
saul
t Sys
tèm
es
| Q1
2012
Ear
ning
s P
rese
ntat
ion
Transaction signed on April 25, 2012
Closing planned in July 2012
Price: approximately US$ 360 million in cash
Gemcom financials to be included in Q3 2012
Immediately accretive to non-IFRS earnings
Neutral to non-IFRS operating margin once
integrated
Gemcom Acquisition Extend DS Reach

27
3DS
.CO
M ©
Das
saul
t Sys
tèm
es
| Q1
2012
Ear
ning
s P
rese
ntat
ion
Mining: a Strategic and Fast Growing Sector
A very large and fast growing sector
Estimated annual mineral production market value > 1.8T$(1)
22% Revenues CAGR(2)
driven by coal & metals consumption
increase
Facing major challenges
Resources availability: Safety, Compliancy, Skills Shortage…
…driving today high demand for Software
(1): In 2010, internal research based on production volumes given by USGS and public material market prices (ex: LME
spot prices, Xerfi 2011 Commodity Reports…)
(2): Based on TOP 40 mining companies 03-10 revenue growth, source: PwC 2011

28
3DS
.CO
M ©
Das
saul
t Sys
tèm
es
| Q1
2012
Ear
ning
s P
rese
ntat
ion
Mining is a key vertical in the Natural Resources industry
Benefits DS & GEMCOM will bring to mining
Resources Availability : Geological Modelisation & Production Management for better exploration & productivity
Safety : Risk Assessment & Evaluation Solutions for better safety
Compliancy : Compliancy Solutions to shorten mining projects study phases & minimize mining impact on planet
Skills Shortage : Collaboration Platform to enable mining people to minimize travels
New Target Industry: Natural Resources
Mining
Water Oil&Gas
Others
Agriculture
Forestry
Landscape
…

29
3DS
.CO
M ©
Das
saul
t Sys
tèm
es
| Q1
2012
Ear
ning
s P
rese
ntat
ion
1 Q1 2012 Business & Strategy Review
2 New GEOVIA brand & Gemcom Acquisition
3 Q2 & FY12 Financial Objectives
4 Financial Information Appendix
Agenda

30
3DS
.CO
M ©
Das
saul
t Sys
tèm
es
| Q1
2012
Ear
ning
s P
rese
ntat
ion
Upgrading 2012 financial objectives for full Q1 revenue over-performance
Leaving unchanged revenue growth assumptions ex FX for the nine-month period Continued good trend in Q2
Cautious H2 stance given the volatility of the economic environment
Updating US$ rate assumptions for the 3 remaining quarters from US$1.40 per €1.00 to US$1.36 FY12 : US$1.35
NOT including Gemcom acquisition
Upgrading FY 2012 Financial Objectives

31
3DS
.CO
M ©
Das
saul
t Sys
tèm
es
| Q1
2012
Ear
ning
s P
rese
ntat
ion
Objectives change: from February to April Non-IFRS
Mid-range 1,870 1,920
Revenue (€m) EPS (€)
Mid-range 3.05 3.15
Ex fx Growth +5-7% +6-8% Growth +3-6% +6-10%
1,700
1,750
1,800
1,850
1,900
1,950
2,000
Initial Obj. FX impact Q1 Activity New Obj.
1,855 - 1,885
1,905 - 1,935
+35+15
2.00
2.25
2.50
2.75
3.00
3.25
3.50
Initial Obj. FX impact Q1 Activity Tax rate & Shares
New Obj.
3.00 - 3.10
3.10 - 3.20
+0.10
-0.05
+0.05
32
3DS
.CO
M ©
Das
saul
t Sys
tèm
es
| Q1
2012
Ear
ning
s P
rese
ntat
ion
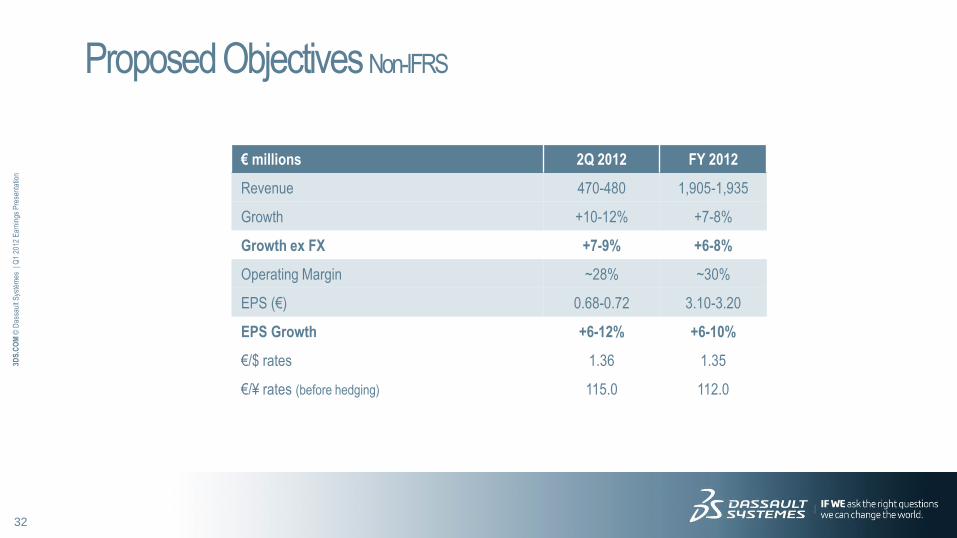
Proposed Objectives Non-IFRS
€ millions 2Q 2012 FY 2012
Revenue 470-480 1,905-1,935
Growth +10-12% +7-8%
Growth ex FX +7-9% +6-8%
Operating Margin ~28% ~30%
EPS (€) 0.68-0.72 3.10-3.20
EPS Growth +6-12% +6-10%
€/$ rates 1.36 1.35
€/¥ rates (before hedging) 115.0 112.0

56
3DS
.CO
M ©
Das
saul
t Sys
tèm
es
| Q1
2012
Ear
ning
s P
rese
ntat
ion
Related Documents


