Masaryk University Faculty of Informatics Dashboard Visualizations in Ext.js Bachelor’s Thesis Dávid Želník Brno, Spring 2021

Welcome message from author
This document is posted to help you gain knowledge. Please leave a comment to let me know what you think about it! Share it to your friends and learn new things together.
Transcript
Masaryk UniversityFaculty of Informatics
Dashboard Visualizations inExt.js
Bachelor’s Thesis
Dávid Želník
Brno, Spring 2021

Masaryk UniversityFaculty of Informatics
Dashboard Visualizations inExt.js
Bachelor’s Thesis
Dávid Želník
Brno, Spring 2021


This is where a copy of the official signed thesis assignment and a copy of theStatement of an Author is located in the printed version of the document.


Declaration
Hereby I declare that this paper is my original authorial work, whichI have worked out on my own. All sources, references, and literatureused or excerpted during elaboration of this work are properly citedand listed in complete reference to the due source.
Dávid Želník
Advisor: RNDr. Vít Rusňák, Ph.D.
i

Acknowledgements
Many thanks belong to my supervisor RNDr. Vít Rusňák, Ph.D., forsupervising this bachelor thesis. I want to thank him for his profes-sional yet still friendly approach and for providing me with helpfuladvice and guidance during the process of writing this thesis.
iii
Abstract
The goal of this bachelor thesis is to create dashboard visualizationsusing the community version of the Ext.js JavaScript framework. Thework has been done as a part of the National Cybersecurity Compe-tence Center project (NC3). In the thesis, we introduce dashboards,their visualization tools and focus on cybersecurity dashboards. Fur-thermore, we introduce ExtJS and other technologies used in the thesisand discuss their limitations and integration.
The result of this thesis is an implementation of geovisualizationsand complex 2D visualizations into dashboards using the Leaflet.jsframework and Treemap-squarify plugin. We explain the creation,usage and restrictions of these visualizations. And we discuss theoverall compatibility of Leaflet.js and Ext.js and possible upgrades tothe designed visualizations.
iv

Keywords
dashboard, ExtJS, Leaflet, choropleth, heatmap, restrictions, geovisu-alization, treemap, CSIRT-MU, JavaScript
v

Contents
1 Introduction 1
2 Dashboards 32.1 What is a Dashboard? . . . . . . . . . . . . . . . . . . . . 32.2 History of Dashboards . . . . . . . . . . . . . . . . . . . 52.3 Dashboard Design Guidelines . . . . . . . . . . . . . . . 52.4 Dashboard Types . . . . . . . . . . . . . . . . . . . . . . 6
2.4.1 Strategic Dashboards . . . . . . . . . . . . . . . . 72.4.2 Operational Dashboards . . . . . . . . . . . . . . 72.4.3 Analytical Dashboards . . . . . . . . . . . . . . . 82.4.4 Tactical Dashboards . . . . . . . . . . . . . . . . 9
2.5 Dashboard Data Visualizations . . . . . . . . . . . . . . 102.5.1 Tables . . . . . . . . . . . . . . . . . . . . . . . . 112.5.2 Charts . . . . . . . . . . . . . . . . . . . . . . . . 122.5.3 Maps . . . . . . . . . . . . . . . . . . . . . . . . . 13
2.6 Cybersecurity Dashboards . . . . . . . . . . . . . . . . . 152.6.1 Information Security KPIs . . . . . . . . . . . . . 16
3 Used Technologies 213.1 ExtJS . . . . . . . . . . . . . . . . . . . . . . . . . . . . . 21
3.1.1 What is ExtJS? . . . . . . . . . . . . . . . . . . . . 213.1.2 Beginnings of ExtJS . . . . . . . . . . . . . . . . . 213.1.3 Sencha . . . . . . . . . . . . . . . . . . . . . . . . 223.1.4 ExtJS Features . . . . . . . . . . . . . . . . . . . . 233.1.5 Application Architecture . . . . . . . . . . . . . 25
3.2 Leaflet.js . . . . . . . . . . . . . . . . . . . . . . . . . . . 283.2.1 Why Leaflet.js? . . . . . . . . . . . . . . . . . . . 283.2.2 History of Leaflet.js . . . . . . . . . . . . . . . . . 283.2.3 Usage . . . . . . . . . . . . . . . . . . . . . . . . . 283.2.4 Leaflet Features . . . . . . . . . . . . . . . . . . . 29
3.3 Leaflet.js Plugins . . . . . . . . . . . . . . . . . . . . . . 293.3.1 Leaflet Heatmap . . . . . . . . . . . . . . . . . . 303.3.2 Leaflet Minichart . . . . . . . . . . . . . . . . . . 313.3.3 Leaflet GeoJSON . . . . . . . . . . . . . . . . . . 31
3.4 Treemap-squarify.js . . . . . . . . . . . . . . . . . . . . . 33
vii
3.4.1 Shortcoming of Treemp-squarify.js . . . . . . . . 33
4 Implementation 354.1 Cyber Copter Chart Developer . . . . . . . . . . . . . . 354.2 PanelTreeMap . . . . . . . . . . . . . . . . . . . . . . . . 36
4.2.1 Creation . . . . . . . . . . . . . . . . . . . . . . . 374.2.2 Functionality . . . . . . . . . . . . . . . . . . . . 374.2.3 Usage . . . . . . . . . . . . . . . . . . . . . . . . . 384.2.4 Absolute Layout Drawback . . . . . . . . . . . . 38
4.3 LeafletBase . . . . . . . . . . . . . . . . . . . . . . . . . . 404.4 LeafletHeat . . . . . . . . . . . . . . . . . . . . . . . . . . 40
4.4.1 Creation . . . . . . . . . . . . . . . . . . . . . . . 414.4.2 Functionality . . . . . . . . . . . . . . . . . . . . 424.4.3 Usage . . . . . . . . . . . . . . . . . . . . . . . . . 424.4.4 HeatMapOverlay Drawback . . . . . . . . . . . . 43
4.5 LeafletMinichart . . . . . . . . . . . . . . . . . . . . . . . 434.5.1 Creation . . . . . . . . . . . . . . . . . . . . . . . 434.5.2 Functionality . . . . . . . . . . . . . . . . . . . . 444.5.3 L.Minichart Drawback . . . . . . . . . . . . . . . 454.5.4 Usage . . . . . . . . . . . . . . . . . . . . . . . . . 45
4.6 LeafletChoropleth . . . . . . . . . . . . . . . . . . . . . . 454.6.1 Creation . . . . . . . . . . . . . . . . . . . . . . . 464.6.2 Functionality . . . . . . . . . . . . . . . . . . . . 464.6.3 GeoJSON Drawback . . . . . . . . . . . . . . . . 47
4.7 GeoDataCreator . . . . . . . . . . . . . . . . . . . . . . . 474.7.1 Creation . . . . . . . . . . . . . . . . . . . . . . . 484.7.2 Functionality . . . . . . . . . . . . . . . . . . . . 48
4.8 MapSettings . . . . . . . . . . . . . . . . . . . . . . . . . 484.8.1 Creation . . . . . . . . . . . . . . . . . . . . . . . 49
5 Leaflet and ExtJS Compatibility 53
6 Conclusion 556.1 Future Work . . . . . . . . . . . . . . . . . . . . . . . . . 55
Bibliography 57
A Electronic Attachments 61
viii

List of Tables
ix

List of Figures
2.1 Example of a car dashboard [2]. 42.2 Example of a data dashboard [4]. 42.3 CMO strategic dashboard [8]. 82.4 Customer Service Team Dashboard [9]. 92.5 Financial Performance Dashboard [10]. 102.6 IT Project Management Dashboard [11]. 112.7 Comparison of dashboard types suggesting which type to
choose in different situations [12]. 112.8 Example of a data table capable of sorting by multiple
variables. [13]. 122.9 Examples of charts [14]. 132.10 Line chart and scatterplot visualization in ExtJS [15]. 142.11 Visualization of hierarchical data using a D3 treeamp in
ExtJS [16]. 142.12 A choropleth map visualization of the amount of covid-19 cases
in the Czech Republic on May 8, 2021. [17]. 152.13 Example of a security dashboard. Source:
Solarwinds [22]. 193.1 Integration of D3.js heatmap into ExtJS in the ExtJS
7.0.0 [16]. 243.2 Representation of the MVC architecture [28]. 263.3 Representation of the MVVM architecture [28]. 273.4 Representation of the MVVM architecture including the
ViewController [28]. 273.5 Example of Leaflet features. 303.6 All types of minicharts. 323.7 Input and output data of the Treemap-squarify algorithm. 344.1 First level of the PanelTreeMap dashboard. 384.2 The second and the third level of the PanelTreeMap
dashboard. 394.3 LeafletHeat vizualization. 414.4 LeafletMinichart visualization. 444.5 LeafletChoropleth component. 464.6 GeoDataCreator component. 49
xi
4.7 MapSettings component. 50
xii
1 Introduction
Dashboards encapsulate various visualization components, from barcharts and line charts to more elaborate visualizations. They are usedin a multitude of application areas. Dashboards often utilize geovisu-alizations to display geographical data and complex 2D componentscapable of displaying hierarchical data, like a treemap.
As part of aNational Cybersecurity Competence Center project, wefocused on designing and implementing visualization components forcybersecurity dashboards. Based on the cooperationwith the companyAxenta, use cases were defined, based on which several visualizationswere created. These use cases also included categories for advancedvisualizations, such as complex 2D visualizations, like a treemap, andgeovisualizations.
In this thesis, we deal with the topic of creating components foroverview display screens, known as dashboards. We develop compo-nents that project geographical data into the dashboards and moreadvanced 2D components, displaying hierarchical or more complexdata, like a treemap. We implement them using a JavaScript frame-work called ExtJS. We are restricted to using the available communityversion of ExtJS, which offers various useful features and charts butdoes not offer the ability to display geographical data or more complexdata visualizations, unlike the commercial versions.
This thesis aims to design new open-source ExtJS componentsusing additional technologies implemented into existing ExtJS com-ponents and discuss their usage, restrictions and integration.
The theoretical part of the thesis introduces what dashboards are,their meaning and areas of application. We look closely at ExtJS andother frameworks and plugins utilized in the implementation. Wemention their benefits, restrictions and discuss their compatibilitywith each other.
In the practical part of this thesis, we explain the creation of thecomponents. We mention features used in the visualizations. We gothrough the development of each custom component and demonstrateits possible use.
1

1. IntroductionThe final chapter, summarizes the results of this thesis and reviews
the benefits, limitations, usage and potential upgrades of the createdvisualizations.
2
2 Dashboards
In this chapter, we introduce information data dashboards. We de-fine what a data dashboard is and go through the history and originof dashboard development. Further, we present fundamental designguidelines for the information dashboards and categorize them ac-cording to their role. Next, we define which visual mechanisms areused in dashboards. Lastly, we take a deeper look into the cybersecu-rity dashboards. We discuss their purpose; we mention what kind ofmeasurements they usually display. Finally, we overview the commondashboard visualizations including tables, 2D charts (e.g., pie and barcharts), treemaps and geovisualizations.
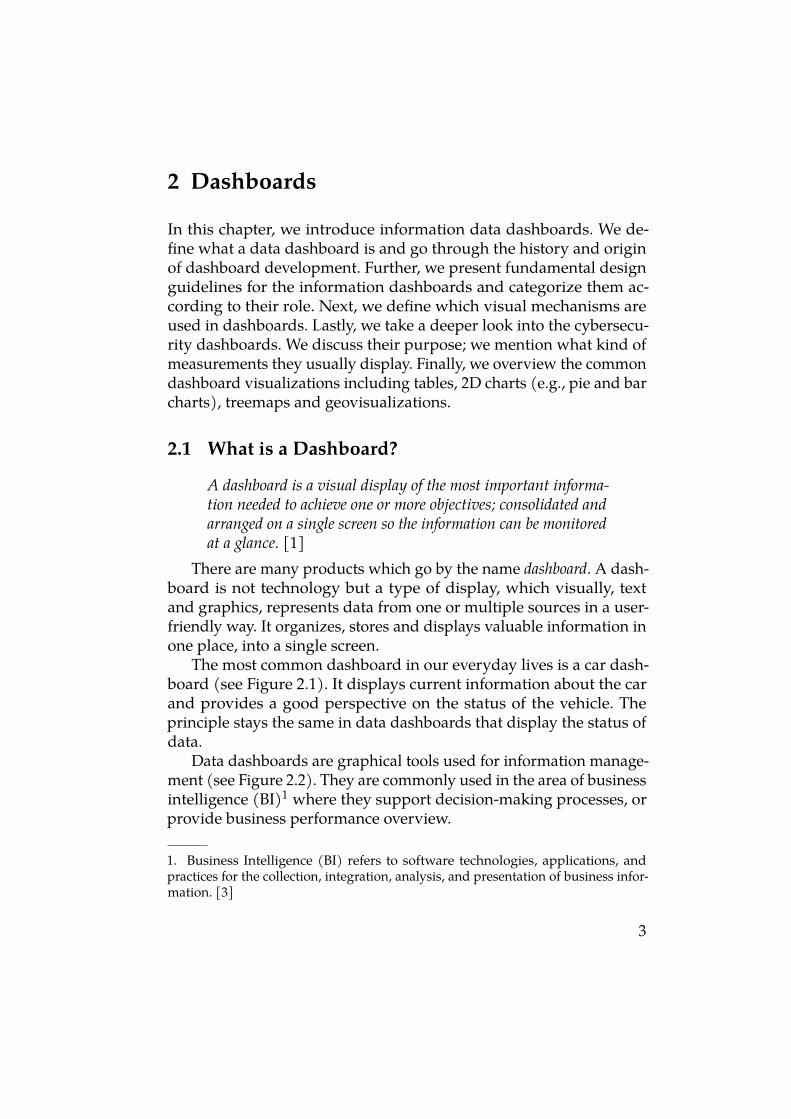
2.1 What is a Dashboard?
A dashboard is a visual display of the most important informa-tion needed to achieve one or more objectives; consolidated andarranged on a single screen so the information can be monitoredat a glance. [1]
There are many products which go by the name dashboard. A dash-board is not technology but a type of display, which visually, textand graphics, represents data from one or multiple sources in a user-friendly way. It organizes, stores and displays valuable information inone place, into a single screen.
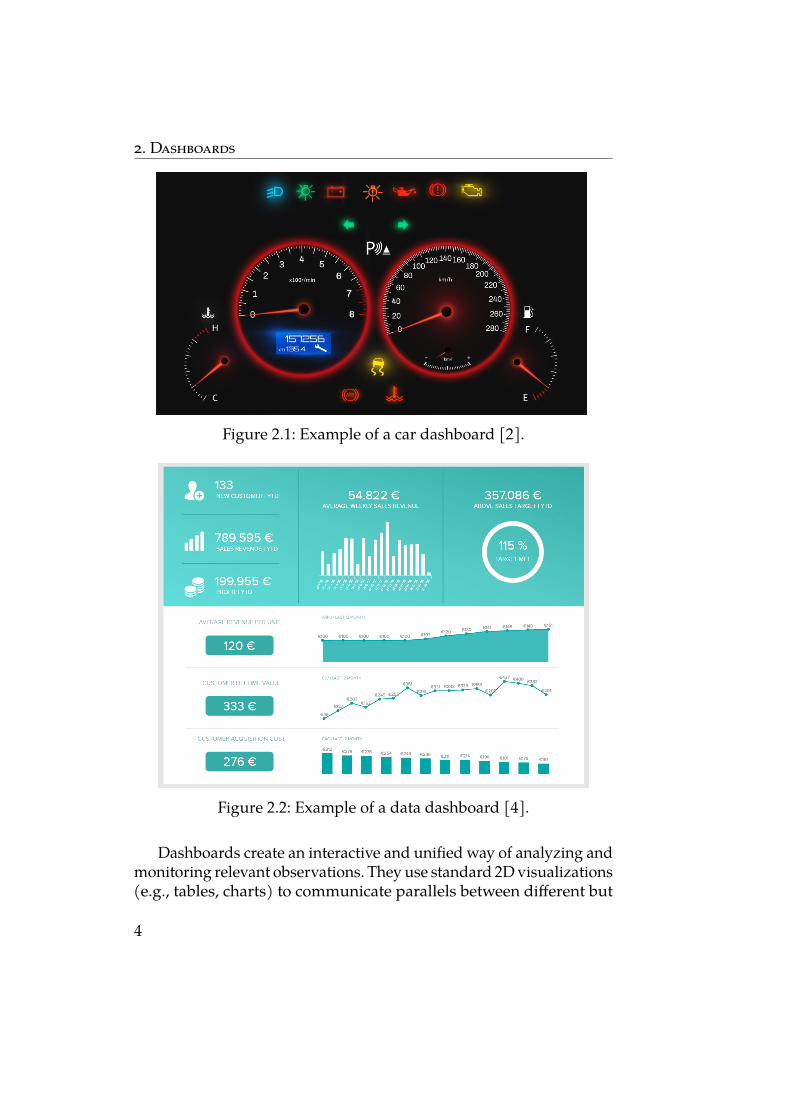
The most common dashboard in our everyday lives is a car dash-board (see Figure 2.1). It displays current information about the carand provides a good perspective on the status of the vehicle. Theprinciple stays the same in data dashboards that display the status ofdata.
Data dashboards are graphical tools used for information manage-ment (see Figure 2.2). They are commonly used in the area of businessintelligence (BI)1 where they support decision-making processes, orprovide business performance overview.
1. Business Intelligence (BI) refers to software technologies, applications, andpractices for the collection, integration, analysis, and presentation of business infor-mation. [3]
3
2. Dashboards
Figure 2.1: Example of a car dashboard [2].
Figure 2.2: Example of a data dashboard [4].
Dashboards create an interactive and unified way of analyzing andmonitoring relevant observations. They use standard 2Dvisualizations(e.g., tables, charts) to communicate parallels between different but
4
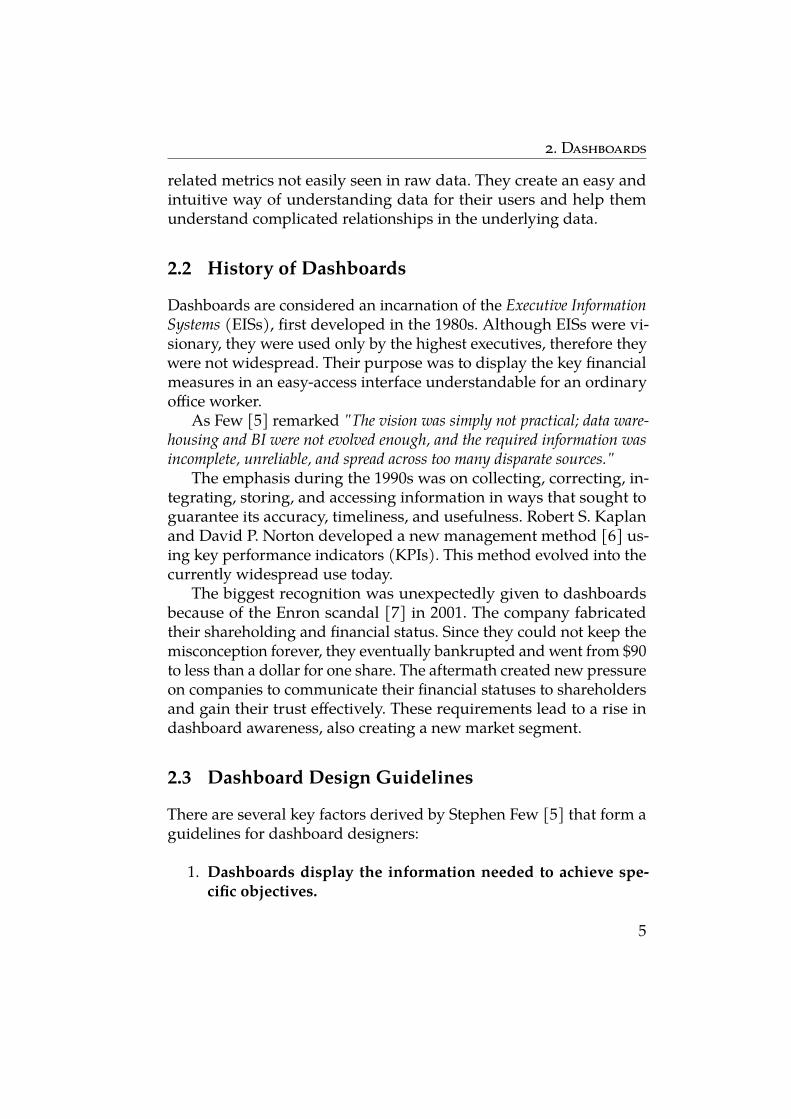
2. Dashboardsrelated metrics not easily seen in raw data. They create an easy andintuitive way of understanding data for their users and help themunderstand complicated relationships in the underlying data.
2.2 History of Dashboards
Dashboards are considered an incarnation of the Executive InformationSystems (EISs), first developed in the 1980s. Although EISs were vi-sionary, they were used only by the highest executives, therefore theywere not widespread. Their purpose was to display the key financialmeasures in an easy-access interface understandable for an ordinaryoffice worker.
As Few [5] remarked "The vision was simply not practical; data ware-housing and BI were not evolved enough, and the required information wasincomplete, unreliable, and spread across too many disparate sources."
The emphasis during the 1990s was on collecting, correcting, in-tegrating, storing, and accessing information in ways that sought toguarantee its accuracy, timeliness, and usefulness. Robert S. Kaplanand David P. Norton developed a new management method [6] us-ing key performance indicators (KPIs). This method evolved into thecurrently widespread use today.
The biggest recognition was unexpectedly given to dashboardsbecause of the Enron scandal [7] in 2001. The company fabricatedtheir shareholding and financial status. Since they could not keep themisconception forever, they eventually bankrupted and went from $90to less than a dollar for one share. The aftermath created new pressureon companies to communicate their financial statuses to shareholdersand gain their trust effectively. These requirements lead to a rise indashboard awareness, also creating a new market segment.
2.3 Dashboard Design Guidelines
There are several key factors derived by Stephen Few [5] that form aguidelines for dashboard designers:
1. Dashboards display the information needed to achieve spe-cific objectives.
5
2. DashboardsAchieving these objectives usually requires various informationfrom multiple sources, which do not have to be related to eachother precisely.
2. A dashboard fits on a single computer screen.The informationmust fit into a single display screen. It should beseen all at once, and the user should not have to move betweenmultiple screens as it creates confusion.
3. The information must be displayed in an accessible and suit-able medium.Most commonly used is a web browser, but it is not the only ac-ceptable medium. Depending on many factors, such as the needto constantly refresh data, we need to choose suitable displaymediums accordingly.
4. Dashboards are used to monitor information at a glance.The information must be quick to absorb, swiftly understoodand correctly displayed.We do not need to show every detail, butwe should make it accessible in case we need them. Dashboardsshould point out things that need the user’s attention or are outof the ordinary.
5. Dashboards have small, concise, clear, and intuitive displaymechanisms.We create display mechanisms that clearly state their purposeand do not take much space.
6. Dashboards are customized.Every company has different requirements, various types ofinformation and needs to display them in a specific way.
2.4 Dashboard Types
We can categorize dashboards in several different ways. We can dis-tinguish them depending on the type of data they use, applicationdomain, update frequency, and others.
The most commonly used is categorization by their role. From thispoint of view, there are four dashboard types:
6
2. Dashboards2.4.1 Strategic Dashboards
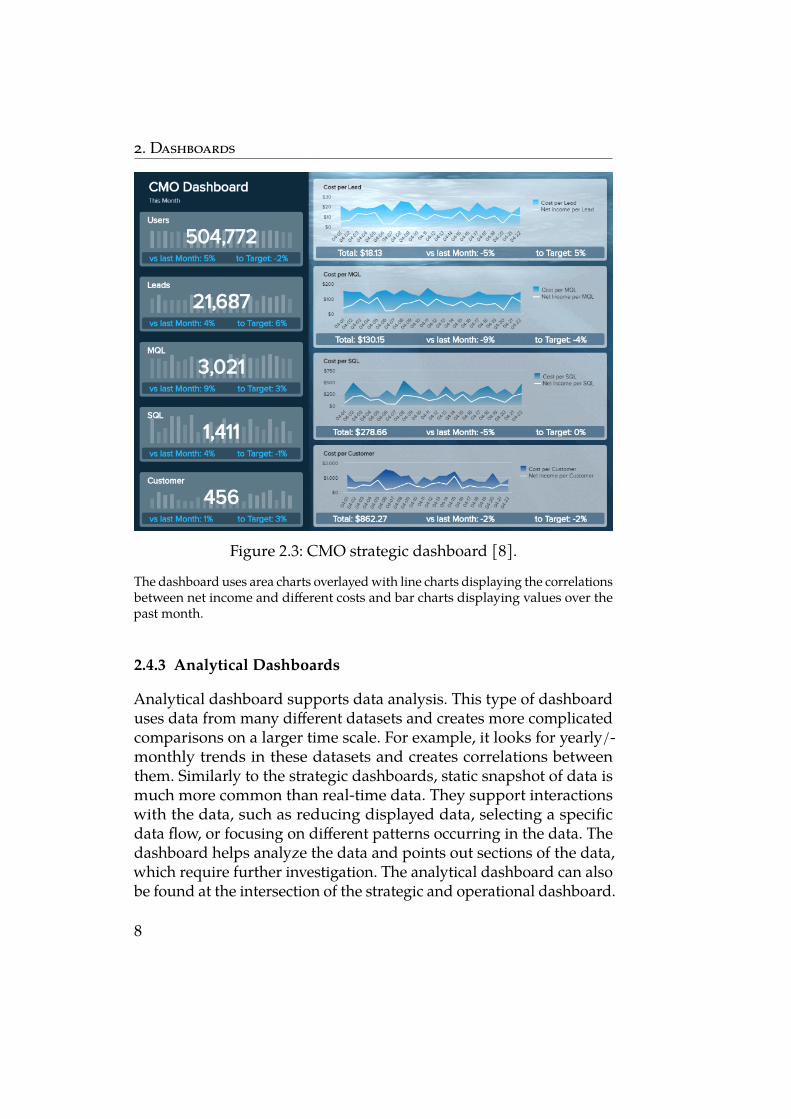
Also known as "executive" dashboards, provide high-level perfor-mance overview, predictions and support the long-term strategicdecision-making process. They use elementary display mechanisms,which are used only for displaying correlation in data and not inter-acting with them. They show possible outcomes as well as long-termcompany strategies. Therefore they use static data and tend to sum-marize performance over set time frames: past month, quarter, or year.Their primary usage is found in senior-level management.
An example of this type of dashboard is a CMO strategic dashboard(see Figure 2.3). Chief Marketing Officers (CMOs) need to have acloser look at a more strategic level of their marketing efforts. Theyare not interested in many detailed data, but they want to have a moregeneral look at the trends which occurred in the data.
2.4.2 Operational Dashboards
This type of dashboards, unlike the previous two, workswith real-timedata. They manage operations that have a shorter time horizon, fewdays or hours. Since these dashboards work with constantly chang-ing events, they require the option to clearly, correctly and instantlyrespond to any change. For that reason, they use simple display mech-anisms similar to the ones mentioned in the strategic dashboards.Unlike in the strategic dashboards, the tools used here are meant toimmediately alert the user about an "error" or unacceptable data. Forexample, if they are not within a set threshold. Even though they usesimple tools, they displaymore detailed insights. They offer interactivedesign giving the user a way to drill down and display more specificdata while still using simplistic tools.
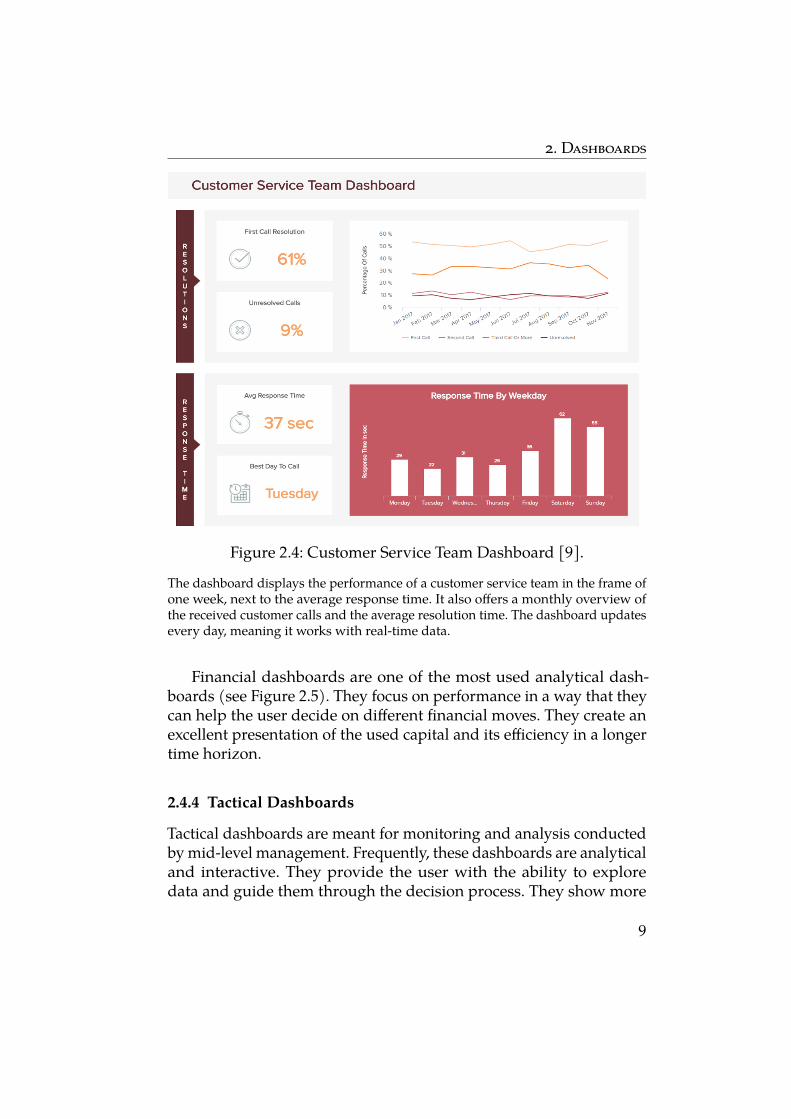
A customer service dashboard creates a good example of an op-erational dashboard (see Figure 2.4). Since things can change fromminute to minute, having all the essential KPIs on a single screenprovides the user with a natural and easily manageable way to keeptrack of all the changes.
7
2. Dashboards
Figure 2.3: CMO strategic dashboard [8].The dashboard uses area charts overlayedwith line charts displaying the correlationsbetween net income and different costs and bar charts displaying values over thepast month.
2.4.3 Analytical Dashboards
Analytical dashboard supports data analysis. This type of dashboarduses data from many different datasets and creates more complicatedcomparisons on a larger time scale. For example, it looks for yearly/-monthly trends in these datasets and creates correlations betweenthem. Similarly to the strategic dashboards, static snapshot of data ismuch more common than real-time data. They support interactionswith the data, such as reducing displayed data, selecting a specificdata flow, or focusing on different patterns occurring in the data. Thedashboard helps analyze the data and points out sections of the data,which require further investigation. The analytical dashboard can alsobe found at the intersection of the strategic and operational dashboard.
8
2. Dashboards
Figure 2.4: Customer Service Team Dashboard [9].The dashboard displays the performance of a customer service team in the frame ofone week, next to the average response time. It also offers a monthly overview ofthe received customer calls and the average resolution time. The dashboard updatesevery day, meaning it works with real-time data.
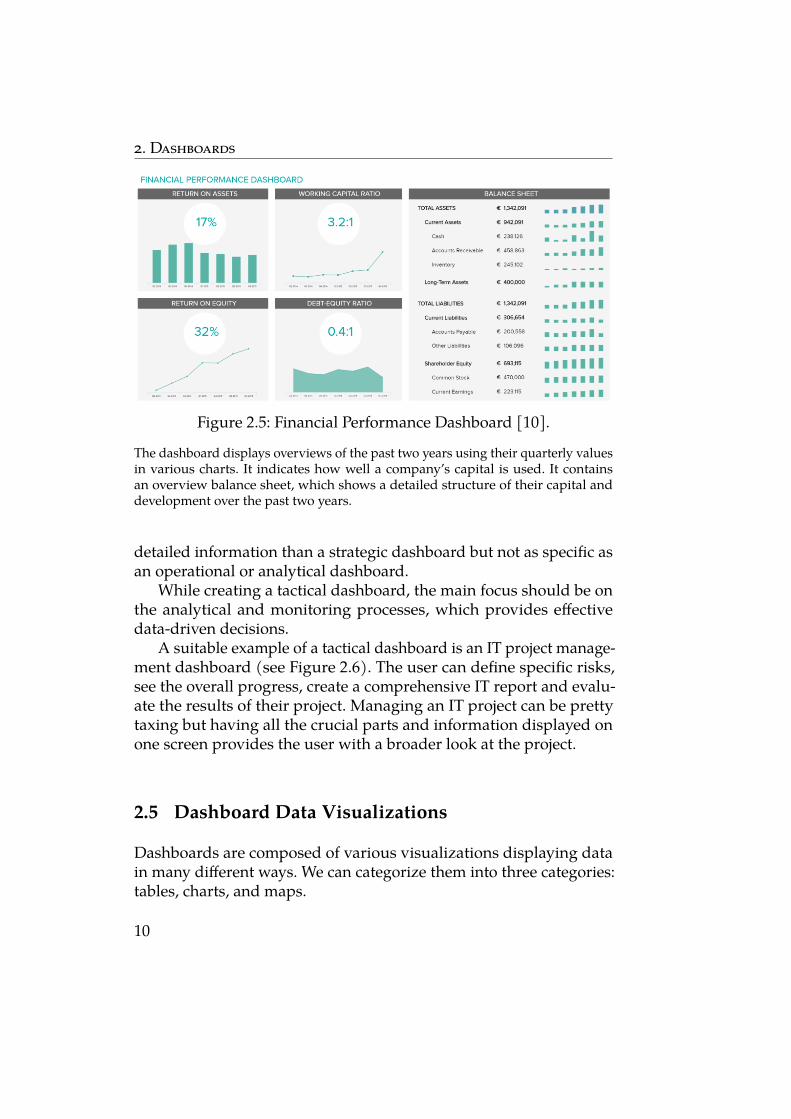
Financial dashboards are one of the most used analytical dash-boards (see Figure 2.5). They focus on performance in a way that theycan help the user decide on different financial moves. They create anexcellent presentation of the used capital and its efficiency in a longertime horizon.
2.4.4 Tactical Dashboards
Tactical dashboards are meant for monitoring and analysis conductedbymid-level management. Frequently, these dashboards are analyticaland interactive. They provide the user with the ability to exploredata and guide them through the decision process. They show more
9
2. Dashboards
Figure 2.5: Financial Performance Dashboard [10].The dashboard displays overviews of the past two years using their quarterly valuesin various charts. It indicates how well a company’s capital is used. It containsan overview balance sheet, which shows a detailed structure of their capital anddevelopment over the past two years.
detailed information than a strategic dashboard but not as specific asan operational or analytical dashboard.
While creating a tactical dashboard, the main focus should be onthe analytical and monitoring processes, which provides effectivedata-driven decisions.
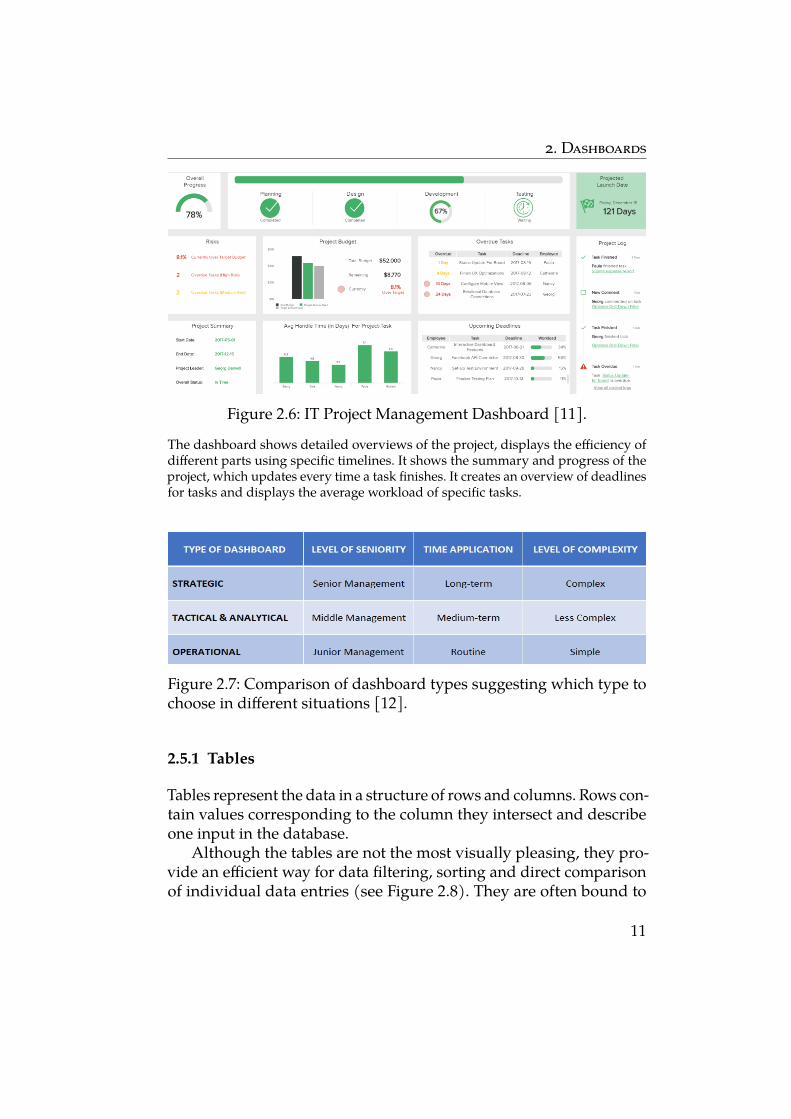
A suitable example of a tactical dashboard is an IT project manage-ment dashboard (see Figure 2.6). The user can define specific risks,see the overall progress, create a comprehensive IT report and evalu-ate the results of their project. Managing an IT project can be prettytaxing but having all the crucial parts and information displayed onone screen provides the user with a broader look at the project.
2.5 Dashboard Data Visualizations
Dashboards are composed of various visualizations displaying datain many different ways. We can categorize them into three categories:tables, charts, and maps.
10
2. Dashboards
Figure 2.6: IT Project Management Dashboard [11].The dashboard shows detailed overviews of the project, displays the efficiency ofdifferent parts using specific timelines. It shows the summary and progress of theproject, which updates every time a task finishes. It creates an overview of deadlinesfor tasks and displays the average workload of specific tasks.
Figure 2.7: Comparison of dashboard types suggesting which type tochoose in different situations [12].
2.5.1 Tables
Tables represent the data in a structure of rows and columns. Rows con-tain values corresponding to the column they intersect and describeone input in the database.
Although the tables are not the most visually pleasing, they pro-vide an efficient way for data filtering, sorting and direct comparisonof individual data entries (see Figure 2.8). They are often bound to
11
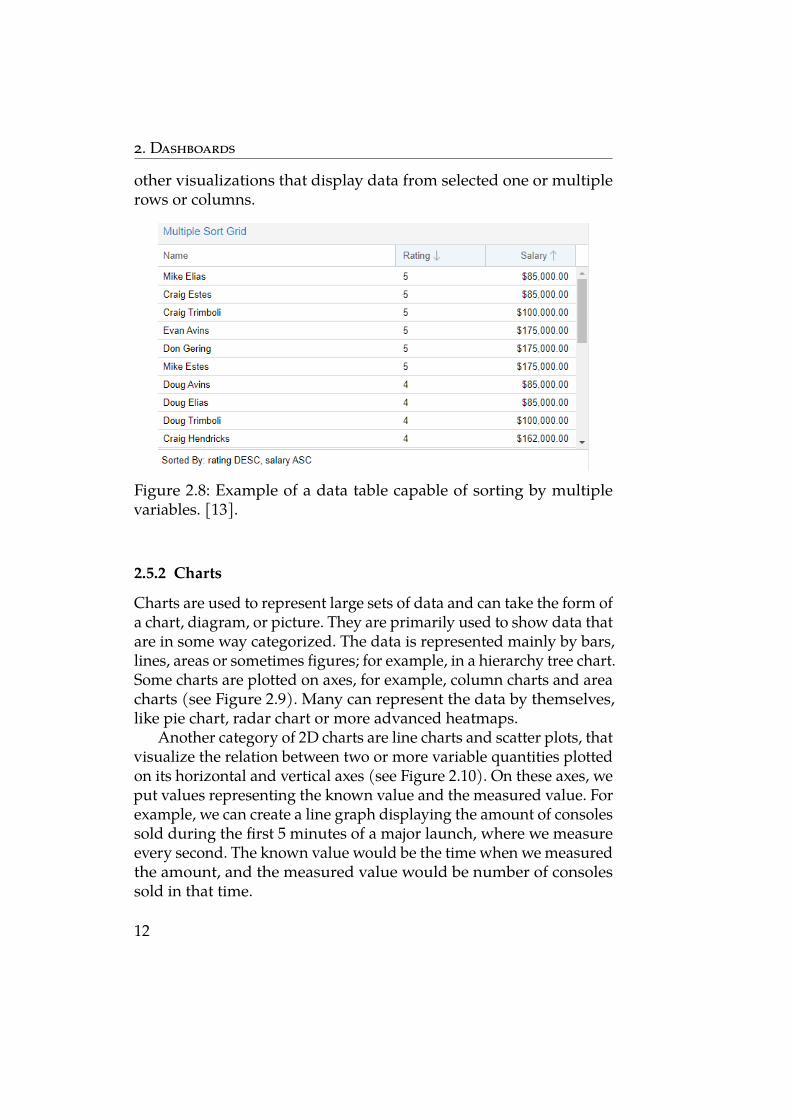
2. Dashboardsother visualizations that display data from selected one or multiplerows or columns.
Figure 2.8: Example of a data table capable of sorting by multiplevariables. [13].
2.5.2 Charts
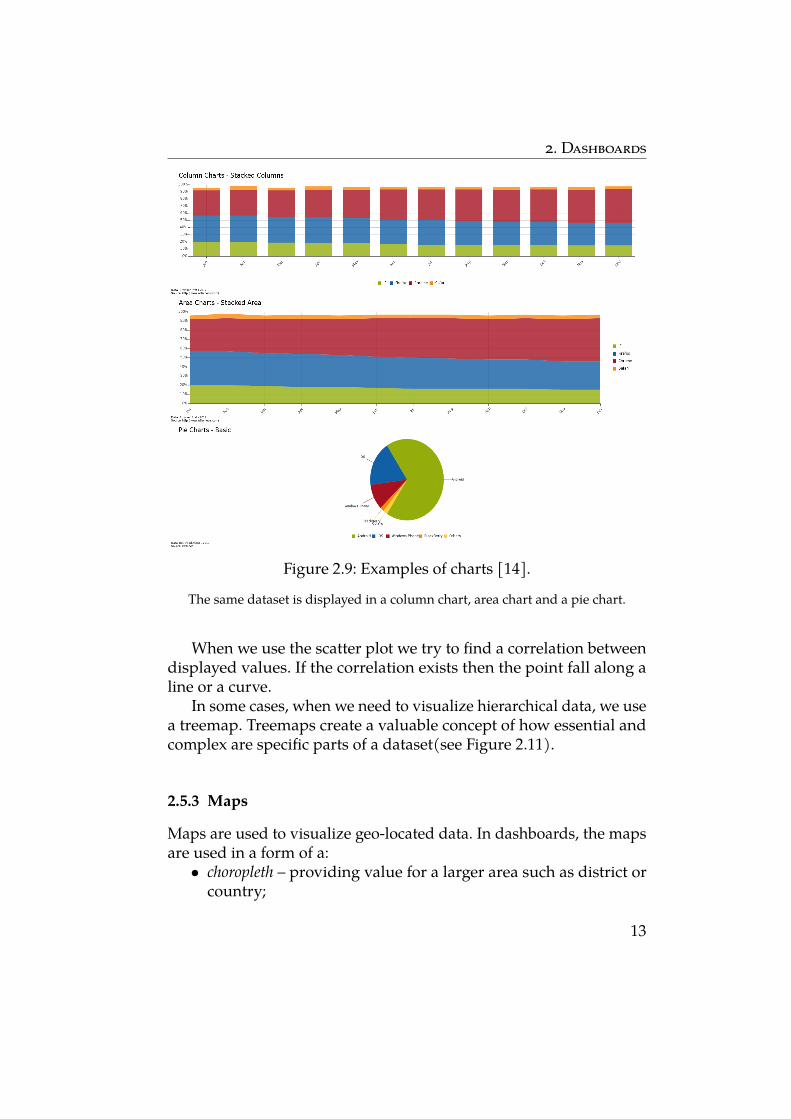
Charts are used to represent large sets of data and can take the form ofa chart, diagram, or picture. They are primarily used to show data thatare in some way categorized. The data is represented mainly by bars,lines, areas or sometimes figures; for example, in a hierarchy tree chart.Some charts are plotted on axes, for example, column charts and areacharts (see Figure 2.9). Many can represent the data by themselves,like pie chart, radar chart or more advanced heatmaps.
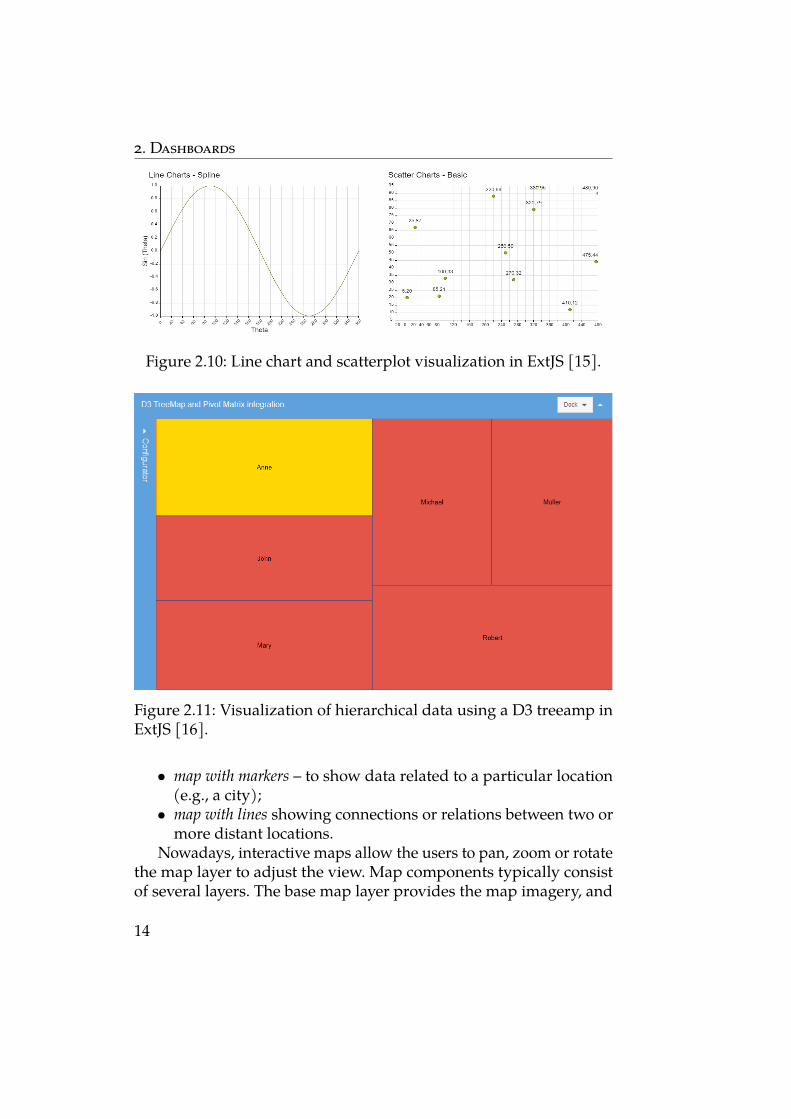
Another category of 2D charts are line charts and scatter plots, thatvisualize the relation between two or more variable quantities plottedon its horizontal and vertical axes (see Figure 2.10). On these axes, weput values representing the known value and the measured value. Forexample, we can create a line graph displaying the amount of consolessold during the first 5 minutes of a major launch, where we measureevery second. The known value would be the time when wemeasuredthe amount, and the measured value would be number of consolessold in that time.
12
2. Dashboards
Figure 2.9: Examples of charts [14].The same dataset is displayed in a column chart, area chart and a pie chart.
When we use the scatter plot we try to find a correlation betweendisplayed values. If the correlation exists then the point fall along aline or a curve.
In some cases, when we need to visualize hierarchical data, we usea treemap. Treemaps create a valuable concept of how essential andcomplex are specific parts of a dataset(see Figure 2.11).
2.5.3 Maps
Maps are used to visualize geo-located data. In dashboards, the mapsare used in a form of a:
• choropleth – providing value for a larger area such as district orcountry;
13
2. Dashboards
Figure 2.10: Line chart and scatterplot visualization in ExtJS [15].
Figure 2.11: Visualization of hierarchical data using a D3 treeamp inExtJS [16].
• map with markers – to show data related to a particular location(e.g., a city);
• map with lines showing connections or relations between two ormore distant locations.
Nowadays, interactive maps allow the users to pan, zoom or rotatethe map layer to adjust the view. Map components typically consistof several layers. The base map layer provides the map imagery, and
14
2. Dashboardsthe upper layers serve for data visualization that changes accordingto the data.
Amap should always be accompanied by the legend describing thedata mapping to colours or glyphs. A Legend contain a number scaleor a list of categories, both with corresponding colours representingpoints or areas on the map.
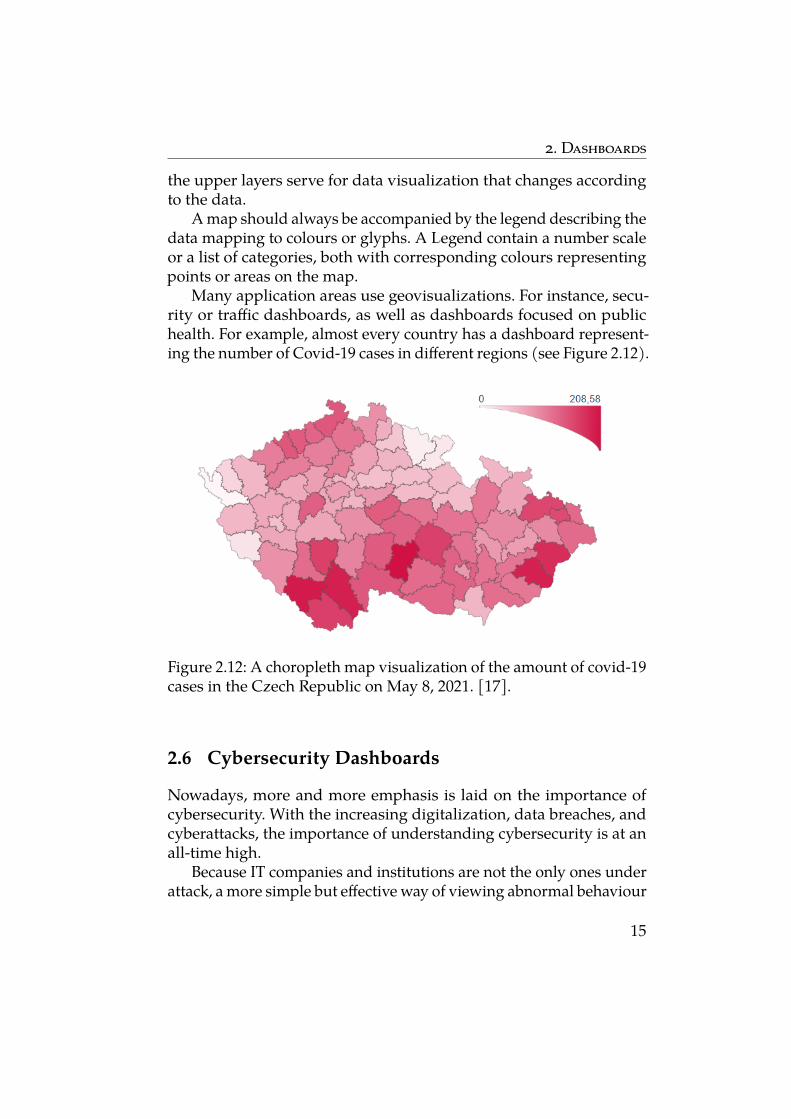
Many application areas use geovisualizations. For instance, secu-rity or traffic dashboards, as well as dashboards focused on publichealth. For example, almost every country has a dashboard represent-ing the number of Covid-19 cases in different regions (see Figure 2.12).
Figure 2.12: A choropleth map visualization of the amount of covid-19cases in the Czech Republic on May 8, 2021. [17].
2.6 Cybersecurity Dashboards
Nowadays, more and more emphasis is laid on the importance ofcybersecurity. With the increasing digitalization, data breaches, andcyberattacks, the importance of understanding cybersecurity is at anall-time high.
Because IT companies and institutions are not the only ones underattack, a more simple but effective way of viewing abnormal behaviour
15
2. Dashboardsin the companies system or data was needed. For example, healthfacilities are often the target for such type of attack.
That is where cybersecurity dashboards come in hand. Their pri-mary purpose is to display inconsistencies in data or any suspiciousactivity in the system and help cybersecurity operators and analyststo make informed decisions. They also help with planning strategiesand tactics in case another attack occurred. The real-time state of thesystem’s data is displayed to the user through information securityKPIs.
2.6.1 Information Security KPIs
According to experts [18], a security dashboard should consist of KPIsmonitoring:
• Current threat level to the organization– Low – no sign or expectation of an attack.– Medium – increased alertness; when we expect/know of
an upcoming attack without anything occurring before it.– High – known threat, when an attack is underway.– Extreme – full alert, high level on a global scale.
• Events and incidents that have occurredA log of events and incidents used for backtracking to the sourceof the attack
• Authentication errorsList of errors and failed attempts at authentication
• Scans, probes and unauthorized accessScanning and probing are the initial phases of a cyberattackused to gather information about the application’s structureand supporting infrastructure; during these steps, unauthorizedaccess can occur.
• Brute force attacks against the system and non-compliant de-vices.Trial-and-error attacks. Hackers use them, for example, to guesslogin info or find a hidden page by trying all possible combina-tions available.
• Clear visibility into the risk landscapeArisk/threat landscape is a collection of threatswith informationon identified vulnerable assets, threats and observed trends.[19]
16
2. Dashboards• Vulnerability management
Identifying, classifying, prioritizing, remediating, andmitigatingsoftware vulnerabilities.[20]
• Third-party risk managementThe goal is to analyze and control risks associated with outsourc-ing to third-party vendors or service providers.
• Incident managementProcess of restoring agreed service to the business as soon aspossible or to respond to service requests.[21]
• Overall risk managementOverview of the system as a whole and the possible threats.
• Mean time to patchThe time it takes to patch a vulnerability.
• Mean time to detect and respond to potential incidents– Mean time to detect (MTTD) – the time it takes to discovera potential security incident
– Mean time to respond (MTTR) – the time it takes to controland remediate a threat once it has been discovered.
• Average window of exposureAverage time a system is exposed to threats.
• Phish fail percentagePercentage of users who failed a phishing test.
• Impact of remedial trainingThe primal purpose of remedial training is to correct the partici-pant’s behaviour in case theywere unable to perform accordingly.It helps them improve and update their knowledge and skill intheir field.
• Policy violationsStatistics about the number and types of policy violations.
• Malware eventsEvents relating to malware activity.
• Phishing eventsData containing the frequency and amount of phishing incidents.
• Number of covered, newly discovered and decommissionedassetsDisplays the current management of financial assets.
17
2. Dashboards• Number of exceptions/types of exceptions
Some exceptions are expected, but companies need to keep trackof their usage in case an attacker is using them.
• Number of threats detected and their risk levelsStatistical overview of all detected risks/threats.
Most of these measures can be displayed using basic visualizations,such as bar or pie charts (see Figure 2.13). However, for a few of thembasic tools are ineffective, and they require more complex visualiza-tions. For instance, the data for overall risk management could beprojected into a treemap. Since it has multiple categories and subcat-egories, it can be easily displayed and accessed in a treemap. It alsogives a good overview of the vulnerability of each field since the mostattacked area will be the biggest, therefore the most eye-catching forthe user.
Another example of helpful visualization in security dashboardsis geovisualization. For example, we can use them to show how arecountries dealing with cyberattacks. We can track the progress ofcyberattacks over time, filter them by type and find out if a specificcountry is more susceptible to the selected type of attack.
Therefore, both treemap and geovisualizations are the main focusfor dashboard visualizations in this thesis.
18
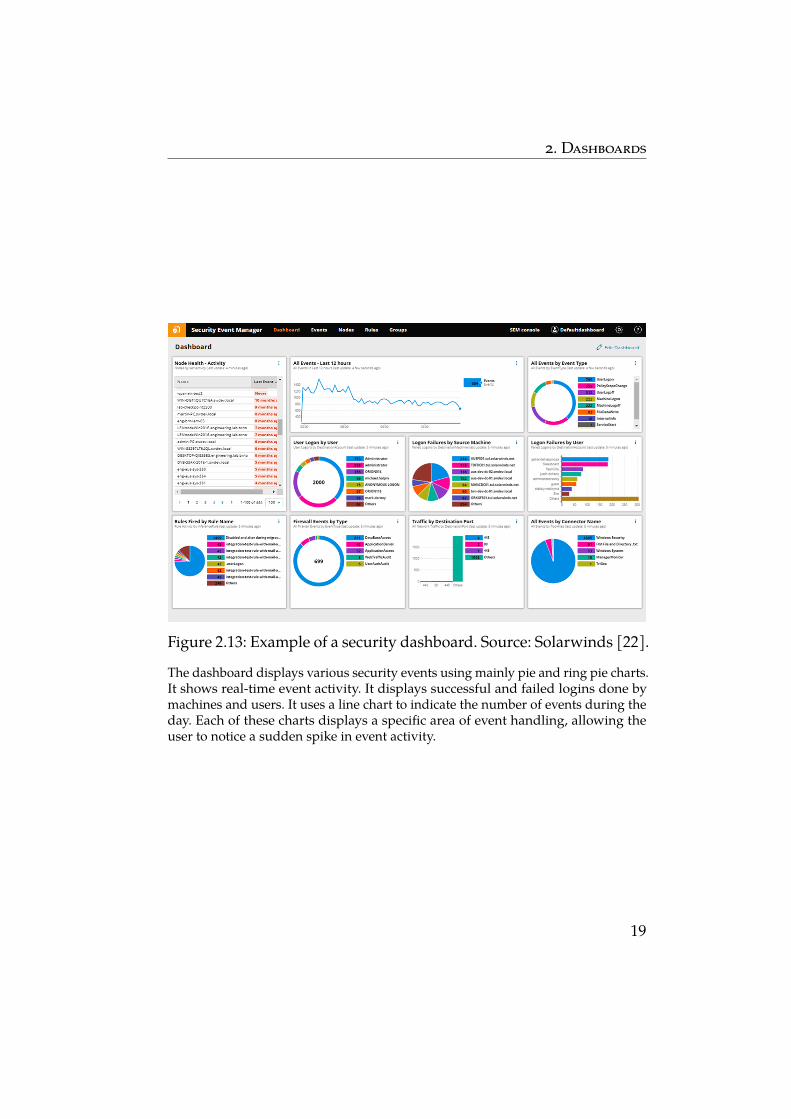
2. Dashboards
Figure 2.13: Example of a security dashboard. Source: Solarwinds [22].The dashboard displays various security events using mainly pie and ring pie charts.It shows real-time event activity. It displays successful and failed logins done bymachines and users. It uses a line chart to indicate the number of events during theday. Each of these charts displays a specific area of event handling, allowing theuser to notice a sudden spike in event activity.
19

3 Used Technologies
This chapter presents technologies used in practical part of this thesis.We explain how they work, and how we utilize them. Moreover, wediscuss their flaws, limitations and compatibility with other usedtechnologies.
3.1 ExtJS
In this section, we focus on the primary technology used in our thesis,which is ExtJS. We go through the meaning and creation of ExtJS,its history, possibilities for application architecture and usage in theimplementation.
3.1.1 What is ExtJS?
ExtJS is an abbreviation for extended or extensible JavaScript. It is aJavaScript framework used to developweb-based desktop applicationsand is compatible with all modern browsers. The main developer andowner of ExtJS is a company called Sencha. ExtJS offers a multitudeof visual tools and components. For example, charts, forms, trees,grids, menus, windows and much more. All of these components arecustomizable and offer many options to play with the design and theuse of these components. In our implementation we use the newestand last free version of ExtJS, which is the 6.0.2 version.
3.1.2 Beginnings of ExtJS
ExtJS is based on the Yahoo! User Interface Library (YUI), releasedin 2006. It was one of the first free libraries offering a rich set of UIcomponents and the possibility to manage their layout.
Few months after the release, Jack Slocum [23], CEO and Founderof Alta5, Sencha and the founding father of ExtJS, created a blogwherehe documented his experience and experiments with YUI. He createdthe Yahoo UI extensions (YUI-ext) from these experiments, whichbecame the forerunner for ExtJS. In time these extensions gained moreand more support from all around the world, and Slocum continued
21

3. Used Technologies
developing and adding to the new framework. A few version of YUI-ext were released before 2007 when Slocum decided to rename it sinceit became a more independent framework. In April 2007, the firstofficial version of ExtJS was release, ExtJS 1.0.
– ExtJS 1.0 – The main feature was the possibility to use jQueryand Prototype.
– ExtJS 2.0 – Introduction of XTypes which gave developers theability to create UI components using just JSON.
– ExtJS 3.0 – A server-side platform called Ext.Direct and RESTsupport are introduced. The platform allowed communicationbetween the server and client of an ExtJS application. That wasalso the last version developed mainly by Slocum.
3.1.3 Sencha
In 2007, Jack Slocum founded the company andwebsitewww.extjs.com.In 2010, by joining forces with jQTouch [24] and Raphaël projects [25],it was rebranded to Sencha [26] with ExtJS as their main product. Anew group took over the development of ExtJS, and Slocum becameless involved.
Since then, Sencha has released a new framework called SenchaTouch, the worlds first mobile HTML5 application framework, andseveral new versions of ExtJS.
ExtJS 4
Released in 2011, it revolutionized ExtJS. It contained major changesto ExtJS in terms of design, functioning and application architecture.For instance, these changes included:
• A completely new class system.• Namespaces, mixins and statics were added to the framework.• The MVC (Model View Controller) pattern was introduced.• Component-based plugins replaced the need to override or ex-
tend classes.• New layouts, VBox and HBox, were introduced.• Sencha Cmd was released and more.
22
3. Used Technologies
ExtJS 5Released in 2014, the version brought a lot of new features to ExtJSapplications. The most significant features introduced was the MVVM(Model View ViewModel) pattern and two-way data binding.
ExtJS 6This version merged Sencha Touch and ExtJS into one framework andwas released in 2015.
ExtJS 6.0.2It was released on March 29, 2016. The version fixed a few bugs andadded some features. For example, it added the possibility to workwith display fields.
Sencha offers a free version and also paid commercial version. Inour thesis, we use the latest free version of Extjs, ExtJS 6.0.2. Thisversion provides a multitude of ExtJS features and charts, and is verywell documented. But it lacksmore complex components like heatmap,treemaps or geovisualizations.
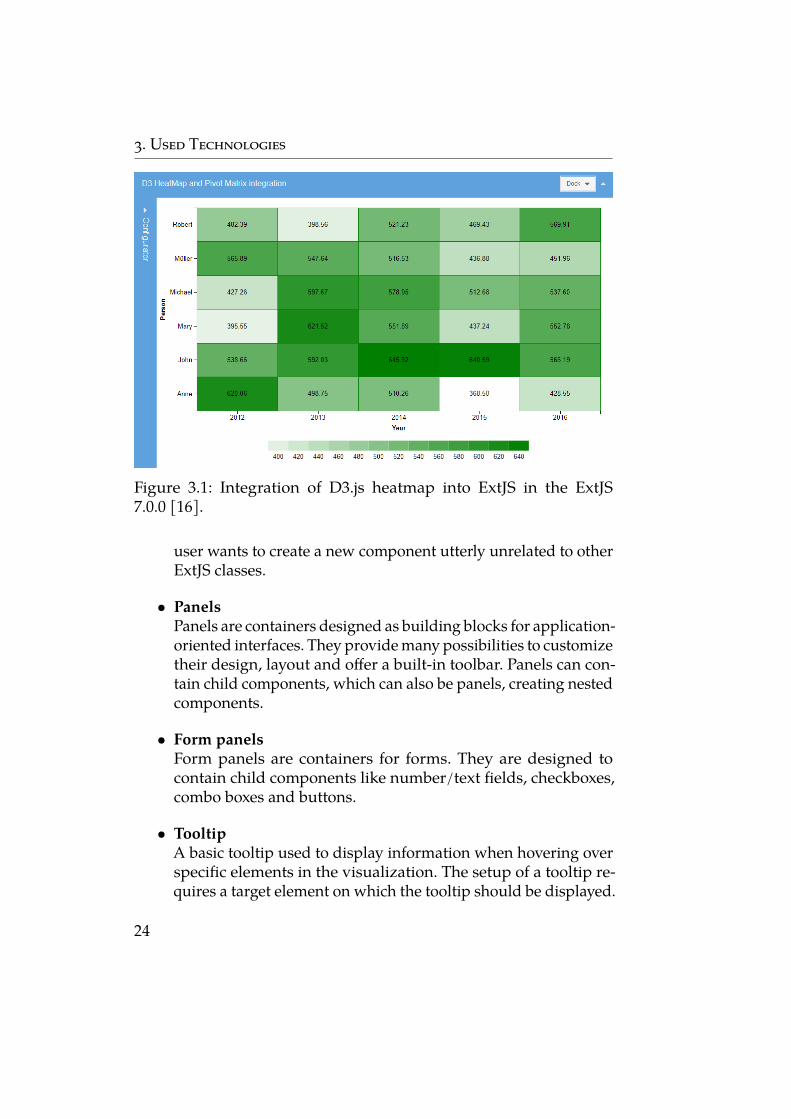
Newer versions continued to upgrade and fix the previous releases.They also created new components with the help of other JavaScriptframeworks. For example, with the integration of the D3.js frame-work, heatmap and treemap components were developed (see Fig-ure 3.1). Unfortunately, these versions are no longer free and requirea commercial licence, with the pricing of $1,295 for one developer andhigher [27].
3.1.4 ExtJS Features
ExtJS offers a variety of valuable features. Every feature offers listen-ers used to call customizable events. They are used to control thevisualizations behaviour. Some of the main ExtJS features are:
• ComponentIt is the core class for all components. Since it does not provideany specific functions or tools, it is rarely used. It is used if a
23
3. Used Technologies
Figure 3.1: Integration of D3.js heatmap into ExtJS in the ExtJS7.0.0 [16].
user wants to create a new component utterly unrelated to otherExtJS classes.
• PanelsPanels are containers designed as building blocks for application-oriented interfaces. They providemany possibilities to customizetheir design, layout and offer a built-in toolbar. Panels can con-tain child components, which can also be panels, creating nestedcomponents.
• Form panelsForm panels are containers for forms. They are designed tocontain child components like number/text fields, checkboxes,combo boxes and buttons.
• TooltipA basic tooltip used to display information when hovering overspecific elements in the visualization. The setup of a tooltip re-quires a target element on which the tooltip should be displayed.
24
3. Used Technologies
Targets can be dynamically changed, which means that there isno need for multiple tooltips for various elements.
• ToolbarsEither as a separate or a built-in component, toolbars have similaruse as form panels. They can contain fields, checkboxes, buttonsand other components used to configure the attached compo-nent..
• Number/text fields– Text field – Used as a text input. It gives the ability to set
restrictions on how the input should look or what it shouldor should not contain.
– Number field – It a numeric text field, allowing only numeri-cal values. The range of acceptable values can be configuredand a spinner can be added for easier use.
• ComboBoxesComboBoxes are components that create a dropdown selectionlist. The options of the list are created from the boxes data store.They offer remote selection, autocomplete, filtering and manyother features.
• CheckBoxeesPossibly the most straightforward component. It creates a vi-sual representation of a Boolean value and is regularly used asa configuration element. For example, to show or hide othercomponents.
• ButtonsOne of the more superficial elements. Buttons use handlers,which are click-event listeners. Generally, handlers are all a but-ton needs. Other events can be used to customize the button’sappearance.
3.1.5 Application Architecture
As previously mentioned, ExtJS provides support for the MVC andMVVM architecture. Both of these software patterns share some as-
25
3. Used Technologies
pects of the project structure. They offer a different approach to han-dling the behaviour of components and the application’s entry point,but the base structure of the project is the same.Common files between MVC and MVVM:
• app – It is themain file, which starts the application and connectsto the HTML file.
• Store – ExJS stores contain locally cached data. They fetch back-end data and feed them to the View.
• View – It contains the view structure of the application or a morecomplex component. It defines how the application appears.
• Model – In this file, objects are bound from the View to the storedata. The bind means that when an object is altered in some way,the store is updated.
Files that differ for MVC and MVVM architectures:• Controller – Controllers are used in the MVC architecture.
Their job is to control and maintain the application’s functional-ity. For example, it manages rendering/reloading layouts, thebehaviour of event listeners of components from the view andmore.
• ViewModel – ViewModel manages data specific for the View. Itbinds the data from the Model to the View and coordinates anyoccurring changes to the Model’s data. That way, the ViewModelcreate indirect interaction with the View using data binding.
MVC – Model View Controller
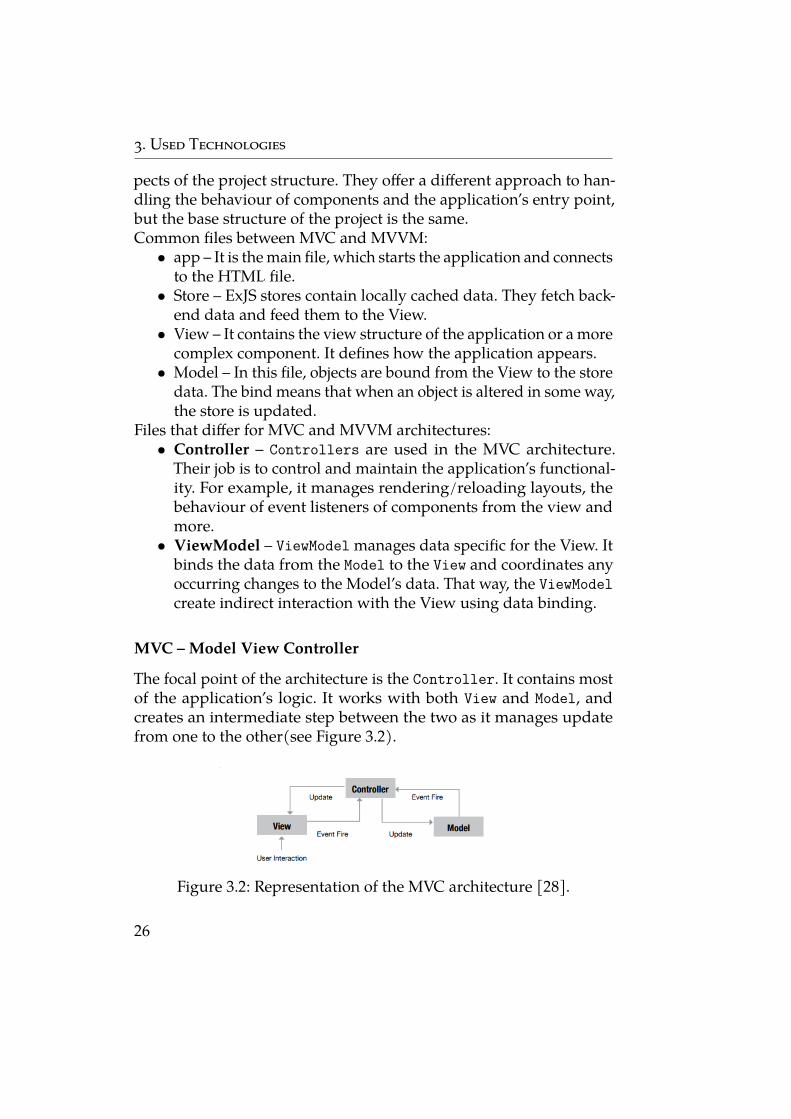
The focal point of the architecture is the Controller. It contains mostof the application’s logic. It works with both View and Model, andcreates an intermediate step between the two as it manages updatefrom one to the other(see Figure 3.2).
Figure 3.2: Representation of the MVC architecture [28].
26
3. Used Technologies
MVVM –Model View ViewModel
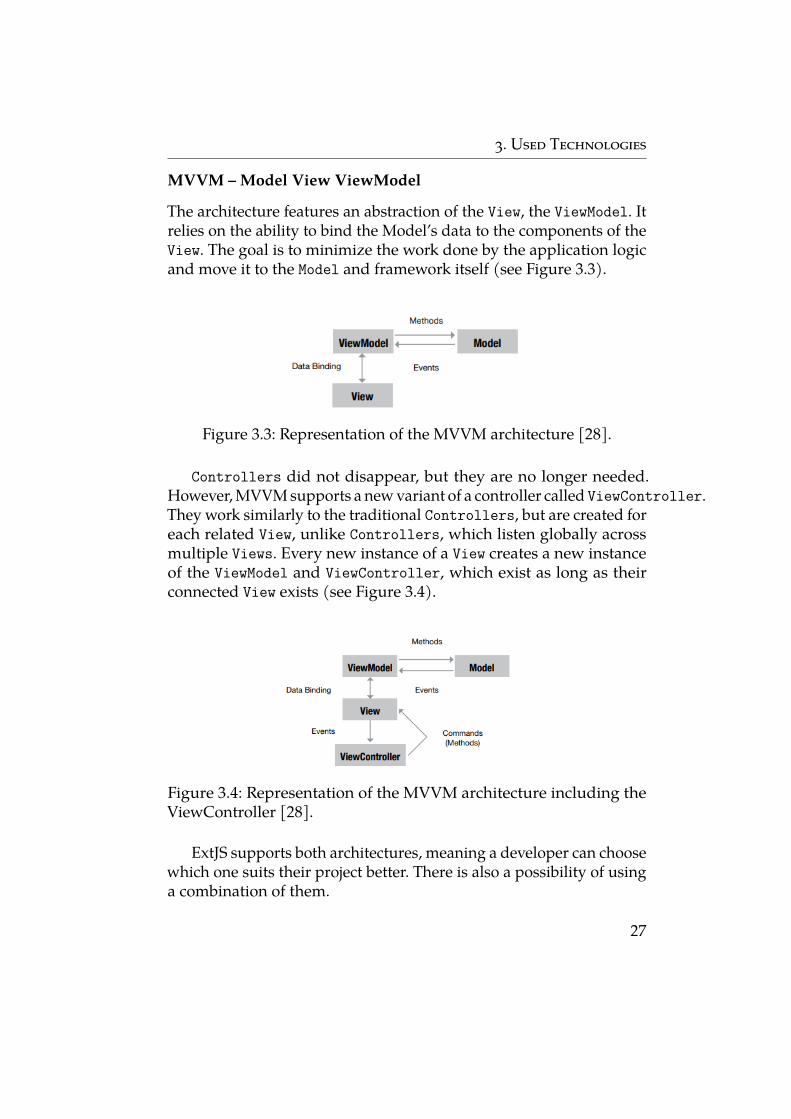
The architecture features an abstraction of the View, the ViewModel. Itrelies on the ability to bind the Model’s data to the components of theView. The goal is to minimize the work done by the application logicand move it to the Model and framework itself (see Figure 3.3).
Figure 3.3: Representation of the MVVM architecture [28].
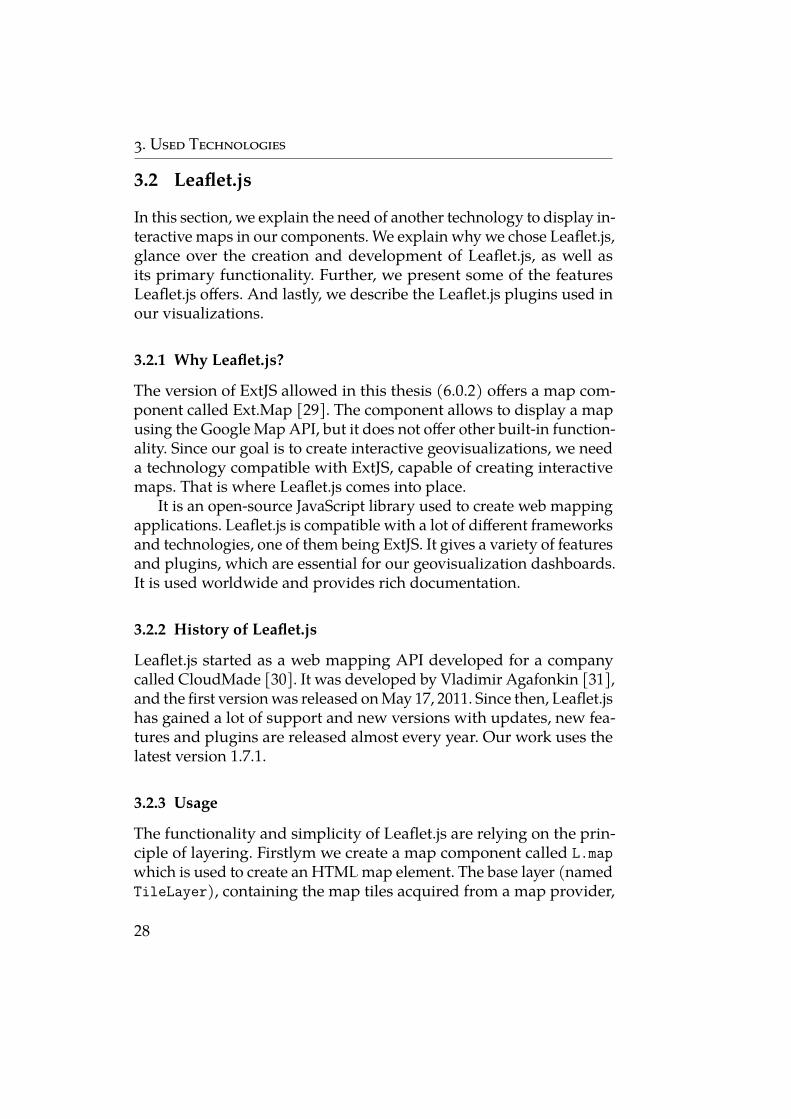
Controllers did not disappear, but they are no longer needed.However,MVVMsupports a newvariant of a controller called ViewController.They work similarly to the traditional Controllers, but are created foreach related View, unlike Controllers, which listen globally acrossmultiple Views. Every new instance of a View creates a new instanceof the ViewModel and ViewController, which exist as long as theirconnected View exists (see Figure 3.4).
Figure 3.4: Representation of the MVVM architecture including theViewController [28].
ExtJS supports both architectures, meaning a developer can choosewhich one suits their project better. There is also a possibility of usinga combination of them.
27
3. Used Technologies
3.2 Leaflet.js
In this section, we explain the need of another technology to display in-teractive maps in our components. We explain why we chose Leaflet.js,glance over the creation and development of Leaflet.js, as well asits primary functionality. Further, we present some of the featuresLeaflet.js offers. And lastly, we describe the Leaflet.js plugins used inour visualizations.
3.2.1 Why Leaflet.js?
The version of ExtJS allowed in this thesis (6.0.2) offers a map com-ponent called Ext.Map [29]. The component allows to display a mapusing the Google Map API, but it does not offer other built-in function-ality. Since our goal is to create interactive geovisualizations, we needa technology compatible with ExtJS, capable of creating interactivemaps. That is where Leaflet.js comes into place.
It is an open-source JavaScript library used to create web mappingapplications. Leaflet.js is compatible with a lot of different frameworksand technologies, one of them being ExtJS. It gives a variety of featuresand plugins, which are essential for our geovisualization dashboards.It is used worldwide and provides rich documentation.
3.2.2 History of Leaflet.js
Leaflet.js started as a web mapping API developed for a companycalled CloudMade [30]. It was developed by Vladimir Agafonkin [31],and the first versionwas released onMay 17, 2011. Since then, Leaflet.jshas gained a lot of support and new versions with updates, new fea-tures and plugins are released almost every year. Our work uses thelatest version 1.7.1.
3.2.3 Usage
The functionality and simplicity of Leaflet.js are relying on the prin-ciple of layering. Firstlym we create a map component called L.mapwhich is used to create an HTMLmap element. The base layer (namedTileLayer), containing the map tiles acquired from a map provider,
28
3. Used Technologies
such as OpenStreetMap, Mapbox or Google Maps, and displays themin the map component.
Further on, there can be another layers providing additional in-formation. Leaflet also offers the functions to dynamically changevisibility of each layer and interaction with them.
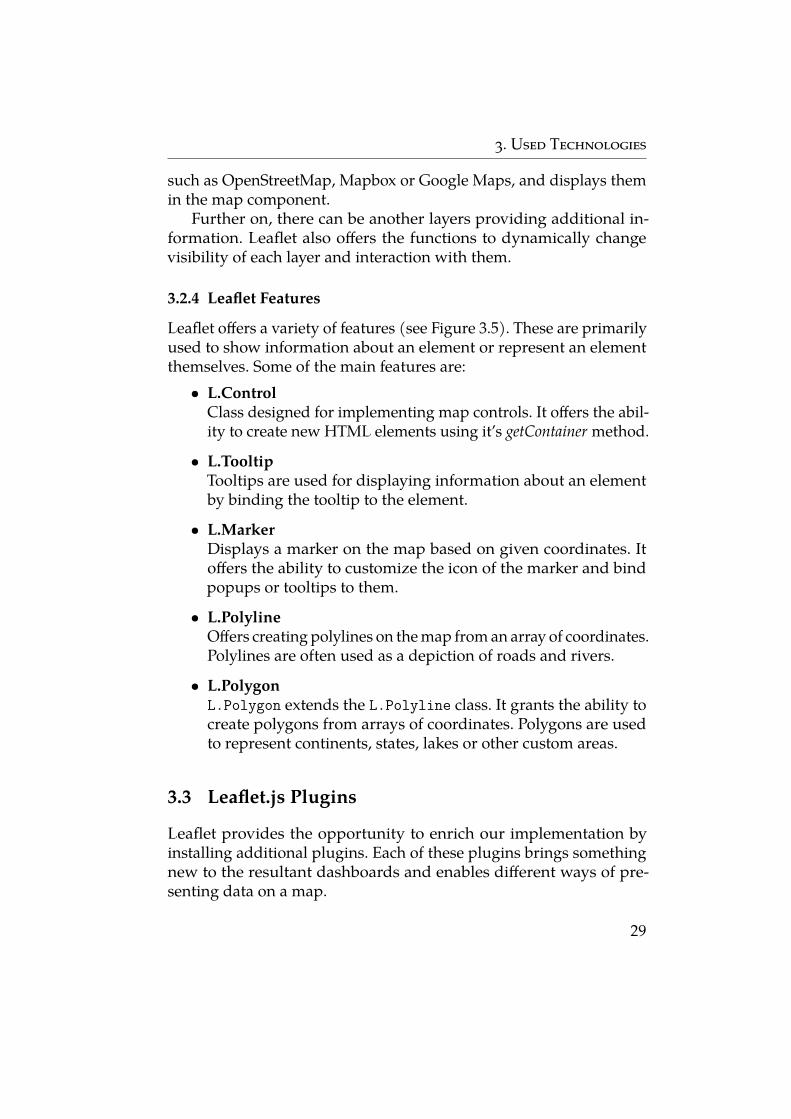
3.2.4 Leaflet Features
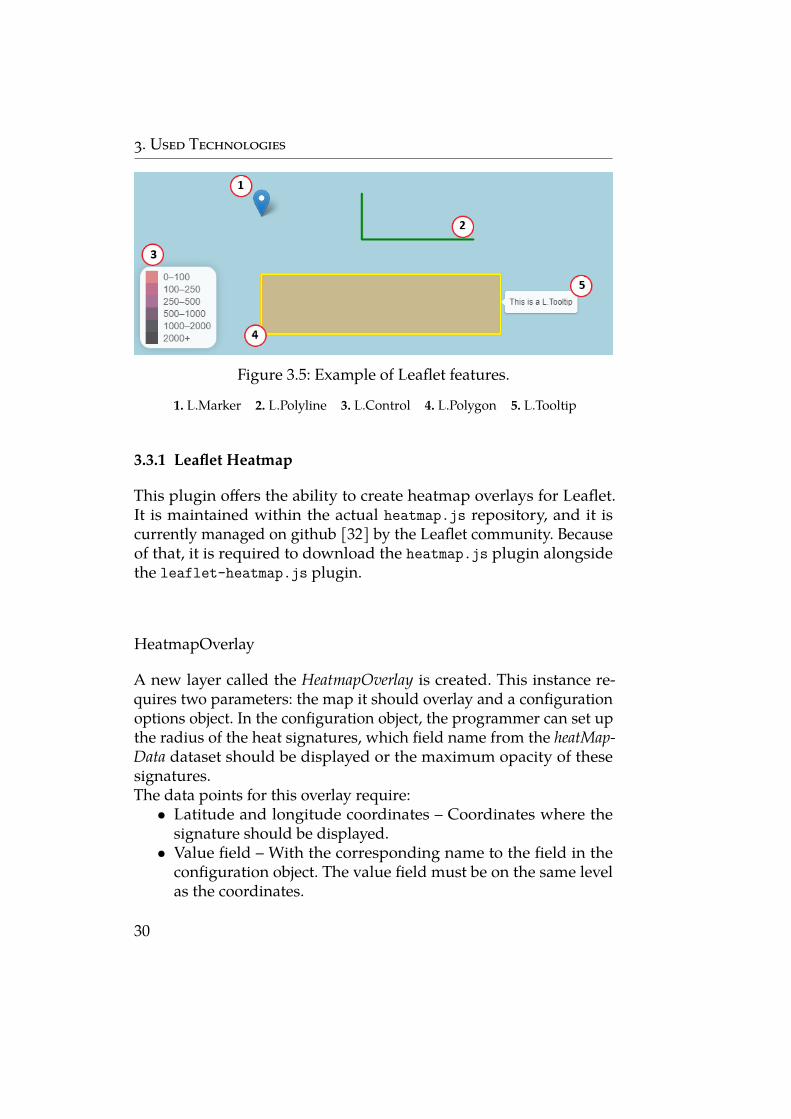
Leaflet offers a variety of features (see Figure 3.5). These are primarilyused to show information about an element or represent an elementthemselves. Some of the main features are:
• L.ControlClass designed for implementing map controls. It offers the abil-ity to create new HTML elements using it’s getContainer method.
• L.TooltipTooltips are used for displaying information about an elementby binding the tooltip to the element.
• L.MarkerDisplays a marker on the map based on given coordinates. Itoffers the ability to customize the icon of the marker and bindpopups or tooltips to them.
• L.PolylineOffers creating polylines on themap froman array of coordinates.Polylines are often used as a depiction of roads and rivers.
• L.PolygonL.Polygon extends the L.Polyline class. It grants the ability tocreate polygons from arrays of coordinates. Polygons are usedto represent continents, states, lakes or other custom areas.
3.3 Leaflet.js Plugins
Leaflet provides the opportunity to enrich our implementation byinstalling additional plugins. Each of these plugins brings somethingnew to the resultant dashboards and enables different ways of pre-senting data on a map.
29
3. Used Technologies
Figure 3.5: Example of Leaflet features.1. L.Marker 2. L.Polyline 3. L.Control 4. L.Polygon 5. L.Tooltip
3.3.1 Leaflet Heatmap
This plugin offers the ability to create heatmap overlays for Leaflet.It is maintained within the actual heatmap.js repository, and it iscurrently managed on github [32] by the Leaflet community. Becauseof that, it is required to download the heatmap.js plugin alongsidethe leaflet-heatmap.js plugin.
HeatmapOverlay
A new layer called the HeatmapOverlay is created. This instance re-quires two parameters: the map it should overlay and a configurationoptions object. In the configuration object, the programmer can set upthe radius of the heat signatures, which field name from the heatMap-Data dataset should be displayed or the maximum opacity of thesesignatures.The data points for this overlay require:
• Latitude and longitude coordinates – Coordinates where thesignature should be displayed.
• Value field – With the corresponding name to the field in theconfiguration object. The value field must be on the same levelas the coordinates.
30
3. Used Technologies
3.3.2 Leaflet Minichart
Leaflet.minichart is a leaflet plugin designed for creating smallcharts, minicharts, on a specific point on a leafletmap. It grants the abil-ity to construct bar charts, pie charts, polar-area chart and polar-radiuscharts. Unlike other plugins used in our dashboards, leaflet.minichartcan visualize multiple variables simultaneously. This way, we can seea comparison of values for one geographical point.
Creating a MinichartThe creation of a minichart requires the centre coordinates of theminichart and an object containing options for the minichart. Theoptions object sets:
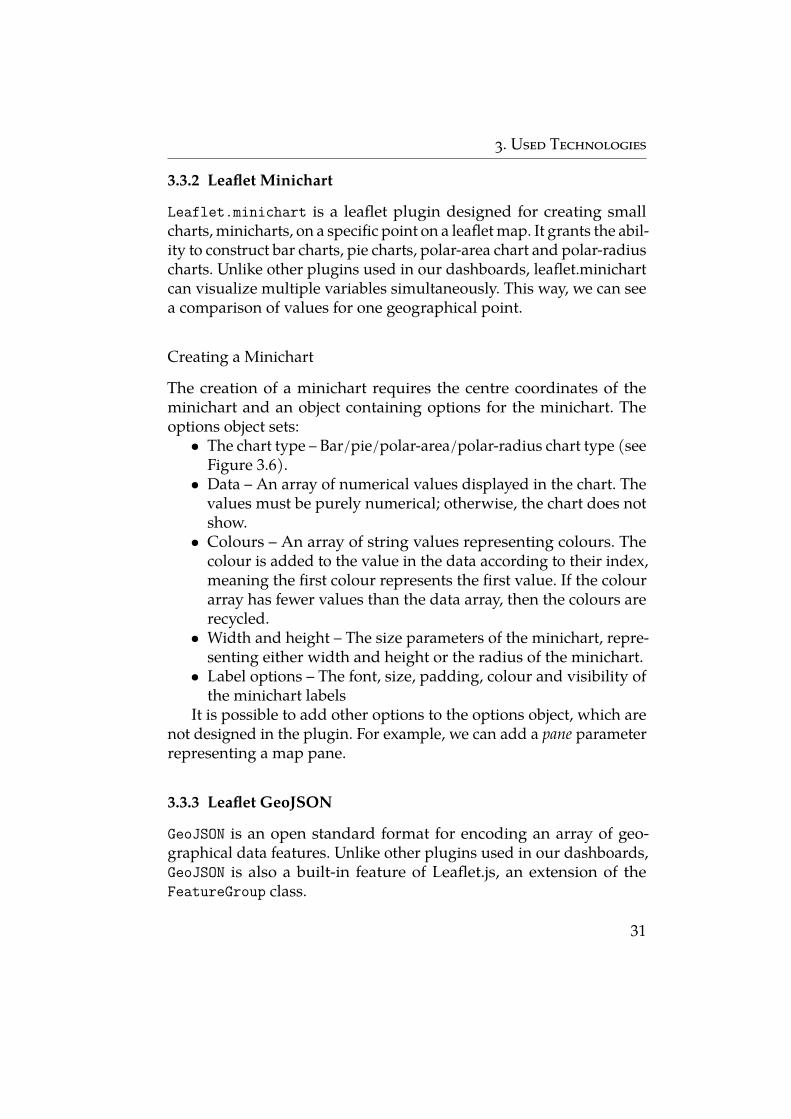
• The chart type – Bar/pie/polar-area/polar-radius chart type (seeFigure 3.6).
• Data – An array of numerical values displayed in the chart. Thevalues must be purely numerical; otherwise, the chart does notshow.
• Colours – An array of string values representing colours. Thecolour is added to the value in the data according to their index,meaning the first colour represents the first value. If the colourarray has fewer values than the data array, then the colours arerecycled.
• Width and height – The size parameters of the minichart, repre-senting either width and height or the radius of the minichart.
• Label options – The font, size, padding, colour and visibility ofthe minichart labels
It is possible to add other options to the options object, which arenot designed in the plugin. For example, we can add a pane parameterrepresenting a map pane.
3.3.3 Leaflet GeoJSON
GeoJSON is an open standard format for encoding an array of geo-graphical data features. Unlike other plugins used in our dashboards,GeoJSON is also a built-in feature of Leaflet.js, an extension of theFeatureGroup class.
31

3. Used Technologies
The development of GeoJSON started in March 2007 and was re-leased in June 2008. It was also released as an RFC by the IETF inAugust 2016 [33].
GeoJSON allows to create custom geographical areas on the map. Itoffers a multitude of features, including points, polygons, line stringsand multi polygons. Unlike Leaflet polygons and lines, GeoJSON addsevents to each of these elements, making them more interactive. Withthe help of custom controls and GeoJSON, we can create an interactivechoropleth visualization.
The GeoJSON Layer
GeoJSON creates a layer of objects, features described by their geometrysettings. Leaflet uses Features and Feature collections to represent thedata objects we want to display on our map. These objects containprincipally only three variables:
• Type – It is either a Feature or a collection of Features, FeatureC-ollection.
• Properties – Contains data values.• Geometry – Describes the object’s shape. The variable consists
of the geometrical type and geographical coordinates.Using the onEachFeature function we can style and globally configurethe events of each feature.
Figure 3.6: All types of minicharts.
32
3. Used Technologies
3.4 Treemap-squarify.js
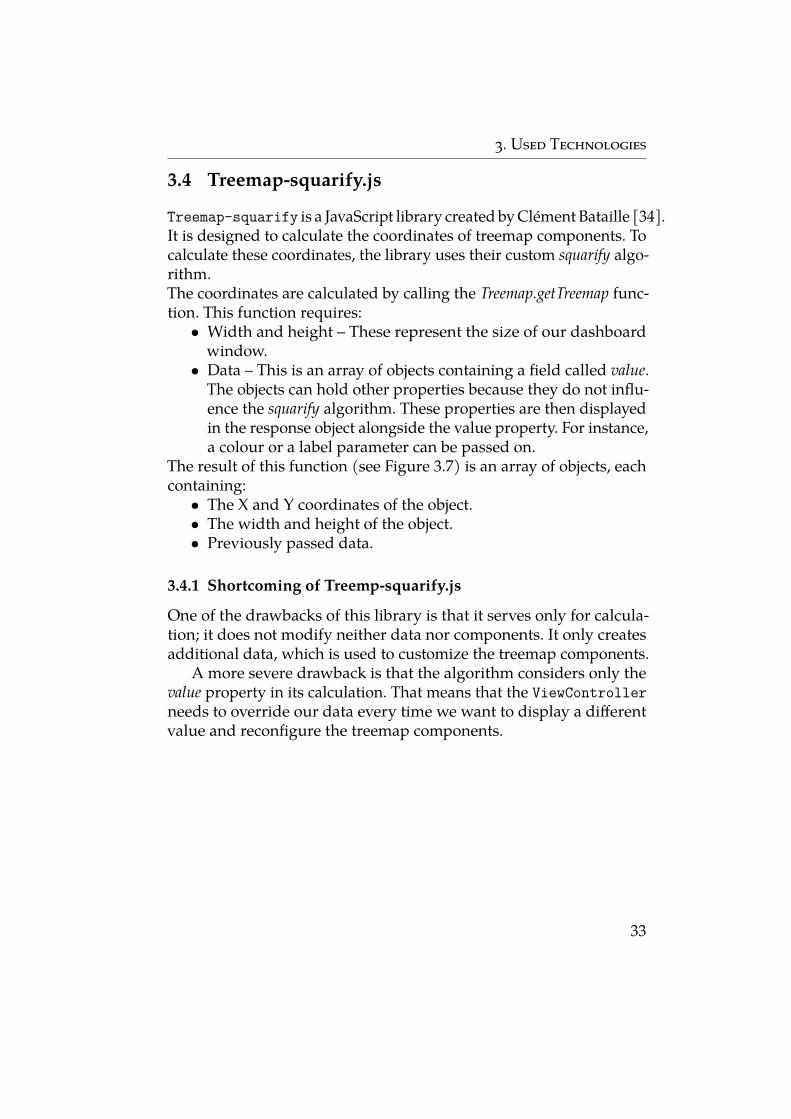
Treemap-squarify is a JavaScript library created byClément Bataille [34].It is designed to calculate the coordinates of treemap components. Tocalculate these coordinates, the library uses their custom squarify algo-rithm.The coordinates are calculated by calling the Treemap.getTreemap func-tion. This function requires:
• Width and height – These represent the size of our dashboardwindow.
• Data – This is an array of objects containing a field called value.The objects can hold other properties because they do not influ-ence the squarify algorithm. These properties are then displayedin the response object alongside the value property. For instance,a colour or a label parameter can be passed on.
The result of this function (see Figure 3.7) is an array of objects, eachcontaining:
• The X and Y coordinates of the object.• The width and height of the object.• Previously passed data.
3.4.1 Shortcoming of Treemp-squarify.js
One of the drawbacks of this library is that it serves only for calcula-tion; it does not modify neither data nor components. It only createsadditional data, which is used to customize the treemap components.
A more severe drawback is that the algorithm considers only thevalue property in its calculation. That means that the ViewControllerneeds to override our data every time we want to display a differentvalue and reconfigure the treemap components.
33
3. Used Technologies
Figure 3.7: Input and output data of the Treemap-squarify algorithm.
34
4 Implementation
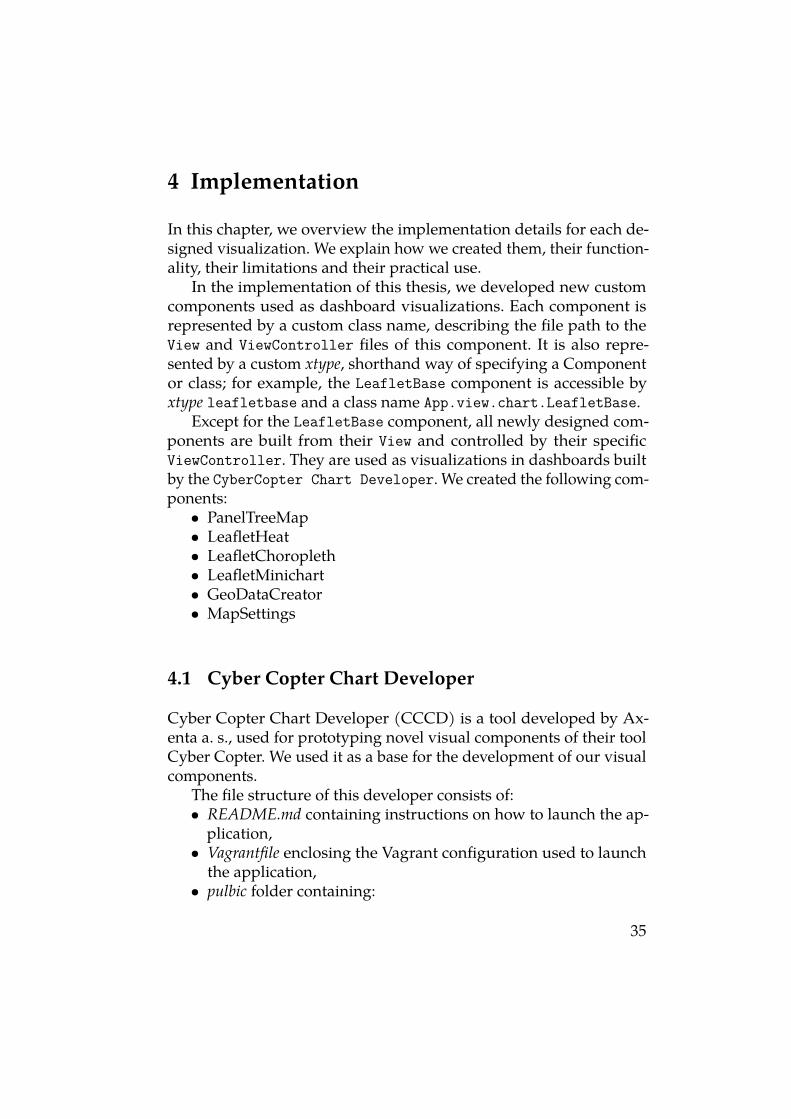
In this chapter, we overview the implementation details for each de-signed visualization. We explain how we created them, their function-ality, their limitations and their practical use.
In the implementation of this thesis, we developed new customcomponents used as dashboard visualizations. Each component isrepresented by a custom class name, describing the file path to theView and ViewController files of this component. It is also repre-sented by a custom xtype, shorthand way of specifying a Componentor class; for example, the LeafletBase component is accessible byxtype leafletbase and a class name App.view.chart.LeafletBase.
Except for the LeafletBase component, all newly designed com-ponents are built from their View and controlled by their specificViewController. They are used as visualizations in dashboards builtby the CyberCopter Chart Developer. We created the following com-ponents:
• PanelTreeMap• LeafletHeat• LeafletChoropleth• LeafletMinichart• GeoDataCreator• MapSettings
4.1 Cyber Copter Chart Developer
Cyber Copter Chart Developer (CCCD) is a tool developed by Ax-enta a. s., used for prototyping novel visual components of their toolCyber Copter. We used it as a base for the development of our visualcomponents.
The file structure of this developer consists of:• README.md containing instructions on how to launch the ap-
plication,• Vagrantfile enclosing the Vagrant configuration used to launch
the application,• pulbic folder containing:
35

4. Implementation
– index.php which loads all components and plugins, andlaunches the application,
– css folder carrying css files used for styling,– geoData folder, which holds custom datasets with randomlygenerated values created for this thesis,
– img folder containing images used in the applications, forinstance, a custom marker icon,
– js folder containing the implementation’s code,– data.php used for generating random data for components,– settings.phpwhich contains default settings for CCCD.
The main components of CCCD are the app.js,Main.js and the Viewand Controller of the ChartView component.
App.js controls the application’s set up and uses Main.js. Main.jsis the global Controller, which is responsible for the launch of thisdeveloper. This Controller offers the ability to create multiple dash-boards at once in the same application.
Each View component in the developer has a class name consistingof App.view.chart.SpecificComponent. This way, the Controller takesthe components names and tries to find the corresponding View files.
Once all wanted components are found, the Controller createsinstances of ChartView, a generalized dashboard component. Theseinstances then create selected visualizations, which the Controllerthen displays in the application.
4.2 PanelTreeMap
Consists of:• View – App.view.chart.PanelTreeMap• ViewController – App.controller.chart.PanelTreeMap• Custom static dataset – panelTreeMapData – array of objects con-
sisting of:– name – the name of the object– parent – name of it’s parent object– value – the specific value the object represents– colour – the colour used for this object in the visualization– children – child objects with the same structure
36
4. Implementation
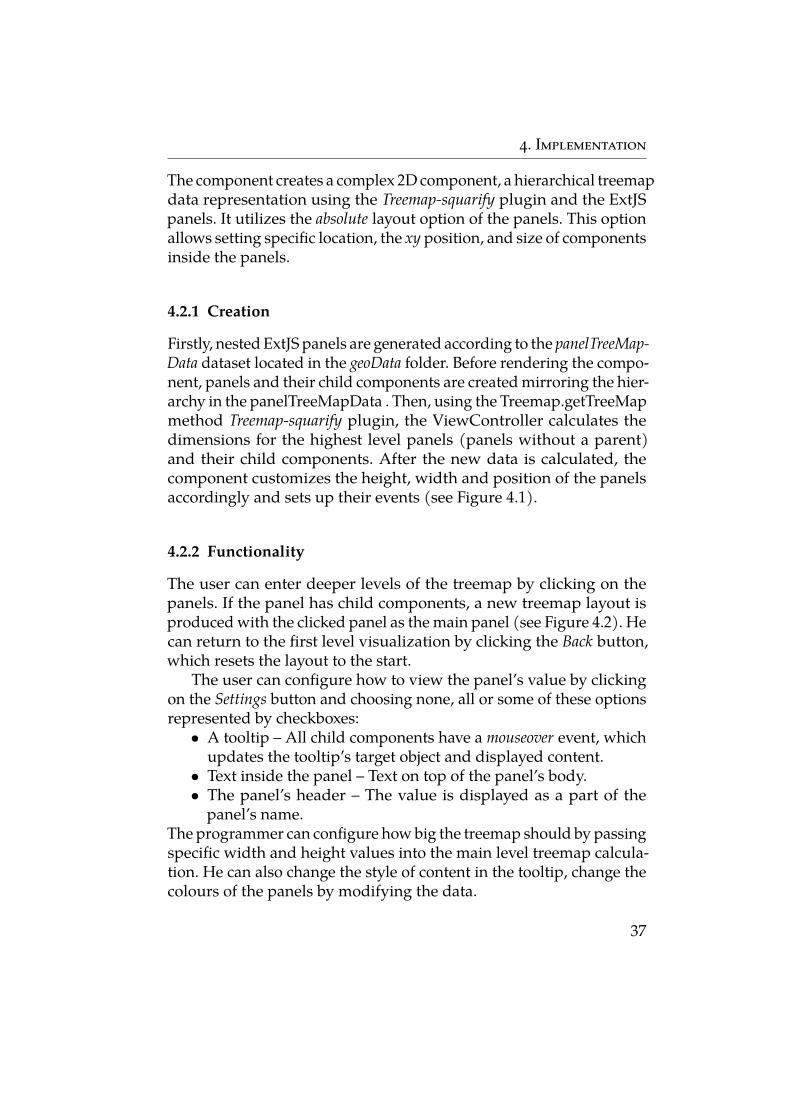
The component creates a complex 2D component, a hierarchical treemapdata representation using the Treemap-squarify plugin and the ExtJSpanels. It utilizes the absolute layout option of the panels. This optionallows setting specific location, the xy position, and size of componentsinside the panels.
4.2.1 Creation
Firstly, nested ExtJS panels are generated according to the panelTreeMap-Data dataset located in the geoData folder. Before rendering the compo-nent, panels and their child components are createdmirroring the hier-archy in the panelTreeMapData . Then, using the Treemap.getTreeMapmethod Treemap-squarify plugin, the ViewController calculates thedimensions for the highest level panels (panels without a parent)and their child components. After the new data is calculated, thecomponent customizes the height, width and position of the panelsaccordingly and sets up their events (see Figure 4.1).
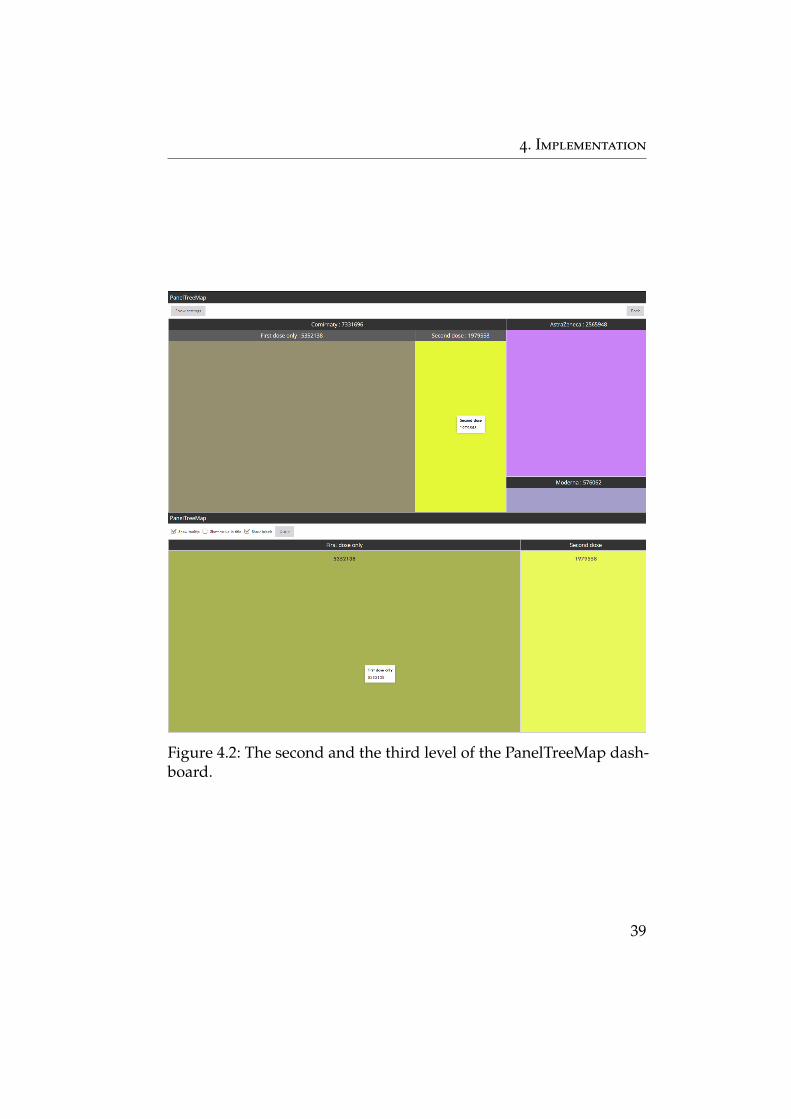
4.2.2 Functionality
The user can enter deeper levels of the treemap by clicking on thepanels. If the panel has child components, a new treemap layout isproducedwith the clicked panel as the main panel (see Figure 4.2). Hecan return to the first level visualization by clicking the Back button,which resets the layout to the start.
The user can configure how to view the panel’s value by clickingon the Settings button and choosing none, all or some of these optionsrepresented by checkboxes:
• A tooltip – All child components have a mouseover event, whichupdates the tooltip’s target object and displayed content.
• Text inside the panel – Text on top of the panel’s body.• The panel’s header – The value is displayed as a part of the
panel’s name.The programmer can configure howbig the treemap should by passingspecific width and height values into the main level treemap calcula-tion. He can also change the style of content in the tooltip, change thecolours of the panels by modifying the data.
37
4. Implementation
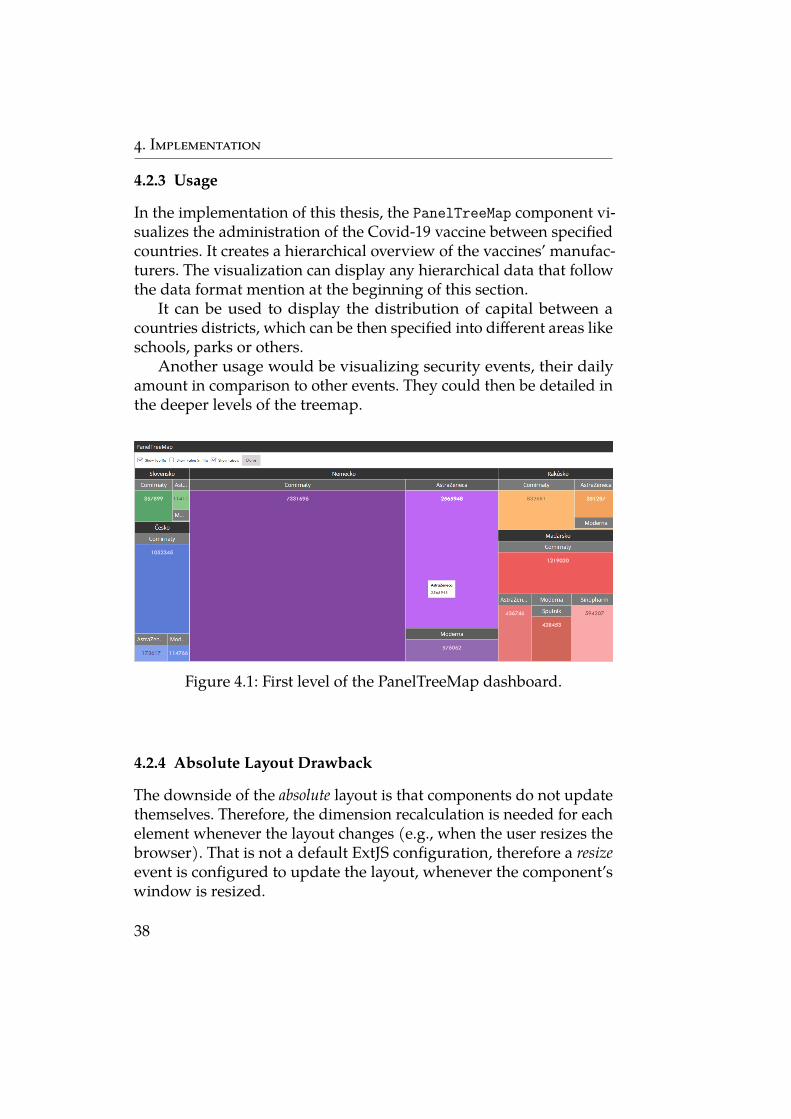
4.2.3 Usage
In the implementation of this thesis, the PanelTreeMap component vi-sualizes the administration of the Covid-19 vaccine between specifiedcountries. It creates a hierarchical overview of the vaccines’ manufac-turers. The visualization can display any hierarchical data that followthe data format mention at the beginning of this section.
It can be used to display the distribution of capital between acountries districts, which can be then specified into different areas likeschools, parks or others.
Another usage would be visualizing security events, their dailyamount in comparison to other events. They could then be detailed inthe deeper levels of the treemap.
Figure 4.1: First level of the PanelTreeMap dashboard.
4.2.4 Absolute Layout Drawback
The downside of the absolute layout is that components do not updatethemselves. Therefore, the dimension recalculation is needed for eachelement whenever the layout changes (e.g., when the user resizes thebrowser). That is not a default ExtJS configuration, therefore a resizeevent is configured to update the layout, whenever the component’swindow is resized.
38
4. Implementation
Figure 4.2: The second and the third level of the PanelTreeMap dash-board.
39
4. Implementation
4.3 LeafletBase
Consists of:• View – App.view.chart.LeafletBaseLeafletBase is a custom geovisualization component extending
the Ext.Component class that allows to create and display the Leafletmap element in an ExtJS application.
It was inspired by Kevin Kazmierczak [35] and Jürg Hunziker [36]and their attempt at Leaflet integration into ExtJS [37, 38].
LeafletBase contains the default configuration settings for thebase map. For instance, it includes:– initialLocation – initial centre coordinates of the map,– initialZoomLevel – integer value representing the initial zoomlevel of the map,
– useCurrentLocation – boolean value, initial location is set to theuser’s current location.
– tileLayerUrl - contains the URL link for the TileLayer,– tileMaxZoom – sets maximal zoom of the map,– tileMinZoom – sets minimal zoom of the map,– noWrap – boolean value, this setting sets if the map should duplicateonce you go over the border,
– attribution – attribution for the source of the map.These configurations can be modified in the View files of the geovi-
sualizations. The only purpose of this component is to create and showthe base map layer; for this reason, it does not need a ViewController.Every components handles the maps behaviour with their specificViewController.
4.4 LeafletHeat
Consists of:• View – App.view.chart.LeafletHeat• ViewController – App.controller.chart.LeafletHeat• Custom static dataset – heatMapData – an array of objects repre-
senting heat signatures, consisting of:– name – name of the object
40
4. Implementation
– latitude and longitude coordinates – center coordinates forthe heat signature
– value – value representing the object– data – object containing data values
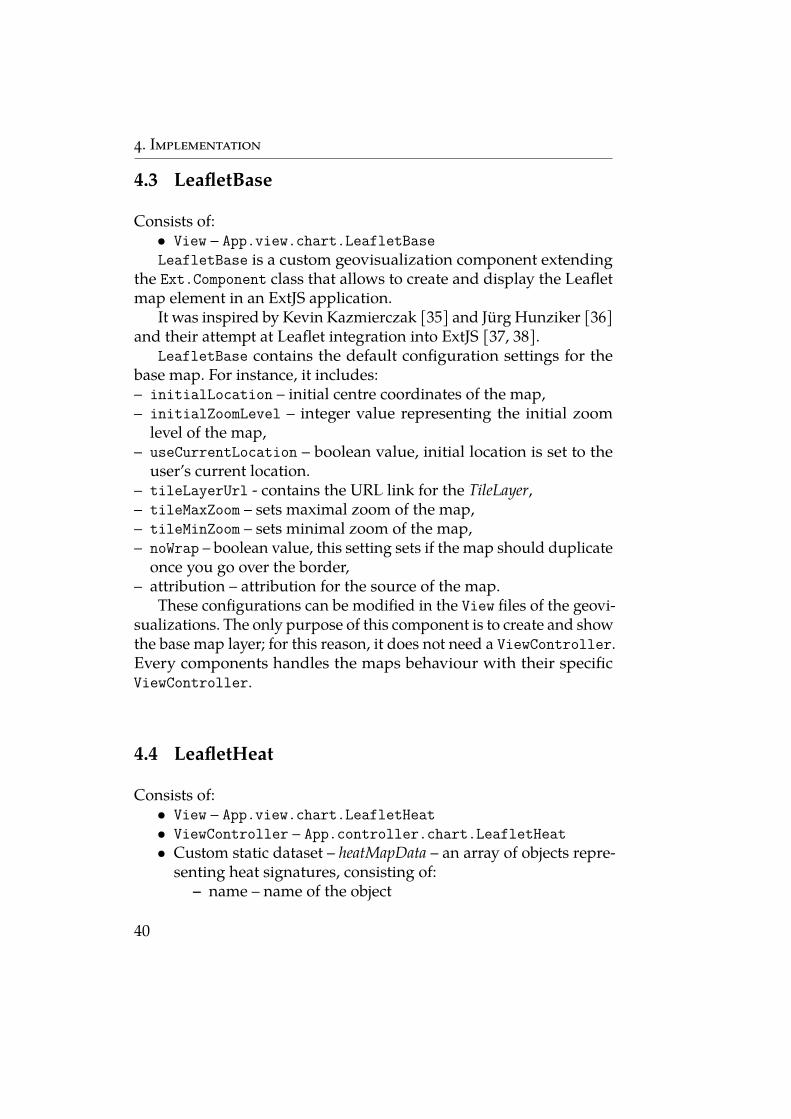
The component represents a geographical heatmap. It was createdusing the leaflet-heatmap plugin, which creates the HeatmapOverlaylayer that overlayes the map with heat signatures representing thefrom heatMapData dataset.
Figure 4.3: LeafletHeat vizualization.We can see the info card display information about the hover heat signature andtooltip displaying the currently selected value.
4.4.1 Creation
The component creates the heatmap layer using the HeatmapOverlayfunction of the leaflet-heatmap.js plugin, which takes a configurationobject and is added to the map. The object contains configuration for:
• radius – defines the radius of the heat signatures• maxOpacity – defines the maximal opacity level• minOpacity – defines the minimal opacity level• scaleRadius – boolean value, scales the radius according to the
map zoom
41
4. Implementation
• useLocalExtrema – boolean value, defines whether the heatmapshould use global extrema from all of the heatmaps data or localextrema from the currently seen heat signatures
• latField – string value representing the latitude coordinate inthe heatmaps data
• lngField – string value representing the longitude coordinatein the heatmaps data
• valueField – string value representing the value parameter fromthe heatmaps data
• gradient – object containing percentages of the maximal valueand corresponding colours
4.4.2 Functionality
The user can select which data value to display in the heatmap using acomboBox in the visualizations toolbar. He can also hide legend, infocard and the tooltip, and configure the base map through the Settingsbutton. The user can also upload new data to the visualization usingthe Upload data button. If the data has the incorrect format, an alertwindow pops up, and the heatmap does not change.
He can use the tooltip or info card to display the value of a heatsignature. The component uses an ExtJS tooltip to display a particularheat signature value. The heatmap layer does not contain objects rep-resenting the heat signatures, only coordinates with correspondingvalues. To update the content of the tooltip accordingly, we use themap’s mousemove event. When we move with a mouse over the map,it captures the mouse cursor’s position and tries to find it in the data.If found, the tooltips and info cards content is updated.
4.4.3 Usage
Geographical heatmaps are used to show the intensity for a specificparameter on the map. For example, the population density or thenumber of cyberattacks for a particular place.
For example, it can display the volume of Covid-19 cases in specificareas on the map; the brighter and more prominent the signature is,the more cases occur in the area.
42
4. Implementation
4.4.4 HeatMapOverlay Drawback
The configuration object for the HeatMapOverlay requires knowingwhich parameter’s value to express. Because of that, we would needto remove and create new heatmap layers if we wanted to change theconfiguration. This visualization uses a more efficient way, which onlychanges the data of the heatmap layer. It uses a comboBox to selectwhich value the heatmap represents. The comboBox has a change event,which rewrites the value’s parameter in the heatMapData dataset andupdates the heatmap’s data.
4.5 LeafletMinichart
Consists of:• View – App.view.chart.LeafletMinichart• ViewController – App.controller.chart.LeafletMinichart• Custom static dataset – miniChartMapData – array of object rep-
resenting cities, states and regions, consisting of:– name – name representing the object– latitude and longitude coordinates – center coordinates for
the minichart the object represents– depth_level – value representing to which category the
minichart belongs(cities, states, regions)– data – object containing data values
The visualization utilizes the leaflet.minichart plugin to create smallcharts (minicharts) on the base map. Unlike other geovisualizations,these minicharts can show multiple values belonging to one locationat the same time.
4.5.1 Creation
The component createsminichart from theminiChartMapData.jsdatasetusing the L.minichart function of the leaflet.minichart plugin. Each charthas the same type and size. Two new parameters were created to helpwork with these minicharts:
• pane – string value of a map’s pane, which is calculated fromthe depth_level parameter from the data
43
4. Implementation
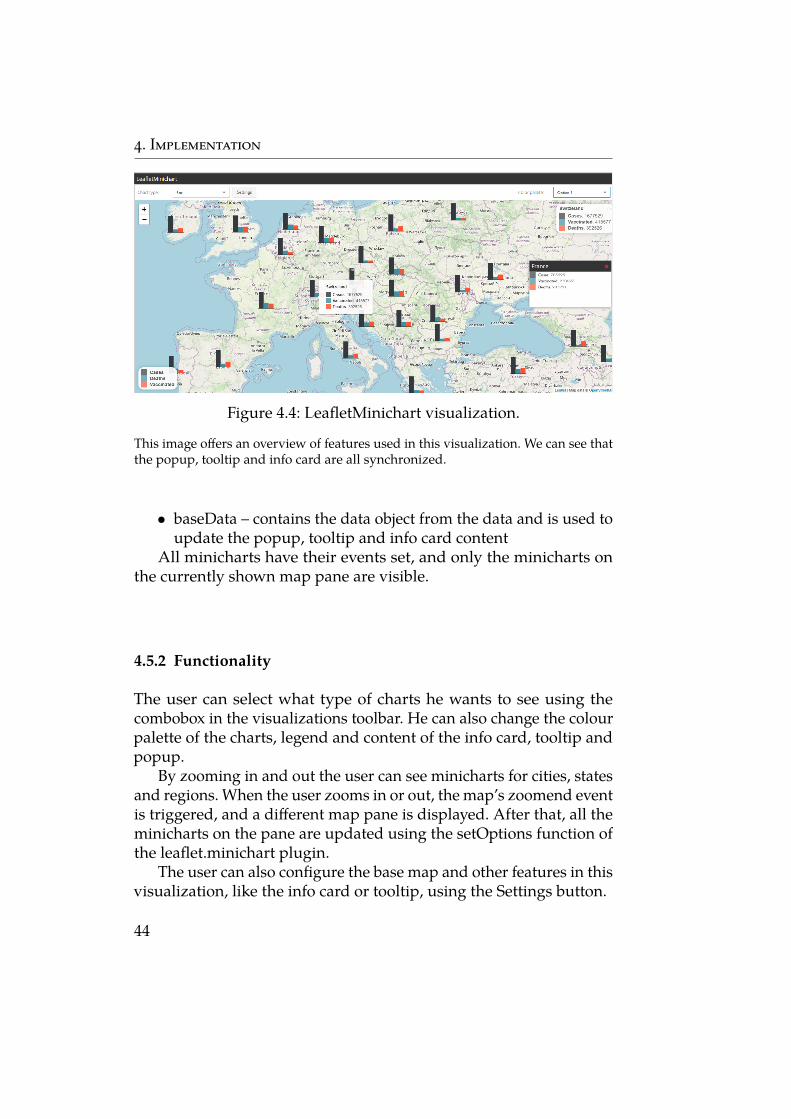
Figure 4.4: LeafletMinichart visualization.This image offers an overview of features used in this visualization. We can see thatthe popup, tooltip and info card are all synchronized.
• baseData – contains the data object from the data and is used toupdate the popup, tooltip and info card content
All minicharts have their events set, and only the minicharts onthe currently shown map pane are visible.
4.5.2 Functionality
The user can select what type of charts he wants to see using thecombobox in the visualizations toolbar. He can also change the colourpalette of the charts, legend and content of the info card, tooltip andpopup.
By zooming in and out the user can see minicharts for cities, statesand regions. When the user zooms in or out, the map’s zoomend eventis triggered, and a different map pane is displayed. After that, all theminicharts on the pane are updated using the setOptions function ofthe leaflet.minichart plugin.
The user can also configure the base map and other features in thisvisualization, like the info card or tooltip, using the Settings button.
44
4. Implementation
4.5.3 L.Minichart Drawback
The L.Minichart function is in its basic state very limited and does notoffer many useful parameters.
Luckily the leaflet.minichart plugin is not strict and allows addingadditional parameters when the minichart is created. This way, thepane parameter, which maps itself to a map pane with the same name.
Since the original configurations only uses only numerical values,it is not possible to know which values are displayed. Therefore, thebaseData parameter containing detailed data was created.
4.5.4 Usage
Minicharts are used to display multiple values representing one place.In this implementation, minicharts represent the values for activeCovid-19 cases, deaths by Covid-19 and the number of vaccinatedpeople for a particular state, city and regions.
It can be used in probably any application field as it offers theability to show multiple values at once and we can work with thecharts as individual objects instead of one layer.
4.6 LeafletChoropleth
Consists of:• View – App.view.chart.PanelTreeMap• ViewController – App.controller.chart.PanelTreeMap• Custom static dataset containing values – choroplethMapData – a
dictionary object containing names of countries with their datavalues
• Custom static dataset containing coordinates for the GeoJSONlayer – choroplethMapCoordinates – GeoJSON FeatureCollectionobject containing and array of Feature objects consisting of:
– type – the Feature type– properties – object containing the name and data value forthe feature
– geometry – object containing the type and coordinates ofthe feature
45
4. Implementation
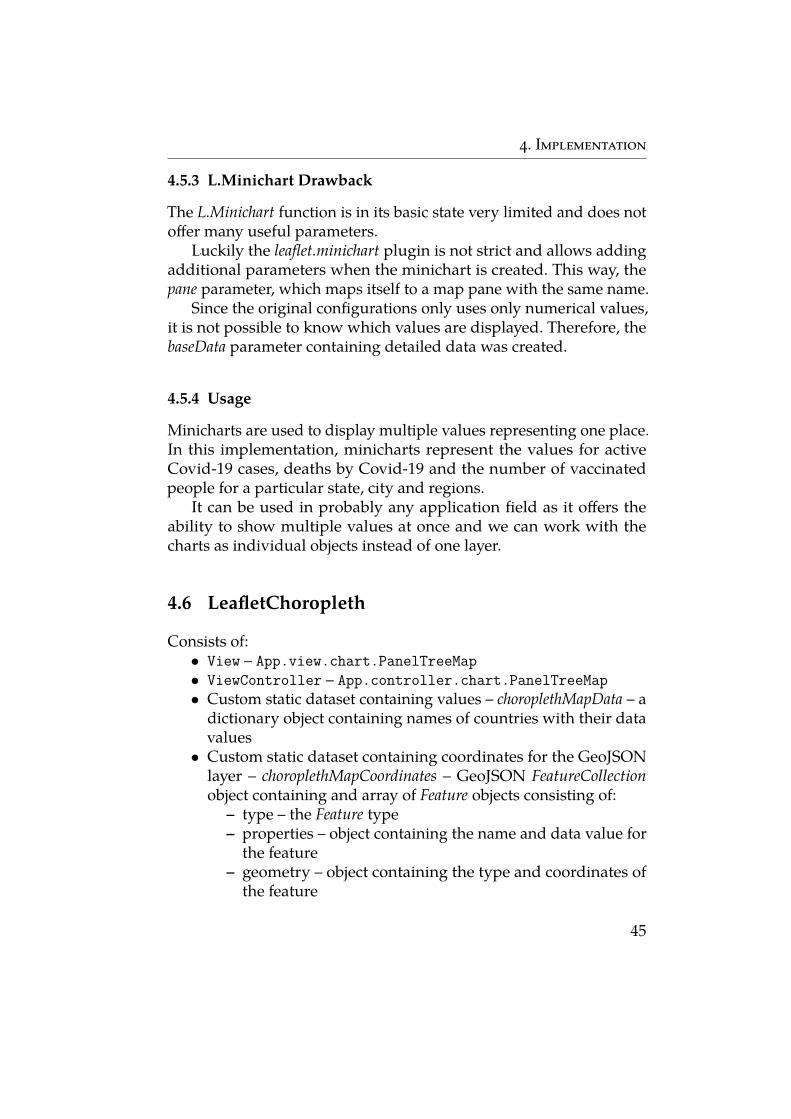
The component utilizes the built-in GeoJSON Leaflet plugin. It createsan interactive choropleth map displaying custom geographical areas(see Figure 4.5).
Figure 4.5: LeafletChoropleth component.We can see how the choropleth map sets colours corresponding to the values in thelegend component.
4.6.1 Creation
The component is created using the L.geojson function, which takesthe geographical data about the features it wants to create from thechorolethMapCoordinates dataset. GeoJSON generates features for whichthe ViewController set up styles and events using the onEachFeatureconfiguration. It sets the features style, adds colour, sets the highlighteffect and binds the tooltip.
4.6.2 Functionality
The user can select which data value he wants the choropleth map todisplay. When a value is selected the value paremeter’s content in thechoroplethMap Coordinates dataset is updated to the chosen parameter’svalue.The user can alse change the colour palette of the interactivelayer to his liking using the colour comboBox in the visualization’stoolbar.
46
4. Implementation
He can configure the added elements (legend, info card, tooltip)and the base map using the Settings button.
Like in the LeafletHeat visualization, the user can upload newdata to the visualization using the Upload data button. If the dataformat of the uploaded data is incorrect, an alert pops up, and thechoropleth map stays intact.
4.6.3 GeoJSON Drawback
Because the data representing GeoJSON features can be very compli-cated and extensive, it divided into two datasets instead of one. Themutual value for these datasets is the name of the feature.
It might not seem as much, but this creates more operations forthe visualizations and therefore more possibilities for errors. We mustnow take care of two datasets instead of one, which need to also bemapped on eachother.
Usage
Choropleth maps offer displaying data representing areas on the map.The areas are visually modified to interpret the values they represent.The LeafletChoropleth component displays areas representing coun-tries where the country’s colour changes according to the declaredvalue.
For example, it shows the population density of these countries orthe number of cyberattacks for each country.
4.7 GeoDataCreator
Consists of:• View – App.view.chart.GeoDataCreator• ViewController – App.controller.chart.GeoDataCreator
Each geovisualization requires a specific format of data. Therefore itis helpful to have a component capable of creating the data formatinstead of writing it manually.
47
4. Implementation
4.7.1 Creation
The component is created solely using the LeafletBase component. Itdoes not require any additional plugins and it utilizes Leaflet features.
4.7.2 Functionality
The user has the ability to create new custom datasets. The user canchoose between two types of dataset:
• Dataset of points – Mode for creating data consisting of points,which are displayed as markers using the L.Marker feature.
• Choropleth dataset – In this mode, the component uses theL.Polygon feature to produce custompolygons on themap. Eachpolygon represents a feature in the new dataset, and its coordi-nates are saved under their geometry property.
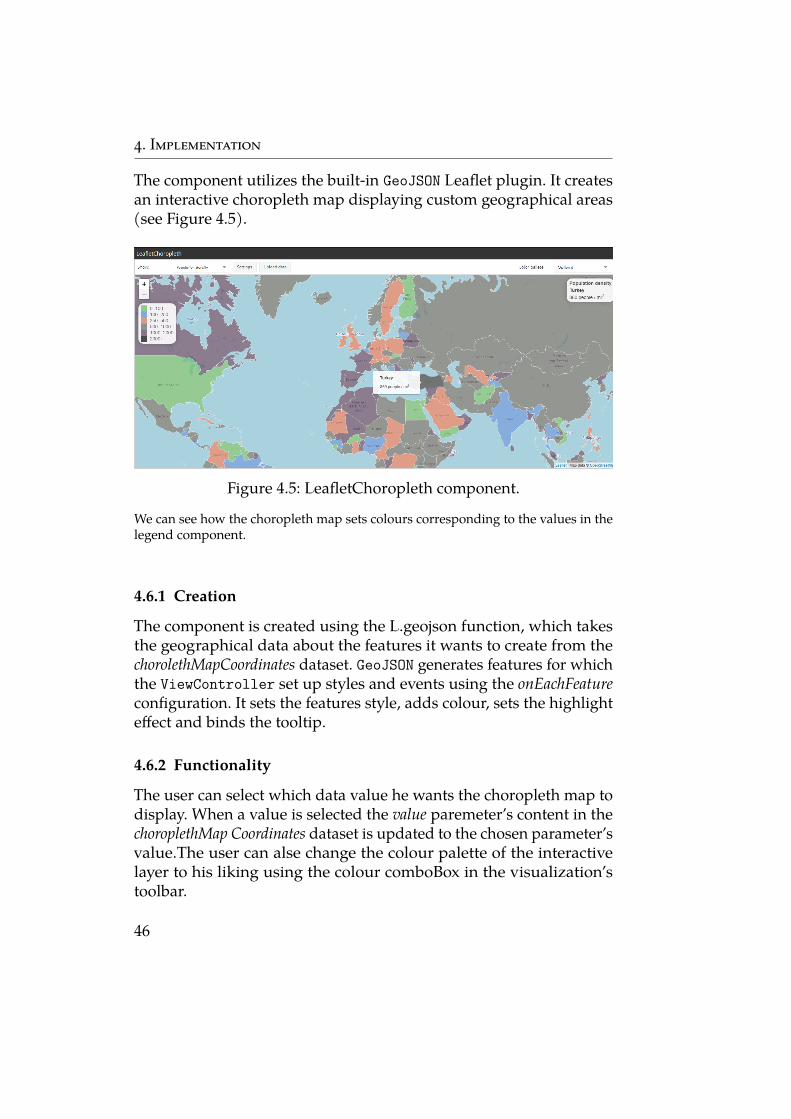
Every polygon and marker in the created datasets has a customname and value, which the user sets using the text and number fieldslocated in the visualization’s toolbar (see Figure 4.6).
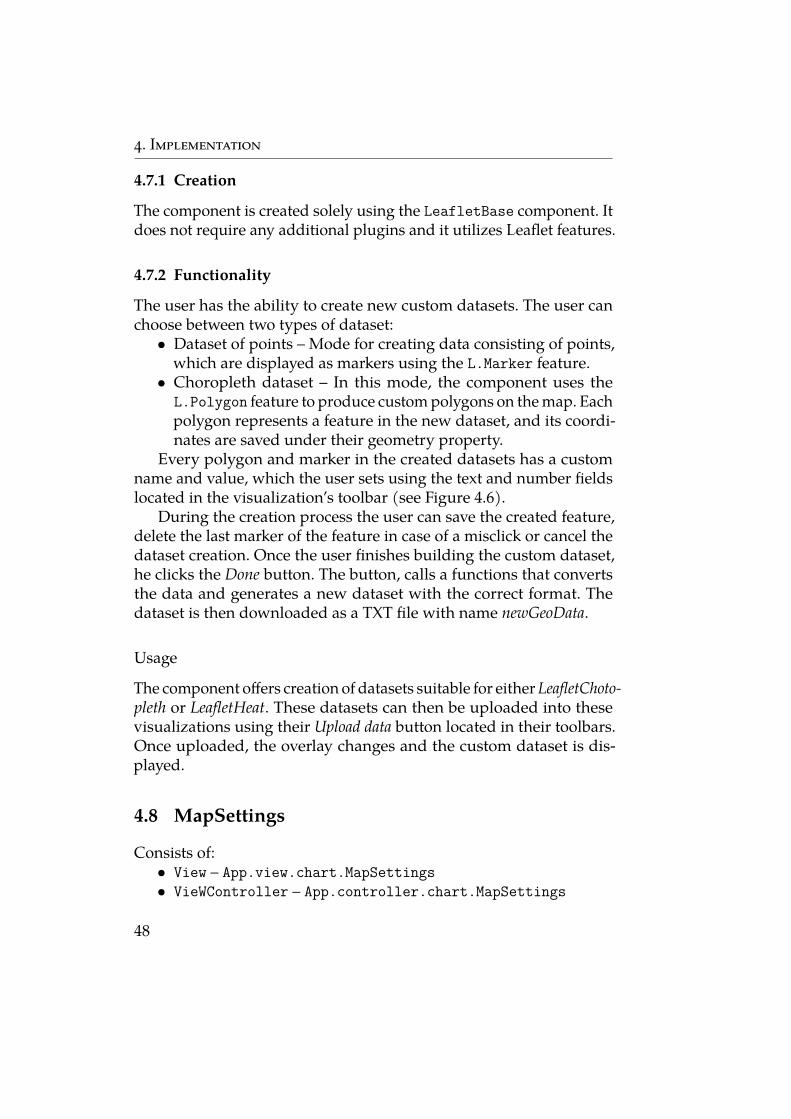
During the creation process the user can save the created feature,delete the last marker of the feature in case of a misclick or cancel thedataset creation. Once the user finishes building the custom dataset,he clicks the Done button. The button, calls a functions that convertsthe data and generates a new dataset with the correct format. Thedataset is then downloaded as a TXT file with name newGeoData.
UsageThe component offers creation of datasets suitable for either LeafletChoto-pleth or LeafletHeat. These datasets can then be uploaded into thesevisualizations using their Upload data button located in their toolbars.Once uploaded, the overlay changes and the custom dataset is dis-played.
4.8 MapSettings
Consists of:• View – App.view.chart.MapSettings• VieWController – App.controller.chart.MapSettings
48
4. Implementation
Figure 4.6: GeoDataCreator component.Displayed is the process of creating a dataset of polygons. One polygon is alreadysaved and displayed with a popup, the other one is being created usind polylinesand markers.
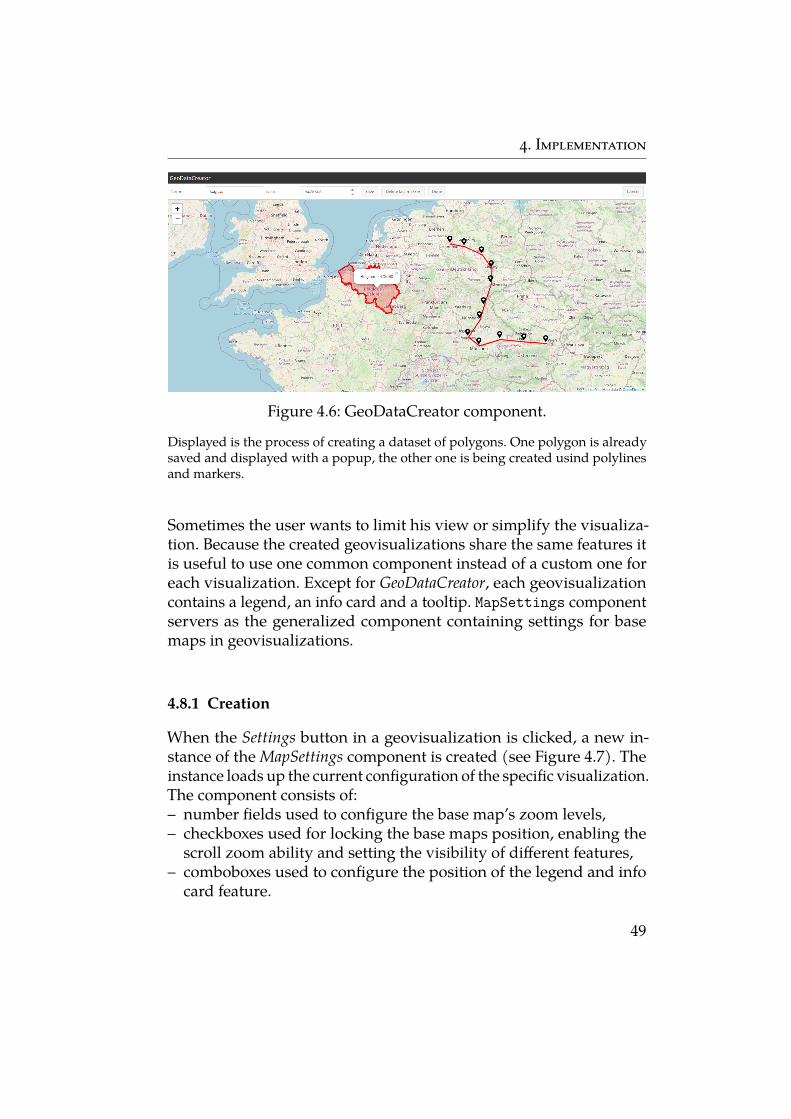
Sometimes the user wants to limit his view or simplify the visualiza-tion. Because the created geovisualizations share the same features itis useful to use one common component instead of a custom one foreach visualization. Except for GeoDataCreator, each geovisualizationcontains a legend, an info card and a tooltip. MapSettings componentservers as the generalized component containing settings for basemaps in geovisualizations.
4.8.1 Creation
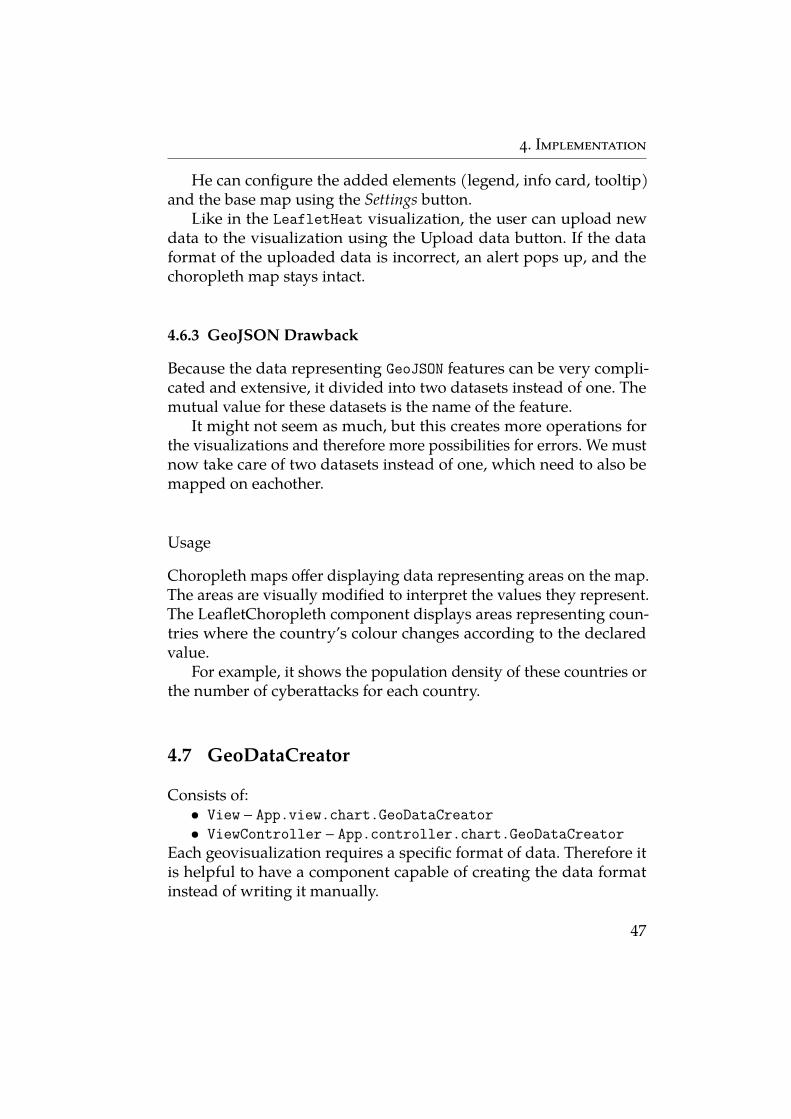
When the Settings button in a geovisualization is clicked, a new in-stance of theMapSettings component is created (see Figure 4.7). Theinstance loads up the current configuration of the specific visualization.The component consists of:– number fields used to configure the base map’s zoom levels,– checkboxes used for locking the base maps position, enabling the
scroll zoom ability and setting the visibility of different features,– comboboxes used to configure the position of the legend and info
card feature.
49
4. Implementation
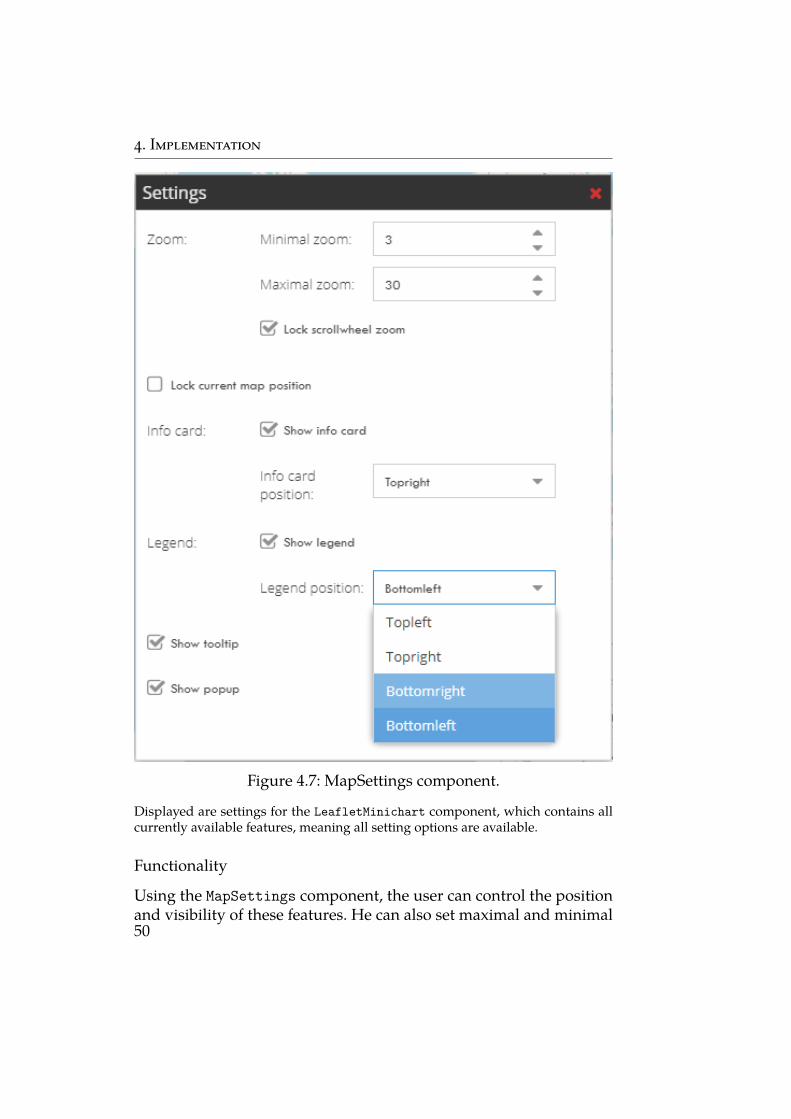
Figure 4.7: MapSettings component.Displayed are settings for the LeafletMinichart component, which contains allcurrently available features, meaning all setting options are available.
FunctionalityUsing the MapSettings component, the user can control the positionand visibility of these features. He can also set maximal and minimal50
4. Implementation
zoom level, lock the current maps position and zoom and enable/dis-able the scroll zoom ability of the base map. The user sets the desiredsettings and once the component is closed the base map reconfiguredaccordingly.
Settings not available in the specific visualization are disabled inthe instance. For example, the MapSettings instance for the Leaflet-Minichart component offers a popup setting, unlike other componentswhere the setting is disabled.
51

5 Leaflet and ExtJS Compatibility
Leaflet and ExtJS have proven to be very compatible. ExtJS does notrestrict access to the Leaflet map and features. It also does not restrictLeaflet’s access to its components. This way, we can work with Leafletas a separate framework and do not have to worry about errors.
One area where the Leaflet and ExtJS framework clash is the lay-ering system. As mentioned previously, Leaflet uses map layers thatstack on top of each other. ExtJS uses the z-index. Every time a newcomponent is added to an ExtJS dashboard, the components z-index isautomatically set. This also applies to Leaflet components. Therefore,an offset is required for these components or select a specific z-index.
Other restrictions can arise by addding the Leaflet plugins. It canoccur if the plugin contains a setting clashing with ExtJS. However,if it is something ExtJS does not know and at the same time does notaffect it, ExtJS lets it go and ignores it. Meaning that Leaflet and itsplugins can still work correctly.
The geovisualizations created in this thesis can be upgraded bysetting up new events, adding extra components or plugins. Eventhough, Leaflet does not have official support from ExtJS, we canassume that the possibilities for upgrades exist and are achievable.
53

6 Conclusion
In this work, we presented the process of creating new visualizationsfor dashboards using the ExtJS framework. The results of this bachelorthesis are new custom open-source geovisualization and complex 2DExtJS components.
We explained what dashboards are, their importance and applica-tion areas depending on their type.
Next, we introduced technologies used in the implementation partof the thesis. Namely a JavaScript framework ExtJS and the geovisual-ization framework Leaflet.js.
Then we describe a new TreeMap visualization component andfour geovisualization components that are the practical results of thisthesis. We go through all created components, explain how were theybuilt, how they work, and what is their practical usage.
Finally, we discuss the compatibility between ExtJS and Leaflet.js.We talk about the restrictions they set for each other and the possibleupgrades to the geovisualizations.
6.1 Future Work
Based on the results of the thesis, we propose additional potentialupgrades. The created visualizations are open-source and offer a lot ofspace for further development. For example, a new feature that wouldswitch between these visualizations in the same dashboard couldbe added. Another example would be upgrading the MapSettingscomponent to utilize more of the base maps configuration.
New components can be built based on these visualizations. Moreuseful plugins could be implemented and create new features or im-prove the already designed visualizations. We have created a basecomponent, which allows new geovisualization to be built.
In the future, the results of this thesis can be improved by testingthem in the real environment. Based on these results, we could recon-figure the visualizations or specify their outputs to better fit their newuse cases.
55

Bibliography
1. FEW, Stephen. Dashboard Confusion [online]. [N.d.] [visitedon 2004-03-20]. Available from: https://www.perceptualedge.com/articles/ie/dashboard_confusion.pdf.
2. VIKIVECTOR/ISTOCK, Getty Images. Example of a car dashboard.2016. Available also from: https : / / www . mentalfloss . com /article/63747/meanings-behind-these-15-symbols-your-cars-dashboard. [Online; accessed April 30, 2021].
3. Business Intelligence (BI) [online]. Oracle [visited on 2021-05-23]. Available from: https://www.oracle.com/cz/business-analytics/business-intelligence/.
4. DURCEVIC, Sandra. Example of a data dashboard. 2020. Availablealso from: https://www.datapine.com/blog/wp- content/uploads/2018/10/sales-performance-dashboard.png. [On-line; accessed April 30, 2021].
5. FEW, Stephen. Information Dashboard Design: The Effective VisualCommunication of Data. 1st ed. Italy: O’Reilly Media, 2006. isbn0-596-10016-7.
6. ROBERT S. KAPLAN, David P. Norton. The Balanced Score-card: Measures that Drive Performance. [N.d.]. Available alsofrom: https://hbr.org/1992/01/the-balanced-scorecard-measures-that-drive-performance-2.
7. SEGAL, Troy. Enron Scandal: The Fall of a Wall Street Darling.[N.d.]. Available also from: https://www.investopedia.com/updates/enron-scandal-summary/.
8. DURCEVIC, Sandra.CMO strategic dashboard. 2020. Available alsofrom: https://www.datapine.com/blog/wp-content/uploads/2019/06/cmo- marketing- dashboard.png. [Online; accessedApril 27, 2021].
9. DURCEVIC, Sandra.Customer Service TeamDashboard. 2020. Avail-able also from: https://www.datapine.com/blog/wp-content/uploads/2019/09/operational-dashboard-customer-service.png. [Online; accessed April 27, 2021].
57
BIBLIOGRAPHY10. DURCEVIC, Sandra. Financial Performance Dashboard. 2020. Avail-
able also from: https://www.datapine.com/blog/wp-content/uploads / 2018 / 10 / analytical - financial - dashboard . png.[Online; accessed April 27, 2021].
11. DURCEVIC, Sandra. IT ProjectManagementDashboard. 2020. Avail-able also from: https://www.datapine.com/blog/wp-content/uploads/2018/10/tactical-IT-dashboard.png. [Online; ac-cessed April 27, 2021].
12. DURCEVIC, Sandra. Comparison of dashboard types. 2020. Avail-able also from: https://www.datapine.com/blog/wp-content/uploads/2018/10/comparison-of-dashboards.png. [Online;accessed April 27, 2021].
13. SENCHA. Example of a data table. 2014. Available also from: https://examples.sencha.com/extjs/5.0.0/examples/kitchensink/?charts=true#scatter-basic. [Online; accessed May 8, 2021].
14. SENCHA. Example of a column chart. 2012. Available also from:https : / / docs . sencha . com / extjs / 4 . 2 . 5 / extjs - build /examples/build/ChartsKitchenSink/. [Online; accessed May8, 2021].
15. SENCHA.Example of a line graph. 2014. Available also from: https://examples.sencha.com/extjs/5.0.0/examples/kitchensink/?charts=true. [Online; accessed May 8, 2021].
16. SENCHA. D3 integration in ExtJS. [N.d.]. Available also from:https : / / examples . sencha . com / extjs / 7 . 0 . 0 / examples /kitchensink/#d3. [Online; accessed May 17, 2021].
17. CZECH REPUBLIC, Ministry of Health. Example of a map visual-ization - covid cases in Czech Republic. 2021. Available also from:https://onemocneni-aktualne.mzcr.cz/covid-19. [Online;accessed May 8, 2021].
18. SIWICKI, Bill. A CIO guide to building a dashboard for cyber-security: KPIs, metrics and other must-haves hospitals shouldtrack continuously to protect medical and patient data. [Online].[N.d.] [visited on 2018-10-23]. Available from: https://www.healthcareitnews.com/news/cio-guide-building-dashboard-cybersecurity.
58
BIBLIOGRAPHY19. BARNARD-WILLS, David; PORTES, Silvia; MARINOS, Louis.
Threat Landscape and Good Practice Guide for Smart Home and Con-verged Media. Athenes, Greece: ENISA, 2015. isbn 978-92-9204-096-3.
20. FOREMAN, Park. Vulnerability Management. 1st ed. New York:Taylor & Francis Group, 2009. isbn 978-1-4398-0150-5.
21. ISO/IEC 20000-1: Service Management System (SMS) Standard[online]. ISO/IEC, 2018-09 [visited on 2018-09]. Available from:https://www.iso.org/standard/70636.html.
22. SOLARWINDS. Security EventManager. 2021. Available also from:https://www.solarwinds.com/-/media/solarwinds/swdcv2/licensed-products/security-event-manager/images/product-screenshots/sem-dashboard.ashx?rev=12a813eaa74e4cb59ca797b5487a4314.[Online; accessed May 3, 2021].
23. Jack Slocum [online]. Brno [visited on 2021-05-16]. Available from:https://github.com/jackslocum.
24. jQTouch [online]. Brno: jQTouch [visited on 2021-05-17]. Avail-able from: http://www.jqtouch.com/.
25. RaphaelJS [online]. Brno: RaphaelJS [visited on 2021-05-16]. Avail-able from: http://raphaeljs.com/.
26. Sencha [online]. Brno: Sencha [visited on 2021-05-17]. Availablefrom: https://www.sencha.com/.
27. Sencha product pricing [online]. Snina: Sencha, 2021-05-22 [visitedon 2021-05-22]. Available from: https : / / www . sencha . com /store/extjs/#perpetual.
28. SENCHA. Making Sense of Application Architecture Choices.[N.d.]. Available also from: http://cdn.sencha.com/whitepaper/Whitepaper-MVVM-MVC.pdf?mkt_.
29. Ext.Map [online]. Brno: Sencha [visited on 2021-05-17]. Availablefrom: https://docs.sencha.com/extjs/6.0.2/modern/Ext.Map.html.
30. CloudMade [online]. Brno: CloudMade [visited on 2021-05-17].Available from: https://cloudmade.com/.
59
BIBLIOGRAPHY31. Vladimir Agafonkin [online]. Brno: Vladimir Agafonkin [visited
on 2021-05-17]. Available from: https://agafonkin.com/.32. heatmap.js [online]. Brno: HeatmapJS [visited on 2021-05-17].
Available from: https://github.com/pa7/heatmap.js/tree/develop.
33. RFC 7946 [online]. Brno: Internet Engineering Task Force (IETF),2016 [visited on 2021-05-17]. Available from: https://datatracker.ietf.org/doc/html/rfc7946.
34. Clément Bataille [online]. Brno: Clément Bataille [visited on 2021-05-17]. Available from: https : / / github . com / clementbat /clementbataille.me.
35. Kevin Kazmierczak [online]. Kevin Kazmierczak, 2021 [visited on2021-05-22]. Available from: https://github.com/kazmiekr.
36. Jürg Hunziker [online]. Jürg Hunziker, 2021 [visited on 2021-05-22]. Available from: https://github.com/tschortsch.
37. Ext.ux.LeafletMapView [online]. Kevin Kazmierczak, 2013-07-04[visited on 2021-05-22]. Available from: https://github.com/kazmiekr/Ext.ux.LeafletMapView.
38. Ext.ux.LeafletMap [online]. Jürg Hunziker, 2013-11-19 [visited on2021-05-22]. Available from: https://github.com/tschortsch/Ext.ux.LeafletMap.
60

A Electronic Attachments
The thesis archive in IS MU contains also a ZIP file that includes:
• The public folder containing the implementation and the geoDatafolder with datasets for each dashboard.
• README.md file with instructions on launching the application.
61
Related Documents