DAPNIA-04-89 04/2004 Wavelets and curvelets in denoising and pattern detection tasks crucial for homeland security. B. Afeyan, K. Won, S. Bisson, J .L. Starck Talk given at the SPIE Defense ofSecurity (Conference on Independent Component Analyses, Wavelets, Unsupervised Smart Sensors Neural Networks II), Orlando (U.S.A.), February 12-16, 2004 Departement d' Astrophysique, de Physique des Particules, de Physique Nucleaire et de I'lnstrumentation Associee DSM/DAPNIA, CEA/Saclay F - 91191 Gif-sur- Yvette Cedex Tel: (1)69082402 Fax: (1) 69 08 99 89 http://www-dapnia.cea.fr

Welcome message from author
This document is posted to help you gain knowledge. Please leave a comment to let me know what you think about it! Share it to your friends and learn new things together.
Transcript
DAPNIA-04-89 042004
Wavelets and curvelets in denoising and pattern detection tasks crucial for homeland security
B Afeyan K Won S Bisson JL Starck
Talk given at the SPIE Defense ofSecurity (Conference on Independent Component Analyses Wavelets Unsupervised Smart Sensors Neural Networks II) Orlando (USA) February 12-16 2004
Departement dAstrophysique de Physique des Particules de Physique Nucleaire et de Ilnstrumentation Associee
DSMDAPNIA CEASaclay F - 91191 Gif-sur- Yvette Cedex Tel (1)69082402 Fax (1) 69 08 99 89
httpwww-dapniaceafr
Wavelets and curvelets in denoising and pattern detection tasks crucial for homeland security
Bedros Afeyana K Wona S Bissonb and J L StarckC
aPolymath Research Inc Pleasanton CA 94566
bSandia National Laboratories Livermore CA 94551
CCentre d Etude de Saclay CEA Gif-sur-Yvette Cedex France
ABSTRACT
The design and successful fielding of sensors and detectors vital for homeland security can benefit greatly by the use of advanced signal and image processing techniques The intent is to extract as much reliable information as possible despite noisy and hostile environments where the signals and images are gathered In addition the ability to perform fast arialysis and response necessitate significant compression of the raw data so that they may be efficiently transmitted remotely accumulated from different sources and processed Proper decompositions into compact representations allow fast pattern detection and pattern matching in real time in situ or otherwise Wavelets for signals and curvelets for images or hyperspectral data promise to be of paramount utility in the implementation of these goals Together with statistical modeling and iterative thresholding techniques wavelets curvelets and multiresolution analysis can alleviate the severity of the requirements which todays hardware designs can not meet in order to measure trace levels of toxins and hazardous substances Photonic or electroshyoptic sensor and detector designs of the future for example must take into account the end game strategies made available by advanced signal and image processing techniques The promise is the successful operation at lower signal to noise ratios with less data mass and with deeper statistical inferences made possible than with boxcar or running averaging techniques (low pass filtering) much too commonly used to deal with noisy data at present SPREE diagrams (spectroscopic peak reconstruction error estimation) are introduced in this paper to facilitate the decision of which wavelet filter and which denoising scheme to use with a given noisy data set
Keywords wavelets curvelets multiresolution analysis noise modeling denoising pattern detection undecishymated iterative wavelet transforms SPREE diagrams
1 INTRODUCTION
For the better part of the past fifteen years multi resolution analysis which is the simultaneous study of signals on successively finer scales and on a sequence of time intervals found one of its most fruitful realizations in discrete wavelet transforms Following the pioneering work of Mallat Meyer Daubeschies Coifman Wickerhauser ~
Vetterli Donoho and many othersI-8 a veritable explosion of publications and applications came to the fore extending all the way from the currently used JPEG 2000 standard in image coding and compression to the next generation video compression standard MPEG-4 to the FBIs finger print file storage and compression to biomedical signal and image processing all the way to the efficient mathematical characterization of fractals fractional Brownian motion and Fourier integral operators and their microlocal asymptotics An early popular exposition with references to the early history of the field can be found in the IEEE Signal Processing Magazine9
An interesting and peculiar feature of this field is that rigorous mathematics adopted from the fields of nonlinear approximation theory and harmonic analysis has flourished drawn inspiration from and suggested improvements in very applied fields such as signal or image processing and digital filter design In fact it is possible to imagine and invent new filters new functions new algorithms and new phase space tiling techniques1o-16 starting from very many seemingly different directions and ending up with remarkably similar results Neither a physicists intuitive methods nor a mathematicians rigorous approach nor a practical engineers tool bag alone seem to give anyone the edge In fact mtch has been repeatedly reinvented even in this relatively short span of time where
Correspondence can be sent to bedrospolymath-usacom
the concepts of wavelets vaguelettes Coifiets Duablets ridgelets edgelets bandlets contouriets beamlets wedgelets chirplets curvelets and all the rest were proposed justified spun used and respun in very many directions such as statistical estimation11-20 denoising21-23 pattern detection24-27 and data compression28-3o to name a few
Some biases do seem to persist however among the various constituents of this field which are mutually incompatible For instance it is maintained usually by those who pursue asymptotic results in the large number of wavelet coefficients kept limit that one wavelet family is as good as another Or it is held that orthogonal decompositions can do as good a job as anything else so why bother with undecimated (translationaly invariant) or overcomplete redundant representations It is not difficult to show that these are not correct views One size does not fit all and various requirements depending on the goals of the particular exercise (denoising data compression pattern detection etc) are often mutually incompatible and thus best served by different filters and different procedures or algorithms altogether A counter position to this has been to advocate that ever expanding libraries of filters and functions should be amassed with which to obtain multiple redundant decompositions and adopting a criterion such as best basis or matching pursuit or basis pursuit or minimum entropy or total variation diminishingS7 to isolate and choose the optimum (hopefully small) set of coefficients from within the elements of this library of libraries in order to adapt ideally to a given signal This may well be prone to inefficiencies in implementation or stalled convergence or be unstable and hae unpredictable behavior The truth may lie somewhere in between these two extreme positions and require splid statistical theoretical backing31-37 before it filters down and becomes convincing to the enthusiastic yet unsuspecting users of the bewildering variety of tools and methods that are in circulation today
The events since 9-11 have caused a sea change in the efforts and concentration that are being devoted to the detection interception and neutralization of harmful substances in public settings Whether it is the needs of the military in hot zones or large crowds of civilians potentially targeted by terrorists the objective of quickly identifying chemical biological or radiological compounds in trace amounts has become of vital importance38-42 The needle in a haystack quality of these tasks encourages the pursuit of technologies that can enhance the signal to noise ratio of a given measurement can detect patterns with high probability of success with controlled incidences of false positive readings3637 can be a platform for efficient multiple sensor information fusion and where automatic target recognition and rapid data transmission can be implemented Sensors and detectors that have such advanced front end dedicated signal processing elements are necessary for the success of the massive endeavors being undertaken to protect ports large urban congregation centers sensitive public installations and the military Especially useful in this regard are remote sensing techniques which rely on electromagnetic radiation (from gamma rays to radio waves) Coherent laser based techniques seem very promising in this arena as well43-45 The need then is to denoise typical spectra that arise from measuremeqts such as the absorption spectra of air borne chemicals in the presence of much larger concentration levels of water vapor nitrogen methane and other common gases Denoising spectra that arise from analytical chemistry or astrophysical data using wavelets has been tried in the past4647 The systematic study of denoising schemes involving iterative algorithms which preserve all large peaks the seamless extension to GC (gas chromatography) and GCMS or LCMS (gas or liquid chromatography mass spectrometry) data48-sO and the incorporation of a set of statistical methods and mulitresolution tools deploying wavelets and curvelets51- S4 which can treat signals images and hyperspectral data for specific sensor adapted performance optimization is an endeavor which we hope will bear fruit
In this paper we show the relative merits of denoising synthetic infrared spectroscopic data made up of Toluene methyl ethyl key tone (MEK) isoprepylacetate (IPA) formaldehyde (H2CO) and water (H20) in the wavelength range 2910 nm to 3050nm to which Gaussian noise with a mean of zero and standard deviations corresponding to signal to noise ratios of 9 and 6 We chose these u values because they correspond to the rule 3u = N x Apeak where Apeak 04 below and N 33 and 50 We compared four different wavelet filters (Haar Daubechies 4278 Antonini 79 biorthogonal28 and the translationally invariant or the undecimated highly redundant version of same (see the article by Donoho and Coifman17 for details on cycle spinning and the it trous algorithm823 which is a fast implementation of the same idea) We also compared the effects of different noise estimates assuming that the signal and noise are separated at the 3u to the 50 level in wavelet coefficient space When we added the Van Cittert iteration schemeS in order to preserve the energy in the largest features we found very good fidelity in the reconstruction of the spectroscopic peak heights
We will also show the relative merits of these same biorthogonal wavelet filters and iterative denoising schemes in 2D and compare their performance with that of curvelets with proper noise modeling (comparing 30- to 50-) including two cases where intentional incorrect assumptions are made concerning the type of noise This image is not synthetic however and the noise is not Gaussian nor of any other well known variety It comes from x-ray imaging on film of laser driven cylindrical hydrodynamical mixing experiments conducted by Los Alamos 5556
This particular image was chosen to compare denoising techniques since it has very many edges in various stages of deformation and merging embedded in noisy inner and outer disks It is the determination of the actual sizes and shapes of these petals that is of vital interest in order to assess the hydrodynamic mixing processes
2 DENOISING SPECTROSCOPIC DATA
We can demonstrate the reh=ltive merits and pitfalls of various wavelet filters and hard thresholding as a means to denoise a signal by looking at theoretical or clean spectra of a number of hazardous chemicals to which significant levels (33 and 50) of noise are added This is shown in Fig 1 where the clean and noisy signals are plotted as well as the denoising that is achieved using the undecimated wavelet transform using the Antonini 79 biorthogonal filter with a 40- noise level estimator and a Van Cittert largest peak preserving iterative schemes
This is necessary when using redundant transforms which would not conserve energy otherwise Figure 2 shows the same with the decimated version of the previous figure as well as by the use of the orthogonal transforms Haar and Daub4 Clearly the undecimated case is superior This is explored further by showing 9 successive spectral band decompositions in Figures 3 and 4 These figures show blow ups of our best denoised vs clean signal plots for 33 and 50 Gaussian additive white noise Almost all the peaks are very well reproduced with some small ones missed and mistaken for noise To better gauge the performance of various filters and compare various options we propose a new diagnostic for spectroscopic data called Spectroscopic Peak Reconstruction Error Evaluation (SPREE) diagrams which are plotted in the next two figures SPREE diagrams allow one to ascertain quickly to what extent peak heights in a spiky signal (IR UV X ray GC GCMS etc) are faithfully reproduced by some denoising scheme how many false positives are generated and how many false negatives It is a way to compare two llifferent reconstructions or in the case of synthetic data the original clean signal to reconstructions of its noisy versions The advantage of SPREE is that it shows just how well peaks are being reproduced (by plotting the relative amplitude of the reconstruction of the original) without any regard to location in wavelength lGstead the issue of reconstruction fidelity is mapped onto the question of proximity to the 45 degree line in a SPREE diagram Also false positives of a certain size are countable on the right edge of the plot while false negatives again distinguished by the sizes of peaks missed are displayed on the top of the plot The former correspond to zeros in the signal (plotted from 1 to 0) and the latter correspond to zeros in the reconstructed signal (also plotted from 1 to 0) The descending order in the axes makes sure that the false detections and misses are not plotted on the x and y axes but on the opposite edges of the plots for clarity Clearly the analysis of SPREE diagrams can be automated and criteria imposed such as the adoption of the most successful candidate in a search through noise modeling algorithms (which have adjustable parameters) and different filter families
3 DENOISING IMAGES WITH PRONOUNCED CURVED EDGES
The cylmix x ray image was denoised using decimated and un decimated versions of the 79 filter with iterative hard thresholding with two ways of estimating the noise level as being unspecified but stationary These can be seen in the first two rows of Fig 7 The next row contains curvelet analysis with the proper model for the noise while the last row shows results from intentional misguided assumptions for the noise to show just how sensitive the mechanism of denoising is to having a good noise model This simply allows us to restate that the proper noise model and good filters can do very impressive denoising together as the third row in Fig 7 shows clearly The iterative technique which preserves the large peaks in the image is necessary for all redundant representations or else overall energy conservation will be lost
Our next step will be to incorporate stronger false positive detection rejection methods by incorporating 37adaptive thresholding on various levels of the multiresolution analysis34- These false detection rate (FDR)
reduction techniques can further enhance the rather impressive performance of 79 Antonini undecimated itershyative multiresolution based qenoising we deployed in this paper on a noisy spectroscopic signal and an image of
hydrodynamic mixing We will also look at more systematic scans of synthetic as well as laboratory data and marry these tools with supervised machine learning algorithms such as neural networls2657
f
ACKNOWLEDGMENTS
We thank Matt Balkey of LANL for providing the cylindrical mix x-ray film image in order to allow us to test our denoising tools We also thank David Donoho Emmanuel Candes and Bruno Torresani for insightful comments suggestions and encouragment This work was partially supported by a DOE SBIR Phase II grant DE-FG03-01ER83294 as well as by Sandia National Laboratories
REFERENCES 1 S Jaffard Y Meyer and R Ryan Wavelets tools for science and technology SIAM Philadelphia PA 2001 2 L Daubechies Ten lectures on wavelets SIAM Philadelphia PA 1992 3 I Daubechies Editor Different perspectives on wavelets AMS Providence RI 1993 4 J Benedetto and M Frazier Editors Wavelets mathematics and applications CRC Press Boca Raton FL
1994 5 M Wickerhauser Adapted wavelet analysis from theory to software A K Peters Wellesley MA 1994 6 C Chui Wavelets A mathematical tool for signal analysis SIAM Philadelphia PA 1997 7 S Mallat A wavelet tour of signal processing second edition Academic Press NY 1999 8 J L Starck and F Murtagh Astronomical image and data analysis Springer Verlag NY 2002 9 O Rioul and M Vetterli Wavelets and signal processing IEEE Signal Proc Mag Oct 14-38 1991 10 L Cohen Time-frequency analysis Prentice Hall NJ 1995 11 B Boashash E Powers and A Zoubir Higher order statistical signal processing Wiley NY 1995 12 S Qian Joint time-frequency analysis Prentice Hall NJ 1996 13 R Carmona W Huang and B Torrresani Practical time-frequency analysis Academic Press San Diego
CA1998 14 P Flandrin Time-frequencytime-scale analysis Academic Press San Diego CA 1999 15 S Qian Time-frequency and wavelet transforms Prentice Hall NJ 2002 16 L Debnath Wavelets and signal processing Berkhauser Boston MA 2003 17 A Antoniadis and G Oppenheim eds Wavelets and statistics Springer Verlag NY 1995 18 W HardIe G Kerkyacharian D Picard and A Tsybakov Wavelets approximfpoundtion and statistical applishy
cations Springer Verlag NY 1998 19 B Vidakovic Statistical modeling by wavelets John Wiley amp sons NY 1999 20 D Percival and A Walden Wavelet methods for time series analysis Cambridge University Press 2000 21 M Jansen Noise reduction by wavelet thresholding Springer Verlag NY 2001 22 S G Chang B Yues and M Vetterli Spatially adaptive wavelet thresholding with context modeling for ~
image denoising IEEE Trans Image proc 9 1522-1546 2000 23 M Shensa The discrete wavelet transform wedding the a trous and Mallat algorithms IEEE Trans Signal
Proc 40 2464-2482 1992 24 C Chen Ed Information processing for remote sensing World Scientific Singapore 1999 25 A Petrosian and F Meyer editors Wavelets in signal and image analysis Kluwer Academic Netherlands
2001 26 M Thouillard Wavelets in soft computing World Scientific Singapore 2001 27 A Chan and C Peng Wavelets for sensing technologies Artech House Boston 2003 28 M Antonini et al Image coding using wavelet transform IEEE Trans Image Proc 1 205-220 1992 29 P Topiwala ed Wavelet image and video compression Kluwer Academic Netherlands 1998 30 K Egiazarian et aI Adaptive denoising and lossy compression of images in transform domain J Elecshy
tronic Imaging 8 233-245 1999 31 D Donoho Nonlinear wavelet methods for recovery of signals densities and spectra from indirect and noisy
data Proc Symposia Appl Math 41 173-205 1993
32 Y Benjamini amp Y Hochberg Controlling the false discovery rate a practical and powerful approach to multiple testing J R Statist Soc B 57 289-300 1995
33 D Donoho Adapting to unknown smoothness via wavelet shrinkage J Amer Math Statist Assoc 90 1200-1224 1995
34 F Abramovich amp Y Benjamini Adaptive thresholding of wavelet coefficients Compo Stat amp Data Anal 22 351-361 1996
35 F Abramovich et al Wavelet thresholding via a Beysian approach J R Statist Soc B 60 729-745 1998
36 F Abramovich Y Benjamini D Donoho and I Johnstone Adapting to unknown sparsity by controlling the false discovery rate Technical Report Stanford University Statistics Department 2000
37 D Donoho and J Jin Higher criticism for heterogeneous mixtures Technical Report Stanford University Statistics Department 2002
38 L Hoffiand R Piffath and J Bouck Spectral signatures of chemical agents and simulants Optical Eng 24 982-984 1985
39 D Flanigan Detection of organic vapors with active and passive sensors a comparison Applied Optics 25 4253-4260 1986
40 T Krupa Optical technologies in the fight against bioterrorism Optics Photonics News February 23-26 2002
41 R Horvath et al Optical waveguide sensor for on-line monitoring of bacteria Optics Lett 28 1233-1235 2003
42 N Skivesen R Horvath and H Pedersen Multi mode reverse-symmetry waveguide sensor for broad-range refractometry Optics Lett 28 2473-2475 2003
43 K Aniolek et al Cavity ringdown laser absorption spectroscopy with a 1 kHz mid-infrared periodically poled lithium niobate optical parametric generatoroptical parametric amplifier Chem Phys Lett 302 555-562 1999
44 T Kulp et al The application of quasi-phase-matchedparametric light sources to practical infrared chemical sensing systems Appl Phys B 75 317-327 2002
45 S Bisson et al Long ave IR chemical sensing based on difference frequency generation in orientationshypatterned GaAs Proc SPIE 4634 78-82 2002
46 J L Starck R Siebenmorgen and R Gredel Spectral analysis using the wavelet transform Astrophysical Journal 482 1011-1020 1997
47 C Cai and P Harrington Different discrete wavelet transforms applied to denoising analytical data J Chem In Comput Sci 38 1161-1170 1998
48 H McNair and J Miller Basic Gas Chromatography John Wiley amp Sons New York 1998 49 R Grob ed Modem practice of gas chromatography third ed John Wiley amp Sons New York 1995 50 P James Ed Proteome research mass spectrometry Springer Verlag Berlin 2001 51 J L Starck E Candes and D Donoho The curvelet transform for image denoising IEEE Trans Image
Proc 11670-6842002 52 J L Starck D Donoho and E Candes Astronomical image representation by the curvelet transform
Astronomy amp Astrophysics 398 785-800 2003 53 E Candes and D Donoho New tight frames of curvelets and optimal representations of objects with
piecewise C2 singularities Comm Pure Appl Math LVII 219-266 2003 54 B Afeyan et al WavElets curvelets and multi resolution analysis in fast Z pinch research in Wavelets
Applications in signal and image processing X M Unser A Aldroubi and A Laine eds Proc SPIE 5207 740-750 2003
55 C Barnes et al Observation of mix in a compressible plasma in a convergent cylindrical geometry Phys Plasmas 9 4431-4434 2002
56 N Lanier et al Multmode seeded Richtmeyer-Meshkov mixing in a convergent compressible miscible plasma system Phys Plasmas 10 1816-1821 2003
57 F Murtagh J L Starck and O Renaud On neuro-wavelet modeling Decision Support Systems Journal in press 2003
z bullamp j
011 III
IiIIiI j 116 ~ e6 I7l~ +
J + II 11 e
J 011011 112 tl
I 11 I
bull lltnlt 29-0 2964 lYlUI lH6 JIIlII 304ft J04fI
Wavc)cDgth (nm) lVavelengtb (nm)
116
bullbull2
Lbull_J__bullbullbull__~__bullbull___Jbull_____~bull _ _ bullbull_bull__bull bullbull _ bullbull~bull _ bull I
Wavelength (11m) Wavelength (om)
VIlVtJengUI (nlUJ lVavelengtb (nm)
Figure 1 The spectroscopic signal and the signal plus 33 and 50 white Gaussian noise are shown in the first row The second row shows our best denoising results using undecimated wavelet transforms implemented with the a trous algorithm and a Van Cittert large peak preserving iterative scheme and 40 hard threshold The third row shows denoising without the iterative scheme
bullbullbull tIImiddotmiddotmiddotmiddot bullbull middot+ middotmiddot1middotmiddot 1 middot +- + +
2920 U4030211
Wavc1envth (om) Wavelengtb (DID)
6 6
~ u
~ 0bullbull
06It ~ ~
B- bullbull4 ~ 04
~ ~ 1 jIl i bull2 ~ ~
bull bull19M1 2980 3000 31110 3041
Wavelength (nm) ~VIIelenatll (Am)
66 i
fLa
zi 06 bull ~~
Bshy ~
bull ~~
0102
~z
VltveJeulllb (lUll) Vavelengtb (nm)
Figure 2 Three filters far less potent than the method adopted in the previous figure give the following results Haar Daub4 and the decimated Antonini 79 biorthogonal systems are used to denoise the 33 and the 50 noise added data used previously The results are full of false positives and false negatives almost everywhere These approaches are not recommended
-------------------_
__
Ii fj
I
~-~
v~JJ U
f j i
1 I u ubullj u
~ l- t u a-a-
a ~
i
bull 4li
~~
I ~ I
IIII 1 IUbull
191~ mM Ill lIn mt lOJ ~)1 ~ Itllti ltll _1t41III J bull Wavdfllllllll(lIml WanltlJlh(lIml
~ -shy
shy j tmiddotmiddotmiddot_middot shy ~~f J J ~
I I I
__1_L_ __ lMllm lt1J m
W-ekllath t-)
f
I Ii
_ middotmiddotmiddotmiddot middotmiddotmiddotmiddot-middotmiddot_middotT--middotmiddot middot -middot_middot-r-middotmiddotf Ij
I
~ middotmiddotmiddotmiddot+middotmiddot-+middotmiddotmiddot+middotmiddotmiddotmiddotI_middot+_middotmiddot~ _middot-I
I
u j J
u
amp Ishya-a ~a-a
~
I ~~
1 tl1bull bullbull I-
ItU otQI Iii JlU Jraquo
0bullbullbull ----_- u _----
H_middot __-__ ---
A i-raquoJ ~j Jllf ~--Jl-Jgt---cfJII----7~-)M--I-JNI7---_-----JI-41-lt5~middotbullJIll JlU JIll JIll HI JIll 11)1J bull
It I
Wanlnglll ()WnrltllamplIt(IIIII Wfltapl (ftnil
Figure 3 The performance of the undecimated Antonini wavelet system with Van Cittert iterative denoising on the spectroscopic data plus 33 Gaussian white noise is shown in 9 successive wavelength par-itions The (extremely rare) false positives (small and annoying) false negatives and detected peak height under and over shoots all very mild are apparent
J- shy
--
iij I - -------_
j U
104 i y
~bull1 tl
_____
t ----------f--------l-J lm BIt
I
Wamiddottkllll(IiIIl)
__ L___lL ~__ J
loU a ~ -Imiddot-middoti-jmiddot-+middotmiddot--middot-middotImiddotmiddot-middotmiddot-t-middotmiddotmiddot_+middotmiddotmiddot--+ ~ i
c
~ lnMI_l_~lt1JIn
fJ U
I
- shy -_ shy
a u
I
~------HII-Jf-I---Jf-12--M--U--II---JfI---1
--------r-----Ir-------
I oU fmiddot--+---+middot-middot --t-- -+--+--j--bull~
I
Ii U~U~~~jJJ~~ I
f Ir-~--r---r---~--~ ~ ~ oU ~++-++ii+- j I
IrJ u l-middotmiddotltmiddotimiddot-middotmiddot-middoti middot-+middot--middot--~middot-middotil--middot+middot --1
i ~
i~j Itl--2tII--1-L- -c1-Zt--JoI-U-1O-middot-Jt--Jl-_----Jt4Jm mWavtlectb (1II1l)
--_---
tv~ ---
~-J ~J W --_lt
f Ir-~~-r--r---~-r~ ~ I---+---f--+---+-middot--I-+---+------I
U iu ~bullI--~-J--i--
Wa-lIlh (11111)
_-shy
I l ~ -t ~L_~
rr I I ~ IOt10 MIl JUI IIlI MIJI
Wadllll (1l1II)
--shy
1 I ilI
1 I I
I i
Figure 4 The performance of the undecimated Antonini wavelet system with Van Cittert iterative denoising on the spectroscopic data plus 50 Gaussian white noise is shown in 9 successive wavelength partitions The (rare) false positives (numerous) false negatives and detected peak height (slight) under and over shoots are apparent
-H~ i
1)shy l j2 i U1 -I
I I J
u I J
u amp I a
III ~
) IIi
J ~
u ujmiddotmiddot middotmiddoti U U 11
nlalgtlt (lim) anlttlgtlt(lIm amellllll(lIm)
l l f
u U u i
bullu~ luJJ II u u ~ ul i ~
1ita J j IIJI
u
A
WanltnJllb (nm Wbullbulldmllth (nm) Wtaglh Bml
Figure 5 The degree to which the spectroscopic peaks are reproduced by Haar Daub4 or decimated Antonini biorthog- ~
onal 79 wavelet filters with a 40 noise threshold is captured by these SPREE diagrams False positives are vertically against the right edge while false negatives are horizontal along the top edge of the figure The first row shows denoising using 3 filters with 33 noise added to the signal The second row shows SPREE plots for additive 50 noise data Perfect reconstruction would have placed all the points along the 45deg diagonal with no clustering of points along the top and right edges of the plot area
u
u
bull
IU
IU
f bull
u tI
fbullfj I IU
I IU I
I j~ U j
4 aa ~ ~ ~ I~
II ~
Ii11 u
J U UU J U 111
Wanlcllllh(lIl11) WTIelICfl (lim) WaTdftampt1l (ml
) raquoL--- ___1__
11 -
ff f ii ju j It)~ j Itbull
j ll
u
l ~
I i ~ uis
) ~II
~
I I I
Wvknctb (lUll) Wavelcllll (am) WIII(lIm
Figure 6 The degree to which the spectroscopic peaks are reproduced by decimated and then undecimated biorthogonal
filtering with or without Van Cittert iteration to preserve significant peak heights is shown in these SPREE diagrams for 33 and 50 Gaussian white additive noise cases Our best results were achieved by the use of the iterative scheme and undecimated wavelets (last column) where there are very few false positives and the adherence to the 45deg fidelity diagonal is remarkable The false negatives are largely at small values which are not a detriment to the usefulness of the most effective denoising technique proposed in this paper
Shot303S1 Framo2a MADs
100 200 300 400 500
Figure 7 Denoising a cylindrical mix x-ray image from LANL Decimated (first row) and undecimated (second row) Antonini 79 biorthogonal wavelets as well as curvelets (third and fourth rows) are used The noise is estimated starting at 30 and 50 respectively in the second and third columns of the first three rows and assumed to be of an unspecified stationary variety In the last row MAD (median absolute deviation) and white Gaussian noise models (respectively) are used to show the effects of wrong noise model adoption with an otherwise good choice of filtCll The first column contains the raw noisy image (four times) The hard thresholding has been done with an iterative approach which attempts to preserve the energy in the image for the redundant transforms (in the second third and fourth rows) Our goal here is to identify the extent to which the fingers or petals are distorted merging and deforming in a series of time lapse images of which this is one Curvelets aHow this assessment far better than all wavelet based denoisng we have tried But with a wrong noise model (row four) even hard thresholding with curvelets produces artifacts and distortions which are not desirable
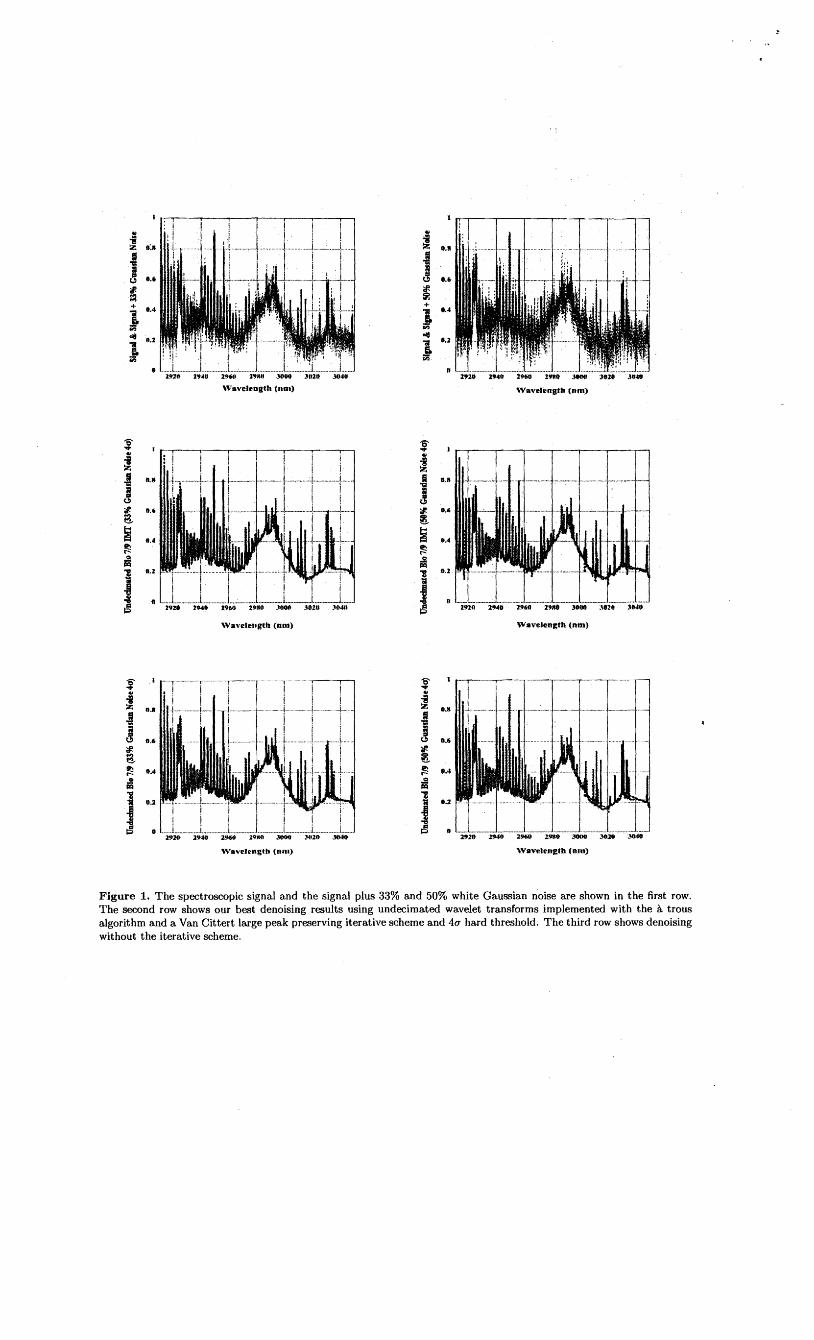
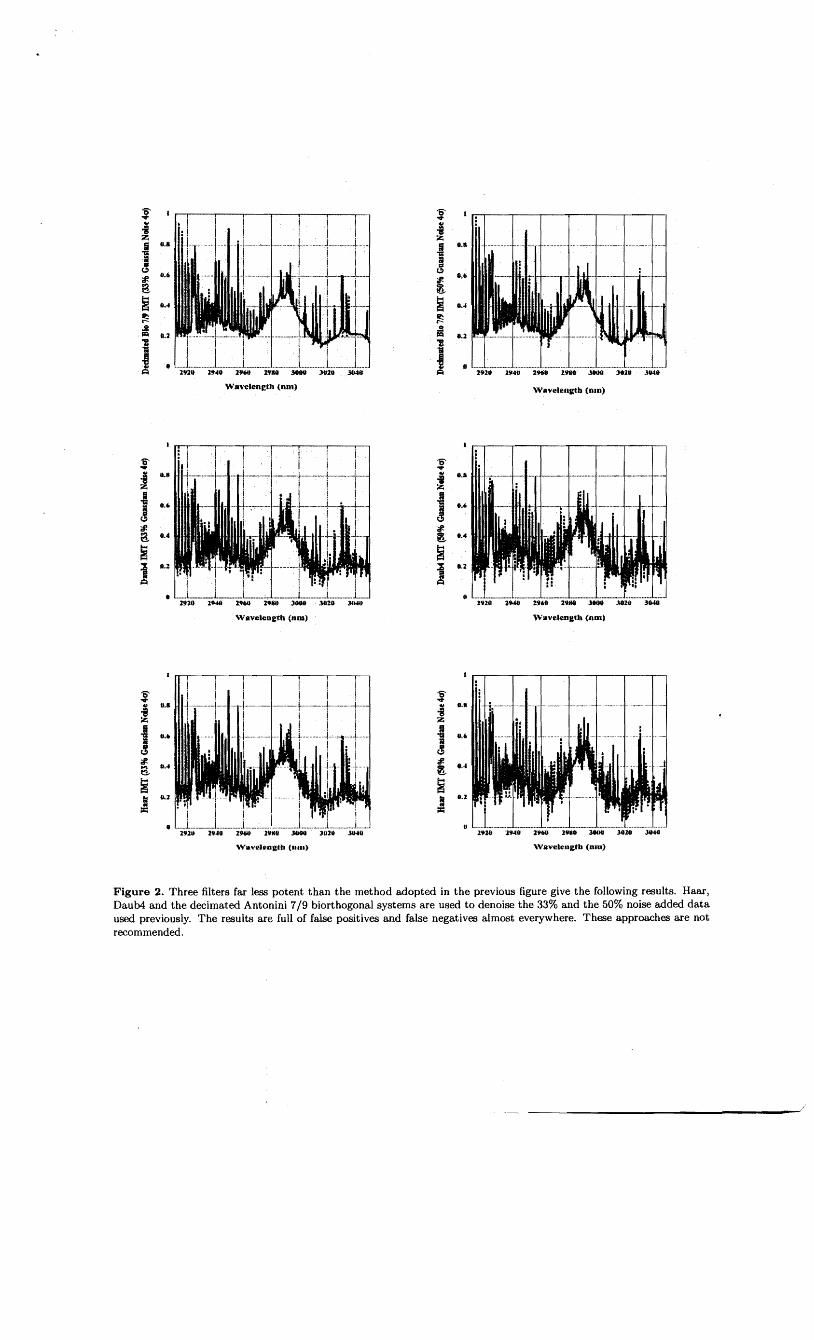
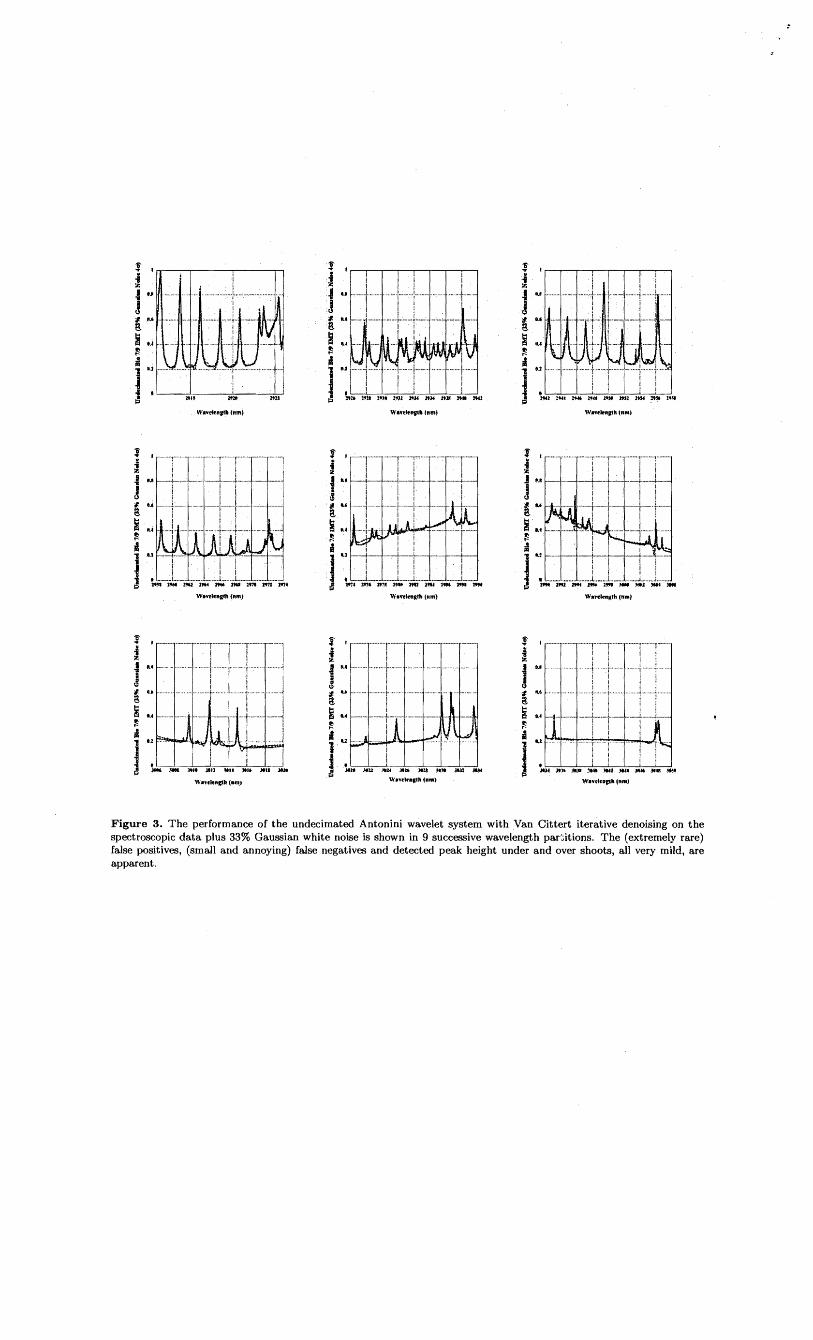
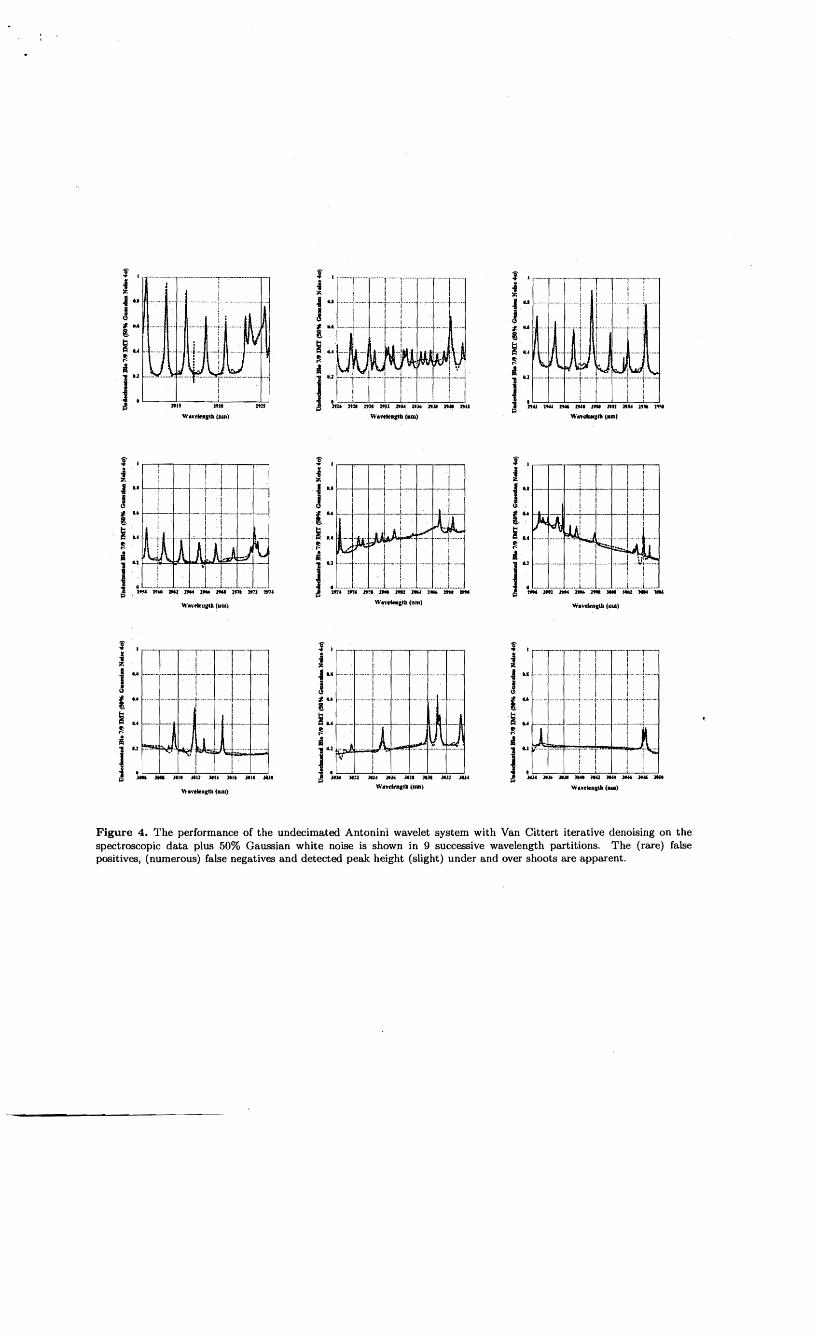
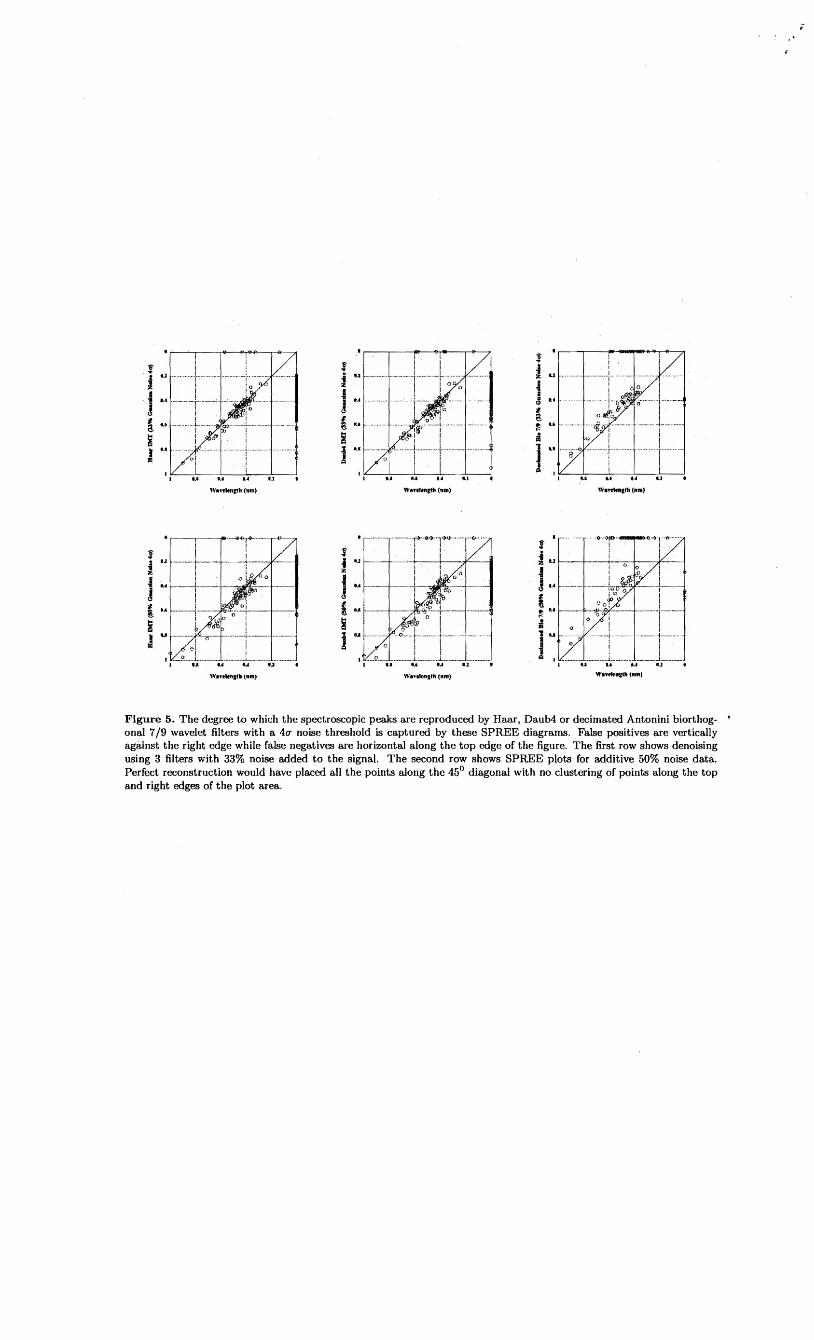
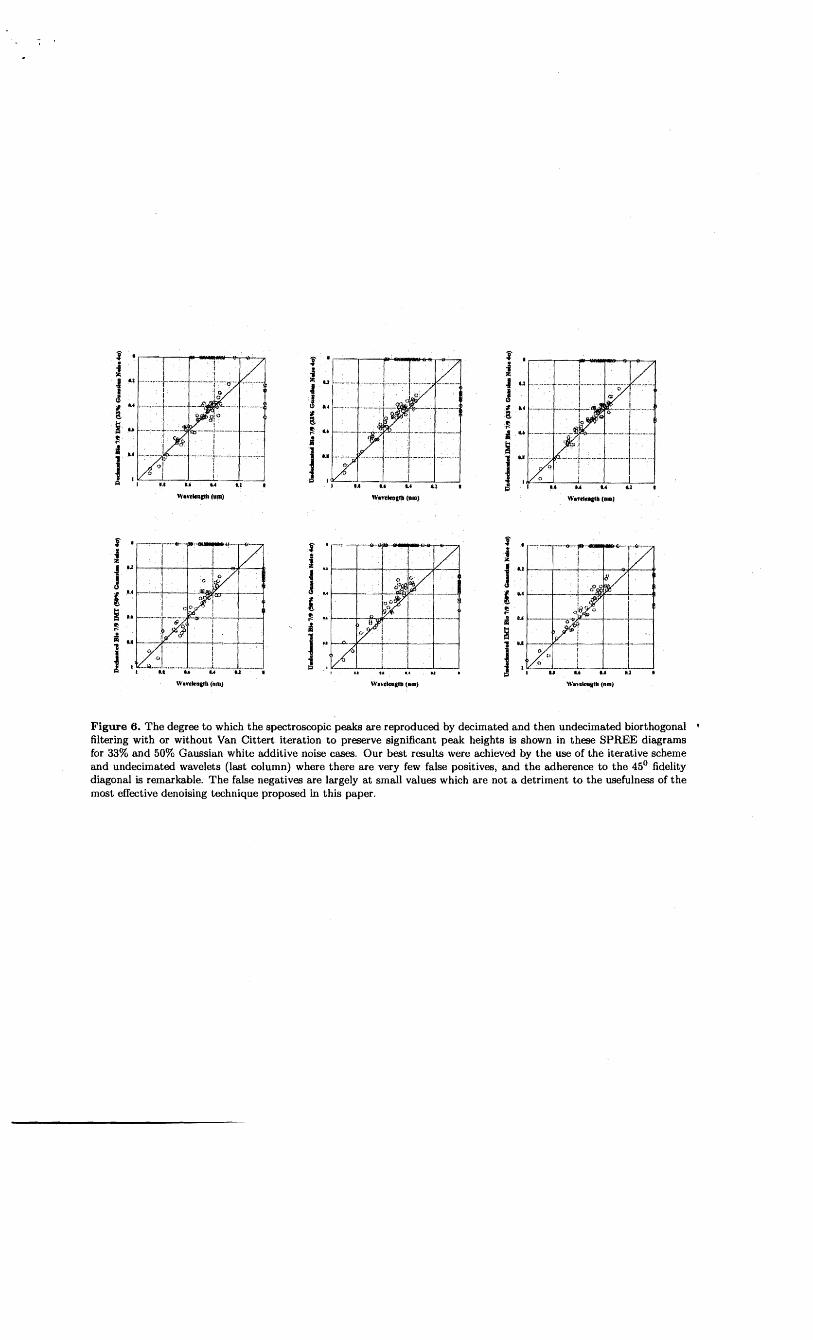
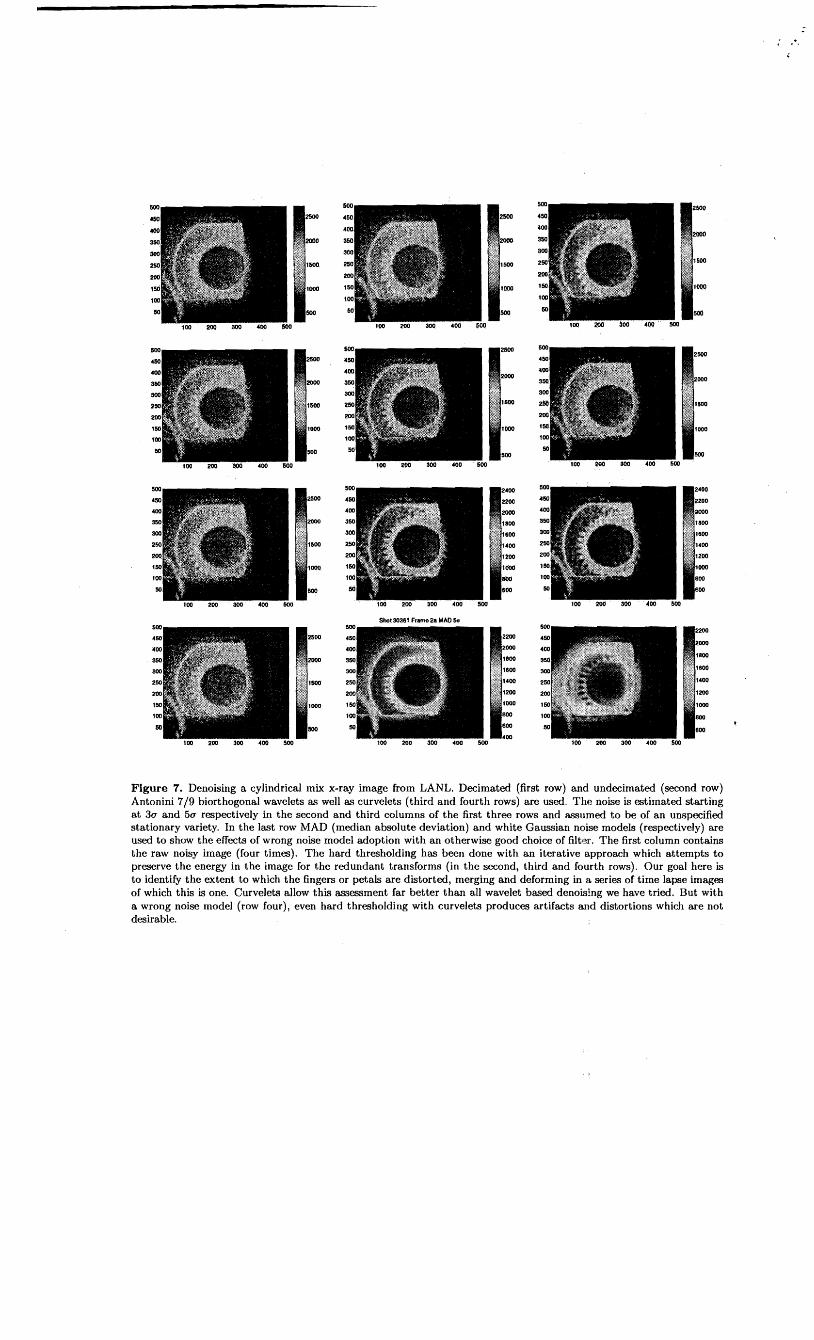
Related Documents