Chapter 9 Damage Estimation Improvement of Electric Power Distribution Equipment Using Multiple Disaster Information Yoshiharu Shumuta Additional information is available at the end of the chapter http://dx.doi.org/10.5772/55207 1. Introduction Electric power distribution equipment has a high damage potential due to disasters and requires a long time for restoration. This is because a huge number of electric power distribu‐ tion equipment is installed under various ground and regional conditions and is located near vulnerable trees and old residential buildings. Thus, during the restoration work after a large scale earthquake, it takes a long time to collect reliable disaster information. It is also even difficult to accurately estimate the damage degree of electric power distribution equipment. Therefore, in Japan, electric power companies pay particular attention to technologies associated with a quickly understanding and estimating the damage degree of the entire electric power distribution system during the emergency restorations. On the other hand, with the progress in information technologies, practical disaster informa‐ tion services are increasing in Japan. For example, the Japan Metrological Agency has started a general delivery service of real-time earthquake information since October, 2007[1]. More‐ over, in recent years, remote sensing images, such as satellite, aero and synthetic aperture radar (SAR) images, are now available and open to the public after a large scale disaster [2]. On the basis of such information technologies, more reasonable ways to support the restoration work for utility lifelines can be developed. Based on this background, our research team has developed an sequentially updated damage estimation system called RAMPEr, which stands for “Risk Assessment and Management System for Power lifeline Earthquake real time” [3][4]. RAMPEr enables us to provide the damage estimation results of electric power distribution equipment during the emergency restoration process against an earthquake. © 2013 Shumuta; licensee InTech. This is an open access article distributed under the terms of the Creative Commons Attribution License (http://creativecommons.org/licenses/by/3.0), which permits unrestricted use, distribution, and reproduction in any medium, provided the original work is properly cited.

Welcome message from author
This document is posted to help you gain knowledge. Please leave a comment to let me know what you think about it! Share it to your friends and learn new things together.
Transcript

Chapter 9
Damage Estimation Improvement of Electric PowerDistribution Equipment Using Multiple DisasterInformation
Yoshiharu Shumuta
Additional information is available at the end of the chapter
http://dx.doi.org/10.5772/55207
1. Introduction
Electric power distribution equipment has a high damage potential due to disasters andrequires a long time for restoration. This is because a huge number of electric power distribu‐tion equipment is installed under various ground and regional conditions and is located nearvulnerable trees and old residential buildings. Thus, during the restoration work after a largescale earthquake, it takes a long time to collect reliable disaster information. It is also evendifficult to accurately estimate the damage degree of electric power distribution equipment.Therefore, in Japan, electric power companies pay particular attention to technologiesassociated with a quickly understanding and estimating the damage degree of the entireelectric power distribution system during the emergency restorations.
On the other hand, with the progress in information technologies, practical disaster informa‐tion services are increasing in Japan. For example, the Japan Metrological Agency has starteda general delivery service of real-time earthquake information since October, 2007[1]. More‐over, in recent years, remote sensing images, such as satellite, aero and synthetic aperture radar(SAR) images, are now available and open to the public after a large scale disaster [2]. On thebasis of such information technologies, more reasonable ways to support the restoration workfor utility lifelines can be developed.
Based on this background, our research team has developed an sequentially updated damageestimation system called RAMPEr, which stands for “Risk Assessment and Management Systemfor Power lifeline Earthquake real time” [3][4]. RAMPEr enables us to provide the damageestimation results of electric power distribution equipment during the emergency restorationprocess against an earthquake.
© 2013 Shumuta; licensee InTech. This is an open access article distributed under the terms of the CreativeCommons Attribution License (http://creativecommons.org/licenses/by/3.0), which permits unrestricted use,distribution, and reproduction in any medium, provided the original work is properly cited.

Reference [3] proposed a damage estimation function installed in RAMPEr which used theearthquake ground motion intensity as an input parameter, and applied the proposed functionto actual electric power distribution equipment damaged by the 2007 Niigata-ken Chuetsu Okiearthquake to clarify the estimation accuracy of the proposed function.
This paper focuses on the updated damage estimation process of RAMPEr. RAMPEr enablesus to improve the damage estimation accuracy using sequentially updated disaster informa‐tion which a power company can collect during the emergency restoration period against alarge-scale earthquake. Chapter 2 introduces the necessary disaster information for threeemergency restoration stages and emphasizes the significance of RAMPEr. Chapter 3 describesthe formulation of the proposed model. Chapter 4 discusses the advantage and limitation ofthe proposed model using the actual damage records due to the 2007 Niigata-Ken Chuetsu-Oki earthquake.
2. Information required for the emergency restoration work
Fig.1 shows the differences in the information required for the efficient restoration of a seismicdamaged electric power distribution system. The restoration process is generally divided intothe initial, emergency, and permanent restoration periods. During the initial restorationperiod, the information associated with the damage degree of the entire electric power systemis needed to judge how many staff members should be dispatched for the restoration. Duringthe emergency restoration period, the information associated with the damage point and modeto judge whether restoration staff members can immediately restore the power is needed.During the permanent restoration process, the information associated with all damagedequipment to be physically repaired is needed.
In order to collect this information, the power company dispatches inspection teams. Inaddition, some power companies have tried to apply remote sensing technologies, includinghelicopters and satellites, to quickly collect damage information. However, at the current time,the inspection teams and remote sensing technologies are not very effective to quickly collectseismic damage information especially for the restoration resource allocation during the initialrestoration period.
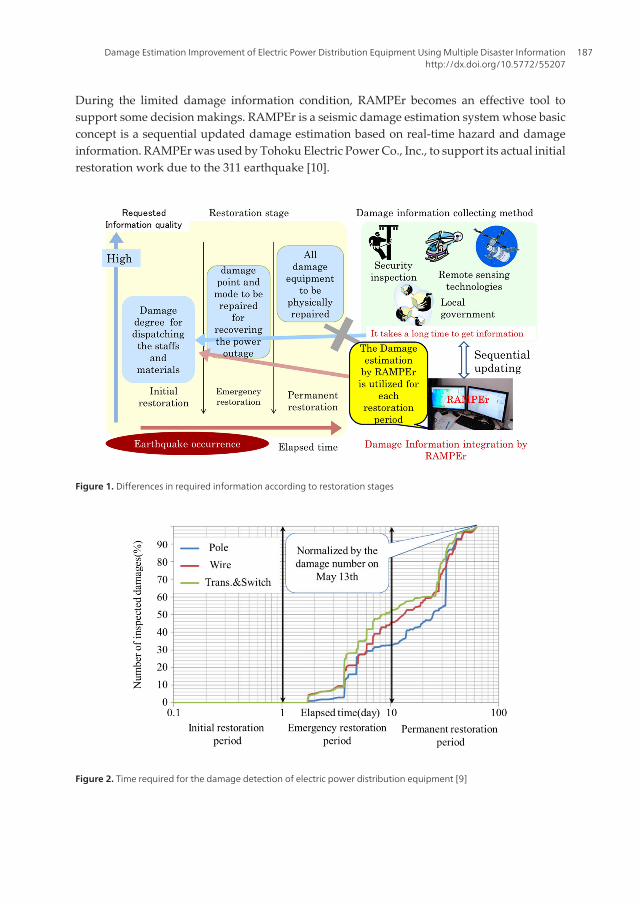
Fig.2 shows the restoration process of an electric power distribution system located in theTohoku region just after the 2011 earthquake off the Pacific coast of the Tohoku (the 311earthquake) occurrence. The horizontal axis and the vertical axis show the elapsed time (days)and the number of inspected damaged equipment (%), respectively. Fig.2 indicates that thedamage information had not been effectively collected, especially during the initial restorationperiod. This is because the Tohoku area had frequent aftershocks, much debris, and somecoastal regions which were not able to be entered for the restoration analysis. This resultillustrates that when a large-scale earthquake occurs, there is the possibility that the restorationwork, including damage information collection, is highly limited by the damage related toresidential buildings and other infrastructures.
Earthquake Research and Analysis - New Advances in Seismology186
During the limited damage information condition, RAMPEr becomes an effective tool tosupport some decision makings. RAMPEr is a seismic damage estimation system whose basicconcept is a sequential updated damage estimation based on real-time hazard and damageinformation. RAMPEr was used by Tohoku Electric Power Co., Inc., to support its actual initialrestoration work due to the 311 earthquake [10].
Figure 1. Differences in required information according to restoration stages
Figure 2. Time required for the damage detection of electric power distribution equipment [9]
Damage Estimation Improvement of Electric Power Distribution Equipment Using Multiple Disaster Informationhttp://dx.doi.org/10.5772/55207
187

3. Consecutive integrated process of multiple disaster information
3.1. Multiple disaster information used by RAMPEr
Disaster information needed by an electric power company can be usually collected after anearthquake occurrence includes four categories; (1) Earthquake, (2) Power outage, (3) Damageinspection, and (4) Damaged area image by remote sensing.
As for the earthquake information, RAMPEr, which has been already installed in some electricpower companies, is supposed to automatically receive the earthquake information throughthe Internet including the epicenter, magnitude, and seismic ground motion intensitiesrecorded on seismographs from the Japan Metrological Agency within several minutes justafter the earthquake occurrence. Based on the received earthquake information, RAMPErevaluates the seismic ground motion intensity distribution. As other sources, the NationalResearch Institute for Earth Science and Disaster Prevention (NIED) opens seismic groundmotion records including K-NET and KiK-net[5]. RAMPEr collects Instrumental SeismicIntensity (ISI), Peak Ground Velocity (PGV), and Peak Ground Acceleration (PGA) recordedfrom K-NET and KiK-net to improve the evaluation accuracy of the seismic ground motiondistribution.
Power outages and damage inspection information are usually confidential information thatthe power company collects. The power outage information is usually collected for every highvoltage distribution line (feeder) with power outages obtained from an online business supportsystem maintained by the electric power company. The inspection information includesdamaged equipment information including distribution poles, distribution lines, transform‐ers, and switches. The inspection information is collected by portable transceivers, mobilephones and Personal Digital Assistances (PDA) as offline information. RAMPEr uses thisconfidential information to improve the damage estimation accuracy [4].
On the other hand, a seismic damage area image provided by remote sensing devices, such assatellites, is also one of the effective resources to understand the damage degree of theearthquake stricken area. However, as mentioned in Chapter 2, at the current technology stage,because it usually takes a long time to take and provide the images, it is difficult for RAMPErto get the satellite image during an emergency restoration period. Thus, this paper focuses on(1) Earthquake information, (2) Power outage information, and (3) Damage inspectioninformation to formulate the damage information integration as follows.
3.2. Basic idea of damage information integration
This paper focuses on a Bayesian network as a basic model to integrate the multiple disasterinformation. Details of the Bayesian network can be found in reference [6]. This chapter onlyintroduces the basic concept of the Bayesian network for a better understanding of thefollowing chapters.
Fig.3 shows a simple Bayesian network. It describes the relationships between variables X1
and X2. The X1 and X2 variables are binary (taking a value of either 0: false or 1: true). The
Earthquake Research and Analysis - New Advances in Seismology188

causality of both nodes is defined as a Conditional Probability Table (CPT). The CPT definesthe causal relationship between X1 as a parent node and X2 as a child node in the Bayesiannetwork. The arrow between the nodes defines the causal relationship between the parentnode and child node. The conditional damage probability of the child node P(X2/X1) can bedetermined by the CPT in Fig.3.
For example, according to the marginalization [6], the probability P(X2= 1) can be estimated as
1
1 2
1
2 1 10
2 1 1
2 1 10 0
( 1 / ) ( )( 1) 0.305
( / ) ( )
X
X X
P X X P XP X
P X X P X
=
= =
= ×
= = =×
å
å å(1)
When variable X1=1 on the parent node is given, the probability P(X2= 1/ X1=1) can be estimated as
2
2 1 12 1 1
2 1 10
( 1 / 1) ( 1)( 1 / 1) 0.6
( / 1) ( 1)X
P X X P XP X X
P X X P X=
= = × == = = =
= × =å (2)
On the contrary, when variable X2=1 on the child node is given, the probability P(X1=1/X2=1)can be estimated as
1
2 1 11 2 1
2 1 10
( 1 / 1) ( 1)( 1 / 1) 0.984
( 1 / ) ( )X
P X X P XP X X
P X X P X=
= = × == = = =
= ×å (3)
Book Title 4
1
Fig.3. A basic element of a Bayesian network 2
3.2. Basic idea of damage information integration 3 This paper focuses on a Bayesian network as a basic model to integrate the multiple disaster 4
information. Details of the Bayesian network can be found in reference [6]. This chapter only 5 introduces the basic concept of the Bayesian network for a better understanding of the following 6 chapters. 7
Fig.3 shows a simple Bayesian network. It describes the relationships between variables X1 and X2. 8 The X1 and X2 variables are binary (taking a value of either 0: false or 1: true). The causality of both 9 nodes is defined as a Conditional Probability Table (CPT). The CPT defines the causal relationship 10 between X1 as a parent node and X2 as a child node in the Bayesian network. The arrow between the 11 nodes defines the causal relationship between the parent node and child node. The conditional 12 damage probability of the child node P(X2/X1) can be determined by the CPT in Fig.3. 13
For example, according to the marginalization [6], the probability P(X2= 1) can be estimated as 14 15
1
1 2
1
2 1 10
2 1 1
2 1 10 0
( 1/ ) ( )
( 1) 0.305( / ) ( )
X
X X
P X X P X
P XP X X P X
(1) 16
17 When variable X1=1 on the parent node is given, the probability P(X2= 1/ X1=1) can be estimated 18
as 19
2
2 1 12 1 1
2 1 10
( 1/ 1) ( 1)( 1/ 1) 0.6
( / 1) ( 1)X
P X X P XP X X
P X X P X
(2)
20
21 On the contrary, when variable X2=1 on the child node is given, the probability P(X1=1/X2=1) 22
can be estimated as 23 24
X1: : Parent Node
X2 : Child node
P(X2/X1) : Conditional probability of X2 assuming that X2 occurs .
Conditional Probability Table(CPT)
X1
X2
X 2 =0: false X 2 =1: true0: false 0.99 0.011:true 0.4 0.6
P (X2/X 1 )X 1
X 1 =0: false X 1 =1:true0.5 0.5
P(X 1 )
Figure 3. A basic element of a Bayesian network
Damage Estimation Improvement of Electric Power Distribution Equipment Using Multiple Disaster Informationhttp://dx.doi.org/10.5772/55207
189

If the causal relationships among disaster events can be defined by a Bayesian network withtwo or more nodes, which includes the 2 nodes of Fig.3 as a minimum unit, the conditionalprobability of a target node can be improved with an increase in the observed information ofthe parent or child nodes.
3.3. Improvement of damage probability using Bayesian network
Fig.4 shows a proposed Bayesian network. The proposed Bayesian network consists of 4 nodes;(1) Earthquake Ground Motion (EGM(a)), (2)Electric Power Distribution Equipment damage(EPDE),(3) Damage Inspection(DI),and (4) Power Outage(PO). The CPT of the proposedBayesian network is defined as follows.
Earthquake Ground Mot ion
informat ion (EGM(a))
Elect ric Power Dist ribut ion Equipment
damage(EPDE)
Power Outage informat ion (PO)
Damage Inspect ion
informat ion (DI)
CPT(A)
CPT(B)
CPT(C)
Figure 4. The proposed Bayesian network model
a. Causal relationship between earthquake ground motion and electric power distributiondamage (CPT(A))
Table 1 shows the CPT which defines the casual relationship between earthquake groundmotion and electric power distribution equipment damage shown as CPT(A) in Fig.4.
Earthquake Research and Analysis - New Advances in Seismology190

EGM(a)=1 indicates that the information of the maximum seismic ground motion intensity afor every target equipment is given. EGM(a) = 0 indicates that no earthquake ground motioninformation is given. EPDE=1 and EPDE=0 indicate the damage and no damage that occurs toequipment, respectively. Pi(a) indicates the estimated damage rate of equipment i with themaximum seismic ground motion a. Pi(a) is estimated by appendix[A]. This paper assumesthat when an earthquake occurs, the maximum ground motion a is always given for everytarget equipment within several minutes. Thus, in Table 1, Pi (EPDE=1/EGM(a)=1) and Pi
(EPDE=0/EGM(a)=1) are equivalent to Pi(a) and 1-Pi(a), respectively, and Pi(EPDE/EGM(a)=0)is neglected in Table 1.
CPT(A) Pi(EPDE/EGM(a))
EGM(a)No Damage
EPDE=0
Damage
EPDE=1
1:maximum seismic ground motion a occurs 1-Pi(a) Pi(a)
Table 1. Conditional probability table between the earthquake intensity and the damage of electric powerdistribution equipment (CPT(A))
b. Causal relationship between the electric power distribution damage and the power outage(CPT(B))
Table 2 shows the CPT which defines the causal relationship between the electric powerdistribution damage and the power outage shown as CPT(B) in Fig.4. According to CPT(B),when EPDE = 1 is given, which indicates that equipment i is damaged, the conditional nopower outage probability of equipment i, Pi (PO=0/EPDE=1), and the conditional power outageprobability of equipment i, Pi (PO=1/EPDE=1), are assumed to be 0 and 1, respectively.
On the other hand, when EPDE=0 is given, which indicates that equipment i is not damaged,the conditional power outage probability of equipment i, Pi (PO=0/EPDE=0), and no poweroutage probability of equipment i, Pi (PO=1/EPDE= 0), are, respectively, estimated as
1
1( 0 / 0) (1 ( ))
Ne
i ii
P PO EPDE P a-
=
= = = -Õ (4)
1
1( 1 / 0) 1 (1 ( ))
Ne
i ii
P PO EPDE P a-
=
= = = - -Õ (5)
where Ne indicates the total number of equipment connected to the same distribution line (thesame feeder). Equation (4) and Equation (5) assumes that when equipment is damaged, apower outage occurs to all equipment connected to the distribution line of the damagedequipment.
Damage Estimation Improvement of Electric Power Distribution Equipment Using Multiple Disaster Informationhttp://dx.doi.org/10.5772/55207
191

c. Causal relationship between damage inspection and electric power distribution equip‐ment damage (CPT(C))
Table 3 shows the CPT which defines the causal relationship between the damage inspectionand the electric power distribution equipment damage shown as CPT(C) in Fig.4. The damageinspection information indicates the inspection result of equipment with the same attribute asthe target equipment i, which includes the number of damaged and non-damaged equipmenton the condition that the target equipment i has no inspection. According to CPT(C), whenDI=0 is given, which indicates that equipment i has no inspection information, the conditionaldamage probability of equipment i, Pi (EPDE=1/DI=0), and the conditional no damageprobability of equipment i, Pi (EPDE=0/DI=0), are equivalent to Pi(a) and 1- Pi(a), respectively.
On the other hand, when DI=1 is given, which indicates that equipment i has inspectioninformation, the conditional damage probability of equipment i, Pi (EPDE=1/DI=1), and theconditional no damage probability of equipment i, Pi (EPDE= 0/DI=1), are evaluated as
0 1
0 11
( 1 / 1)2
i ii
i i
n nP EPDE DI
M M+ +
= = =+ +
(6)
0 1
0 11
( 0 / 1) 12
i ii
i i
n nP EPDE DI
M M+ +
= = = -+ +
(7)
where Mi0 is the total number of inspected equipment with the same attribute as equipment i.
ni0is the total number of damaged equipment with the same attribute as equipment i. On the
other hand, Mi1and ni
1 are, respectively, evaluated as
( ) ( )12
( )
(1 )3i i
i
p a p ai
p a
Mm m
s
-= - (8)
CPT(B) Pi(PO/EPDE)
EPDENo Power Outage
PO= 0
Power Outage
PO=1
0: No damage Equation (4) Equation (5)
1: Damage 0 1
Table 2. Conditional probability table between the damage to electric power distribution equipment and the poweroutage (CPT(B))
Earthquake Research and Analysis - New Advances in Seismology192

( ) ( )1( ) 2
( )
(1 )1 1i i
i
i
p a p ai p a
p a
nm m
ms
ì ü-ï ï= - -í ýï ïî þ
(9)
where, μpi(a) and σpi(a) are the average and standard deviation of the estimated damage
probability of equipment with the same attribute as equipment I, pi(a), on the condition thatthe maximum ground motion intensity a is given, respectively. For this formulation, it isassumed that the estimated damage probabilities of equipment with the same attribute i followthe beta distribution based on the theory of Bayesian statistics [7].
Note that when the damage inspection information of equipment i is given, the conditionaldamage probability of equipment i, Pi (EPDE/DI=1), becomes 1 (damage) or 0 (no damage) asthe definitive value instead of that by Table 3.
CPT(C) Pi(EPDE/DI)
DINo Damage
EPDE=0
Damage
EPDE=1
0: No inspection 1-Pi(a) Pi(a)
1: Inspection Equation (7) Equation (6)
Table 3. Conditional probability table between the inspection information and the damage of electric powerdistribution equipment
d. Combination of the joint occurrence probability
Based on Table1, Table2, and Table 3, Table 4 shows the combination of all the joint occurrenceprobabilities in Fig.4. Based on Table 4, all the conditional damage probabilities of theequipment can be evaluated. For example, when the earthquake ground motion information,EGM(a)=1 and power outage information, PO=1, are given, the conditional damage probabilityof equipment i, Pi(EPDE=1/EGM(a)=1,PO=1), is evaluated as
[1] [5]( 1 / ( ) 1, 1)[1] [3] [5] [7]iP EPDE EGM a PO +
= = = =+ + +
(10)
On the other hand, when the earthquake ground motion information, EGM(a)=1 and thedamage inspection information, DI=1, are given, the conditional damage probability ofequipment i, Pi(EPDE=1/EGM(a)=1,DI=1), is evaluated as
[1] [2]( 1 / ( ) 1, 1)[1] [2] [3] [4]iP EPDE EGM a DI +
= = = =+ + +
(11)
Damage Estimation Improvement of Electric Power Distribution Equipment Using Multiple Disaster Informationhttp://dx.doi.org/10.5772/55207
193

Combination No EGM(a) DI EPDE PO Joint occurrence probability
[1] 1 1 1 1 Equation(6)
[2] 1 1 1 0 0
[3] 1 1 0 1 (1-Equation(6)) (1-Π(1-Equation(6))
[4] 1 1 0 0 (1-Equation(7)) Π(1-Equation(7))
[5] 1 0 1 1 Pi(a)
[6] 1 0 1 0 0
[7] 1 0 0 1 (1-Pi(a)) (1-Π(1-Pi(a))
[8] 1 0 0 0 (1-Pi(a)) Π(1-Pi(a))
Table 4. Combination of the joint probability (CPT(A)+CPT(B)+CPT(C))
The following positive analyses discuss the estimation accuracy for the situations of Equation(10) and Equation (11).
4. Positive analyses based on the 2007 Niigata-Ken Chuetsu Oki earthquake
4.1. Precondition of positive analyses
This chapter discusses the effectiveness of the proposed model based on an actual power outageand damage records of an electric power distribution system struck by the 2007 Niigataken-ken Chuetsu-Oki earthquake (hereafter, called the Chuestsu-Oki earthquake). The target electricpower distribution system consists of 32,295 poles including 18,474 high voltage electric powerdistribution poles and 63 feeders, which indicates a high voltage distribution line.
Fig.5 shows the distribution of the seismic intensity scale of the Japan Meteorological Agency(JMA) due to the Chuetsu-Oki earthquake. The Chuetsu-Oki earthquake caused the 6 upperon the seismic intensity scale of the Japan Meteorological Agency (JMA 6+) as the maximumground motion intensity to the struck area. In the analysis, it is assumed that the earthquakeground motion information related to Fig.5 has already been given as EGM(a) in Fig.4.
Fig.6 shows the power outage area caused by the Chestsu-Oki earthquake. Power outages alsooccurred to 15,074 high voltage poles, which is about 80 % of the total number of high voltagepoles in the target system. The power outage information is given as the power outageinformation (PO) in Fig.4.
Fig.7 shows the observed points of the damaged poles due to the Chuetsu-Oki earthquake.The pole damages mainly consisted of two damage modes; i.e., breakage and inclination [8].The damaged pole information is given as the damage inspection information (DI) in Fig.4.
In order to discuss the effectiveness of the proposed model, two situations are assumed in thefollowing positive analysis;
1. The earthquake ground motion and power outage information are given (discussed in 4.2).
Earthquake Research and Analysis - New Advances in Seismology194

2. The earthquake ground motion and the damage inspection information are partially given(discussed in 4.3).
JMA seismic intensity scale
Figure 5. The distribution of the seismic intensity scale of the Japan Meteorological Agency (JMA) due to the Chuetsu-Oki earthquake (treated as EGM(a) in Fig.4)
High voltage distribution lines with power outage
Figure 6. The observed power outage of high voltage distribution lines due to the Chuetsu-Oki earthquake (treated asPO in Fig.4)
Figure 7. The observed points of the damaged poles due to the Chuetsu-Oki earthquake (treated as DI in Fig.4)
Damage Estimation Improvement of Electric Power Distribution Equipment Using Multiple Disaster Informationhttp://dx.doi.org/10.5772/55207
195

4.2. The effect on accuracy improvement of power outage information
Fig.8 shows a comparison between the observed and estimated number of damaged highvoltage poles, which are normalized by the total number of observed damage poles. Thecaption [Observed] indicates the total number of observed poles damaged by the Chuetsu-Okiearthquake. The caption [without POI] indicates the total number of estimated damaged polesbased on the causal relationship defined by Table 1, which is CPT (A) in Fig.4. The damageprobability for pole i, which indicates the estimated damage number of pole i, is estimated asPi (EPDE= 1/EGM(a)=1). On the other hand, the caption [with POI] indicates the total numberof estimated damage poles based on the two causal relationships including CPT(A) and CPT(B)in Fig.4 evaluated by Equation (10).
Fig.8 indicates that the normalized damaged number of [with POI], 1.06, is closer to that of the[Observed], 1.00, than that of [without POI], 1.25. This result suggests that the proposed modelusing the power outage information can effectively improve the damage estimation accuracyof the electric power distribution poles.
Fig.9, on the other hand, shows a comparison of the number of damaged poles for every thirdmesh (1km×1km) among [Observed], [with POI], and [without POI]. R indicates the correlationcoefficients between [Observed] and [with POI], and between [Observed] and [without POI].Fig.9 indicates that the correlation coefficient R between [Observed] and [with POI] is slightlyhigher than that between [Observed] and [without POI].
In order to discuss the improved effect of the power outage information on the damageestimation accuracy, Fig.10 shows the relationship among the damage probability of a polewithout power outage information, the damage probability of a pole with power outageinformation, and the total number of poles connected to the same feeder. The horizontal axisindicates the damage probability of a pole without power outage information (PO), which isestimated as Pi (EPDE= 1/EGM (a)=1) based on Table 1. The vertical axis indicates that withPOI, which is estimated as Pi (EPDE=1/POI=1) based on Equation (10). Ne, the total number ofpoles on the same feeder, imitates the actually installed feeder conditions of the target electricpower distribution system.
Fig.10 illustrates that when the damage probability of a pole without POI is 0.001, POI improvesthe damage probability to 0.5, 0.1, 0.02 and 0.0015 on the condition that Ne=2, Ne=10, Ne= 50,Ne=100, and Ne=1000, respectively. This result suggests that the power outage informationbecomes more effective along with a decrease in the number of poles connected to the samefeeder. In this paper, though it is assumed that a power company can identify a power outagerange for every feeder, some power companies can identify the power outage within asubdivided range using a switch. In such a situation, the power outage information is moreuseful to improve the damage estimation accuracy.
Fig.10 also shows that the improvement effect based on the power outage information dependson the earthquake ground motion intensity level. For example, when the earthquake groundmotion intensity under a target pole becomes about 6- to 6+ on the JMA seismic intensity scale,it is usually estimated that the damage probability without POI, which is evaluated by P(a), Pi
(EPDE=1/EGM (a)=1), becomes 0.001 to 0.01. When the damage probability without POI is from
Earthquake Research and Analysis - New Advances in Seismology196

0.001 to 0.01, there are significant differences in the damage probability with POI. On the otherhand, when P(a) exceeds 0.03,whose earthquake ground motion intensity becomes over 6+,there is a limited effect of power outage information on improving the damage estimationaccuracy.
This result suggests that the power outage information is usually effective for improving theestimation accuracy. However, when one feeder, which is a unit to identify the power outagerange, has over 50 high voltage poles, and over 6+ of the earthquake ground motion level striketarget feeder, there is a possibility that the effect of the power outage information only slightlyimproves the damage estimation accuracy of the target equipment.
POI: Power Outage Information
Figure 8. Comparison of total number of damaged high voltage poles
Figure 9. Comparison of the number of damaged poles for every third mesh (1km×1km) among [Observed], [withPOI], and [without POI].
Damage Estimation Improvement of Electric Power Distribution Equipment Using Multiple Disaster Informationhttp://dx.doi.org/10.5772/55207
197

Figure 10. Effect of power outage information on the conditional damage probability of electric power distributionequipment
4.3. The effect on accuracy improvement by the damage inspection information
This section discusses the effect of the damage inspection information to improve the damageprobability of the electric power distribution poles. In order to understand the effect of theinspection information on the improvement of the damage estimation accuracy, the damageprobability of poles, Pi (EPDE=1/EGM (a)=1) is updated based on the different inspection rates.The inspection rate is evaluated as the number of inspected poles divided by the total numberof poles (32,295 poles). In this simulation, it is assumed that actual damaged poles by theChuetsu-Oki earthquake shown in Fig.7 are inspected based on an inspection priority. Theinspection priority is determined as follows:
1. The target area is divided into the third mesh (1km×1km)
2. The third mesh (1km×1km) is also divided into the 16 fifth meshes (250m×250m).
3. The conditional damage probabilities, Pi(EPDE=1/EGM(a)=1), for all poles are estimatedbased on table 1.
4. The averages of the estimated damage probabilities for every third mesh and for everyfifth mesh are evaluated.
5. The differences in the average of all the estimated damage probabilities between the thirdmeshes and the 16 fifth meshes of the same third mesh are evaluated as an inspectionpriority index.
6. The 16 fifth meshes are put in order based on the inspection priority index value. Thesmaller the priority index, the higher the priority level.
Fig.11 shows the allocated inspection districts of fifth meshes with a 29% inspection rate. Thered square point shows the inspection point which is determined by the inspection priorityindex. The background chart with allocated third meshes is the estimated number of pole
Earthquake Research and Analysis - New Advances in Seismology198
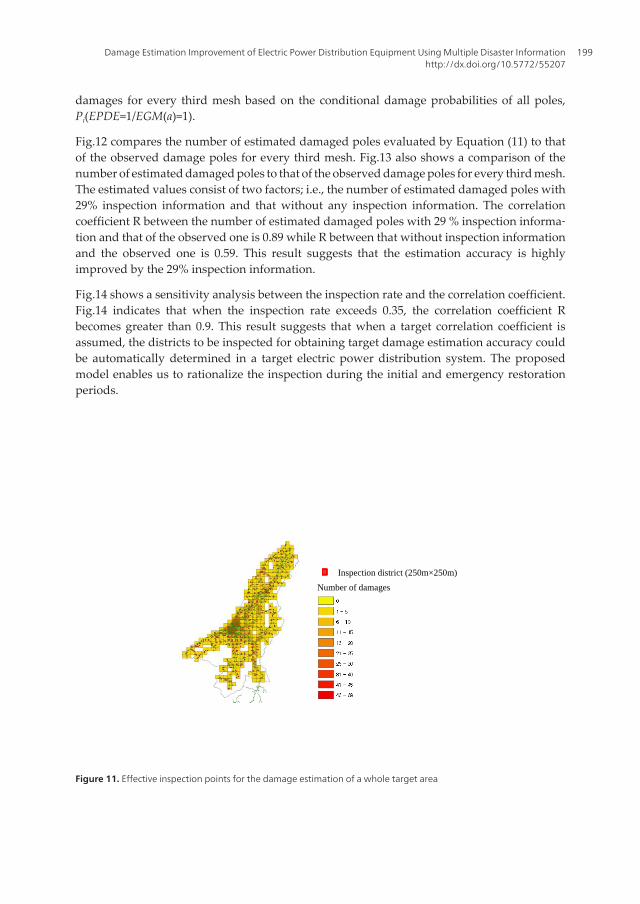
damages for every third mesh based on the conditional damage probabilities of all poles,Pi(EPDE=1/EGM(a)=1).
Fig.12 compares the number of estimated damaged poles evaluated by Equation (11) to thatof the observed damage poles for every third mesh. Fig.13 also shows a comparison of thenumber of estimated damaged poles to that of the observed damage poles for every third mesh.The estimated values consist of two factors; i.e., the number of estimated damaged poles with29% inspection information and that without any inspection information. The correlationcoefficient R between the number of estimated damaged poles with 29 % inspection informa‐tion and that of the observed one is 0.89 while R between that without inspection informationand the observed one is 0.59. This result suggests that the estimation accuracy is highlyimproved by the 29% inspection information.
Fig.14 shows a sensitivity analysis between the inspection rate and the correlation coefficient.Fig.14 indicates that when the inspection rate exceeds 0.35, the correlation coefficient Rbecomes greater than 0.9. This result suggests that when a target correlation coefficient isassumed, the districts to be inspected for obtaining target damage estimation accuracy couldbe automatically determined in a target electric power distribution system. The proposedmodel enables us to rationalize the inspection during the initial and emergency restorationperiods.
it is assumed that actual damaged poles by the Chuetsu-Oki earthquake shown in Fig.7 are inspected based on an inspection
priority. The inspection priority is determined as follows:
1. The target area is divided into the third mesh (1km×1km)
2. The third mesh (1km×1km) is also divided into the 16 fifth meshes (250m×250m).
3. The conditional damage probabilities, Pi(EPDE=1/EGM(a)=1), for all poles are estimated based on table 1.
4. The averages of the estimated damage probabilities for every third mesh and for every fifth mesh are evaluated.
5. The differences in the average of all the estimated damage probabilities between the third meshes and the 16 fifth meshes
of the same third mesh are evaluated as an inspection priority index.
6. The 16 fifth meshes are put in order based on the inspection priority index value. The smaller the priority index, the
higher the priority level.
Fig.11 shows the allocated inspection districts of fifth meshes with a 29% inspection rate. The red square point shows the inspection
point which is determined by the inspection priority index. The background chart with allocated third meshes is the estimated
number of pole damages for every third mesh based on the conditional damage probabilities of all poles, Pi(EPDE=1/EGM(a)=1).
Fig.12 compares the number of estimated damaged poles evaluated by Equation (11) to that of the observed damage poles for
every third mesh. Fig.13 also shows a comparison of the number of estimated damaged poles to that of the observed damage poles
for every third mesh. The estimated values consist of two factors; i.e., the number of estimated damaged poles with 29% inspection
information and that without any inspection information. The correlation coefficient R between the number of estimated damaged
poles with 29 % inspection information and that of the observed one is 0.89 while R between that without inspection information
and the observed one is 0.59. This result suggests that the estimation accuracy is highly improved by the 29% inspection
information.
Fig.14 shows a sensitivity analysis between the inspection rate and the correlation coefficient. Fig.14 indicates that when the
inspection rate exceeds 0.35, the correlation coefficient R becomes greater than 0.9. This result suggests that when a target
correlation coefficient is assumed, the districts to be inspected for obtaining target damage estimation accuracy could be
automatically determined in a target electric power distribution system. The proposed model enables us to rationalize the
inspection during the initial and emergency restoration periods.
Figure 11. Effective inspection points for the damage estimation of a whole target area
Inspection district (250m×250m)
Number of damages
Figure 11. Effective inspection points for the damage estimation of a whole target area
Damage Estimation Improvement of Electric Power Distribution Equipment Using Multiple Disaster Informationhttp://dx.doi.org/10.5772/55207
199

Figure 12. Comparison of estimation accuracies between the damage estimations with 29 % inspection informationand without inspection information
1 2
3 4
5 6 7
8 9
10 11
F12 13
14
Fig. 13. Comparithird mes
Fig. 14. Relationsestimation
(b) Estimated inspection
ison of the numbesh.
ship between the inn of damaged pole
number of damaginformation
Number of damag
(a) Observed n
er of estimated da
nspection rate andes
ged poles without
ged poles
number of damage
amaged poles with
d the correlation co
t (c) Estim29 %
d poles
h that of observed
oefficient associat
mated number ofinspection inform
Bo
d damage poles fo
ted with the observ
f damaged poles mation
ook Title
or every
ved and
with
Figure 13. Comparison of the number of estimated damaged poles to that of observed damaged poles for every thirdmesh.
Earthquake Research and Analysis - New Advances in Seismology200

Figure 14. Relationship between the inspection rate and the correlation coefficient associated with the observed andestimation of damaged poles
5. Conclusion
This paper proposed a model to integrate multiple disaster information. The proposed modelenables us to improve the damage estimation accuracy of electric power distribution equip‐ment during the initial and emergency restoration periods after an earthquake. The researchresults are summarized as follows.
1. Information required for the emergency restoration work
The restoration process for an electric power distribution system after an earthquake is dividedinto three periods; i.e., initial, emergency, and permanent restoration periods. The necessaryinformation and the information that was able to be collected within the three restorationperiods were elucidated. As a result, it was clarified that the damage estimation technologiesare very useful for actual restoration work under limited disaster information circumstanceswhile the application of a seismic damage estimation system for electric power distributionequipment (RAMPEr) to the actual restoration work after the 2011 earthquake off the Pacificcoast of the Tōhoku is described.
2. Formulation of a sequential updated model for electric power distribution system
A basic model to integrate the sequentially updated disaster information was proposed basedon a Bayesian network. The proposed model can effectively integrate multidimensional
Damage Estimation Improvement of Electric Power Distribution Equipment Using Multiple Disaster Informationhttp://dx.doi.org/10.5772/55207
201

disaster information, including earthquake ground motion, power outage and damageinspection information, to improve the estimation accuracy of seismic damaged electric powerdistribution poles.
3. Positive analysis based on the 2007 Niigata-Ken Chuetsu-Oki earthquake
The proposed model was applied to an actual electric power distribution system struck by the2007 Niigataken Chuetsu-oki Earthquake, and the effect of the power outage and damageinspection information for improvement of the damage estimation accuracy was verified. Asfor the power outage information, it was clarified that under the installed conditions of theactual electric power distribution system, the damage estimation accuracy with power outageinformation was higher than that without power outage information. It was also realized thatin order to effectively utilize the power outage information by the proposed model, the sizeof one feeder, which was related to a unit to identify the power outage range, and the earth‐quake ground motion level, which determined the damage probability level, were importantparameters.
On the other hand, as for the inspection information, in order to effectively select the damageinspection point, the inspection priority of the actual electric power distribution poles wasproposed. Based on the proposed inspection priority, the relationship between the inspectionrate and the damage estimation accuracy was analyzed. As a result, it was also clarified thatunder the installed conditions of the actual electric power distribution system, the estimationaccuracy is highly improved only by the 29% inspection information and when the inspectionrate exceeds 0.35, the correlation coefficient R between the number of observed damaged polesand that of the estimated one becomes greater than 0.9.
In Japan, the occurrence of the Nankai Trough earthquake is feared. As mentioned in Chapter2, the damage estimation system, RAMPEr, in which the proposed model has already beeninstalled, is operating in some areas that could be highly affected by the Nankai Troughearthquake. In such a high seismic area, it is expected that RAMPEr will become a useful toolto support the restoration work after the earthquake. As future subjects, in order to improvethe damage estimation accuracy of the proposed model, some remote sensing images will beintegrated into the proposed model and the damage records due to the 2011 earthquake offthe Pacific coast of Tohoku will be analyzed.
Apendix [A]
Equipment damage estimation model [4]
In this paper, based on reference [4], the seismic damage probability with the maximumearthquake ground motion a (Pi(a)) is evaluated as
( ) ( ( ))i m i j k l cP a L C B T S f z a= × × × × × (12)
Earthquake Research and Analysis - New Advances in Seismology202

where fc(z(a)) is the seismic damage ratio of equipment i with seismic countermeasure C andseismic performance z(a) assuming that the maximum ground motion a affects the targetequipment. The seismic performance z(a) is the seismic safety margin evaluated by the bendingmoment of the ground surface of the electric power distribution poles caused by the maximumground motion a. Sl is the modification coefficient evaluated by the line connected type l.Tk isthe modification coefficient for the land use condition k.Bj is the modification coefficient forthe microtopography division j. Ci is the modification coefficient for the seismic countermeas‐ure of equipment i. L m is the modification coefficient for local region m. m is an electric powersupply area covered by a business branch office.
Seismic performance z(a) relative to the earthquake intensity a is evaluated as
0( ) 1 2 ( )z a k k z a= × × (13)
where z0(a) is the safety margin relative to the maximum surface ground acceleration a (m/s2),which defined as the ratio to the static earthquake force of the design collapse load (N). Thestatic force is converted into the top concentration load of a distribution pole from themaximum surface ground acceleration.
According to the Japan Electric Technical Standards and Codes Committee (2007), Z0(a) isevaluated as
40
20
0 40
20
(without pole anchor)120 ( ) ( )
( )0.3 ( )
(with pole anchor)( ) ( ')
K D tP e H t
Z eK D Q t AJP e H t
ì ü× ×ï ï
× +ï ï= í ý
× × +ï ïï ï× +î þ
(14)
K is a soil coefficient defined by the Japan Electric Technical Standards and Codes Committee(2007). K is divided into four types. The standard soil [A] is defined as 3.9×10⁷ (N/m4), whichincludes hardened soil, sand, gravel, and soil with small stones. The standard soil [B] is definedas 2.9×10⁷ (N/m4) , which includes softer soil than [A]. Poor soil [C] is defined as 2.0×10⁷ (N/m4) ,which includes a kind of silt without soil. Poor soil [D] is defined as 0.8×10⁷ (N/m4) , whichincludes moist clay and humid soil.
D0is the diameter on the ground surface of the distribution pole (m). t is the penetration depthof the distribution pole into the ground (m). H is the concentration load height from the groundsurface (m).
P(a) is the concentration load (kN) converted from the maximum surface ground accelerationa (m/s2). P(a) is evaluated as
1 1( )- 0.25aP a W l
H= ´ (15)
Damage Estimation Improvement of Electric Power Distribution Equipment Using Multiple Disaster Informationhttp://dx.doi.org/10.5772/55207
203
where H is the height of the distribution pole from the ground surface (m), W1is mass of theupper ground part of the distribution pole (kg), l1is the height of the gravity center of the upperpart of the distribution pole (m).
t0 is the depth of the gyration center of the distribution pole from the ground surface, whichis evaluated as
0 without pole an2 (3
chor)t t= (16)
2 2'
0 with pole an32 ( ) ( chor)
3 2c
c
t ntt
t nt+
=+
(17)
1
AnA
= (18)
where A is the area of the pole anchor. A1 is the area of the base part of the distribution pole.A and A1 are evaluated as
0( )A L D d= - (19)
1 0A D t= (20)
where L is the length of the pole anchor (m), d is the width of the pole anchor (m).
Q and J are evaluated as
2 0 '1 (6 8 3),12
tQ m m m
t= - + = (21)
20( ' )c cJ t t t= - (22)
where tc is the depth of the center of the pole anchor from the ground surface (m).
k1 is a modification coefficient considering the effects of the overhead wire including strungand joint use wires, and overhead equipment such as an overhead transformer.
Earthquake Research and Analysis - New Advances in Seismology204

Based on a preliminary analysis, k1 is evaluated as
4
1
111 1i i
i
ka w L b
=
=´ +å (23)
where a1and b1 are recurrent coefficients evaluated by a preliminary analysis, and these valuesare assumed to be a1is 0.000428, b1is 1.0. Note that i=1: high voltage wire; i=2: low voltage wire;i=3: overhead transformer; i=4: joint use wire; wi is the mass of I; Li is the height of the distri‐bution pole from the ground surface.
k2 is a modification coefficient considering adjacent distribution poles. k2 is assumed to be
k2=1.0 (in the case where adjacent distribution poles have no overhead equipment), k2=0.9 (inthe case where the number of adjacent distribution poles with overhead equipment is less thanthree), k2 =0.85 (in the case where the number of adjacent distribution poles with overheadequipment is more than four).
In Equation (A.1), the damage ratio is evaluated as
ln ( ( ) / , )( ( ))
ln ( ( ) / , )c c d d
cc c all all
DP z af z a
TP z al xl x
= × (24)
2ln( ( )))1 1ln ( ( ) / , ) exp ( )22 ( )
xc x x
xx
z az a
z al
l xxp x
é ù-= × - ×ê ú
× × ê úë û (25)
x ={ d (damaged equipment)all (all equipment) }
where, fc(z(a)) is the seismic damage ratio function of equipment with seismic countermeasurec and equipment performance z(a) assuming that the maximum ground surface accelerationa. DPc is the total number of actual seismic damaged equipment with seismic countermeasurec, TPc is the total number of equipment with seismic countermeasure c. When x is d,lnc(z(a)) / λx=d , ζx=d ) is the log normal probability density function of the performance valuez(a) associated with damaged equipment with seismic countermeasure c due to a targetearthquake. When x is d, λx=d and ζx=d are the mean and standard deviation of ln(z(a))associated with the damaged equipment, respectively. When x is all, lnl(z(a));λx=all , ζx=all) isthe log normal probability density function of the performance value z(a) of all equipmentwith seismic countermeasure c. λx=all and ζx=all are the mean and standard deviation of ln(z(a))for all equipment with seismic countermeasure c, respectively.
Damage Estimation Improvement of Electric Power Distribution Equipment Using Multiple Disaster Informationhttp://dx.doi.org/10.5772/55207
205

Acknowledgements
The views and actual damage records expressed herein are based on research supported byseveral electric power companies including the Tohoku Electric Power Co., Inc.
Author details
Yoshiharu Shumuta
Civil Engineering Laboratory, Central Research Institute of Electric Power Industry, Chiba,Japan
References
[1] Japan Meteorological Agency: What is an Earthquake Early Warning ?, http://www.jma.go.jp/jma/en/Activities/eew1.html/ (accessed 21 November 2012).
[2] Sentinel Asia: https://sentinel.tksc.jaxa.jp/sentinel2/topControl.action/ (accessed 21November 2012).
[3] Shumuta,Y., Todou, T., Takahashi, K., and Ishikawa, T. Development of a DamageEstimation Method for Electric Power Distribution Equipment, The Journal of the Insti‐tute of Electrical Engineers in Japan, Volume 130-C Number 7, 2010;1253-1261 (in Japa‐nese).
[4] Shumuta,Y. Masukawa,K. Todou,T. and Ishikawa T. Proceedings of the 11th Interna‐tional Conference on Applications of Statistics and Probability in Civil Engineer‐ing(CASP11),2011;MS_218,2026-2033.
[5] Strong-motion Seismograph Networks (K-NET, KiK-net), National Research Institutefor Earth Science and Disaster Prevention, http://www.k-net.bosai.go.jp/ (accessed 21November 2012).
[6] Koski, T., and Noble, J. Bayesian Networks, Wiley series in probability and statistics:Wiley, 2009.
[7] Gelman,A.,Caelin, J.B.,Stern, H.S.,and Rubin, D.,B. Bayesian Data Analysis: Chap‐man & Hall/CRC,2004.
[8] The Niigata-Ken Chuetsu Earthquake Investigation Committee, Report of the 2004Niigata-Ken Chuetsu-Oki earthquake damage investigation report, Japan Society ofCivil Engineering, 2004 (in Japanese).
Earthquake Research and Analysis - New Advances in Seismology206

[9] Tohoku Electric Power Co. Inc. “Power outage information associated with the 2012earthquake off the Pacific coast of Tōhoku”, http://www.tohoku-epco.co.jp/informa‐tion/1182212_821.html (accessed November 21, 2012).
[10] Miyako,T., and Todou, T,. Development of seismic damage estimation system forelectric power equipment, Electrical Review, 2011; No.2011. 10, 76-78 (in Japanese).
Damage Estimation Improvement of Electric Power Distribution Equipment Using Multiple Disaster Informationhttp://dx.doi.org/10.5772/55207
207

Related Documents