HYDRAULIC DESIGN CRITERIA SHEETS 111-16TO 111-16/2 HIGH OVERFLOW DAMS CREST PRESSURES 1. Hydraulic Design Charts 111-16to 111-16/2 present crest pressures for H/~ values of 0.50, 1.00, 1.17, 1.33, plots of and 1.50. The charts are based on recent ES 801 test data* for crests with and with- out piers: Chart 111-16represents pressures on crests without piers; Chart 111-16/1, pressures midway between piers; and Chart 111-16/2, pres- sures adjacent to piers. Piezometers used for measuring the last condition were located immediately adjacent to the pier face. 2. The data shown are applicable to high overflow dams with standard crests. Data are plotted in terms of the dimensionless factors, pressure divided by design head (hp/Hd) and horizontal distance divided by design head (X/Hal),to permit ready conversion to any selected design head. Pres- sures for intermediate head ratios can be obtained by plotting hp/~ ver- sus H/Hal for a given X/Hal . 3* It is recommended that the spillway design head ~ be selected so that the minimum crest pressure for the maximum expected head H be no lower than -20 ft of water to ensure cavitation-free operation. -— * U. S. Army Engineer Waterways Experiment Station, CE, Investigations of Various Shapes of the Upstream Quadrant of the Crest of a High Spillway; Hydraulic Laboratory Investigationz by E. S. Melsheimer and T. E. Murphy. Research Report H-70-1, Vicksburg, Miss., January 1970. - 111-16to 111-16/2 Revised 3-55 Revised 9-70

Welcome message from author
This document is posted to help you gain knowledge. Please leave a comment to let me know what you think about it! Share it to your friends and learn new things together.
Transcript

HYDRAULIC DESIGN CRITERIA
SHEETS 111-16TO 111-16/2
HIGH OVERFLOW DAMS
CREST PRESSURES
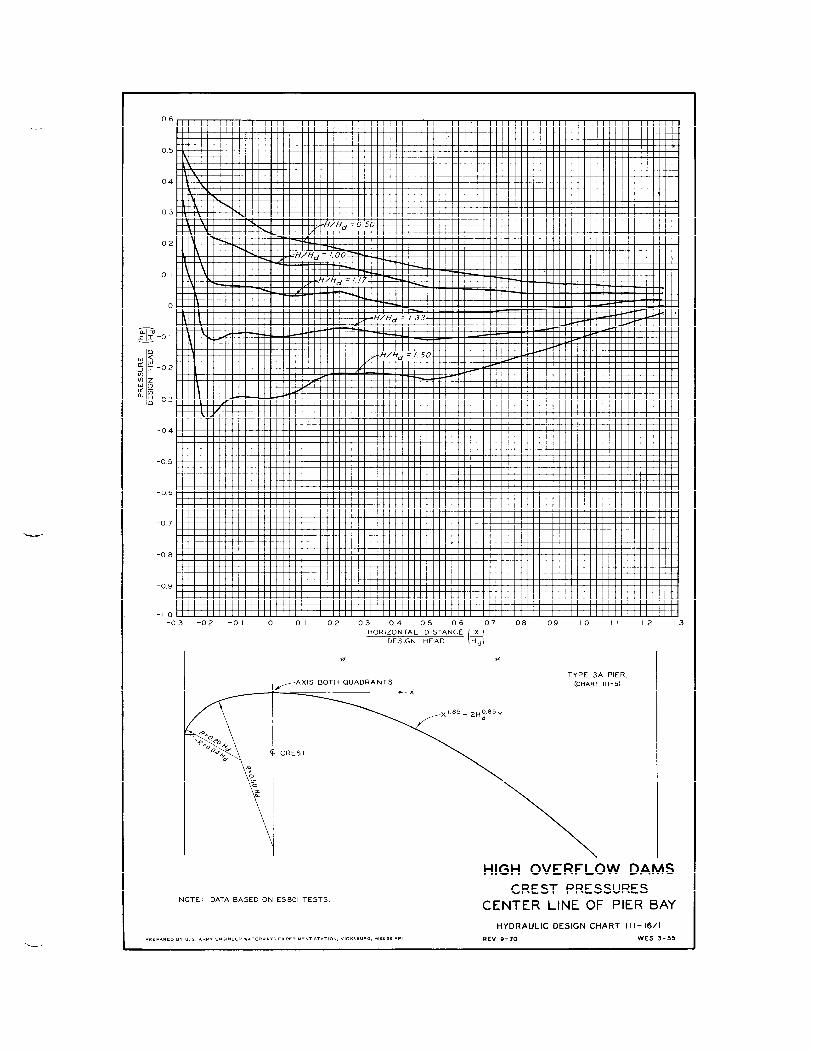
1. Hydraulic Design Charts 111-16to 111-16/2presentcrest pressures for H/~ values of 0.50, 1.00, 1.17, 1.33,
plots ofand 1.50.
The charts are based on recent ES 801 test data* for crests with and with-out piers: Chart 111-16represents pressures on crests without piers;Chart 111-16/1,pressures midway between piers; and Chart 111-16/2,pres-sures adjacent to piers. Piezometers used for measuring the last conditionwere located immediately adjacent to the pier face.
2. The data shown are applicable to high overflow dams with standardcrests. Data are plotted in terms of the dimensionless factors, pressuredivided by design head (hp/Hd) and horizontal distance divided by designhead (X/Hal),to permit ready conversion to any selected design head. Pres-sures for intermediate head ratios can be obtained by plotting hp/~ ver-sus H/Hal for a given X/Hal .
3* It is recommended that the spillway design head ~ be selectedso that the minimum crest pressure for the maximum expected head H be nolower than -20 ft of water to ensure cavitation-free operation.
-—
* U. S. Army Engineer Waterways Experiment Station, CE, Investigations ofVarious Shapes of the Upstream Quadrant of the Crest of a High Spillway;Hydraulic Laboratory Investigationz by E. S. Melsheimer and T. E. Murphy.Research Report H-70-1, Vicksburg, Miss., January 1970.
-
111-16to 111-16/2Revised 3-55Revised 9-70

I
06
05
04
03
02
01
0
‘-01
-02
-03
-04
-05
-06
-07
-08
-0.9
-lo-(
k; ! 1 I I I I 1 , I I 1 I I , , I I I I I I I 1 I 8 1 I I , I I , , I t t , , , , , , , , , ,, ( r , , , , , I I , , I , , I I I 1 I I I I I
L ..
‘a ---- 1 , , )
1 1 I ( 1 1 xl 1 1 1 1 1 1 v) I I [i 1 I I I Ii I I I I [I
I III I
I I I I II I I I I Iilllk+#?t-
1
l!ultl!
1 I I I I II
I I [
, ,I #w. 1 11 1 $ 1 ! , 1 1 1 [ 1 1 1 1 1 1 1 c 1 , 1 1 $ 1 1 1 1 1 I t 1 1 I I I I , , I I , , , I ) I I , , I , t , I , , , —-! ,r , 1+
~,’, !,! !’,’.’.1 I I I I I I I I I I I I I 1 I I I 1 I I I Id-w-r I I
\ t l-f/H~=///+J 1 1 1 1 1 1 1 1 1 I I , , t , -1 , . ,
/ -
\ I ! !]i!! ! ! Hll&+--“ “cl-l
4“x 1,
i ff/fi’d = / ~~+, I I I I I I I I I I ) I I I I I I u-r I 1 I 1- 0 “I I I I I I I L f ——. —. . ——————. ————
I / ,“ IIN!I I I I I I I !w -1 1 rI I I ill 1X1 I 1 I I I I
)3 -02 -o I o 01 02 03 0.4 05 06 07 08 09 10 11 1.2 1.3HORIZONTAL DISTANCE X
DESIGN HEAD [1~
F’=2H’85Y
NOTE. DATA BASED ON ES801 TESTS
HIGH OVERFLOW DAMSCREST PRESSURES
NO PIERS
HYDRAULIC DESIGN CHART 111-16
PREPARED BY u s ARMY ENGINEER w#. TERw AYS Experiment sTATION, VICKSBURG, MISSISSIPPI REV 3-55, 9-70 WES 9-54
06
05
04
03
02
01
0
Iz-iiIr-ol—
-04
-05
-06
-07
-08
-09
-1 0-03 -02 -o I o 01 02 03 0.4 05 06 07 08 09 10 II 1.2
HORIZONTAL DISTANCE
()
&
DESIGN HEAD Hd
1.3
HIGH OVERFLOW DAMS
CREST PRESSURESNOTE. DATA BASED ON ES801 TESTS
CENTER LINE OF PIER BAY
HYDRAULIC DESIGN CHART 111-16/1
PREPARED BY u s ARMY ENGINEER WATERWAYS EXperiment STATION, VIc K5i3u RG, MISSISSIPPI REV 9-70 WES 3-55

=.>.
-—
06
05
04
03
02
0. I
o
ii%11-01—
!3~ az m 02~ s-ln
: 5K ~
n g-03
-04
-05
-06
-07
-08
-0.9
-lo-03 -02 -o I o 0.1 0.2 03 0.4 05 06 07 08 09 I .0 II I .2 1.3
HORIZONTAL DISTANCE
1)
~
DESIGN HEAD Hd
TYPE 3A PIER
AXIS BOTH QUADRANTS (CHART 111-51
w
HIGH OVERFLOW DAMSCREST PRESSURES
NOTE DATA BASED ON ES801 TESTS ALONG PIERS
HYDRAULIC DESIGN CHART 111-16/2
PREPARFD BY U S ARMY ENGINEER WATERWAYS EXPERIMENT STATION, VICKSBURG, MISS15SIPP( REV 9-70 WES 3-55

.- HYDRAULIC DESIGN CRITERIA
●SHEET’111-17
HIGH OVERFLOW DAMS
PRESSURE RESULTANTS
1. In certain stability problems it is desirable to determine theactual pressure forces acting on the upstream face of the dam rather thanto assume straight-line pressure distribution near the crest. HydraulicDesign Chart 111-17 presents a plot of experimental data showing pressuredistribution in terms of the design head. The data pre ented are based on
rCW 801 tests for crests without piers and on USBR tests 1, of pressures ona sharp-crested weir for H/Hal= 1.00. The location and magnitude (in termsof the design head) of three resultants based on integration of the pres-sure plot between the limits of O < y < 1.5 Hd are also shown. The cross-hatched area (RI) is a pressure reduction to be applied to the normallyassumed pressure acting on the vertical face of the dam. Sufficient pres-sure data on the vertical face are not available to allow computation ofthe resultant (Rl) for H/Halvalues of 0.50 and 1.33. R2 is the verticalpressure resultant effected by flow over the curved surface of the crest.R3 is the horizontal pressure resultant effected by the flow downstreamfrom the spillway crest.
‘L.
(1)“Studies of Crests for Overfall Dams, Boulder Canyon Project,”
Final Reports, Part VI, Bulletin 3, Bureau of Reclamation, 1948.
‘—
111-17Revised 8-58

+ Ha
/1I,
M.1
.oo
‘d
Hd
/
/
/
/
//
/
//p
RE
s’uR
ER
ED
UC
TIO
NA
RE
A
AS
SU
M
oU
SB
RD
AT
A❑
WE
S-
ES
801
DA
TA
RE
SU
LT
AN
TL
OC
AT
ION
RI
=12
.92
Hd
2A
YI
‘0.1
61H
d
R2=
7.55
Hd
2A
X2.
=i.2
0gH
d
R3=
5.96
Hd
2A
Y3
=0.
976
Hd
RE
SU
LT
AN
TS
AR
EIN
PO
UN
DS
PE
RF
OO
TO
FC
RE
ST
LE
NG
TH
AN
DIN
CL
UD
ES
PE
CIF
ICW
EIG
HT
OF
WA
TE
R(6
2.4
LB
PE
RC
UF
T).
NO
TE
:V
ER
TIC
AL
FA
CE
OF
DA
MU
SE
DA
SZ
ER
OD
AT
UM
FO
RH
OR
IZO
NT
AL
PR
ES
SU
RE
SU
PS
TR
EA
MF
RO
MC
RE
ST
.
MA
SO
NR
YL
INE
US
ED
AS
ZE
RO
DA
TU
MF
OR
HO
RIZ
ON
-
0T
AL
PR
ES
SU
RE
SD
OW
NS
TR
EA
MF
RO
MC
RE
ST
AN
DF
OR
VE
RT
ICA
LP
RE
SS
UR
ES
.
❑
VE
LO
CIT
YO
FA
PP
RO
AC
HN
EG
LIG
IBL
EF
OR
HIG
HO
VE
R-
FL
OW
DA
MS
.
VE
RT
ICA
LP
RE
SS
UR
EO
NC
RE
ST
m
IY
x < t- (f)
1
M~1
.85
=2.0
H40
”85Y
5
R3
HIG
HO
VE
RF
LO
WD
AM
SP
RE
SS
UR
ER
ES
ULT
AN
TS
NO
PIE
RS
HY
DR
AU
LIC
DE
SIG
NC
HA
RT
’1ll
-17
RE
vIsE
D8-
58W
ES
9-54
———_—.—
HYDRAULIC DESIGN CRITERIX
SHEETS 111-18 TO 111-18/5
SPILLWAY ENERGY LOSSES
1. An estimate of the loss of energy on the downstream face of ahigh overflow spillway may be important in the design of energy-dissipatingdevices at the foot of the spillway. If the losses are substantial, theirevaluation is desirable in order to design an economical stilling basin orto estimate the throw of a jet from a flip bucket. The problem is twofold:(a) determination of energy loss during development of the turbulent bound-ary layer, and (b) determination of energy loss in the fully developedturbulent flow. For a large head on the crest with the spillway designflow, usually only (a) need be considered. HDC 111-18 to 111-18/5 applyto the condition of turbulent boundary layer development.
2. Previous Design Criteria. It has been common practice to use theManning equation or some other open-channel equation to determine spillwayenergy losses. Gumensk~ based an analysis on the Manning equation and pub-lished a graph which has been widely used. Jansen2 proposed an empiricalequatio
fbased on Randolph’s3 observation on Madden Dam. Bradley and
Peterka published a graph which reflects spillway losses as indicated bytests on Shasta and Grand Coulee Dams. In general, the results obtainedby these methods do not agree.
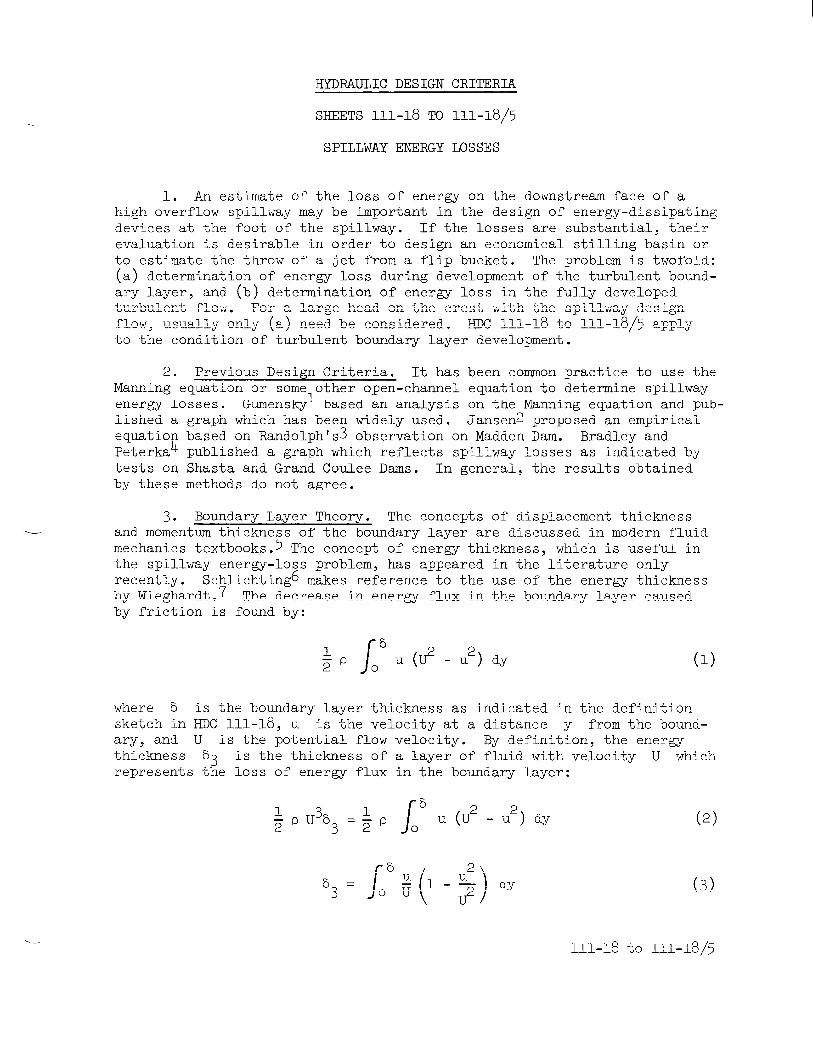
3. Boundary Layer Theory. The concepts of displacement thicknessand momentum thickness of the boundary layer are discussed in modern fluidmechanics textbooks.5 The concept of energy thickness, which is useful inthe spillway energy-loss problem, has appeared in the literature onlyrecently. Schlichting6 makes reference to the use of the energy thicknessby Wieghardt.7 The decrease in energy flux in the boundary layer causedby friction is found by:
where b is the boundary
/
6
*P $0 u ( - U2)dY (1)
layer thickness as indicated in the definitionsketch in HDC 111-18, u is the velocity at a distance y from the bound-ary, and U is the potential flow velocity. By definition, the energythickness 83 is the thickness of a layer of fluid with velocity U whichrepresents the loss of energy flux in the boundary layer:
(2)
(3)
111-18 to 111-18/5

If 63 can be estimated, the energy flux loss upstream from any point onthe s~illway face can be found from:
Division of equationthe specific weight,of head:
3km‘L=2 3
(lb/see)
4 by qy , where q is the unit discharge andresults in defining the energy loss in terms of
2
6.UJ
%3
= 2gq(feet of head)
where g is the acceleration due to gravity. The evaluation of bU is discussed below. 3
(4)
y isfeet
(5)
and
4. ‘Turbulent Boundary Layer Investigations. During spillway dis-charge, the turbulent boundary layer continues to develop until it reachesthe free-water surface or until ~he flow enters the energy dissipator atthe toe ofcorrelatedroughness.reanalyzed
the structure. Bauerb>g made extensive laboratory tests andboundary layer thickness and development length (X) with surfaceHis analysis included limited protot~e data.lo KeuleganllBauer’s data and proposed the equation
6 ()++
Y = 0.96 ~
where X is the distance from an assumed origin and k is the absolutesurface roughness height.
(6)
839 data, Keulegan s5* Spillway Energy Losses. A study of Bauer’s , 11
reanalysis, additional prototype dat ,128
and photographs* has been made bythe Waterways Experiment Station13~1 to develop design criteria for esti-mating spillway energy losses. This study resulted in the curve given inHDC IH-18 which is applicable for estimating the boundary layer thicknessin flows over spillways. The equation of the curve is:
6
()
-0.233
c= 0.08 ; (7)
where L is the length along the spillway crest from the beginning of thecrest curve (HDC 111-18). A roughness k value of 0.002 ft is recommendedfor concrete.
* Unpublished photographs by the U. S. Army Engineer District, Vicksburg,Miss., of flow over the spillway of Arkabutla Dam, Coldwater River,Mississippi.
111-18-tO111-18/5
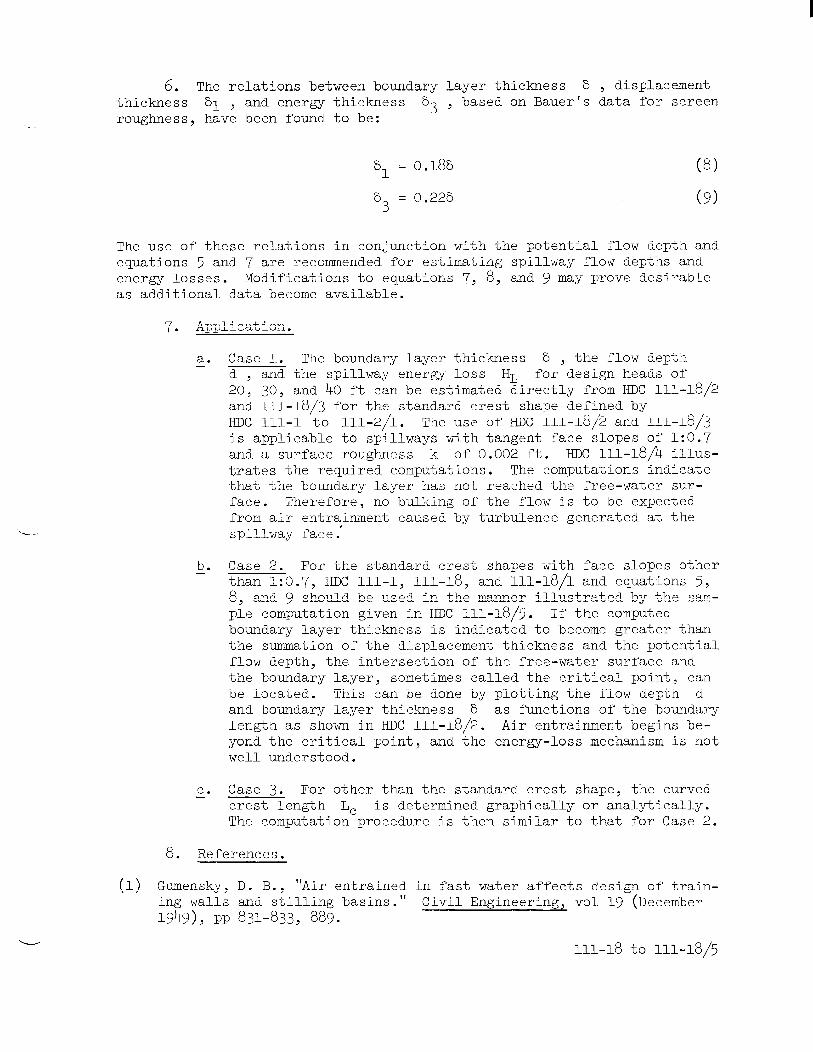
6. The relations between boundary layer thickness b , displacementthickness 51 , and ener~ thickness 53 , based on Bauer’s data for screenroughness, have been found to be:
5 = 0.2253
(9)
The use of these relations in conjunction with the potential flow depth andequations 5 and 7 are recommended for estimating spillway flow depths andenergy losses. Modifications to equations 7, 8, and 9 may prove desirableas additional data become available.
7. Application.
a. Case 1. The boundary layer thickness 5 , the flow depth—, and the spillway energy loss HL for design heads of
~0, 30, and 40 ft can be estimated directly fromHDC 111-18/2and 111-18/3 for the standard crest shape defined byHDc 111-1 to 111-2/1. The use of HDC 111-18/2and 111-18/3is applicable to spillways with tangent face slopes of 1:0.7and a surface roughness k of 0.002 ft. HDC KL1-I-8fl illus-
trates the required computations. The computations indicatethat the boundary layer has not reached the free-water sur-face. Therefore, no bulking of the flow is to be expectedfrom air entrainment caused by turbulence generated at the.spillway face.
b. Case 2. For the standard crest shapes with face slopes other—than 1:0.7, HDC 111-1, 111-18, and 111-18/I- and equations 5,8, and 9 should be used in the manner illustrated by the sam-ple computation given in HDC 111-18/5. If the computedboundary layer thickness is indicated to become greater thanthe summation of the displacement thickness and the potentialflow depth, the intersection of the free-water surface andthe boundary layer, sometimes called the critical point, canbe located. This can be done byand boundary layer thickness 6length as shown in HDC 111-18/2.yond the critical point, and thewell understood.
plotting the flow depth das functions of the boundaryAir entrainment begins be-energy-loss mechanism is not
c. Case 3. For other than the standard crest shape, the curved—crest length Lc is determined graphically or analytically.The computation procedure is then similar to that for Case 2.
8. References.
(1) Gumensky,ing walls
1949), PP
D. B., “Air entrained in fast water affects design of train-and stilling basins.” Civil Engineering, vol 19 (December831-833, 889.
111-18to 111-18/5

(2) Jansen, R. B., “Flow characteristics on the ogee spillway.” ASCEHydraulics Division, Journal, vol 83 (December 1957), pp 1452-1 to1452-11. ._.
(3) Randolph, R. R., Jr., “Hydraulic tests on the spillway of the MaddenDam. “ Transactions, American Society of Civil Engineers,(1938), pp 1080-1112.
Vol 103
(4) Bradley, J. N., and Peterka, A. J., “Hydraulic design of stillingbasins.” ASCE Hydraulics Division, Journal, vol 83, HY 5 (October1957), pp 1401-1 to 1406-17.
(5) Rouse, Hunter, Advanced Mechanics of Fluids. John Wiley & Sons, Inc.,New York, N. Y., 1959.
(6) Schlichting, H., Boundary Layer Theory. English translation by
J. Kestin. McGraw-Hill Book Co., Inc., New York, N. Y., 1960.
(7) Wieghardt, K., “Ueber einen Energiesatz zur Berechnung laminarerGrenzschichten (Concerning an energy principle for calculation oflaminar boundary layer).” Ingenieur-Archiv, vol 16 (1948), p 231.
(8) Bauer, W. J., The Development of the Turbulent Boundary Layer onSteep Slopes. A dissertation submitted to State University of Iowa,August 1951.
(9) “Turbulent boundary layer on steep slopes.” Transactions,American S~ciety of Civil Engineers, vol 119 (1954), pp 1212-1233.
.—
(10) Hickox, G. H., “Air entrainment on spillw~ faces.” Civil Engineering,vol 15 (December 1945), pp 562-563.
(11) U. S. Army Engineer Waterways Experiment Station, CE, TurbulentBoundary Layer Development on Spillways, by G. H. Keulegan. Miscel-laneous Paper No. 2-587, Vicksburg, Miss., July 1963.
(12) Michels, V., and Lovely, M., “Some prototype observations of airentrainment flow.” Proceedings, Minnesota International HydraulicsConvention (August 1953), pp 403-414.
(13) U. S. Army Engineer Waterways Experiment Station, CE, A Study ofSpillway Energy Losses During Development of the Turbulent BoundaryLayer. Miscellaneous Paper No. 2-642, Vicksburg, Miss., April 1964.
(14) Office, Chief of Engineers, Department of the Army, Engineering andDesign; Hydraulic Design of Spillways. Engineer Manual EM 1110-2-1603,Washington, D. C., March 1965.
111-18-tO111-18/5 .

‘-----
L
0.100
0.080
0.060
0040
0.020
&L
0010
0.008
0.006
0,004
0.002
0.0012 x 10” 3 4 6 8 104 2 3 4 6 8 10=
~K
—
L
DEFINITION SKETCH
PREPARED BY U, S ARMY ENGINEER WATERWAYS EXPERIMENT STATION, VICKSBURG MISSISSIPPI
6= BOUNDARY LAYER THICKNESS, FT
L= SURFACE LENGTH, FT
K= ABSOLUTE SURFACE ROUGHNESSHEIGHT, FT
OVERFLOW DAMSHIGH
SPILLWAY ENERGY LOSSBOUNDARY LAYER DEVELOPMENT
HYDRAULIC DESIGN CHART 111-18
WES 1-66

3.5
NOTE CURVE APPLICABLE TO CREST SHAPE
DEFINED BY HDC Ill-1 TO 111-2/1.
3.0
i
2.5 i ‘
/ ‘
2.0 / ‘
r
/ ‘
1.5
/ ‘
A
{
1.0
/ ‘
/ /
/
1-
0.5 A
UPsr REAM WAD RANT LENGT H = o.3f 5 #(i
DEFINITION SKETCH1 , t , , t
0.00.0 0.5 1.0
+1.5 2.0
x2.5
~
NOTE: Lc = LENGTH ALONG CURVED CREST, FT
x = HORIZONTAL COORDINATE, FT
Hd = SPILLWAY DESIGN HEAD, FT
HIGH-OVERFLOW DAMS
SPILLWAY ENERGY LOSSSTANDARD CREST LENGTH
HYDRAULIC DESIGN CHART 111-16/ I
PREPARED SY u s ARMY ENGINEER WATERWAYS EXPERIMENT s7AT10N, VICKSBURG, MISSISSIPPI wES 1-66—

30
20
I [ I I I I I I I I
I
<a#>+++..*________k-----i
r—‘}--#--- ‘“- --‘wI I I I I I I I I NJ [,.—. — -——-
4.-+- . ..
+ I 4-- -w !-- ,x ----- ..-
. . . . . - . .
3 l-+! 1 1 1 1 1 s I 1 1 1 1 1%
—.——. —. .—-.
f I I [ I I I [ I— .—. — .—— —- —...—— —. .—.
I / I I [.-_. —_ —.— _— _ . .
-.,1 I 1,
1/1 -_-_---t-–---+ “---- P++ -tt-- ‘-- -
dOR
61
I .-.— ,
I .—+ ...-— 1
I f—.—— —— . .
{ .—-t x
2 -“: I /,.—-——.
I ./ 1---T L 1 1
—-
- +—-—— -–- – - -–
—.—. . ——.—
,1 1 I P- I I
I_iiiiiiiii iiiI
1’ I A I
‘-
---- .,- ,., -.OW DEPTH, FT
e = BOUNDARY LAYER THICKNESS, FT
6, = DISPLACEMENT THICKNESS, FT
U ❑ POTENTIAL VELOCITY, FPS.,. -
~ = POINT VELOCITY, FPS
3
L = TOTAL LENGTH TO SECTION, FT ‘~~ :
HA = SPILLWAY DESIGN HEAD, FT
I I I I I
~ -+--—” ‘1-- ,- .--- .,,_- - _,, - .,--------. -1
Ibllt *f! I I I [ [ 1 1 1 1 ‘ tF+--+ “—---i ‘ K = AM> WLUIL KVUbli NL3>, t I . . i
L
NOTE: CURVES APPLICABLE TO STANDARD
1SPILLWAY CREST CHDC II I-I TO 111-2z I)WITH 1:0.7 TANGENT FACE SLOPE.
DEPTH (d) IS POTENTIAL FLOW DEPTHPLUS DISPLACEMENT THICKNESS.
d
t6 L HIGH - OVERFLOW DAMS
SPILLWAY ENERGY LOSSSTANDARD CREST
t 6 LOCATION OF CRITICAL POINTDEFINITION SKETCH
HYDRAULIC DESIGN CHART 111-18/2
PREpARED BY u s ARMY ENGINEER WATERWAYS EXperiment STATION, VICKSWURG, MISSISSIPPI WES I -66

----
HL
L
LEGEND
HL=ENERGY HEAD LOSS, FT
L =TOTAL LEN GTHTOSECTION, FT
Hd ‘SPILLWAY DESIGN HEAD, FT
HIGH- OVERFLOW DAMS
SPILLWAY ENERGY LOSSSTANDARD CRESTFACE SLOPE 1:0.7
HYDRAULIC DESIGN CHART II 1-18/3
PREPARED BY U 5 ARMY ENGINEER WATERWAYS EXPERIMENT STATION VICKSBURG, MISSISSIPPI WES I -66

GIVEN:
Hd = 30 ft
H = 250 ft
k = 0.002 ft (Surface roughness)
Face slope = 1:0.7
COMPUTE:
1. Boundary Geometry
a. Length of curved crest, L ~
x,—= 1.67 (HDC 111-1)Hd
Lc—= 2.50 (HDC 111-18/1)Hd
LC = 2.50Hd = 75.0 ft
b. Length of tangent, L~
Y,—- 1.32 (HDC 111-1)Hd -
Y, = 1.32Hd =39.6 ft
Y2 -Y, =250 -39.6 =210.4ft
x2 -X,=%(Y2-Y, ) = 147.3 ft
!Hd
H 11
Y
0.7
2. Hydraulic Computation
a. Spillway energy loss, H~
For L = 331.9 ft and Hd =30 ft
H~ = 20.0 ft (HDC 11 1-18/3)
b. Energy head entering stilling basin, Hb
Hb=H+Hd-HL
=250+ 30-20 =260ft
c. Depth of flow, d, and boundary layer
thickness, 8, at PC of toe curve
d = 5.30 ft (HDC 11 l-18\2)
8 = 1.62 ft (HDC 11 1-18/2)
LT = ~(210.4)2 + (147.3)2
= 256.9 ft
c. Total crest length, L
L= LC+LT
= 75.0 + 256.9 = 331.9 ft
Note: Computed H ~ is satisfactory and no
bulking of flow from air entrainment
since 8< d.
HIGH OVERFLOW DAMS
SPILLWAY ENERGY LOSS
SAMPLE COMPUTATIONFACE SLOPE I :0.7
PREPARED BY U S ARMY ENGINEER WATERWAYS EXPERIMENT STATION, VICKSBURG, MISSISSIPPI
HYDRAULIC DESIGN CHART I II -18/’4
WES 1-66.

GIVEN:
Hd ==30 ft\ H = 350 ft
k = 0.002 ft (Surface roughness)
Face slope = 1:0.78
COMPUTE ENERGY HEAD
ENTERING STILLING BASIN:
1. Boundary Geometry
a. Length of curved crest, LC
$= 1.47 (HDC 111-1)
d
; = 2.15 (HDC 111-18/1)d
LC = 2.15Hd = 64.5 ft
b. Length of tangent, LT
Y,
~ = ‘“04 (HDC “’-’)
Y, = 1.04Hd =31.2 ft
Yz -Y, =350 -31.2 =318.8ft
Tana. ~. 1.2821
sin a= ().7885Y* -Y,
LT =Sin Ct
= 404.4 ft
c. Total crest length, L
L= LC+LT
= 64.5 + 404.4= 468.9 ft
2. Hydraulic computation
------
a.
b.
c.
Boundary layer thickness, 8
L 468.9~=~= 2.344 X 10⁵
U -0.233
& 0.08 ; (HDC 11 1-18)
= 0.08 (0.0561)
= 0.00449
8=2.loft
Energy thickness, 83
83 =0.228(Eq 9, sheets 111-18 to 111-18/5)
==0.462 ft
Unit discharge, q
q = Cti~’2C = 4.03 (HDC 111-3)
q = 4.03 (30)3/2 = 662 cfs
Note: Computed Hb satisfactory and no bulking
of flow from air entrainment since 8< d.
L- PREPAREDBYuS ARMY ENGINEER WATERWAYS EXPERIMENT STATION, VICKSBURG, MISSISSIPPI
d.
e.
f.
9
I ‘d
1H IY 1
0.78
x
Potential flow depth
PC of toe curve
dP and velocity U at
H .d COSU+UJTp 2g
COS a= 0.6150
HT=H+Hd =350+ 30=380ft
By trial
upu —
2g
(ft) l–(ft)—
156.0 377.9
155.9 377.4
(ft)
2.1
2.6
(jP =
-’---upH -—
T 2g
0.6150
(ft)—
3.41
4.23
(Cfs)
532<662
659 = 662
Spillway energy loss
8 usHL= fi(Eq 5, sheets 111-18 to 111-18/5)
0.462 (155.9)3 = A, ft.64.4 (662)
Energy head entering sti Iling basin
ti#-i+tid-ti L
=350+ 30-41 =339ft
Depth of flow, d, at PC of toe curve
d=dp +8,
8, = 0.188 (Eq 8, sheets 111-18 to 111-18/5)
= 0.18 (2.10) = 0.38 ft
d =4.23 + 0.38 =4,61 ft
HIGH OVERFLOW DAMS
SPILLWAY ENERGY LOSS
SAMPLE COMPUTATIONFACE SLOPE I I0.78
HYDRAULIC DESIGN CHART I I I - 18/5
wES 1’66

.—
HYDMUTJC DESIGN CRITERIA
SHEETS 111-19To 111-19/2
HIGH OVERFLOWDAMS
-
SPILLWAY CREST WITH OFFSETS
Cl%lLSTSHAPES
AND RISERS
10 Purpose. Use of spillway crests with offsets and risers mayeffect appreciable economies in the construction of concrete gravity spill-ways provided the concrete mass eliminated from the standard crest shapedefined in HDC 111-1 to 111-2/1 is not required for structural stability.The scheme has also been adopted for the high arch dam Monteynard.lHDC 111-19 to 111-19/2 shotid serve for developing crest shapes for prelim-inary economic studies. It is suggested that the final spillway shape bemodel-tested.
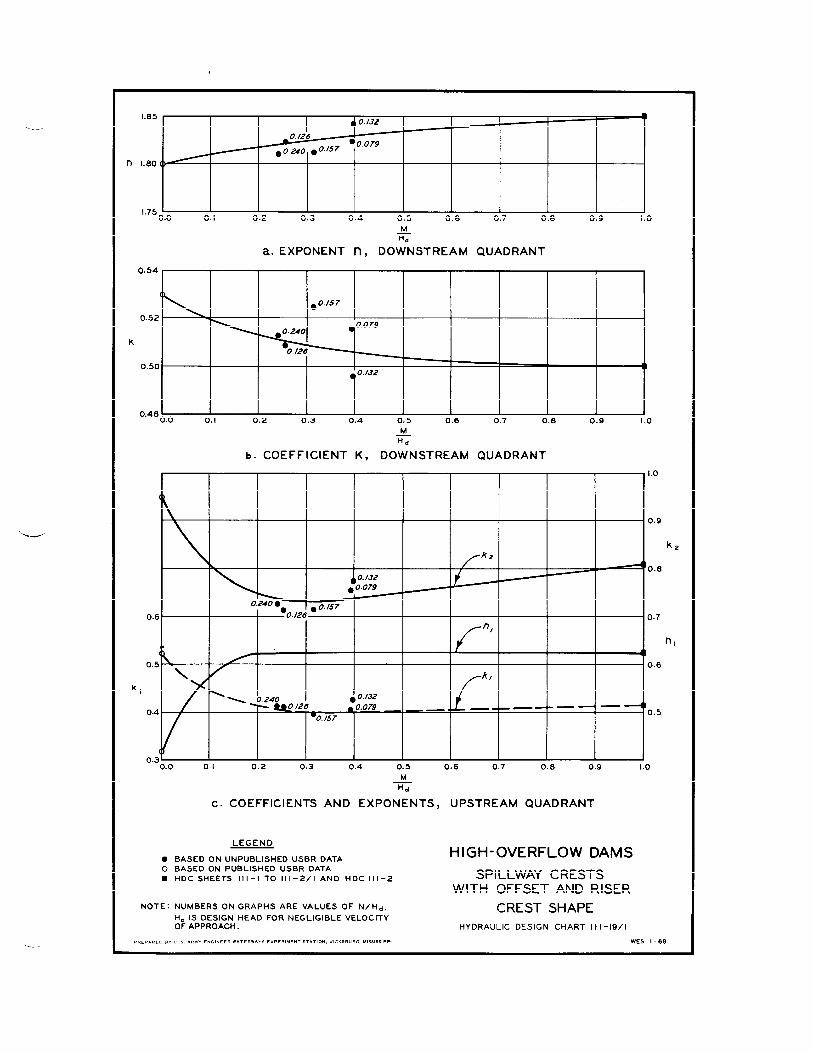
2. Background. A laboratory study of overhanging crests produced byan offset in a sharp-crested weir was reported by the U. S. Bureau of Rec-lamation (USBR).2 A recent analysis of unpublished USBR test data was madeby the Waterways Experiment Station (l?ES). In this study the dimensionlessquantity of the ratio of the riser height to the head on the rounded crestM/Hd was selected as the basic shape variable. The offset dimension Ndoes not appear to be very effective until the ratio M/Kd becomes verysmall ● One limiting case is the offset weir with no riser (M = O), whichforms a 45-degree backward-sloping weir. The lower nappe of the flow overa 45-degree backward-sloping, sharp-crested weir may extend initiallyslightly upstream of the sharp crest. The other limiting case is a highspillway with no offset (N = O) described in HDC 111-1 to 111-2/1. Thetest data selected for the WES study were from experiments with negligiblevelocity of approach, a condition representative of a high dam for whichsubstantial savings in concrete would result from undercutting the upstreamface. These data were for M/lid test values of 0.240 to 0.396 havingN/Hd values of 0.079 to 0.240. The resulting M/’N values are 1.0 to 5.O.Sections having Mm values less than 0.5 are not recommended.2 The re-sults of this study are summarized in HDC 111-19 to 111-19/2 and generallydefine spillway crest geometry for riser-design head ratios ofo <M@d <1.().
3. Crest Location. The USBR lower-nappe coordinates are in terms ofthe head on the sharp-crested weir and have their origin at the weir. Fordesign purposes, it is more convenient to have the coordinates in terms ofthe head Hd on the round crest with their origin at the crest apex.HDC 111-19 gives curves for estimating the distance Xe of the round crestfrom the sharp crest and the height Ye of the round crest above the sharpcrest. The curves are in terms of the design head Hd on the round crest
and are plotted as a function of the ratio of the riser height to designhead M/Hd . The values of Xe/Hd and ye~d were feud to be 0.287 and0.166, respectively, for the limiting case of M/Hd=O. HDc 111-2/1
111-19tO 111-19/2

gives values of 0.2T0 and 0.126 for Xe~ and
the case of M/Hd ~ 1.0 . These limiting casesand were used as guides in defining the generalin the chart.
ye~ , respectively, forare plotted in HDC 111-19shape of the curves given
4. Downstream Quadrant. The standard form of the equation for thedownstream quadrant with the head on the round crest is:
Yn
()—=K$‘d d
(1)
Values of the constant K and the exponent n for various ratios of M@dwere determined graphically and by electronic computer. Values of n andK resulting in best correlation with the basic data are plotted in graphsa and b in HDC 111-19/1. Data points appropriate for the limiting casesdiscussed in paragraph 3 are also shown. The vertical-face spillway de-fined in HDC 111-1 has n and K values of 1.85 and 0.50, respectively.It is reasoned that the values of n and K shotildapproach these limitsasymptotically as the riser height M becomes larger in relation to thedesign head Hd .
5. Upstream Quadrant. The standard form of the equation defined inHDC 111-1 to 111-2/1 for the upstream quadrant of the vertical-face weirwas used as a basis for the case of weirs with offsets and risers:
(2)—
The subscript w refers to the sharp-crested weir. The conditions estab-lished for developing the exponents and constants of the equations included:
a.
b.
c.
d.
dYwCurve slopes — of zero at the round crest and of infinity
%
at the sharp-crested riser for the selected values of ‘e/Hdand ye/Hal “
For M@d values > 0.24, the exponent nl of the first termhas the value of 0.625developed for the vertical-face weirusing relaxation data of McNown and others3 discussed inHDc 111-1 to 111-2/1.
The exponent n of the second term is the same as thatdeveloped for the downstream quadrant.
The constants K1 and ~ developed to provide a reasonablefit to the experimental data.
6. Computed values of exponents and constants for equation 2 basedon the selected USBR data are plotted in graphs a and c in HDC 111-19/1.The plotted points meet the conditions established in paragraph 5.
111-19 tO 111-19/2 -—
‘=.-
7. Application. The crest shape defined in HDC 111-1 to 111-2/1should be applicable to overhanging spillways having riser heights~o.6~ . Use of the curves in HDC 111-19and 111-19/1is suggested forpreliminary design purposes should there be design reasons for making theriser smaller than 0.6~ . The curves on these charts should be used inthe reamer indicated by the sample computation given in HDC 111-19/2. Thefinal design should be model-tested. The use of a curvature of appreciableradius to connect the riser to the sloping overhang is recommended if modeltests indicate pressure pulsations on the crest resulting from flow separa-tions around the riser.
(1)
(2)
(3)
8. References.
Bowman, W; G., “French high arch dam is all-in-one (MonteynardDam).”Engineering News-Record, vol 169 (25 October 1962),pp 30-37.
U. S. Bureau of Reclamation, “Studies of crests for overfall dams.”Boulder Canyon Project Final Reports, Part VI, Hydraulic Investiga-tions, Bulletin 3, Denver, CO1O. (1948).
McNown, J. S., Hsu, En-Yun, and Yih, Chia-Shun, “Applications of therelaxation technique in fluid mechanics.” Transactions, AmericanSociety of Civil Engineers, Vol 120 (1955),pp 650-6690
‘“—
1w19 tO m-19/2

___
------
Hd
Iw
1r
Ye
M
DOWNSTREAM QUADRANT UPSTREAM
x~
iq
0.2
Ye
~ \
o. I0.0 0.2 0.4 0.6 0.8 1.0
M.
BASEDON UNPUBLISHED USBR DATA
BASEDON PUBLISHED USBR DATAHDC ill-2/l
NUMBERS ON GRAPH ARE VALUESOFN/Hd.
Hdis DESIGN HEAD BASEDON LOWERSURFACE OF NAPPE FROM SHARP-CRESTEDWEIR WITH NEGLIGIBLE VELOCITY OFAPPROACH,
PREPARED 8Y U 5 ARMY ENGINEER WATERWAYS EXPERIMENT 5TATION, VICKSBURG, MISSISSIPPI
HIGH-OVERFLOW DAMSSPILLWAY CRESTS
WITH OFFSET AND RISER
CREST LOCATIONHYDRAULIC DESIGN CHART 111-19
WESI -66
.
___
-—
-.
n
1.85
1.80 (
1.750.0 0.1 0.2 0.3 0.4 0.5 0.6 0.7 0.8 0.9 1.0
0.54
(
0.52
k
0.50
0.48000. I c
k,
(
0.6
E0“5\
0.4
0.30.0 0.1
M~
a. EXPONENT 17, DOWNSTREAM QUADRANT
.0. /57
0.079
●0.126
, ,0.132
2 0.3 0.4 0.5 0.6 0.7 0.8
Mm
COEFFICIENT K, DOWNSTREAM QUADRANTb.
:9 1.0
AZ
0.132.00.079
I0.240 ●
●0.126
g 0./57
‘l 0.240 .0.132~o.12 6 fi 0.079 . . .—— -—— ——
-0. /57
0.2 0.3 0.4 0.5
M1+~
c. COEFFICIENTS AND EXPONENTS,
LEGEND
● BASED ON UNPUBLISHED USBR DATAO BASED ON PUBLISHED USBR DATA■ HDC SHEETS 11l-1 TO 111-2/1 AND HOC II I-2
NOTE: NUMBERS ON GRAPHS ARE VALUES OF N/Hal.
Hd IS DESIGN HEAD FOR NEGLIGIBLE VELOCITYOF APPROACH.
PREPARED BY u 5 ARMY ENGINEER WATERWAYS EXPERIMENT 37 ATt0N, VICKSBURG, MISSISSIPPI
0.6 0.7 0.8 0.9
UPSTREAM QUADRANT
HIGH-OVERFLOW DAMS
SPILLWAY CRESTSWITH OFFSET AND RISER
1.0
0.9
kz
0.8
0.7
n,
0.6
0.5
1.0
CREST SHAPEHYDRAULIC DESIGN CHART I I l-19/l
WES I -66

GIVEN:
N
q= 0.25 ft
Negligible velocity of approach
COMPUTE:
1. Downstream Quadrant Equation
()
;=K + n
d d
K ==0.508, n = 1.825 (HDC 111-19/1)
()
1.825
; = 0.508 ;d d
2. Upstream Quadrant Equation
i= K+5’-KwK, = 0.405, K2 = 0.730
, = 0.6252 n = 1.825 1(HDC 111-19/’1)
n
Y ()0.625
— = 0.405 ;()
1.825
Hw-0.730 +
w w
3. Check for Zero Slope at Crest
x~= 0.282, & 0.130 (HDC 111-19)
d d
Hw=Hd+Ye =Hd+o.130Hd =l.130tid
x, x,
Hw =‘-0.250> $= , ,;; H
1.130Hd = 1.130-=0.115
jf]=Kln(~~’-1_K2~(~)nd
w
l—
k fit
4. Solve for Values Of K, and K2 Giving
xZero Slope at the Crest for & = 0.250
w
%= KG$’-KG)n0.115 = K, (0.250 )0”625 - K2 (0.250)
0.115= 0.421K, - 0.080K2
()d;w
0.625K, (0.250)-0-375x=
()d~
w
- 1.825K2 (0.2.50 )0”825 = O
1.05K, -0.583 K2=0
K, =0.554K2
1.825
(1)
Substitute Equation 2 into Equation 1
0.115 = 0.421 X 0.554K2 - 0.080K2
K2 =0.752, K, =0.416
Upstream Quadrant Equation
Y ()0,625
()
1.825
iTw= 0.416 ; -0.752 f
w w
(2)
_ 0.405 x 0.625— 0.730 x 1.825 (0,250)0825
(0.250)0$375 -
0.253
-0.5941.331 (0.319) = 0.002 * 0.000
HIGH-OVERFLOW DAMS
Note: For final design greater accuracy of
computations is recommended.
SPILLWAY CRESTSWITH OFFSET AND RISER
CREST GEOMETRYSAMPLE COMPUTATION
HYDRAULIC DESIGN CHART I I I -19/2
PREPARED BY u 5 ARMY ENGINEER WATERWAYS EXPERIMENT STATION, VICKSBURG, MIsSISSIPPIWES I -66

HYDRAULIC DESIGN CRITERIA
SHEETS 111-20 TO 111-20/1
ELLIPTICAL CREST SPILLWAY
COORDINATES
1. Previous Crest ShaDes.
a. Downstream Quadrant. The U. S. Bureau of Reclamation(USBR) (reference 6) conducted extensive experiments onthe shape of the falling nappe over a sharp-crested weir.Using these data, the U. S. Army Corps of Engineers recom-mended that the 1.85 power of X be used to define thedownstream quadrant for a high overflow spillway withnegligible approach velocity (see Chart 111-2). Again,based on USBR data (references 6 and 7), Charts 111-7through 111-10 present coordinates from the best fit of
the general equation: Xn n-1
= KHd Y for 3V on 3H, 3V on
2H, and 3V on lH upstream faces. For low ogee spillwaycrests (with 45-deg upstream face only) Charts 122-3 to122-3/5 present plots of X , Y , n , and K forvalues of the ratio of velocity head divided by designhead ha/Hal of 0.08 and 0.12 where X = horizontal coor-
dinate positive to the right; Y = vertical coordinatepositive downward; n = variable, however usually setequal to 1.85; and K = variable dependent on approachdepth.
b. Upstream Quadrant. It has long been known that, forcurving flow of the type encountered in overflow spill-ways, conditions at any point in the flow are dependentupon influences directly upstream. Early attempts to fitcircular arcs to the profile of the lower nappe of flowover a sharp-crested weir produced surface discontinuitiesat the weir crest. This problem was partially remediedthrough the use of a combination of relaxation techniquesand data fitting (references 1 and 2). Another method,the fitting of a third, short-radius arc tangent to thevertical face and the intermediate-radius arc, was modeltested at the U. S. Army Engineer Waterways ExperimentStation (WES) (reference 4) and is incorporated in Chart111-2/1. No additional criteria were available for highoverflow spillways with other than a vertical upstreamface. Curves and factors for a 45-deg upstream face lowogee crest are given in Charts 122-3/1, 122-3/4, and122-3/5.
111-20 to 111-20/1
2. Elliptical Up,stream Quadrant Model Tests. In the late 1960’s,WES conducted a study to compare performance of four commonly used up-stream quadrant design procedures (reference 4). Of the four tested,the short-radius arc method (Chart 111-2/1) and an elliptical formula ofthe following form
(1)
where A and B are the major and minor axes, respectively, of theellipse, appeared to yield the most acceptable results. In 1973 WESpublished results (reference 5) of preliminary studies done to verify adesign procedure incorporating an elliptical upstream quadrant developedfrom the USBR data of reference 6. The procedure was verified for highspillways during these tests. A comprehensive test program with a widerange of approach velocities, upstream face slopes, and head ratios wasconducted at WES from 1977 to 1982 (reference 3). For these later ex-periments P/Hd , where P is the approach depth, ranged from 0.25 to2.0, H /Hd ranged from 0.4 to 1.5, and upstream face slopes rangedfrom ve~tical to 2V on 3H.
3. Spillway Crest Coordinates: Downstream Quadrant. For highspillways where the velocity of approach can be considered negligible
(ha/Hal< 0.06), the downstream quadrant equation is that given is Chart
111-2. As the depth of approach decreases, approach velocities increaseand the spillway should become flatter to match the partially suppressedvertical contraction of the nappe. Data for sharp-crested weirs were
found to be closely fit by maintaining the form of the equation (Xn =n-1
KHd Y) with n = 1.85 and varying K with approach depth (refer-
ence 5). The K value can be determined from Chart 111-20.
4. Point of Tangency: Downstream Quadrant. Chart 111-1 is aplot of coordinates for the tangent points X/Hd and Y/Hd versus
slope function u (l/slope) for K = 2.0 . Coordinates of the down-stream tangent points, X/Hd and Y/Hd , for other K values can bedetermined from Chart 111-1 values by multiplying those values by
(K/2)1/0.85
Alternately the coordinates of the downstream tangentpoint can be”determined directly from
1/0.85
-()
X=K(2)
‘d1.85a
and
111-20 to 111-20/1—
Y ()1 x 1“85—=iziq‘d
(3)
or
()YIK1.85/0.85
‘=~ 1.85a‘d
(4)
5. Spillway Crest Coordinates: Upstream Quadrant. Model studiesindicated that the quadrant of an ellipse in which the axes systemati-cally varied with depth of approach would fit the measured data exceptthat the ellipse quadrants would extend upstream of the position of thesharp-crested weir used to generate the nappe form to become tangent tothe vertical (reference 5). This extension is more pronounced for lowervalues of P/Hd . The general equation for the elliptical upstreamquadrant is given by
(5)
where the origin of the coordinates has been translated to the crestapex and the positive y-direction is downward (see definition sketch onChart 111-20). Solving for Y , equation 5 becomes
(6)
Graphs to determine A and B , normalized by the design head‘d ‘ ‘or
various ratios of approach depth to design head P/H are given inChart 111-20. For P/Hd z 2.0 ,
dA and B become constant with values
of 0.28Hd and 0.164Hd , respectively.
6. Point of Tangency: Upstream Quadrant. If a sloping upstreamface is desirable (normally P/H= < 1.0), then the elliptical upstreamquadrant is designed for a verti~al face as discussed above and-thesloping upstream face is attached tangent to the ellipse. The coordi-nates of the upstream point of tangency (PT) are determined by differ-entiating equation 6 with respect to X and setting it equal to theupstream face slope F and solving for the X coordinate, i.e.
s
-— 111-20 to 111-20/1

where F is equal to the slope LY/flX of the upstream face. Substi-tuting f& X in equation 6 and solving for the Y coordinate gives
Y=’-* (8)
Chart 111-20/1 illustrates the computational procedure for determiningthe
(1)
(2)
(3)
(4)
(5)
(6)
(7)
coordinates of a spillway with an elliptical upstream quadrant.
7. References.
McNown, J. S., Hsu, En-Yun, and Yih, Chia-Shun, “Applications ofthe relaxation technique in fluid mechanics,” Transactions, Ameri-can Society of Civil Engineers, vol 120 (1955), pp 650-669.
Office, Chief of Engineers, Department of the Army, Engineering andDesign; Hydraulic Design of Spillways, Engineer Manual EM1110-2-1603, Washington, D. C., March 1965.
U. S. Army Engineer Waterways Experiment Station, CE, GeneralSpillway Investigation; Hydraulic Model Investigation, by S. T.Maynord, Technical Report HL-85-1, Vicksburg, Miss., March 1985.
Investigations of Various Shapes of the Upstream Quad-rant of th~ Crest of a High Spillway ; Hydraulic Laboratory Investi-gation, by E. S. Melsheimer and T. E. Murphy. Research ReportH-70-1, Vicksburg, Miss., January 1970.
, Spillway Crest Design, by T. E. Murphy. MiscellaneousPaper No. H-73-5, Vicksburg, Miss., December 1973.
U. S. Bureau of Reclamation, U. S. Department of the Interior,Boulder Canyon Project, Hydraulic Investigations; Studies of Crestsfor Overfall Dams, Part VI, Bulletin 3, Denver, Colo., 1948.
U. S. Bureau of Reclamation, U. S. Department of the Interior,Design of Small Dams, Washington, D. C., 1973.
—
111-20 to 111-20/1

.10.0.
8.0
6.0
4.0 ‘
u
x 2.0
nauxz0:1.0 “n
0.8 “
0.6
0.4
0.2
0.15+0.21 0.23
51GN POOL
//
-—
0.25 0.27 0.29
A/Hd0.12 0.14 0.16 0.18
B/Hd
I
I
I
I
—.1
J1.90 2.10 2.30
K
/COORDINATE
PT
/
J Fs
1.0
REFERENCE: WES, SPILLWAY CREST DESIGN, BY
~cREsTAx\
T,E, MURPHY, MISCELLANEOUSPAPER H-73-5, DECEMBER 1973
(REFERENCE 5).
DEFINITION SKETCH
Hd = TOTAL HEAD
F~ = UPSTREAM FACE SLOPE
ELLIPTICAL CREST SPILLWAY
COORDINATES
COORDINATE COEFFICIENTS
HYDRAULIC DESIGN CHART 111-20
PREPARED BY U S ARMY ENGINEER WATERWAYS EXPERIMENT STATION, VICKSBURG, MISSISSIPPI WES 11-87

-_-
U.S. ARMY ENGINEER WATERWAYS EXPERIMENT STATION
COMPUTATION SHEET
JOB GS 801 PROJECT JOHN DOE SPILLWAY SUBJECT ELLIPTICAL DESIGN
COMPUTATION SPI LLWAY DESIGN
COMPUTED BY AJR DATE 10/26/82 CHECKED BY BJB DATE 11/20/82
GIVEN:APPROACH DEPTH P = 15 FT
DESIGN HEAD Hd = 25 FT
4V ON 1H UPSTREAM FACE
2V ON 3H DOWNSTREAM FACEREQUIRED:
SPILLWAY SHAPE WITH ELLIPTICAL UPSTREAM QUADRANT
COMPUTE:
1. COORDINATE COEFFICIENTS
p/Hal = 15/25= 0.6
FROM CHART 111-20 A/Hal= 0.25 B/Hal = 0.146 K = 2.04
A = 6.25 B = 3.65F~ = V/H = 4/1 = 4.0a= H/V =3/2=1.5
2. TANGENT POINTS
UPSTREAM:
A2 Fsx ‘-(AZF~Z + BZ)112
(6.25)2(4.0) = -6.184FT= ‘[(6.25)2(4)2 + (3.65)2] li2
B2= 3.65-
(3.65)2 = 3.123FTy = B - ~A2F~2 + B2)1/2[(6.25)2(4)2+ (3.65)2]lD
DOWNSTREAM:
)( +&),0s5Hd = ((1:5~1,5)’’025,25, = 17.41FT
y=(.:)8,=_l_&!)l&5= ,2,FT
3. EQUATIONS:
UPSTREAM :
‘=BWTI‘3651-(1-6:2)”?DOWNSTREAM:
)(1.85 x’ “85Y=——
x’”,,
K Hd0s5 = (2.04 )(25)0”85 = 31”469ELLIPTICAL CREST SPILLWAY
NOTE: ATTACH UP- AND DOWNSTREAM COORDINATESFACES AT TANGENT POINTS.Y POSITIVE DOWNWARD.
CREST DESIGN
HYDRAULIC DESIGN CHART 11 1-20/1
F+!EPAREDOY11S A*Y ENGINEERWATERWAYSCWElilWNT STAIION VlCK581J@G,W5SISSIPPI WES 11-S7

HYDRAULIC DESIGN CRITERIA
SHEETS 111-21 TO 111-21/1
ELLIPTICAL CREST SPILLWAY
DISCHARGE COEFFICIENTS
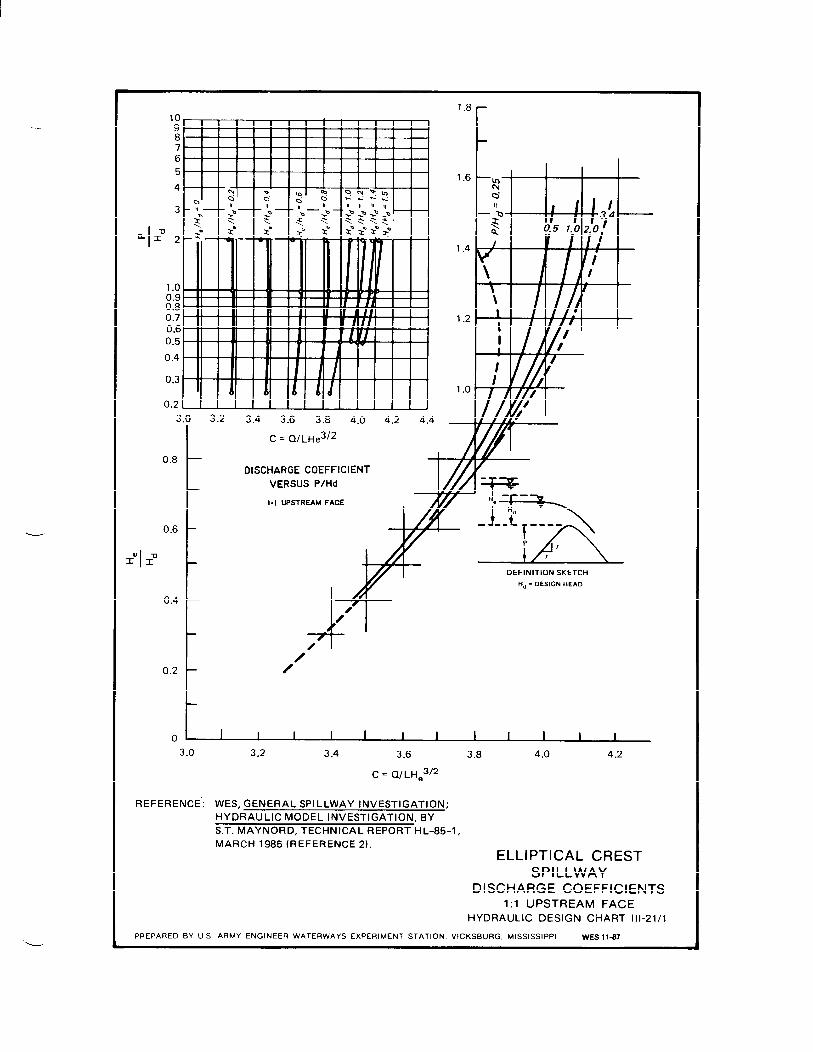
1. General. Discharge over an uncontrolled spillway crest iscomputed using the equation
Q = CL H3/2e
where
Q= total discharge, cfs
c = discharge coefficient (Chart 111-21 and 111-21/1)
L= effective crest length, ft (Hydraulic Design Sheet 111-3/1)
He = energy head on crest, ft
2. Test Data. Tests were conducted at the U. S. Army EngineerWaterways Experiment Station (wES) in 1970 (reference 1) and 1977-1980(reference 2). The later set of tests was conducted in a 2.5-ft-wideflume with a design head of 0.8 ft. Because of possible Reynolds numbereffects, measurements were not made for He less than about 0.3 ft
(He/Hal= 0.4, where‘d
is the design energy head on crest in feet).
Instead, curves were extrapolated to the theoretical value of about C =3.09 , which is the coefficient for critical flow over a broad-crestedweir (reference 3). For P/Hd = 0.25 , where P is the crest heightabove approach channel invert in feet, measurements were difficult aboveH /Hd = 1.0 due to upstream turbulence associated with a Froude numbern~ar 1.0. The kinetic energy correction factor a was assumed to be1.0 for all tests. .
3. Two separate plots of the three variable groupings involvedare provided for ease in interpolation. The curve marked 3.4 on the Cvs He/Hal plot in Chart 111-21 is identical with the curve for high
overflow dams presented in Chart 111-3. It can be considered to be the
limit above which the relative spillway height has little or noinfluence.
‘—
4. Application. Although there is a general tendency for flatterupstream slopes to result in lower discharge coefficients, ellipticalcrest data for all upstream slopes fall into two distinct envelopes:slopes less than lV on lH and slopes greater than IV on lH. See
111-21 to 111-21/1

Sheets 111-20 to 111-20/1 for a discussion of slopes used. It is recom-mended that the two families of curves shown in Charts 111-21 and111-21/1 be used directly for slopes greater or less than lV on lH, re-spectively. Charts 111-21 and 111-21/1 should also be used to developrating curves in lieu of Chart 111-3/3 which was found not to fit ex-perimental data for elliptical crest spillways. The concept of under-designing for H ~ Hd is also applicable to elliptical crest spillways
esince discharge coefficients increase beyond He/Hal= 1.0 , especiallyfor values of P/H2 above 1.0.
(1)
(2)
(3)
u
5. References.
U. S. Army Engineer Waterways Experiment Station, CE, Investiga-tions of Various Shapes of the Upstream Quadrant of the Crest of aHigh Spillway; Hydraulic Laboratory Investigation, by E. S.Melsheimer and T. E. Murphy, Research Report H-70-1, Vicksburg,Miss., January 1970.
s General SDillwav Investi~ation: Hvdraulic Model Inves-. 4 J w dtigation, by S. T. Maynord, Technical Repo~t HL-85-1, Vicksburg,Miss. , March 1985.
Brater, E. F., and King, H. W.,Solution of Hydraulic Problems,N. Y., 1976.
Handbook of Hydraulics for the6th cd., McGraw-Hill, New York,
—-
111-21 to 111-21/1

.—
‘-.
10
:76
5
4
3
2
IL X“
1.0$:0.70.6
0.5
0.4
0.3
0.2-.—3
0.8
0.6
Iz“ +’
0.4
0.2
0
~1 I I I I I3.2 3.4 3.6 3.8 4.0 4.2 4.4
D
1.8
I
1.6
I ~ IA ‘“p/Hal= 0.25 05 1.0 ~o 3.4
F,. Ill/l/
C=Q/
IISCHARGEVERS
VERTICAL UP
A’!ZT DEFINITION SKETCH
Hd = DESIGN HEAD
b
I 1 1 1 1 I I I 1 I 1 I 1 J
3.0 3.2 3.4 3.6 3.8 4.(
C = Q/LHe3/2
REFERENCE: WES, GENERAL SPILLWAY INVESTIGATION;
HYDRAULIC MODEL INVESTIGATIC)N, BY
S.T. MAYNORD, TECHNICAL REPORT HL-85-1,
MARCH 1985 (REFERENCE 2). ELL
I 4.2 4.4
PTICAL CREST
SPILLWAYDISCHARGE COEFFICIENTS
VERTICAL UPSTREAM FACEHYDRAULIC DESIGN CHART III-21
PREPARED BY U S ARMY ENGINEER WATERWAYS EXPERIMENT STATION, VICKSBURG, MISSISSIPPI WES 1147
.—109876
5
4
3
X“ 2
1.:0.80.70.60.5
0.4
0.3
0.2
1 I i I
L
3.0 3.2 3.4
0.8
0.6
II@x?’
0.4
0.2
0
—
I 1 1 1 1 1 I I I1
, , ,I I I I I I I I
I I Ii
I I I 1 1 I i I I
3.6 3.8 4.0 4.2 4.4
C = Q/ LHe3J2
DISCHARGE COEFFIC
VERSUS P/Hal
III UPSTREAM FACE
+0
0/
1.8
F
1.68Q.
1 I / /— ‘i
q i I 3.4
Q 05 1.0 2.0 ‘//
1.4
\
I\ I/l/
11 1
Ii1
II I ,
4. b_lJ—u4
‘1 II /Y/@-
:IENT
/I1.0 “
1
4 4
0,0
—
DEFINITION SKETCH
Hd = DESIGN HEAD
1 I 1 1 I I 1 I I I I I
3.0
REFERENCE:
3.2 3.4 3.6 3.8 4.0 4.2
C = Q/ LHe3/2
WES. GENERAL SPILLWAY INVESTIGATION:
HYDRAULIC MODEL lNVESTIGAT1O-N, BY -
S,T, MAYNORD, TECHNICAL REPORT HL-85-1 ,
MARCH 1985 (REFERENCE 2).
ELLIPTICAL CREST
SPILLWAYDISCHARGE COEFFICIENTS
1:1 UPSTREAM FACE
HYDRAULIC DESIGN CHART 111-21/1
PREPARED BY U S ARMY ENGINEER WATERWAYS EXPERIMENT STATION, VICKSBURG, MISSISSIPPI WEs 11-s7
--
HYDRAULIC DESIGN CRITERIA
SHEET 111-22
GATED ELLIPTICAL CREST SPILLWAY
PIER CONTRACTION COEFFICIENTS
1. Previous Criteria. See Charts 111-5 and 111-6.
2. General. See Sheets 111-20 to 111-20/1 for a description ofmodel studies conducted at the U. S. Army Engineer Waterways ExperimentStation (WES) to test elliptical crest spillway design concepts.* TwoType 3 piers were located as shown in Chart 111-22. See Chart 111-5 fora description of Type 3 pier geometry. For a vertical upstream face,the pier nose was located in the same plane as the face of the spillway,and this same horizontal distance was maintained upstream of the axis ofthe spillway crest for a lV on lH face. Measurements were taken forP/Hd = 0.25 , 0.5 , and 1.0 over a range of He/Hal values where P is
the crest height above approach channel in feet,‘d
is the design en-
ergy head on crest in feet, and H is the energy head on crest infeet.
e
3. Application. Chart 111-22 provides an estimate of pier con-traction coefficients for an elliptical crest spillway. Curves aredrawn for clarity purposes and should be used with caution since coef-ficients depend greatly on approach conditions. Further data may benecessary to confirm trends and values indicated by this figure.
-——.—.—
* U. S. Army Engineer Waterways Experiment Station, CE, General Spill-way Investigation; Hydraulic Model Investigation, by S. T. Maynord,Technical Report HL-85-1, Vicksburg, Miss., March 1985.
111-22

L.
. .
He/Hal
I
1.6
I.4
I .2
I,0
0.8
0,6
0,4
0,2
0,0
P/Hal ~erf. 1:1 CURVE
I
——
0.25 A*—
A 0 —-—0
9 u ‘–—
●o
!A D @
B q Q
\
\
\
1 t 1 I
-o. I 5 -o. I -0.05 0.0 0.05 0. I 0.15Kp
~CRESTAX/S I REFERENCE:
Ito.s’
r. I
I 1;I 2s’
I II 0.s’
I
DEFINITION SKETCHTYPE 3 PIERS (CHART III-5)
WES, GENERAL SPILLWAY INVESTIGATION;
HYDRAULIC MODEL lNVESTIGATlON, BY
S,T. MAYNORD, TECHNICAL REPORT HL-85-1 ,
MARCH 1985
ELLIPTICAL CREST
SPILLWAYPIER CONTRACTION COEFFICIENTS
HYDRAULIC DESIGN CHART 111-22
PREPARED BY U.S. ARMY ENGINEER WATERWAYS EXPERIMENT STATiON, VICKSBURG, MISSISSIPPI! WES 11-87

HYDRAULIC DESIGN CRITERIA
SHEETS 111-23 TO 111-23/3
ELLIPTICAL CREST SPILLWAY
WATER SURFACE PROFILES
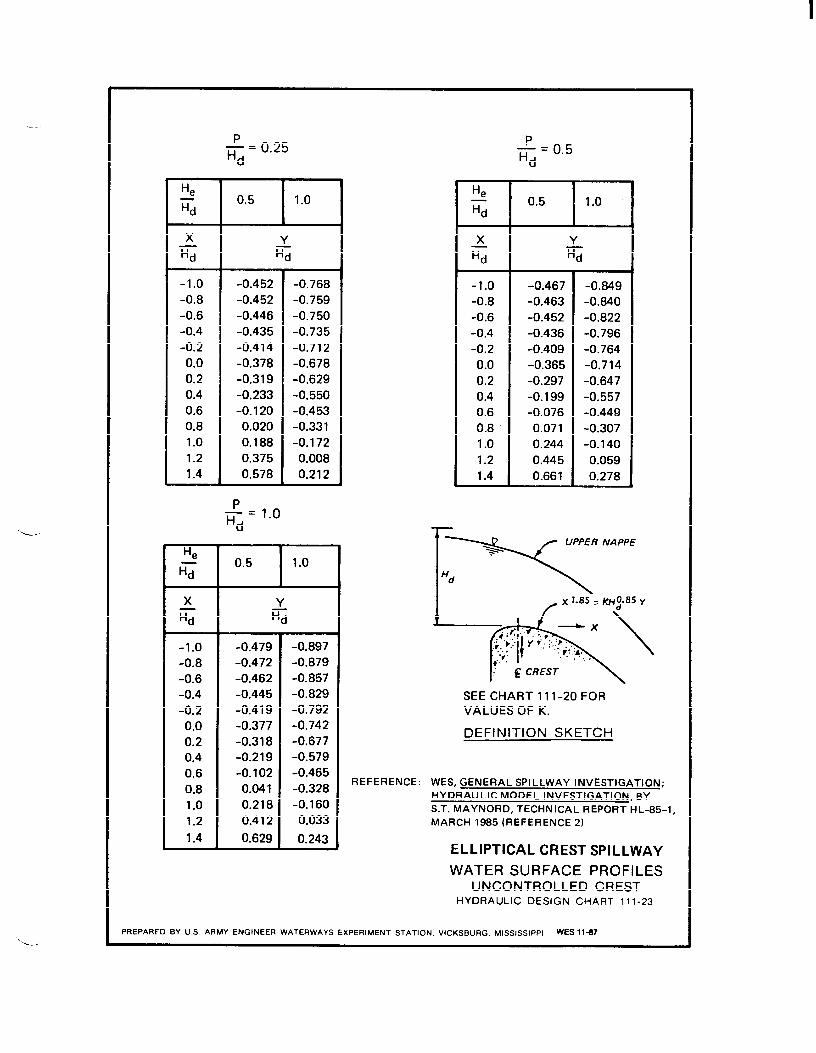
1. General. See Sheets 111-11 to 111-14/1 and 122-3/9 to122-3/10 for discussion of previous criteria and other availableinformation.
2. Model Tests. See Sheets 111-20 to 111-20/1 for general modeltest details (reference 2). Tests were conducted for both gated and un-gated crests for P/Hd values of 0.25, 0.5, and 1.0 and H /Hd valuesof 0.5, 1.0, and 1.5, where P is the crest height above ap~roach chan-nel in feet,
‘dis the design energy head on crest in feet, and H
is the energy head on crest in feet.e
3. Chart 111-23 is applicable for ungated elliptical spillwaycrest design. Charts 111-23/1 through 111-23/3 depict upper nappe pro-files along piers and in gate bay center lines for the three differentP/Hd values. See Chart 111-22 for a description of pier placement.
4* Application. Upper nappe profiles were found not to vary sig-nificantly with change in upstream face slope over the range of slopesand P/Hd values tested. For values of P/Hd other than those given,P/Hd may be plotted versus Y /Hd for constant X/Hd as demonstrated
by Rouse (reference 1). Ungated flow values of X/Hd to about 0.8 andcentral values of X/Hd for gated flow may be interpolated linearlywithout significant error.
5. References.
(1) Rouse, H., cd., Engineering Hydraulics, John Wiley and Sons, Inc.,New York, N. Y., 1951, p 530.
(2) U. S. Army Engineer Waterways Experiment Station, CE, GeneralSpillway Investigation; Hydraulic Model Investigation, by S. T.Maynord, Technical Report HL-85-1, Vicksburg, Miss., March 1985.
111-23 to 111-23/3
He
T~
-1.0
-0.8
-0.6-0.4
-0.20.0
0.20.4
0.60.8
1.01.2
1.4
-1.0-0.8-0.6
-0.4-0.20.0
0.20.4
0.60.8
1.0
1.2
1.4
P— = 0.25Hd
y_Hd
-0.452-0.452
-0.446-0.435
-0.414-0.378
-0.319
-0.233-0.120
0.0200.188
0.375
0.578
D
—= 1.0id
-0.768-0.759
-0.750-0.735
-0.712
-0.678
-0.629-0.550
-0.453-0.331
-0.172
0.0080.212
T-Y_Hd
-0.479-0.472
-0.462-0.445
-0.419-0.377-0.318
-0.219-0.102
0.0410.218
J
0.412
0.629
-0.897-0.879-0.857-0.829
-0.792-0.742
-0.677-0.579
-0.465-0.328
-0.1600.033
0.243
-1.0
-0.8
-0.6
-0.4
-0.20.0
0.2
0.40.60.8
1.0
1.21.4
P— = 0.5Hd
_lP--0.467-0.463
-0.452-0.436
-0.409-0.365
-0.297-0.199
-0.0760.071
0.244
0.4450.661
-0.849-0.840
-0.822-0.796
-0.764-0.714
-0.647-0.557
-0.449-0.307
-0.140
0.0590.278
/ UPPER NA PPE
SEE CHART 111-20 FORVALUES OF K.
DEFINITION SKETCH
REFERENCE: WES, GENERAL SPILLWAY INVESTIGATION;
HYDRAULIC MODEL INVESTIGATION, BY
S.T. MAYNORD, TECHNICAL REPORT HL-85-1,
MARCH 1985 (REFERENCE 2)
ELLIPTICAL CREST SPILLWAY
WATER SURFACE PROFILESUNCONTROLLED CREST
HYDRAULIC DESIGN CHART 111-23
PREPARFD BY U.S ARMY ENGINEER WATERWAYS EXPERIMENT STATION, VICKSBURG, MISSISSIPPI WES 11-87

.._
L.
‘d
CENTER LINE OFGATE BAY
-1.0-0.8
-0.6-0.4
-0.20,0
0.20.4
0.60.81.0
1.2
1.4
ICEYiij
-0.469-0.469
-0.464-0.454
-0.438-0.405-0.358
-0.260-0.151
-0.0180.135
0.3150.528
-0.850-0.848
-0.839-0.823-0.796
-0.758-0.715
-0.640-0.553
-0.448-0.303
-0.135
+0.045
DEFINITION SKETCH
REFERENCE: WES, GENERAL SPILLWAY INVESTIGATION;
HYDRAULIC MODEL INVESTIGATION, BY
S.T, MAYNORD, TECHNICAL REPORT HL-B5-1 ,
MARCH 1985 (REFERENCE 2)
ALONG PIERS
=_FF-1.0
-0.8
-0.6-0.4
-0.20.0
0.20.4
0.60.81.0
1.2
1.4
-0.469-0.469
-0.466-0.469
-0.488-0.414
-0.286-0.175
-0.066+0.061+0.209
+0.378
+0.577
-0.838
-0.835-0.833-0.835-0.894-0.900
-0.756-0.615
-0.471-0.311-0.139
+0.044
+0.250
LEGEND
— ~ OF BAY
---- ALONG PIERS
7.85 y
WATER SURFACE PROFILESCONTROLLED CREST
P/Hd = 0.25
HYDRAULIC DESIGN CHART 11 1-23/1
PREPARED BY U S ARMY ENGINEER WATERWAYS EXPERIMENT STATION, VICKSBURG, MISSISSIPPI WES 11-87

-—
CENTER LINE OF GATE BAY ALONG PIERS
H
~0-5 I 1-0I 1-5Ipl 0-5I 10I 1-5
YHd
-1.0-0.8-0.6-0.4-0.2
0.00.20.40.60.81.01.21.4
-0.483-0.479-0.471-0.454-0.429-0.388-0.329-0.241-0.123+().()19+o.198+().394+o.613
-0.894-0.886-0.871-0.851-0.824-0.783-0.728-0.655-0.570-0.458-0.300-0.104+().119
-1.254
-1.244
-1.229-1.208-1.183
-1.149
-1.099
-1.034
-0.951
-0.856
-0.753
-0.631
-0.426
-1.0-0.8-0.6-0.4-0.2-0.15
0.0
0.2
0.40.60.81.01.21.4
-0.483-0.481-0.477-0.480-0.467-0.450-0.356-0.252-0.159-0.0550.0810.2560.4770.672
-0.889-0.880-0.869-0.880-0.917-0.910-0.825-0.677-0.541-0.414-0.258-0.0890.1050.319
-1.257-1.248-1.233-1.243-1.338-1.373-1.324-1.176-1.029-0.885-0.735-0.566-0.383-0.188
.
I TYPE 3 PIER
(CHART ill-5)I
LEGEND
— Q OF BAY
--- ALONG PIERS
Y
DEFINITION SKETCH
REFERENCE: WES, GENERAL SPILLWAY INVESTIGATION;
HYDRAULIC MODEL INVESTIGATION, BY
S.T. MAYNORD, TECHNICAL REPORT HL-85-1 ,
MARCH 1985 (REFERENCE 2)
ELLIPTICAL CREST SPILLWAYWATER SURFACE PROFILES
CONTROLLED CRESTP/Hd = 0.5
HYDRAULIC DESIGN CHART 11 1-23/2
PREPARED BY U.S. ARMY ENGINEER WATERWAYS EXPERIMENT STATION, VICKSBURG, MISSISSIPPI WEs 11-87

..—
CENTER LINE OF GATE BAY ALONG PIERS
-1.0-0.8-0.6-0.4-0.2
0.00.20.40.60.81.01.21.4
0.5 1.0 1.5
-0.494-0.488-0.483-0.476-0.445-0.403-0.335-0.240-0.116+0.029
0.2010.4030.626
-0.939-0.925-0.913-0.888-0.855-0.808-0.743-0.666-0.573-0.454-0.291-0.086+(3.150
-1.311-1.300-1.275-1.248-1.210-1.162-1.102-1.029-0.938-0.833-0.707-0.562-0.395
TYPE 3 PIER
(CHART 11 1-5)
H
< 0.5 1.0 1.5
-1.0-0.8-0.6-0.4-0.2-0.150.00.20.40.60.81.01.21.4
-0.489-0.483-0.475-0.488-0.463-0.438-0.369-0.264-0.170-0.0630.0690.2340.4310.651
YHd
-0.933-0.925-0.918-0.931-0.935-0.915-0.829-0.695-0.571-0.441-0.298-0.1280.0650.278
-1.311
-1.300
-1.280
-1.313
-1.375
-1.383
-1.315
-1.171
-1.023
-0.882
-0.730
-0.555
-0.362
-0.140
I>
.-\
UPPER NAPPEN
‘d<
<N
\ LEGEND\
— ~ OF BAY
--- ALONG PIERS
..
REFERENCE:
PREPARED BY US
DEFINITION SKETCH
WES, GENERAL SPILLWAY INVESTIGATION;
HYDRAULIC MODEL INVESTIGATION, BY
S.T. MAYNORD, TECHNICAL REPORT HL-B5-1 ,
MARCH 1985 (REFERENCE 2)
ELLIPTICAL CREST SPILLWAYWATER SURFACE PROFILES
CONTROLLED CRESTP/l+d = 1.0
HYDRAULIC DESIGN CHART 11 1-23/3
ARMY ENGINEER WATERWAYS EXPERIMENT STATION, VICKSBURG, MISSISSIPPI WEs 11-87

.—
HYDRAULIC DESIGN CRITERIA
SHEETS 111-24 TO 111-24/10
ELLIPTICAL CREST SPILLWAY
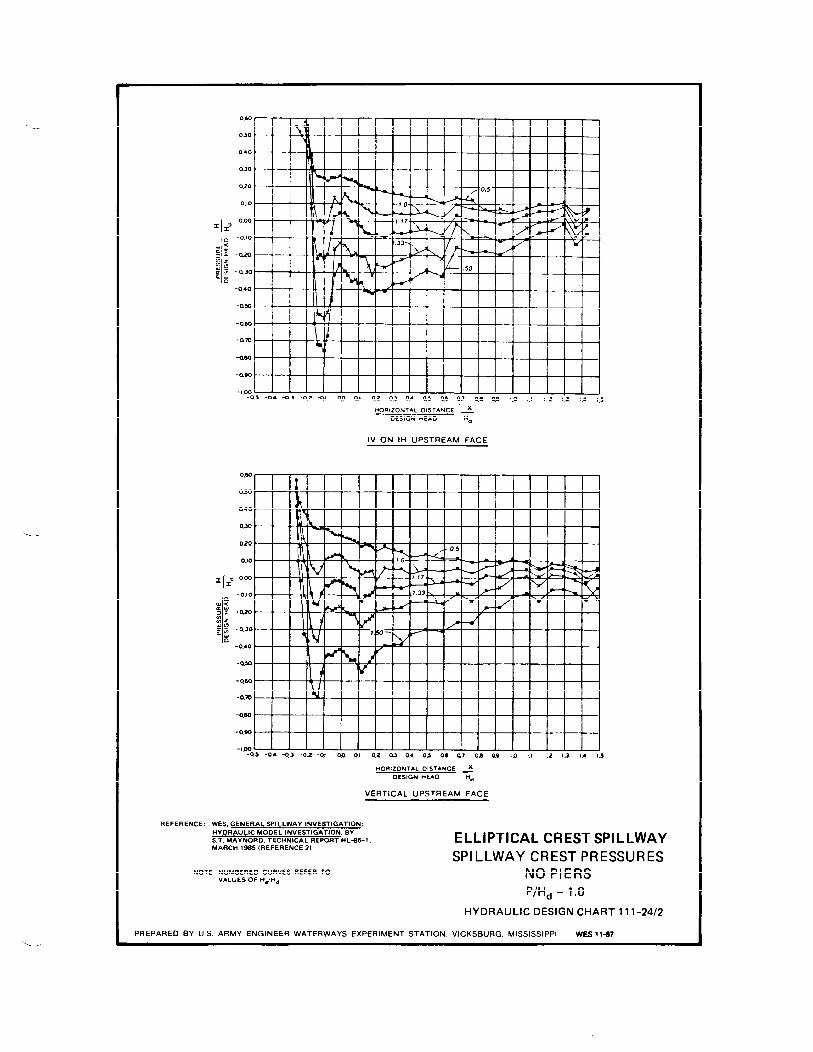
SPILLWAY CREST PRESSURES
1. Hydraulic Design Charts. Charts 111-24 to 111-24/8 presentplots of crest pressures for He/Hal values of 0.50, 1.00, 1.17, 1.33,and 1.50 and P/Hd values of 3.4, 1.0, 0.5, and 0.25 for crests withand without piers, where P is the crest height above approach channelin feet,
‘dis the design energy head on crest in feet, and H is
ethe energy head on crest in feet. Piers for P/Hd = 3.4 were Type 3A
(see Chart 111-5) with the test arrangement depicted in the insets ofCharts 111-24/7 and 111-24/8 (reference 3). Piers for all other p/Hal
values were Type 3 with the same test configuration except flume widthequalled 2.5 ft (reference 2).
2. Application. These charts apply to spillways with and withoutpiers over the given range of P/Hd values which are designed in accor-
dance with references 2 and 4 and Chart 111-20. Pressures for interme-diate head ratios can be obtained by plotting H/Hd versus He/Hal fora given X/Hd“
3. It is recommended that spillway design head‘d
be selected
so that minimum crest pressure for the maximum expected head is lessthan -20 feet of water to ensure cavitation-free operation and avoidpossible pulsating and inefficient spillway operation (reference 1) (seeChart 111-25). Chart 111-24/9 provides a suggested minimum allowablepressure design curve for an elliptical spillway crest without piers.It was constructed using maximum negative pressures for P/Hd values of0.5, 1.0, and 3.4 for vertical and lV on lH upstream faces. Chart111-24/10 provides a data summary curve for the case of an ellipticalspillway crest with piers designed as described in paragraph 1 above.Note that maximum negative pressures along the pier control the designhead limit in all spillway crest designs with piers.
4. References.
(1) Bauer, W., and Beck, E., Handbook of Applied Hydraulics, McGraw-Hill, 1969, Section 20.
..-
(2) U. S. Army Engineer Waterways Experiment Station, CE, GeneralSpillway Investigation; Hydraulic Model Investigation, by S. T.Maynord, Technical Report HL-85-1, Vicksburg, Miss., March 1985.
111-24 to 111-24/10

(3) U. S. Army Engineer Waterways Experiment Station, CE, Investiga-tions of Various Shapes of the Upstream Quadrant of the Crest of aHigh Spillway; Hydraulic Laboratory Investigation, by E. S.Melsheimer and T. E. Murphy, Research Report H-70-1, Vicksburg,Miss. , January 1970.
(4) Spillway Crest Design, by T. E. Murphy, MiscellaneousPaper H-73:5, Vicksburg, Miss., December 1973.
—
111-24 to 111-24/10

I
11’111~111-0.10 *
- Q20
- a30
-Q40 ,
-asa
-0s0
-0.m ,
+aso
-MO t
Ill I-Loo I I 1 1 I I 1 I I I I I I 1 I I J
-QS -0,4 -0.3 -Q2 -m @ QI Q2 0.3 0.4 0.5 OS 0.7 OB Q9 Ig 1,1 1.2 1.3 14 1.s
HORIZONTAL DISTANCE x
DES!GN HEAO ~
IV ON IH UPSTREAM FACE
0.60
MOd
a4 o
00
0.20 — — — I
alo
0.00 k
I Illlr%lli I T 1 >1 I I I
-0.10 ~ , \
- Q20
- OJo
-040
-am
-0.60 f
-0.m
-0.s0
-as
-Ino A
-0.5 -0.4 -0-3 -02 -Q1 Qo m 02 0.3 a4 0> 0.6 0.7 0.8 0.9 10 I.1 I .2 1.3 1.4 1.5
HORIZONTAL DISTANCE XDESIGN nEAO ~
VERTICAL UPSTREAM FACE
NOTE NuMBEREO CURVES REFER TO ELLIPTICAL CREST SPILLWAYVALUES OF lie/tid
SPILLWAY CREST PRESSURES
REFERENCE: WES, GENERAL SPILLWAY INVESTIGATION;
HYDRAULIC MODEL INVESTIGATION, BYS.T. MAYNORO, TECHNICAL REPORT HL-S5-1 ,MARCH 19S5 (REFERENCE 2)
NO PIERS
P/Hd = 0.25
HYDRAULIC DESIGN CHART 111-24
PREPARED BY U.S. ARMY ENGINEER WATERWAYS EXPERIMENT STATION, VICKSBURG, MISSISSIPPI WES11437---

Mo .
030
Q20 r
0.00
-0.$0
-Ozo
- Q30
-a40 T*
-MO~~
-Wo I
I-o.m
I-Om
-moI I
-Im----a5 -OA *3 -a2 -oJ w 0.1 a2Q30Aascief17asa9 1.0 1.1 1.2 1.3 I 4 1.s
HORIZONTAL OISTANCE xDESIGN HEAO ~
IV ON lH UPSTREAM FACE
0.60 t
0s0 ,[1 I
10.40
1
a30 ,I
0.20
0.oo
1#
- QJO
I f I ~--
0.1o }1 1
Pi
-mI 1 F-
;.50X ~ , ,!1 I I II 1
-OAO 1 4 “ I I I
/1 :-0s0 , , I
\ !! I-0.w
IJIt, 1
-am ,t
- .
I
ill i-aw I
I I I I 1,’-100 I I 1 I I I I 1 I 1 1 1 I 1 I I I I J
-0.s -OA 43 -0.2 -@ 0s 0.1 ozo.3oAo3a6a7Qa OS IOIJI.2L31.41S
HORIZONTAL OISTANCE xOESIGN HEAD ~
NOTE, NUMBERED CURVES REFER TO VERTICAL UPSTREAM FACEVALUESOF H/H~
REFERENCE WES, GENERAL SPILLWAY INVESTIGATION;
HYDRAULIC MODEL INVESTIGATION, BYS.T. MAYNORD, TECHNICAL REPORT HL-S5-1 ,MARCH 19S5 IRE FERENCE 21 ELLIPTICAL CREST SPILLWAY
SPILLWAY CREST-PRESSURESNO PIERSPIHd = 0.5
IHYDRAULIC DESIGN CHART 11 1-24/1
PREPARED BY U.S. ARMY ENGINEER WATERWAYS EXPERIMENT STATION, VICKSBURG, MISSISSIPPI WEs 11-s7‘..
—
Obo
050 ~
040 t
Q30
020 .9
010 ,
0.00 ~
-0.10 .
-a.?o
QJO ~
-0.40
-Q=
-0,60
-am \ f
-QOO
- am
-1.00-Q5 -W -0.3 -0.3 -01 0.0 al w! 0.3 a4 0.s 0.4 0.7 0.4 Q9 I.0 1.I 1.2 1.3 1.4 1.5
HORIZONTAL OISTANCE 2
DESIGN HEAO ‘d
IV ON II+ UPSTREAM FACE
0.60-
050 ~1
0.40
0.30
020 .
0.10
, 0.00
-0.10 — — —
-a30
4
-0.40 -
-0s .I F \ i “
-Q40
-0.m
4.80 r
-M@ .
-lglo~-0,s -0,4 *.3 -0.2 -01 09 0.1 0.2 a3 a4 03 !28 a? OD Q9 10 1.1 1.2 1.3 1.4 1..5
REFERENCE. WES, GENERAL SPILLWAY INVESTIGATION;
HYDRAULIC MODEL INVESTIGATION, BYS.T. MAY NORD, TECHNICAL REPORT HL-B5-1 ,MARCH 19S5 (REFERENCE 2)
NOTE NuMBERED CURVES REFER TOVALUES OF H#id
HORIZONTAL OISTANCE x
DESIGN IiEAO 7d
VERTICAL uPSTREAM FACE
ELLIPTICAL CREST SPILLWAYSPILLWAY CREST PRESSURES
NO PIERSP/Hd =1.0
HYDRAULIC DESIGN CHART 11 1-24/2
PREPARED BY U.S ARMY ENGINEER WATERWAYS EXPERIMENT STATION, VICKSBURG, MISSISSIPPI WES 1147.—

/
PR
EP
‘1 . a 2 m : a
.05
.04.
03.Q
2.O
.!0.
001
0203
0.4
0,5
0,6
0.7
0.0
091.
01,
11.
21.
314
15
HO
RIZ
ON
TA
LD
IST
AN
CE
xC
JES
IGN
HE
AD
<C
EN
TE
RL
INE
OF
BA
YV
&R
~
o 0 0 0 0
b0
I=0
n-0 I~< =W.o ,1 :Z
.o.0 g-
.0 -0 -0 -0 4 -0 -1.
.05
.04.0
3-0
2.0
100010203
0405060
.1Q
80.9
1,0
1,1
1.2
1.3
14
15
ICA
LU
PS
1
~x
DE
SIG
NH
EA
D~
AL
ON
GP
IEn
S‘R
EA
MF
AC
E—
..
0,6
0
0.5
0
0.4
0
0.3
0
0.2
0
0.1
0
‘l~m
ooo
~-0
.!0
:$
.0,2
0,
I
:z
.0.3
0.
g=
ma
~.0
.40
0
.050
-0.6
0
.0,1
0
0,8
0
.0.9
0
.I,
OQ 0.5
-0.4
.0.3
0.2
-0.1
0.0
0.!
0.2
OJ
0.4
0.5
06
01
0.8
0.9
tO
1,1
1.2
1.3
1,4
1.5
l-lO
nlZ
ON
IAl
DIS
IAN
CE
LD
ES
IGN
HE
AD
t+O
RIZ
ON
TA
LD
IST
AN
CE
X
‘dO
ES
IGN
HE
AO
~C
[NT
ER
LIN
EO
FB
AY
AL
ON
GP
IER
SE
LL
IPT
ICA
LC
RE
ST
SP
ILL
WA
YS
PIL
LW
AY
CR
ES
TP
RE
SS
UR
ES
N.1
~UP
f18E
~M@
c
RE
FE
RE
NC
EW
ES
,G
EN
ER
AL
SP
ILL
WA
YIN
VE
ST
IGA
TIO
N,
WIT
HP
IER
SH
YD
RA
UL
ICM
OD
EL
INV
ES
TIG
AT
ION
,B
YN
OT
EN
uM
8E
RE
0C
UR
VE
SB
Ef
ER
10S
,T,
MA
YN
OR
O,
TE
CH
NIC
AL
RE
PO
RT
HL
-S5-
1,P/
Hd
=0.
25V
AL
UE
SO
FM
efH
d,
MA
RC
H19
85IR
EF
ER
EN
CE
21
HY
DR
AU
LIC
DE
SIG
NC
HA
RT
111-
24/4
‘AR
ED
BY
US
AR
MY
EN
GIN
EE
RW
AT
ER
WA
YS
EX
PE
RIM
EN
TS
TA
TIO
N,
VIC
KS
BU
RG
,M
ISS
ISS
IPP
IW
Es
1147

(
=1 :1
: z :
L15.0
4.0
342
.Ot
00
0102
030405081170.1
30.O
10
11
!.2
13
1.4
1,5
HO
RIZ
ON
TA
LO
ISIA
NC
EX
—_
‘OE
SIG
NH
EA
D%
CE
NT
ER
LIN
EO
FB
AY
VE
RT
OM
050 04
0.I
—,
.—,.
..—
—.
.+.—
,,—
_,
.
I
030
r
10K
:.a
30
-0.4
0
4.5
0
-060
-oT
o
-0.8
0
-0.E
Q
-1.0
0 .OS
-0A
+3+.2
+1,1
0,0
0,1
02
0.3
04
05
06
0.7
0.0
0.9
1.0
!.1
lJ13
1.4
L5
ICA
LU
PS
1
O60
05
UIw
llll
llll
l-1
J-F
I=U
FI
“+t-t-lwtt-t-ti-t-tttt-i
010
020
010
IIIU
J:‘w
:,:
0!0
:12
0N
:r;
a~030
040
050
.060
070
080
0.9
0
.100
.05.a
4.0
302
.O.l
On
O102Q
304050607040.9
10
1.!
!,2
lJ!.
4!.
5
HO
RIZ
ON
TA
LO
ISIA
NC
Ex
——
——
DE
SIG
NH
EA
D~
AL
ON
GP
IER
S“R
EA
MF
AC
E—
—
060
050
a40
030
0.20
0.10
111=
~0.
00
I
UA
<$
y.0
.}0
:z
.0,2
0w :-
0.30
.0,4
0
.0.5
0
.060
-a70
.080
.a90
.I.ca
.0.5
-04
.O.3
.a2
-0.!
aO0.
102
030.
40.
5a6
0,?
Od
0.9
101.
1!,
2!.
31.
41.
5H
OR
IZO
NT
AL
OIS
TA
NC
EX
6E
[>IG
PJ
HE
AO
~
@4J
ER
LIN
EO
FB
AY
IVIt
iU
PS
TR
EA
MF
AC
EN
OT
EN
UM
E6E
RE
0C
UR
VE
SR
EF
ER
TO
VA
LU
ES
OF
H~H
6R
EF
ER
EN
CE
.W
ES
,G
EN
ER
AL
SP
ILL
WA
YIN
VE
ST
IGA
TIO
N;
HY
DR
AU
LIC
MO
DE
LIN
VE
ST
IGA
TIO
N,
BY
P/H
d=
0.5
S.T
.M
AY
NO
RD
,T
EC
HN
ICA
LR
EP
OR
TH
L-8
5-I
,
HO
RIZ
ON
TA
LO
ISIA
NC
EX
DE
SIG
NH
EA
OE
LL
IPT
ICA
LC
RE
ST
SP
ILL
WA
Y~
AL
ON
GP
IER
SS
PIL
LW
AY
CR
ES
TP
RE
SS
UR
ES
WIT
HP
IER
S
MA
RC
H19
85[R
EF
ER
EN
CE
Z)
PR
EP
AR
ED
BY
US
AR
MY
EN
GIN
EE
RW
AT
ER
WA
YS
EX
PE
RIM
EN
TS
TA
TIO
NV
ICK
SB
UR
GM
ISS
ISS
IPP
IH
YD
RA
UL
ICD
ES
IGN
CH
AR
T1
11-2
4/5
Ws<
11-4
37

060
II
II
050
040
030
020
q::
:
-tt
-m-t-i
.040
-0,5
0
-060
.0.7
0
-080
-0,9
0
.,M
“’%
5-0
.4-0
3-02
.0.1
0.0
0102
0.3
0.40
.50
.60.
70.
8“)
.91.
01.
11.
21.
314
1.5
060
050
0.4
0
0.3
3
0.:0
Il=
.:3
[
!#.1
u0.1
0,1 :
z0
.?0
~.
:00.3
0
.0,4
0
.0.5
0
.0.6
0
-0,7
0
-0.8
0
-0.9
0
.1.0
0 .0.S
-04
.03
-0.2
-0.1
0.0
0.1
0.2
0.3
0.4
0.5
0.6
0.7
0.8
0.9
1.0
1.1
1213
1.4
1.5
tiO
RIZ
ON
IAl
OIS
TA
NC
E~
,—
——
——
—_
OE
SIG
NH
EA
OH
OF
41Z
ON
TA
LO
IST
AN
CE
x—
..—
—
‘dD
ES
IGN
IiEA
OH
dC
~ER
LIN
EO
FB
AY
VE
RT
ICA
LA
LO
NG
PIE
RS
UP
ST
RE
AM
FA
CE
0.60
0.5
0
0.4
0
0.3
0
0.2
0
0.1
0
0.0
0
.0.1
0
-0.2
0
-0.3
0
-0.4
0
4.5
0
-0.6
0
-0.7
0
~.
80
-0.9
0
.1.0
0 -0.5
.0.4
+.3
-02411
00
0.1
02
0.3
0.4
0.5
0.6
0.7
0.8
0.9
1.0
1.1
12
1.3
1.4
1.5
HO
FIIZ
ON
T4L
L31
ST
AN
CE
x_.
—.—
—O
ES
IGN
HE
AO
%C
EN
TE
RL
INE
OF
BA
~
NC
)T
E:N
UM
BE
RE
DC
UR
VE
SR
EFE
RT
OV
AL
UE
SO
FH
JHe
0.60
0.5
0
0.4
0
0.3
0
0.2
0
q=
m:;
::
. a
1
.0.1
0
2 In-0
.20
w %n
-0.3
0
-0.4
0
-0.5
0
-0.6
0
-0.7
0
-0..
!)0
-0.9
0
.1on ... -0
.5-0
.4-0
3-02
-0.1
0.0
0.1
020.
30.
40,
5O
.C0.
70
E09
1011
121.
314
1.5
tiO
RIZ
ON
TA
LD
IST
AN
CE
xD
ES
IGN
HE
AO
~E
LL
IPT
ICA
LC
RE
ST
SP
ILL
WA
YA
LO
NG
PIE
RS
SP
ILL
WA
YC
RE
ST
PR
ES
SU
RE
SIV
IHU
PS
TR
EA
MF
AC
FW
ITH
PIE
RS
RE
FE
RE
NC
E.
WE
S,
GE
NE
RA
LS
PIL
LW
AY
INV
ES
TIG
AT
ION
,
HY
DR
AU
LIC
MO
DE
LIN
vES
TIG
AT
ION
,B
Y
ST
MA
YN
OR
D,
TE
CH
NIC
AL
RE
PO
RT
HL
-85-
1,
P/H
d=
1.00
MA
RC
H18
85IR
EF
ER
EN
cE2)
,H
YD
RA
UL
ICD
ES
IGN
CH
AR
T11
1-24
/6P
RE
PA
RE
DB
YU
SA
RM
YE
NG
INE
ER
WA
TE
RW
AY
SE
XP
ER
IME
NT
ST
AT
ION
,V
ICK
SB
UR
G,
MIS
SIS
SIP
PI
WE
S11
47

-----
4.3 4.2 -0.1 0 0.1 0.2 0.3 0.4 0.5 0.6 0.7 ().8 0.9 1.0 1.1 1.2 1.3
HORIZONTAL DISTANCEGN HEAD +
f
PIERREFERENCE:
1
---
ELEVATION VIEW
WES. INVESTIGATIONS OF VA RlflllR ~l+ApE!j
OF THE UPST{EAM QUADRANT OF TUE CRESTOF A HIGH SPILLWAY; HYDRAULILINVESTIGATION. BY E.S. ME LSHEIME
.,,-P LABORATORYER AND T.E. MURPHY,
RESEARCH REpORT H-70-1, JANuARY 1970
(REFERENCE 3).
ELLIPTICAL CREST SPILLWAYSPILLWAY CREST PRESSURES
ALONG PIERP/Hd = 3,4
VERTICAL UPSTREAM FACE
HYDRAULIC DESIGN CHART 111-24/7
PREPARED BY U S ARMY ENGINEER WATERWAYS EXPERIMENT STATION, VICKSBURG, MISSISSIPPI WEs 11-07
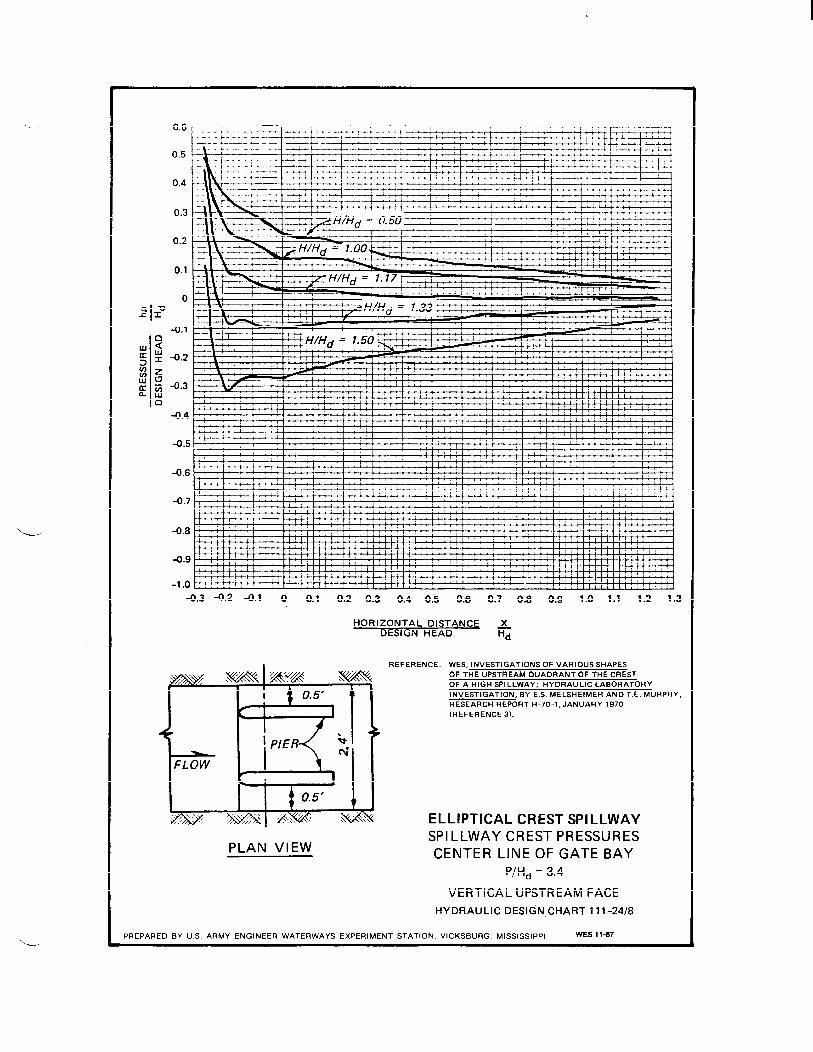
.
-0.3 -0.2 -0.1 0 0.1 0.2 0.3 0.4 0.5 0.6 0.7 0.8 0.9 1.0 1.1 1.2 1.3
HORIZONTAL DISTANCE ~DESIGN HEAD Hd
PLAN VIEW
REFERENCE: WES, INVESTIGATIONS OF VARIOUS SHAPESOF THE UPSTREAM QUADRANT OF THE CREST
OF A HIGH SPILLWAY; HYORAULIC LABORATORYINVESTIGATION, BY E.S. ME LSHEIMER AND T.E. MURPHY,RESEARCH REPORT H-70 -l, JANUARY 1970
(REFERENCE 3).
ELLIPTICAL CREST SPILLWAYSPILLWAY CREST PRESSURESCENTER LINE OF GATE BAY
PIHd = 3,4
VERTICAL UPSTREAM FACE
HYDRAULIC DESIGN CHART 11 1-24/8
PREPARED BY U S ARMY ENGINEER WATERWAYS EXPERIMENT STATION, VICKSBURG, MISSISSIPPI WES 11-07

c-’
-..-...
Xa
0.0
-o. I
-0.2
-0.3
-0.4
-0.5
-0.6
-0.7
-0,8
-0.9
\
o<$ iJGGESTEl ) DESIGN
CURVE
●
\
8
\
\
(
I .0 1.1 I .2 I .3 I .4 1.5 1.6
He
Hd
LEGENDREFERENCE: WES, GENERAL SPILLWAY INVESTIGATION;
O VERTICAL UPSTREAM FACEHYDRAULIC MODEL INVESTIGATION, BY
S.T. MAYNORD, TECHNICAL REPORT HL-85-1,● IV ON 1H UPSTREAM FACE MARCH 1985 (REFERENCE 2)
Hp = PRESSURE HEAD ON CREST, FT ELLIPTICAL CRESTHd = DESIGN HEAD, FT
SPiLLWAYHe = ENERGY HEAD, FT MAXIMUM NEGATIVEP = AVERAGE APPROACH DEPTH, FT PRESSURE VS l+e/Hd
UNCONTROLLED CREST (P/Hal > 0.5)HYDRMULIC DESIGN CHART Ill - 24/9
PREPARED BY U.S. ARMY ENGINEER WATERWAYS EXPERIMENT STATION, VICKSBURG, MISSISSIPPI WEs 11-87
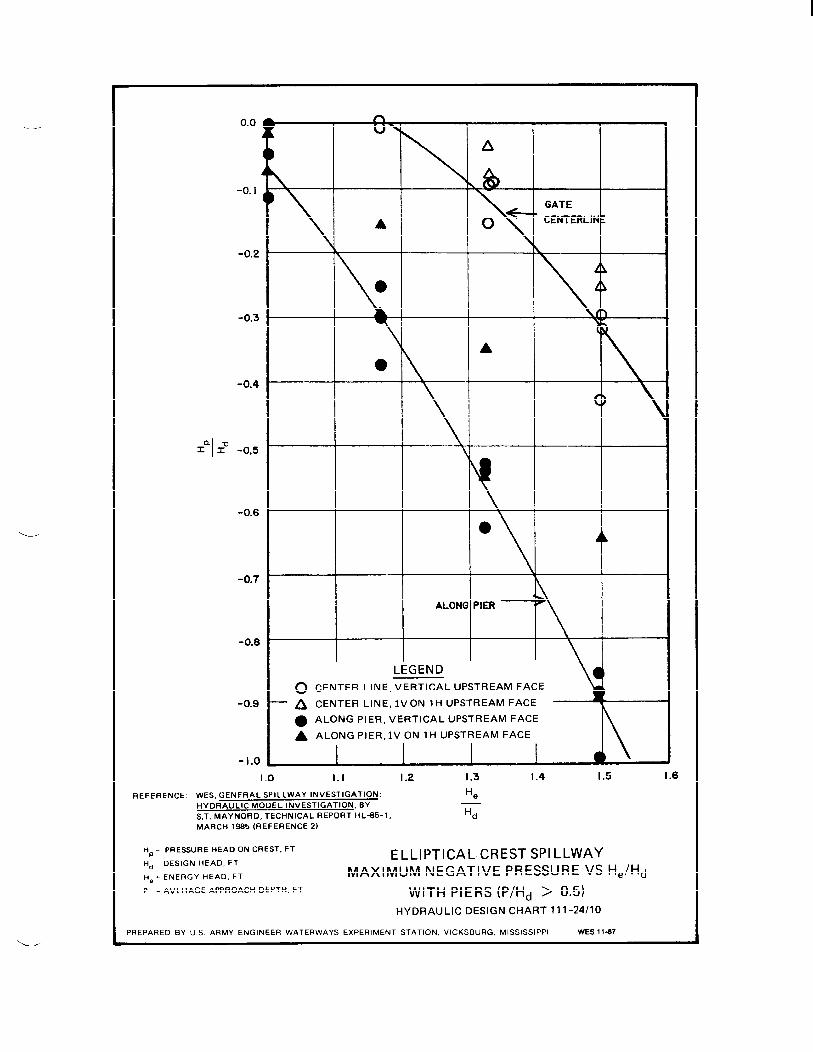
I
.. - 0.0
-0.1
-0.2
-0.3
-0.4
In ZU -(3.5
-0.6
-0.7
-0.8
-0.9
u~A
\ \
A CENTERLIN E
k
A
●
c>
\
●
ALONG PIER
LEGEND \dO CENTER LINE, VERTICAL UPSTREAM FACE
– A CENTER LINE,lVON IH UPSTREAM FACE
● ALONG PIER, VERTICAL UPSTREAM FACE
A ALONG PIER,lV ON IH UPSTREAM FACE *
-1.0I .0 1.1 I .2 I .3 I .4 I .5 1.6
REFERENCE WES, GENERAL SPILLWAY INVESTIGATION;
HYDRAULIC MODEL INVESTIGATION, BY
S.T. MAYNORD, TECHNICAL REPORT HL-85-1 ,
MARCH 1985 (REFERENCE 2)
Hp = PRESSURE HEAD ON CREST, FT
Hd = DESIGN HEAD, FT
He - ENERGY HEAD, FT
P = AVERAGE APPROACH DEPTH, FT
He
Hd
ELLIPTICAL. CREST SPILLWAY
MAXIMUM NEGATIVE PRESSURE VS He/Hal
WITH PIERS (p/Hal > 0.5)
HYDRAULIC DESIGN CHART 111-24/10
PREPARED BY U S ARMY ENGINEER WATERWAYS EXPERIMENT STATION, VICKSBURG, MISSISSIPPI WES 1147

0.6
0.5
0.4
0.3
0.2
0.1
0
I“-0.1
a<: -0.2
z
: -0.3UJn
4).4
43.5
-0.6
-0.7
4.8
-0.9
:1.0
1—— 4- 1
~’. ‘ ““ 1 I I 1 I
/,= 1 17~
-0.3 -0.2
REFERENCE:
-0.1 0 0.1 0.2 0.3 0.4 0.5 0.6 0.7 0.8 0.9
HORIZONTAL DISTANCE X
DESIGN HEAD —Hd
WES, INVESTIGATIONS OF VARIOUS SHAPES
OF THE UPSTREAM QUADRANT OF THE CREST
OF A HIGH SPILLWAY; HYDRAULIC LABORATORY
INVESTIGATION, BY E.S. ME LSHEIMER AND T.E. MURPHY,
1.0 1.1 1.2 1.3
RESEARCH REPORT H-70-1, JANUARY 1970
(REFERENCE 3).
ELLIPTICAL CREST SPILLWAYSPILLWAY CREST PRESSURES
WITHOUT PIERS
P/Hd = 3.4
VERTICAL UPSTREAM FACE
HYDRAULIC DESIGN CHART 111-24/3
PREPARED BY U S ARMY ENGINEER WATERWAYS EXPERIMENT STATION, VICKSBURG, MISSISSIPPI WES 11-87

HYDRAULIC DESIGN CRITERIA
SHEETS 111-25 TO 111-25/1
ELLIPTICAL CREST SPILLWAY
CAVITATION SAFETY CURVES
1. General. Sheets 111-20 through 111-24/10 describe variousdesign aspects of elliptical crest spillways. For a description ofmodel test data to support these sheets, see reference 2 and Sheets111-20 to 111-20/1.
2. Cavitation Safety Curves. Charts 111-24/9 and 111-24/10present plots of the function Hp/Hd = F(He/Hd) where H is the pres-
Psure head,
‘dis the design total head on crest, and H is the
eactual total head on crest. This formulation is versatile and can beused for any value of the pressure head H . However, vacuum tank
Pobservations by Abecasis (reference 1) indicated that cavitation on aspillway crest would be incipient at an average pressure of about-25 feet. For safety purposes, it is recommended that spillway crestsbe designed so that the maximum expected head will result in a pressureno lower than about -20 feet. Chart 111-25 is taken from the data ofMaynord (reference 2) for H = -20 feet and a crest without piers.
PCurves of -25 and -15 feet are also presented. The -25-foot curve cor-
~ responds to the lower portion of Abecasis’ measured envelope of valuesfor incipient cavitation. Chart 111-25/1 presents the same curves for acrest with piers located as described in Charts 111-24 to 111-24/10.These pressures were measured at a point 0.02 foot from the pier edge ina model with a design head
‘dof 0.8 foot. The two -20-foot curves
can be approximated by the following equations:
(without piers)‘d
= 0.277(He)l”2585 (1)
(with piers)‘d
= 0.309(He)1”2186 (2)
3. Design Examples. Depending on the available data, economics,and other design restrictions, there are many different approaches tothe proper sizing of a spillway for preliminary design.
4. References.
(1) Abecasis, F. M., “Discussion of ‘Designing spillway crests forhigh-head operation,’” by J. J. Cassidy. Journal of the HydraulicsDivision, American Society of Civil Engineers, vol 96, No. HY12,December, 1970.
111-25 to 111-25/1

(2) U. S. Army Engineer Waterways Experiment Station, CE, GeneralSpillway Investigation; Hydraulic Model Investigation, by S. T.Maynord, Technical Report HL-85-1, Vicksburg, Miss., March 1985.
111-25 to 111-25/1 —
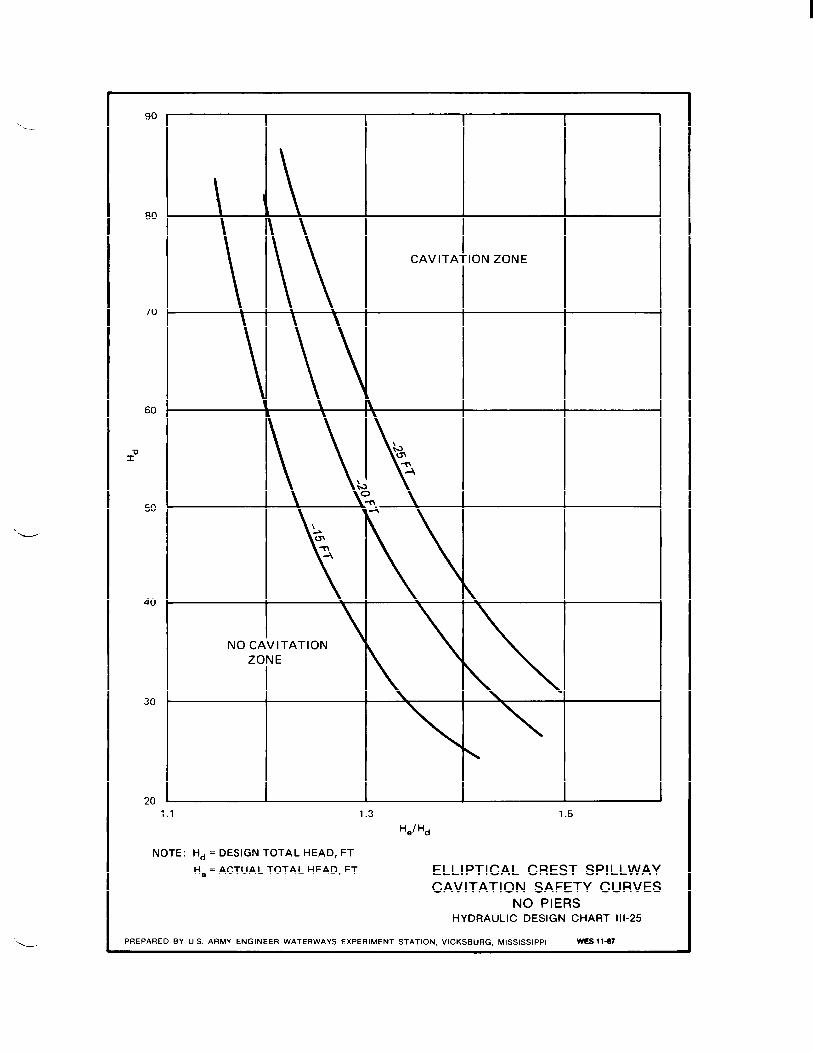
‘-._
L
90
80
70
60
1?
50
40
30
20
NO CAVITATION ‘
ZONE
CAVITA
NOTE: Hd = DESIGN TOTAL HEAD, FT
He = ACTUAL TOTAL HEAD, FT ELLIPTICAL CREST SPILLWAY
CAVITATION SAFETY CURVESNO PIERS
HYDRAULIC DESIGN CHART III-25
PREPARED BY U S ARMY ENGINEER WATERWAYS EXPERIMENT STATION, VICKSBURG, MISSISSIPPI WEs 11-87+
1.1 1.3
I+e/ Hd
ION ZONE
\
1.5
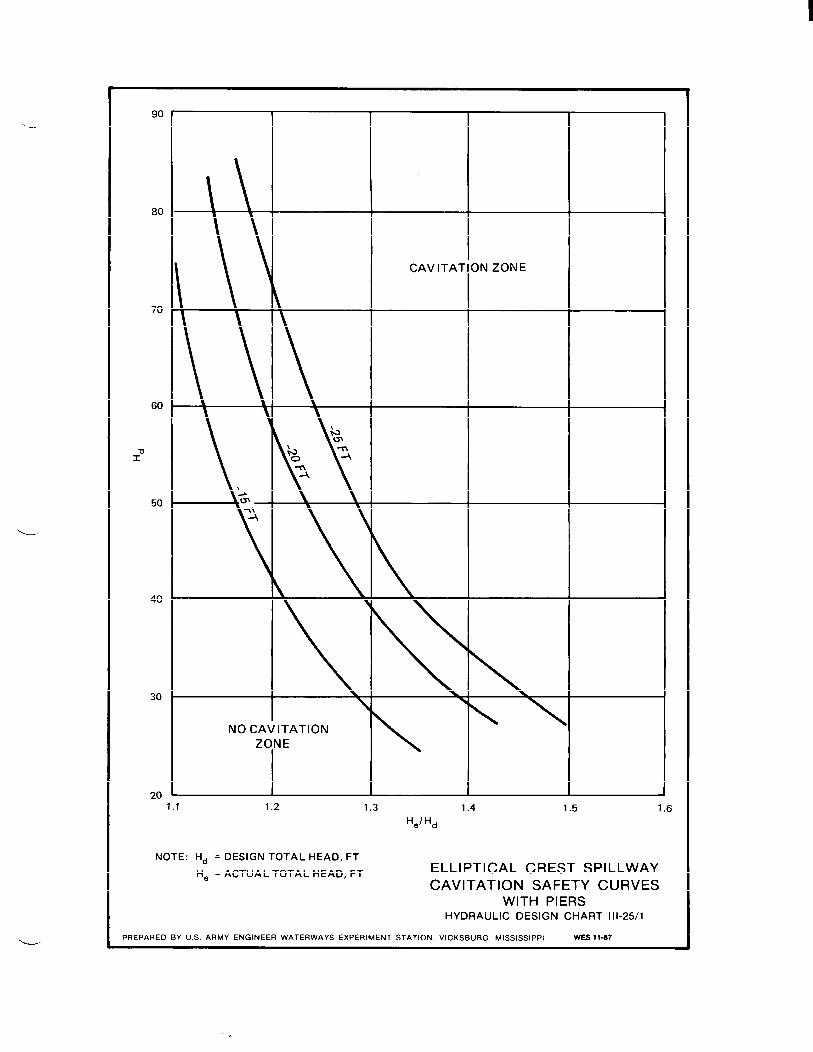
.-90
80
70
60
1?
50
40
30
201.1
Cavitation ZONE
NO CAVITATION
ZONE
1.2 1.3
NOTE: Hd = DESIGN TOTAL HEAD, FT
He = ACTUAL TOTAL HEAD, FT
1.4 1.5
I+el Hd
ELLIPTICAL CREST SPILLWAY
CAVITATION SAFETY CURVESWITH PIERS
HYDRAULIC DESIGN CHART 111-25/1
1.6
PREPARED BY U S. ARMY ENGINEER WATERWAYS EXPERIMENT STATION, VICKSBURG, MISSISSIPPI WEs 11-87

HYDRAULIC DESIGN CRITERIA
—
SHEETS 112-1 AND 112-2
SPILLWAY STILLING BASINS
HYDRAULIC JUMP
1. General. The principle of conservation of linear momentum re-sults in the classical hydraulic jump equation
%=’8+/%$Tables for the evaluation of D2 may be found in the Corps of EngineersHydraulic Tables, 2d Edition, 1944.
2. Spillway Stilling Basins. The purpose of Hydraulic DesignCharts 112-1 and 112-2 is the determination of the elevation of the apronor stilling basin floor when headwater and tailwater elevations are knownfor a given discharge. The form of the graphs was devised by Irwin.*On each chart families of D1 and D2 curves are shown for various dis-charges per foot of basin width and heads. Chart 112-1 covers a headrange of 5 to 500 ft and a discharge range of 10 to 250 cfs. Chart 112-2covers a similar range of heads but has a discharge range of 100 to 2500Cfs ● The head (H) as defined by the sketch at the foot of each chart isthe difference between the headwater and tailwater elevations. In thedevelopment of these charts friction losses were neglected. Recent ex-periments at State University of Iowa* for the Waterways ExperimentStation indicate that friction losses in accelerating flow down the faceof a spillway may be considerably less than the normal friction loss inwell-developed turbulent flow. Two lines depicting the Froude numbersquared (F2 = 3 and F2 = 12) are shown to define the jump characteris-tics. The line F2 = 3 marks the boundary between jumps of the undularand shock types. Model studies indicate that a strong hydraulic jumpforms in the region above the line F2 =12.
* R. L. Irwin, “Diagram for hydraulic jump,” Civil Engineeri~ (June1942), P 335.
* W. J. Bauer, “The Development of the Turbulent Boundary Layer on SteepSlopes,” Dissertation, University of Iowa, Iowa City, August 1951.
“L.
112-1 and 112-2Revised 1-68

.—
10 15 60 70 80 90 100 150 200
q = :;CHfR;E ~;R FOO;~F 8A;N WIDTH IN CFS
250
FORMULA: H =2 q* D2
[r
0 q2
~———— T– gDs [l- ]’+~—~+ 1-lgD2
-Da
SPILLWAY STILLING BASINS
HYDRAULIC JUMPIo<q <250
HYDRAULIC DESIGN CHART 112- I
WES 4-I-53

‘L.
ko 150 200 300 400 500 600 700 SOO 9001000 Iwo 2000 2500
c1 = DISCHARGE PER FOOT OF BASIN WIDTH IN CFS
SPILLWAY STILLING BASINSHYDRAULIC JUMP
100<q <2500HYDRAULIC DESIGN CHART 112-2
WCS 4-1-53

HYDRAULICDESIGN CRITERIA
‘----
SHEET 112-2/1
SPILLWAYSTILLING BASINS
HYDRAULICJUMP
VELOCITY DISTRIBUTION
1. The balance of pressure-plus-momentum upstream and downstreamfrom the jump is the basis for the theoretical equation of the hydraulicj-• This equation is given in HDCllz-s. When an end sill or bafflepiers are added there is an additional force i the upstream direction.U. S. Army Corps of Engineers EM ll10-2-1603(B~ suggests that a sa_Msfac-tory jump will occur for 0.gd2 by the use of an end sill and bafflesalthough more shallow basins have been demonstrated to perform satisfac-torily in the laboratory.
2. If the drag force of baffles is to be estimated, the effectivevelocity against the baffle and the drag coefficient must be known. Thedrag coefficient of the isolated cube referred to in HDC712-1 has beenestimated to be 1.33 based on State University of Iowa air lmnnel tests. (1)
The drag coefficient of~
single cube in open channel flow has been com-puted to be about 1.5. 7 Tests at Massachusetts Institute of Technol-0~(3) ind,ica-te that the drag coefficient is about 0.7 for a single row ofstepped iers and about 0.4 for a double row of Bluestone Dam type baffle
7piers.(G
3. HIX 112-2/1 can be used as a guide in selecting baffle pierheight and location as well as in estimating the velocity in the vicinityof the baffles. HDC 112-2/1 presents vertical velocity distribution curvesin the hydraulic jump at X/d2 stations of 1, 2, and 3 from
(t?e toe of
the jump. The curves resu t from experimental data by Rouset
and Mahon-ing Dam model study tests. 5) Curves for Froude numbers of entering flowof 2, 32 h, 6} 8} and 10 are given. The local velocity V is expressedin terms of the entering velocity V1 . The distance y above the flooris in terms of the depth downstream from the jump d2 .
4. The force exerted on the baffle piers and the resulting reductionin total downstream pressure and momentum can be estimated by use of HDC112-2/1 and an estimated drag coefficient. Available data indicate thatthe pier spacing as well as pier size and geometry has an effect upon thedrag coefficient. The designer is also sometimes concerned with the forceexerted on baffle piers by logs and other debris passing through the basin.
5* References.
(1) Chien, Ning, Fing, Yin, Wang, Huang-Ju, and Siao, Tien-To, Wind TunnelStudies of Pressure Distribution on Elementary Building Forms. Iowa
112-2/1
(2)
(3)
(4)
(5)
(6)
(7)
(8)
Institute of Hydraulic Research, for Office of Naval Research, 1951.
Harleman, D. R. F., “Effect of baffle piers on stilling basin perform-ance.” Journal, Boston Society of Civil Engineers, vol 12, No. 2(April lgyy), pp84-gg.
Newman, J. B., 111, and La Boon, F. A., Effects of Baffle Piers on theHydraulic Jump. M.S. thesis, Massachusetts Institute of Technology,1953.
Rouse, H., Siao, Tien-To, and Nagaratnam, S., “Turbulence character-istics of the hydraulic jump.” Transactions, American Society ofCivil Engineers, vol 124 (1959), pp 926-966.
U. S. Army Engineer District, Pittsburgh, CE, Report on HydraulicModel Studies on the Spillway and Outlet Works of Mahoning Dam, onMahoning Creek, near Punxsutawney, Pennsylvania. Case Institute ofTechnology, May 1936.
U. S. Army Engineer Waterways Experiment Station, CE, A LaboratoryDevelopment of Cavitation-free Baffle Piers, Bluestone Dam, New River,West VirRinia. Technical Memorandum No. 2-243, Vicksburg, Miss.,
.
March 19~8.
, unpublished data. 1957.
U. S. Army, Office, Chief of Engineers,EM 1110-2-1603, March 1953.
—. —.
Hydraulic Design, Spillways.
—
112-2/1
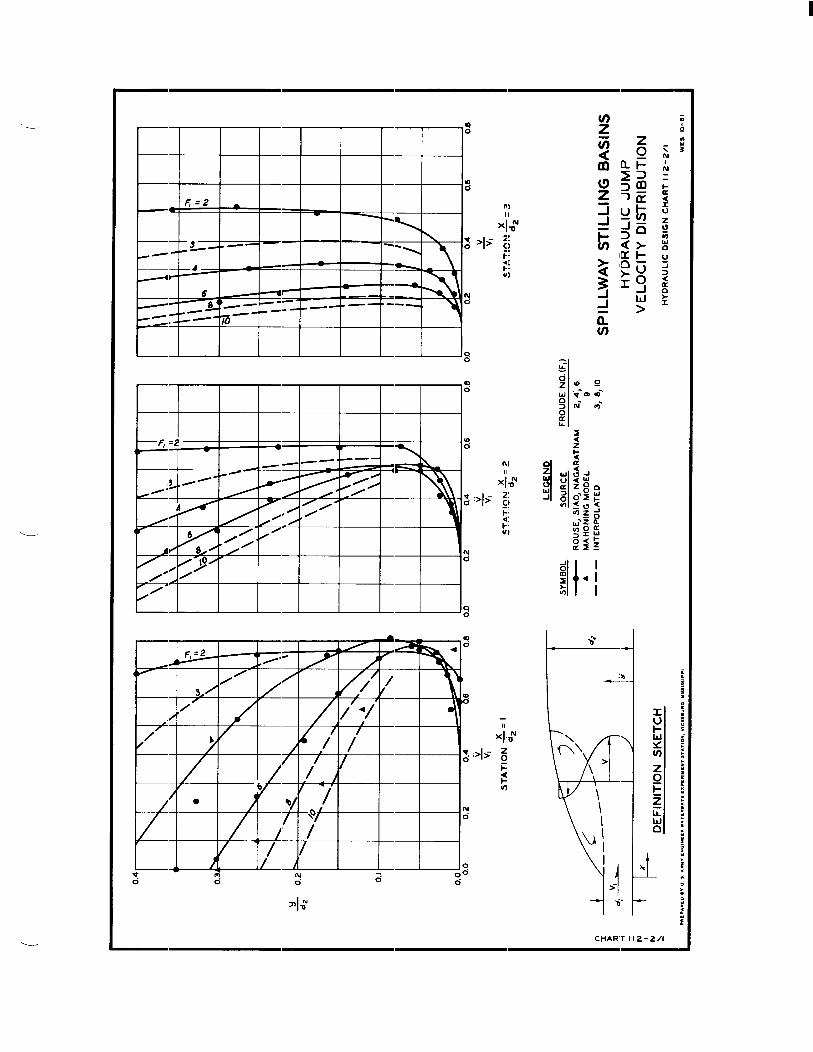
0.4
\\
4)
h
\\
●\w
0.3A~
\
\
\,
‘\
7\4—
\
\\
\
0.2‘-
~\
/~
\,
!\
y‘
\.
0.1
●.
\
●0.0 0.0
0.2
0.4 . v F
ST
AT
ION
‘=I
d2
4 d,v,
-
tx
l--
DE
FIN
ITIO
NS
KE
TC
H
●R
EP
AR
ED
#YU
SA
M4Y
EN
GIN
EE
RW
AT
ER
WA
YS
CX
PC
RIM
CM
TS
TA
71O
N,
VIC
KS
8UR
GM
ISS
ISS
IPP
I
— d2
-T\
T\ \ \\
\,
1\\ \\
\ ! \,
I\\
I\
\I
.1
\ \\\‘\ ,
I
d
0.2
0.4
0.6
0.
SY
MB
OL
A—
—.
v v,
ST
AT
ION
‘=2
d2
LE
GE
ND
SO
UR
CE
FR
OU
OE
NO
.(F
l)
RO
US
E,
SIA
O,
NA
GA
RA
TN
AM
2,
4;
6M
AH
ON
ING
MO
DE
L9
INT
ER
PO
LA
TE
D3,
0,10
xsT
AT
’0N
~=3
SP
ILLW
AY
ST
ILLI
NG
BA
SIN
S
HY
DR
AU
LIC
JU
MP
VE
LO
CIT
YD
IST
RIB
UT
ION
HY
DR
AU
LIC
DE
SIG
NC
HA
RT
II
2-2/
1
WE
S10-6
1

HYDRAULIC DESIGN CRITERIA
SHIWIW112-3 TO lU-5
SPILLWAY STILLING BASINS
SEQUENT DEFTH CURVES FOR RECTANGULAR CHANNEL
1. The conventional hydraulic jump equation is based on the prin-ciples of conse~ation of momentum and continuity of flow. The equation is
II 2 Dl Dl2
‘1+ 2V1‘2 =-F g ‘T
where Dl and D2 are sequent depths upstream and downstream, respec-tively, from the jmp. V1 and V2 are the corresponding sequentvelocities.
2. Tables have been published by King(s) and the Corps ofEngineers(6) that give the Dp value when the D1 and V1 values areknown.
3* A log-log graph, devised by E. W. Lane(5) and published by theNational Resources Committee(k), is given as Chart 112-3. It maybe usedto determine D2 and V2 when D1 and V1 are known.
4. A graph on Cartesian coordinates was devised by Doma(2) and re-published by Abbett(l). This graph gives the solution for D2 when D1and VI are known. The graph was prepared for a range of values of10 CVl < 100 in Chart 112-4 and of 6 < V1 < 10 in Chart 1X2-5.
(1)
(2)
(3)
(4)
5* List of References.
Abbett, R. W., American Civil Engineering Practice. Vol II, JohnWiley & Sons., Inc., New York, N. Y., sec 17, p 56.
Douma, J. H., Hydraulic Model Studies of the Wickiup Outlet WorksStilling Basin, Deschutes Project, Oregon. U. S. Bureau of Reclama-tion, Memorandum to Chief Designing Engineer, Denver, Colo., 30 June1939, Appendix 1, fig. 17. (Available on loan only)
King, H. W., Handbook of Hydraulics. 3d cd., McGraw-Hill Book Co.,Inc., New York, N. Y., 1939, table 133, p. 444-4-45.
National Resources Committee, Low Dams. Washington, D. C., 1938,p. 105.
112-3 to IJ2-5

(5) U. S. Bureau of Recl~ation, Drawing No. X-D-931. lJOctoberlgss.
(6) War Department, Corps of Engineers, Hydraulic Tables. 2d cd.,U. S. G. P. O., Washington, D. C., 19X4, table 3, p. 16-56.
----
112-3 tO 112-5
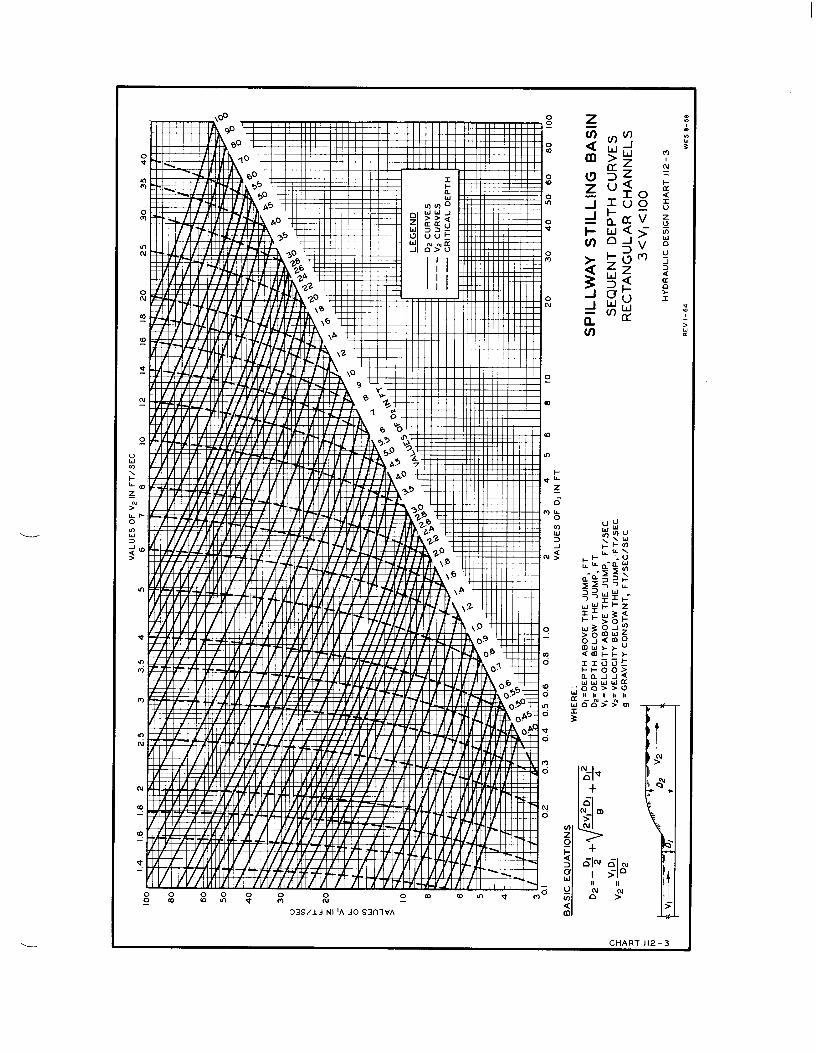
1.4
1.6
1.8
2V
ALU
ES
OF
V21N
FT
/SE
C
___
2.5
33
.54
56
78
10
12
14
16
18
20
25
30
35
40
>-
IL 0 to
0.I
0.2
0.3
0.4
0.50.6
0.8
1.0
23
45
VA
LU
ES
OF
DI
INFT
BA
SIC
EQ
UA
TIO
NS
VID
Iv2
=—D
2
68
10
WH
ER
E:
DI=
DE
PT
HA
BO
VE
TH
EJU
MP
,F
TD
2=D
EP
TH
BE
LO
WT
HE
JUM
P,
FT
VI
=V
EL
OC
ITY
AB
OV
ET
HE
JUM
P,
FT
/SE
C
V2=
VE
LO
CIT
YB
EL
OW
TH
EJU
MP
,F
TZ
SE
C
9=
GR
AV
ITY
CO
NS
TA
NT
,F
T/S
EC
/SE
C
20
30
40
50
60
80
I00
SP
ILLW
AY
ST
ILLI
NG
BA
SIN
SE
QU
EN
TD
EP
TH
CU
RV
ES
RE
CT
AN
GU
LA
RC
HA
NN
EL
S3<
VI<
IO0
HY
DR
AU
LIC
DE
SIG
NC
HA
RT
11
2-3
T—
,T
RE
V1-6
4W
ES
8-5
8

‘—
1-IL
z—
ONL0cou
3<>
60
55
50
45
40
35
30
25
20
15
10
5
0“o I 2 3 4 5 6 7 8
VALUES OF D, IN FT
SPILLWAY STILLING BASIN
SEQUENT DEPTH CURVESRECTANGULAR CHANNELS
Io<vl<loo
HYDRAULIC DESIGN CHART 112-4
WES 8-58

I
---
-—.
24
22
20
18
18
14
12
10
8
6
4
2
n“o I 2 3 4 5 8 7 8
VALUES OF 0, IN FT
.— ——_———
————————————— L ‘2 —
t v] — &j/ 1
SPILLWAY STILLING BASIN
SEQUENT DEPTH CURVESRECTANGULAR CHANNELS
6< VIC40
HYDRAULIC DESIGN CHART 112-5
WES 8-58

HYDRAULIC DESIGN CRITERIA
SHEET112-5/1
SPILLWAY STILLING BASINS
END SILL
TAILWATER REDUCTION
1. An end sill is commonly used as the terminal wall of a stillingbasin. Where a tailwater deficiency prevents satisfactory hydraulic jumpperformance and accompanying energy dissipation, the stilling basin flooris set lower than the riverbed and an end sill forms a step, or rise, tothe elevation of the bed of the channel. Hydraulic Design Chart 112-5/lcan be used to determine the relation between the Froude number of theentering jet, the sill height, and the downstream depth required forstabilizing the hydraulic jump when baffle piers are not used.
2. The effects of end sill height upon the reduction of flow depthdownstream from a sill have been investigated experimentallyby Forster andSkrinde.* Chart 112-5/l reproduces the data and curves published byForster and Skrinde. The ratio of the depth d3 over the end sill to theentering depth dl is plotted against the Froude number F1 of theentering flow. The curves represent various ratios of sill height to theupstream depth h/dl for basin lengths of 5(h + d3). The dashed linelabeled h/all= O is the theoretical hydraulic jump curve for sequentdepths.
3* The design criteria above apply to a stilling basin that requiresa vertical end sill or downstream channel invert sufficiently high to pro-duce the tailwater required for formation of the hydraulic jump. The endsill may act as a critical-depth control, and flow into the downstreamchannel may be very turbulent with supercritical velocities. Excessivewave action, surges, and supercritical velocities may require that in-creased protection be provided for 100 ft or more downstream of the still-ing basin to prevent channel erosion. Careful consideration should begiven to the need for increased riprap protection downstream of the still-ing basin. In extreme cases lowering of the basin elevation and use of astandard-type stilling basin may be more economical than extensive riprapprotection.
* J. W. Forster and R. A. Skrinde, “Control of the hydraulic jump bysills.” Transactions, American Society of Civil Engineers, vol 115,paper 2415 (195o), pp 973-987.
.—
112-5/1Revised 9-70 c

.
9 -(
//
/ ‘/o ‘ f f
8 A / ‘
r A
7
AJ/
6P {
o0
45
/ r r o
/ o
- , , . L #
‘o r r
/0 LOWER LIMITOF EXPERIMEIV m
i
/ /
/f I
/’/
I _/kr- 14
3I
\= lJ- THkO@CAL:CUR@ !
FROUDE NUMBER, F,
LEGEND
v, NOTE : CURVES AND DATA BY FORSTER AND SKRINDE.l’=
d== CRITICAL DEPTH
//////////1///////// [Iillll llllllllflllr’1
L .(,+------rDEFINITION SKETCH SPILLWAY STILLING BASINS
END SILLTAl LWATER REDUCTION
HYDRAULIC DESIGN CHART 112-5/!
PREPARED ❑ Y U S ARMY ENGINEER WATERWAYS ExPERIMENT STATION, VICKSBURG, MI SSISS!PPI WES 1-66
.

HYDRAULIC DESIGN CRITERIA
SHEETS 112-6 to 112-6/2
HIGH OVERFLOW DAMS
BUCKET-TYl?EENERGY DISSIPATOR
1. Bucket-t~e energy dissipators are used where excessive tailwaterdepths prevent adequate energy dissipation by means of a hydraulic jump ona horizontal stilling basin floor. HDC 112-6 and 112-6/1 can be used toestimate probable roller and surge heights for preliminary design purposes.
2. The design curves shown in the charts were developed by McPhersonand Karrl from extensive laboratory tests wherein the discharge was dis-tributed uniformly over the bucket. The test data have been omitted fromthe charts in the interest of clarity. The data points shown are fromWaterways Experiment Station (WES) studies2-6 and are in reasonably goodagreement with McPherson’s and Karr’s curves for q parameters ~ 26 x 10-3.The agreement is less satisfactory for higher q parameters. The chartsare therefore not considered applicable for q parameter values> 26 x 10-3, and the final design for large structures should be developedby hydraulic model study.
3. The streambed was generally at the same elevation as the bucketinvert in the McPherson and Karr tests. In the WES tests, the streanbedelevation varied from bucket-lip elevation to below the bucket-invert ele-vation. However, it is believed that the channel-bed elevation has neg-ligible effect on roller and surge heights.
4. The discharge parameterthe Froude number of the entering
q =Vd
of thejet in
and V
design curves can be related tothe following manner:
Then
and
*=*
where F = Froude number of entering jet
q = discharge per ft of bucket width, cfs
112-6 to 112-6/2Revised 1-66

‘1 =d=
v=
available energy head (pool to bucket invert), ft
depth of flow entering bucket, ft
velocity of flow entering bucket, fps
5* HDC112-6/2 illustrates application of HDC 112-6 and 112-6/1 forthe preliminary design of bucket-type energy dissipators. The sample com-putation is for a specific spillway discharge. The full range of spillwayflows should be investigated.
6. The WES model data shown in HDC 112-6 indicate that good energydissipation is obtained when the bucket roller depth hb is between 75 and90 percent of the tailwater depth ~ . For this condition, the surgeheight is 105 to 130 percent of the tailwater depth.
(1)
(2)
(3)
(4)
(5)
(6)
7. References.
McPherson, M. B., and Karr, M. H., “A study of bucket-t~e energydissipator characteristics.” ASCE, Hydraulics Division, Journal,vol 83, paper 1266, No. HY 3 (June 1957); vol 83, paper 1348, No.HY 4 (August 1957), Corrections, PP 57-64; VO1 84, paper 1832,No. HY 5 (October 1958), Closure, pp 41-48.
U. S. Army Engineer Waterways Experiment Station, CE, Model Studiesof Spillway and Regulsting Sluices for Wolf Creek Dam, CumberlandRiver, Kentucky. Technical Memorandum No. 201-1, Vicksburg, Miss.,January 1944.
, Model Studies of Spillway and Bucket for Center Hill Dam,Caney Fork River, Tennessee. Technical Memorandum No. 202-1,Vicksburg, Miss., August 1946.
, Model Study of Spillway and Bucket, Stewarts Ferry Dam,Stones River, Tennessee. Technical Memorandum No. 2-239, Vicksburg,Miss., September 1947.
, Spillway for Osceola Dam, Osage River, Missouri; ModelInvestigation. Technical Memorandum No. 2-261, Vicksburg, Miss.,October 1948.
, Spillway Design for Whitney Dam, Brazes River, Texas;Model Investigation. Technical Memorandum No. 2-263, Vicksburg,Miss., October 1948.
—
112-6 to 112-6/2Revised 1-66

I
--0.9 I II II I Ill I I [1 I I I I I I I I I J .J. .-1
I 1 I I I I I I 1! I I I I I I I II Mtdlltww
.~ljf~+~~+~f#l+]\ll. .- .- . .*
LEGEND 1
Mc PHERSON
WES AND KARR ++
qh,
qI?l
SYMBOL PROJECT x 103 —x 1033/2
viih,R 3/2 K
viih, —o CENTER HILL (TYPE 1 -HIGH) 14-53 3.94.4 5 6
❑ CENTER HILL (TYPE 1 -LOW) 1348 4.1-4 7 10 6-7
0.7
Bil
A OSCEOLA (ORIGINAL)
v oscEoLA {TYPE11■ STEWARTSFERRY(TYPE11
El3C-1C6 1.7-2.1
30-106 2.1-26
13
26
24-75 2.7-32
0.6
0.5
0.4
0.3
0.2
0.1
nn---0.0 0.1 0.2 0.3 0.4
h2
~
DESIGN CURVES SHOWN DEVELOPED BY McPHERSON ANDKARR FROM EXPERIMENTAL DATA. THESE DATAOMITTED TO SIMPLIFY CHART.
POOL
1
L-
/“
ROLLER
[
- SURGEhl i
H s +’ TW4
0,5 0.6 0.7 0.8
RANGES OF VARIABLES
SPILLWAY SLOPE
LIP ANGLE
H/h,
hi/R
q/~h13z2 X103
McPHERSONWES AND KARR
141-167 I 1’1
45° 45°
068-093 >0.75
SEE LEGEND
SEE LEGEND
HIGH OVERFLOW DAMS
i L,+h~ h2
;s e BUCKET-TYPE ENERGY DISSIPATORt -t 1
ROLLER DEPTH
DEFINITION SKETCH HYDRAULIC DESIGN CHART 112-6
PREPARED BY “ S ARMY ENGINEER WATERWAYS EXPERIMENT STATION, VICKSBURG, MISSISSIPPIREv 1–66
WES 5-59
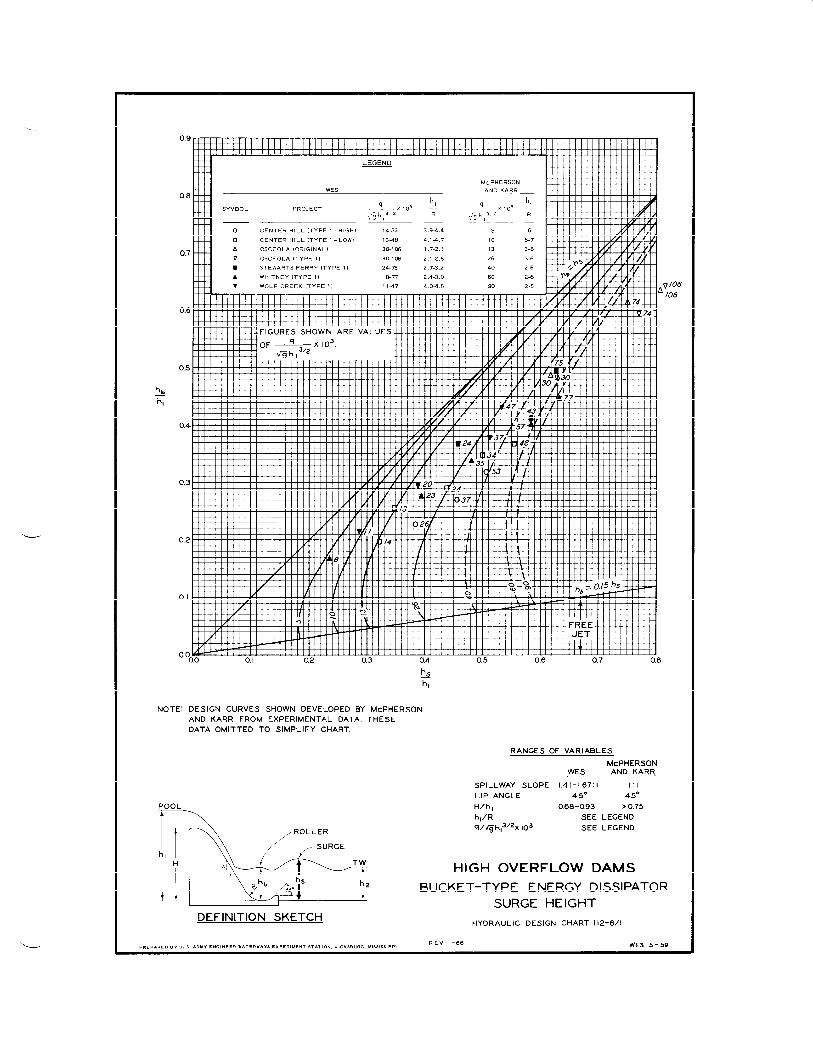
0.9 rI II I I 1111 I 1[1 I I Ill I
I II I I I I I I I I I I I I I [1 I I I
LEGEND t
+ *7 t. 7
II!“lit
0.7
0.6
Mc PHERSON
wES AND KARR
“ h, “ h,SYMBOL PROJECT ~g;,, ,’ 103 ; ~g;,, ,’ 103 ;
l~]FIGURES SHOWN ARE VALUES ~W+~
HH4’HH
0.5
0.4
0.3
0.2
0. I
0.000 0.1 0.2 0.3 0.4 0.5 06 0.7 0.8
NOTE:
POOL
hs
~
DESIGN CURVES SHOWN DEVELOPED BY McPHERSONAND KARR FROM EXPERIMENTAL DATA THESEDATA OMITTED TO SIMPLIFY CHART
RANGES OF VARIABLES
SPILLWAY SLOPELIP ANGLE
H/h,
hi/R
q/~hl 3/2x lo3
McPHERSON~ AND KARR
141–1.67”1 1:1
45° 45“
068-093 >0,75
SEE LEGEND
SEE LEGEND
v‘1
I’I.l...:!!tfifw,HIGH OVERFLOW DAMS
BUCKET-TYPE ENERGY DISSIPATORSURGE HEIGHT
DEFINITION SKETCHHYDRAULIC DESIGN CHART 112-6/1
PREPARED WY U. S. ARMY ENGINEER WATERWAYS EXPERIMENT STATION, VICKSBURG, MISSISSIPPIREV 1-66 WES 5-59
f06
’06

COMPUTATION FOR PRELIMINARY DESIGN
-.
GIVEN:
Discharge (q) per ft of
basin width = 450 cfs
Pool elevation =765ft
Tai Iwater elevation z 650 ft
Radius of bucket z 50 ft
Slope of bucket lip = 45 deg
Spillway slope = 10:6.1
Ratio of H to hl >0.75
POOL
ASSUME:
Bucket invert elevation H 550 ft
COMPUTE:
1.
2.
3.
4.
5.
hl = pool elevation - bucket invert elevation 6.
= 765-550= 215 ft
hz = tailwater elevation - bucket invert 7.
elevation
= 650-550 = 100 ft
h#hl = 100/215 = 0.465
Discharge parameter
450 x 103=5.68 x 3153
= 25
From Chart 112-6 read hb/hl = 0.42
for hz/h 1 = 0.465 and
x 103 = 25G ;1312
Note: Good energy dissipation is indicated if
the roller height (hJ is between 75 and
90 percent of the tai Iwater depth (hz).
PREPARED BY u s ARMY ENGINEER WATERWAYS EXPERIMENT STATION, VI CKSBUF!G M, SS, SS, PP,
8.
9.
10.
hb =0.42x hl
=0.42 x215=90 ft
From Chart 112-6/1 read h,/hl = 0.52 for
hb/h 1 = 0.42 and
q X 103 = 25
G hlslz
h,=0.52xh1
=0.52 x215= 112 ft
Compute hb and h~ for full range of
spillway flows.
Determine maximum elevation of bucket
rot Ier and surge.
HIGH OVERFLOW DAMSBUCKET-TYPE ENERGY DISSIPATOR
SAMPLE COMPUTATIONHYDRAULIC DESIGN CHART II2- 6/2
REv I-68 WES 5-59
—

HYDRAULIC DESIGN CRITERIA
SHEET 112-7
HIGH OVERFLOW DAMS
ENERGY
FLIP BUCKET AND
DISSIPATORS
TOE CURVE PRESSURES
1. Hydraulic forces acting on high, overflow spillway flip bucketsand toe curves are of interest in the structural design of these devices.Theoretical studies and model and prototype data indicate that the bottompressures change continuously throughout the curve and are influenced bythe curve radius, the total head, and the unit discharge. It has alsobeen shown that the pressures immediately upstream and, in the case of thetoe curve, downstream of the curve are influenced by the curvature.
(Rouse 3) illustrates the application of the flow net solution to thisproblem.
2. Flip Buckets. Approximate techniques, including use of thecentrifugal force equatiorl(pland a vortex ana.logy,(1~2)have been sug-gested for computing the pressures on spillway flip buckets. A recentWES study~7) using a theoretical approach similar to vortex analogy sug-gested by Douma(2) indicated that, for relatively high dams, bucket pres-sures could be expressed as:
%= f(*’%)where
hP
= pressure head against boundary, ft
‘T= total head (point to energy gradient), ft
q= unit discharge, cfs
R = radius of curve, f’t
g = acceleration due to gravity, ft per sec per sec
(2= angle of rotation from beginning of curve, degrees
%= total deflectio~.angle, degrees
The term ~j~ defines the relative position along the curve.
3* HDc 112-[7
resents dimensi nless flip bucket pressure curves7based on Pine Flat 4 and Haz%well(j model spillway data analyzed in
.—— 112-7Revised I-64

accordance with the preceding expression. Spillway energy losses were as-sumed negligible in the analysis. The plotted data for al% from 0.25to 0.75 indicate that the pressure in the middle portion of the bucket isnearly constant. Therefore, the pressure distribution through the bucketcan be adequately defined by the four curves shown in the chart. The curvefor ~/~ = 1.0 coincides with the axis of the chart ordinates since thepressure on the lower nappe of the jet leaving the bucket is atmospheric.The Pine Flat(G) prototype data plotted on the chart indicate satisfactorycorrelationwith the model data. Allowances were made for spillway energylosses in computing the total head HT for the prototype data.
4. Toe Curves. The available data(8)
from model tests conductedunder the Corps of Engineers Engineering Studies Item 801 which are plottedin HllC112-7 indicate that for a high dam the flip bucket pressure dis-tribution curves generally apply to spillway toe curves. However, the datashow that the pressure at the end of the toe curve approximates that at thebeginning of the curve if the toe curve is not submerged.
5* HDC 112-T can be used to estimate the pressure distribution onspillway flip buckets or toe curves associated with high overflow dams.However, for design purposes, allowance for spillway energy losses shouldbe included in the computations of HT required for use of the chart.The user is cautioned that the curves are not applicable to toe curves af-fected by submergence.
6. References.
(1)
(2)
(3)
(4)
(5)
(6)
Balloffet, A., “Pressures on spillway flip buckets.” Journal of theHydraulics Division, American Society of Civil Engineers (September1961), pp 87-96.
Douma, J. H., discussion of paper, “Design of side walls in chutes andspillways,” by D. B. Gumensky. Transactions, American Society ofCivil Engineers, vol 119 (1954), pp 364-367.
.—
Rouse, H., Engineering Hydraulics. John Wiley and Sons, Inc.,New York, N. Y., 1950, p 47.
U. S. Army Engineer Waterways Experiment Station, CE, Spillway andConduits for Pine Flat Dam, Kings River, California; Hydraulic ModelInvestigation. Technical Memorandum No* 2-sl”j,Vicksburg, Miss.,December 1953.
, Sluice Outlet Portal and Spillway Flip Bucket, HartwellDam, Savannah River, Georgia; Hydraulic Model Investigation.Technical Memorandum No. 2-393, Vicksburg, Miss*, August 1954.
, Prototype Tests of Spillway Crest and Flip Bucket,Pine Flat Dam, Kings River, California. Technical Report No. 2-511,
-—-
Vicksburg, Miss., June 1959.
112-7Revised 1-64

\.
(7) U= S= ArmY Engineer Waterways Experiment Station, CE, An Investigationof Spillway Bucket and Toe Curve Pressures. Miscellaneous Paper No.2-625J Vicksburg, Miss., February 1964.
(8) } unpublished ES 801 data.
112-7Revised I.-64

--- -
0.40 -
0.35 –
0.30 –
0.25
0.20 –
0.15
0.10 –
0.05
0.00 d
—ala ~=/. o(FLfPBu CKETS)
x 94
/
4
0
}
o
/g/“&>%x
85 # 38
NOTE: NUMBERS ARE VALUES
OF (a/a T)x 102 FOR
DATA POINTS.
-- --- ---0.00 0.10 020
DEFINITION SKETCH
—
—
0.30 0.40 0.50 0.60 ().10
>HT
LEGEND
A PINE FLAT MODELx HARTWELL MODEL
A PINE FLAT PROTOTYPE
n ES 801 (TOE CURVE)
HIGH OVERFLOW DAMS
ENERGY DISSIPATORS
FLIP BUCKET AND TOE CURVE PRESSURES
HYDRAULIC DESIGN CHART 112-7
REV 1-64 WES 10-61
..—
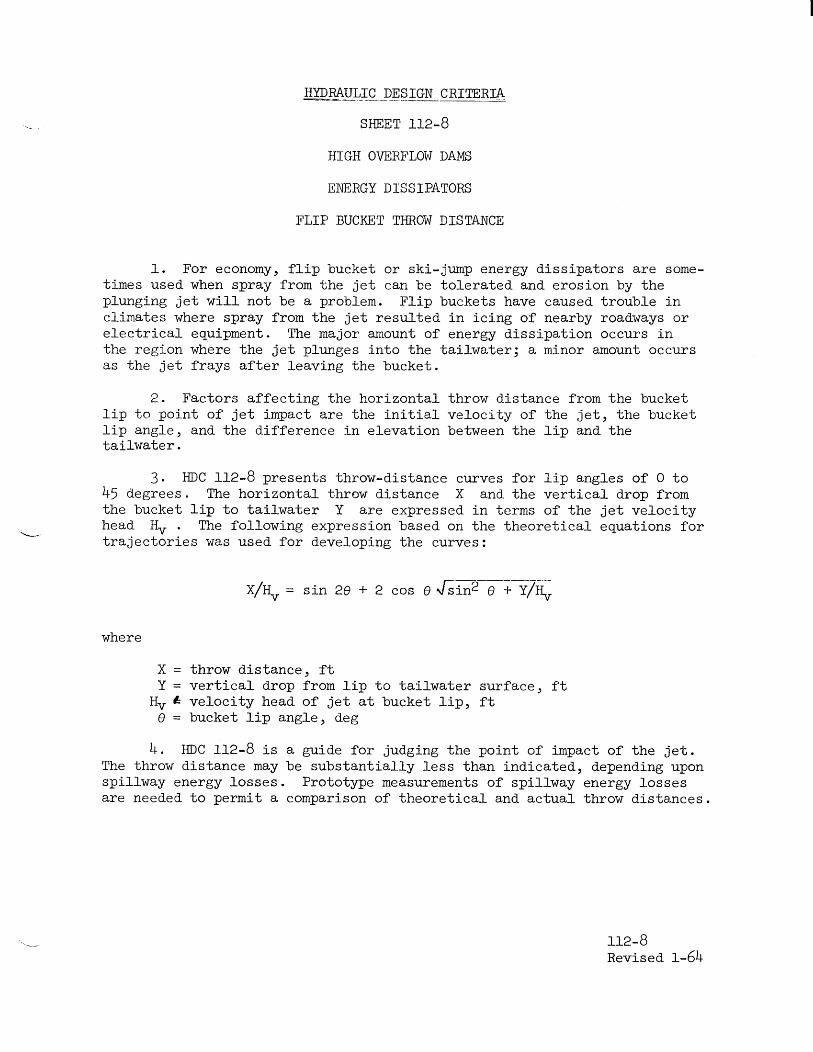
HYDRAULIC DESIGN CRITERM—- ....-—-—_____
.— SHEET 112-8
HIGH OVERFLOW DAMS
ENERGY DISSIPATORS
FLIP BUCKET THROW DISTANCE
1. For economy, flip bucket or ski-jump energy dissipators are some-times used when spray from the jet can be tolerated and erosion by theplunging jet will not be a problem. Flip buckets have caused trouble inclimates where spray from the jet resulted in icing of nearby roadways orelectrical equipment. The major amount of energy dissipation occurs inthe region where the jet plunges into the tailwater; a minor amount occursas the jet frays after leaving the bucket.
2. Factors affecting the horizontal throw distance from the bucketlip to point of jet impact are the initial velocity of the jet, the bucketlip angle, and the difference in elevation between the lip and thetailwater.
3* HDC 112-8 presents throw-distance curves for lip angles of O to45 degrees. The horizontal throw distance X and the vertical drop fromthe bucket lip to tailwater Y are expressed in terms of the jet velocityhead Hv . The following expression based on the theoretical equations forLtrajectories was used for developing the curves:
_—— ———----X/Hv = sin 20 + 2 cos 0&in2 0 + Y/~
where
x = throw distance, ftY= vertical drop from lip to tailwater surface, ftHv & velocity head of jet at bucket lip, fte = bucket lip angle, deg
4. HDC112-8 is a guide for judging the point of impact of the jet.The throw distance may be substantially less than indicated, depending uponspillway energy losses. Prototype measurements of spillway energy lossesare needed to permit a comparison of theoretical and actual throw distances.
‘— 112-8Revised I.-64

.—
-—
I .0
0.8
0.6
e
0.4-
0.2
* /
0.00.6 I .0 1.4 I .8 2.2 2.6 3.0
EQUATION
vx -slN2e+2cose slN e+Hv
~-
WIIERE:X = THROW DISTANCE, FT
e ❑ BUCKET LIP ANGLE
Hv= vELOclTY HEAD AT BucKET
LIP, FT
Y = VERTICAL DROP FROM LIP TOTAlLWATER SURFACE, FT
.\-——-‘\’\ \\
‘, \ HIGH OVERFLOW DAMS\ \,_
4 ENERGY DISSIPATORSx F LIP BUCKET THROW DISTANCE
DEFINITION SKETCHHYDRAULIC DESIGN CHART 112-8
pREpAREO 8V u s ARMY ENGINEER WATERWAYS EXPERIMENT STATION, VICKS9URG, MISSISSIPPIWES 10-61
Related Documents


![Gravity Dam Design[1]](https://static.cupdf.com/doc/110x72/545a2372b1af9f37608b5959/gravity-dam-design1.jpg)


