A place to earn, learn, and create a national model for economic advancement via the Retail Sector DALLAS, TEXAS Accelerating Retail Mobility For Economic Success

Welcome message from author
This document is posted to help you gain knowledge. Please leave a comment to let me know what you think about it! Share it to your friends and learn new things together.
Transcript

A place to earn, learn, and create a national model for economic advancement via the Retail Sector
DALLAS, TEXAS
Accelerating Retail Mobility For Economic Success
SUMMARY: PHASE I – RETAIL+PLUS DALLASPhase I – Retail+Plus Dallas In late 2015, the Walmart Foundation provided its first grant to Innovate+Educate, a national nonprofit. The
grants was part of a five-year, $100 million commitment to work toward closing the skills gap between
America’s workers and prospective employers. Innovate+Educate looked at multiple cities across the U.S to
determine the best city to launch their work. After narrowing it down between two top retail cities (Houston
and Dallas, Texas) I+E chose Dallas due to the strong leadership of Laurie Larrea, President of Workforce
Solutions Greater Dallas and the strong partnership between WFSDallas and the Dallas Regional Chamber,
The work in 2015-2016 was defined by a strong leadership advisory council formed by I+E in last 2015 that
included AT&T, CVS, Dallas County Community College District, DART (Dallas Area Rapid Transit), Dallas
Regional Chamber, El Rancho Foods, Goodwill and Goodwill Stores, Kroger, Lowes, PepsiCo/Frito Lay,
Regions Bank, United Way Dallas, Walmart Corporation, and WFS Dallas.
The work also leveraged the National Retail Competency Model, a model funded by Walmart Foundation
in early 2015 and led by the Business Roundtable and ACT Foundation. This model served to validate a
foundational competency framework developed by over 165 companies across the U.S. In April, 2016 the
Dallas Retail Advisory Council confirmed through facilitated sessions that these indeed were core competency
across retail and adjacent sectors most needed by employers.
The next phase (April – October 2016) included critical work with employers and their employees (incumbents)
across Dallas to validate the competency model, identify assessment tools, and train incumbents for
advancement along their career pathways. Key training partnerships across Dallas began to take seed include
Dallas County Community College District Supervisory Certificate, WAFC Retail Management Certificate,
National Retail Federation, and Workforce Solutions Greater Dallas. As a benefit from the grant, over 800
incumbents received an assessment and/or training, with positive results coming from both incumbents and
the employers involved.
Through the first grant (formally called Retail+Plus Dallas), the work illustrated the importance of building a
strong infrastructure around training and competency based assessments, as well as tools for the employers
and jobseekers to simplify the process for identifying training resources for upskilling and advancement.
Retail+Plus identified key areas to address and demonstrated there is a strong need for the retail sector to
consider the economic mobility of their workforce. Providing pathways for entry level incumbents to advance
into higher paying jobs not only reduces turnover and advances the retail sector, but adds to the efficiency and
sustainability of both the employee and company in the long run.
A critical indicator of this desire for advancement was a survey I+E launched in Spring 2016 to incumbents
in retail across Dallas. Over 3,000 surveys were completed, providing live data from current incumbents
in the Dallas area. From this data, employers on the advisory council received personalized confidential
reports on their internal incumbent view of economic mobility. An aggregated view of the 3,000 incumbents
also was compiled with a snapshot of results below, including an 82% interest or extreme interest in career
advancement.
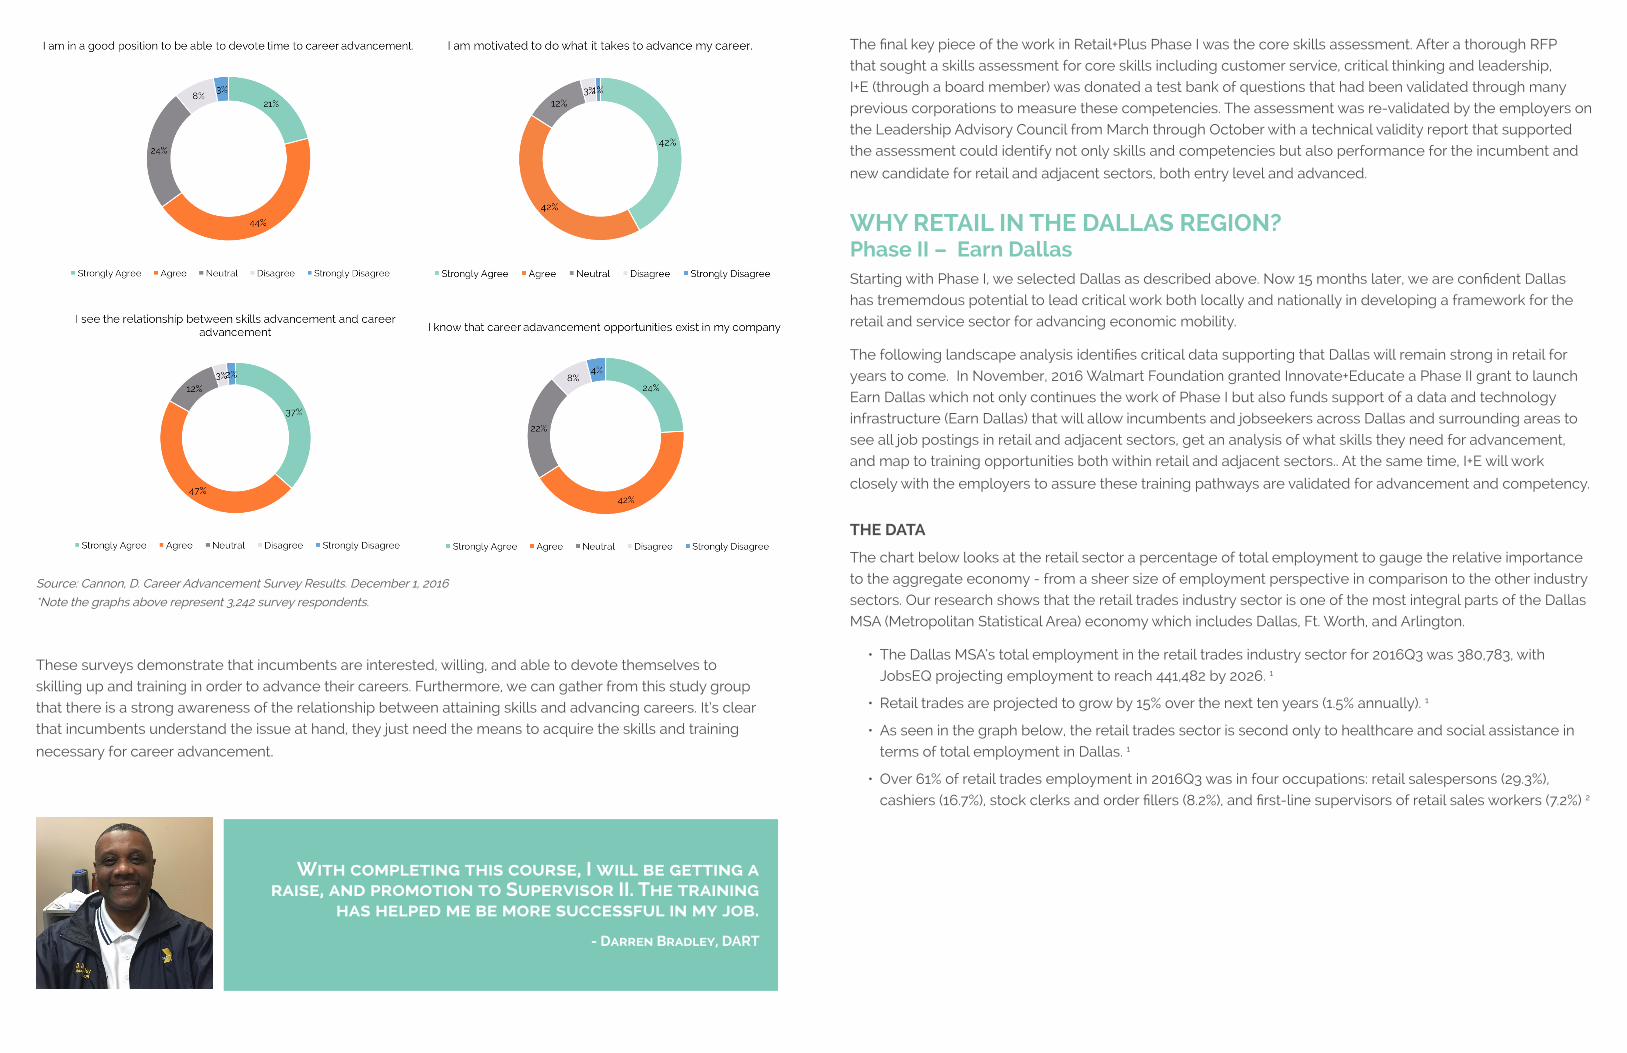
Source: Cannon, D. Career Advancement Survey Results. December 1, 2016
*Note the graphs above represent 3,242 survey respondents.
These surveys demonstrate that incumbents are interested, willing, and able to devote themselves to
skilling up and training in order to advance their careers. Furthermore, we can gather from this study group
that there is a strong awareness of the relationship between attaining skills and advancing careers. It’s clear
that incumbents understand the issue at hand, they just need the means to acquire the skills and training
necessary for career advancement.
With completing this course, I will be getting a raise, and promotion to Supervisor II. The training
has helped me be more successful in my job.
- Darren Bradley, DART
The final key piece of the work in Retail+Plus Phase I was the core skills assessment. After a thorough RFP
that sought a skills assessment for core skills including customer service, critical thinking and leadership,
I+E (through a board member) was donated a test bank of questions that had been validated through many
previous corporations to measure these competencies. The assessment was re-validated by the employers on
the Leadership Advisory Council from March through October with a technical validity report that supported
the assessment could identify not only skills and competencies but also performance for the incumbent and
new candidate for retail and adjacent sectors, both entry level and advanced.
WHY RETAIL IN THE DALLAS REGION? Phase II – Earn DallasStarting with Phase I, we selected Dallas as described above. Now 15 months later, we are confident Dallas
has trememdous potential to lead critical work both locally and nationally in developing a framework for the
retail and service sector for advancing economic mobility.
The following landscape analysis identifies critical data supporting that Dallas will remain strong in retail for
years to come. In November, 2016 Walmart Foundation granted Innovate+Educate a Phase II grant to launch
Earn Dallas which not only continues the work of Phase I but also funds support of a data and technology
infrastructure (Earn Dallas) that will allow incumbents and jobseekers across Dallas and surrounding areas to
see all job postings in retail and adjacent sectors, get an analysis of what skills they need for advancement,
and map to training opportunities both within retail and adjacent sectors.. At the same time, I+E will work
closely with the employers to assure these training pathways are validated for advancement and competency.
THE DATA
The chart below looks at the retail sector a percentage of total employment to gauge the relative importance
to the aggregate economy - from a sheer size of employment perspective in comparison to the other industry
sectors. Our research shows that the retail trades industry sector is one of the most integral parts of the Dallas
MSA (Metropolitan Statistical Area) economy which includes Dallas, Ft. Worth, and Arlington.
• ●The Dallas MSA’s total employment in the retail trades industry sector for 2016Q3 was 380,783, with
JobsEQ projecting employment to reach 441,482 by 2026. 1
• ●Retail trades are projected to grow by 15% over the next ten years (1.5% annually). 1
• ●As seen in the graph below, the retail trades sector is second only to healthcare and social assistance in
terms of total employment in Dallas. 1
• ●Over 61% of retail trades employment in 2016Q3 was in four occupations: retail salespersons (29.3%),
cashiers (16.7%), stock clerks and order fillers (8.2%), and first-line supervisors of retail sales workers (7.2%) 2
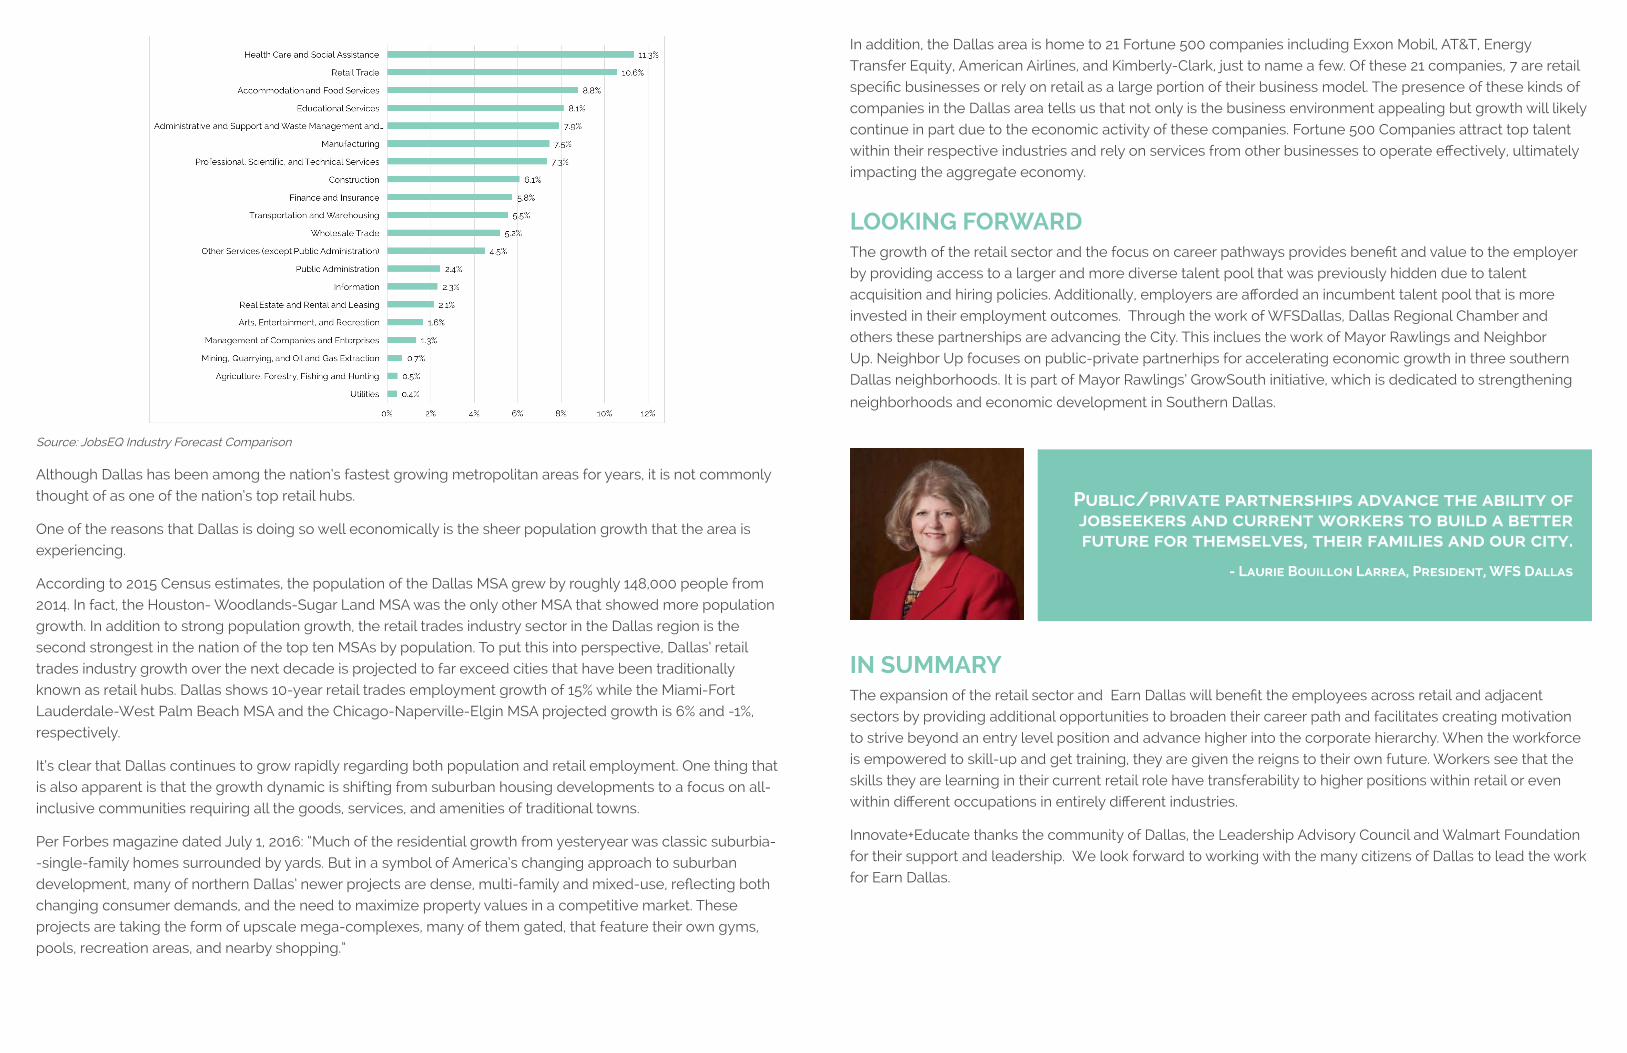
Source: JobsEQ Industry Forecast Comparison
Although Dallas has been among the nation’s fastest growing metropolitan areas for years, it is not commonly
thought of as one of the nation’s top retail hubs.
One of the reasons that Dallas is doing so well economically is the sheer population growth that the area is
experiencing.
According to 2015 Census estimates, the population of the Dallas MSA grew by roughly 148,000 people from
2014. In fact, the Houston- Woodlands-Sugar Land MSA was the only other MSA that showed more population
growth. In addition to strong population growth, the retail trades industry sector in the Dallas region is the
second strongest in the nation of the top ten MSAs by population. To put this into perspective, Dallas’ retail
trades industry growth over the next decade is projected to far exceed cities that have been traditionally
known as retail hubs. Dallas shows 10-year retail trades employment growth of 15% while the Miami-Fort
Lauderdale-West Palm Beach MSA and the Chicago-Naperville-Elgin MSA projected growth is 6% and -1%,
respectively.
It’s clear that Dallas continues to grow rapidly regarding both population and retail employment. One thing that
is also apparent is that the growth dynamic is shifting from suburban housing developments to a focus on all-
inclusive communities requiring all the goods, services, and amenities of traditional towns.
Per Forbes magazine dated July 1, 2016: “Much of the residential growth from yesteryear was classic suburbia-
-single-family homes surrounded by yards. But in a symbol of America’s changing approach to suburban
development, many of northern Dallas’ newer projects are dense, multi-family and mixed-use, reflecting both
changing consumer demands, and the need to maximize property values in a competitive market. These
projects are taking the form of upscale mega-complexes, many of them gated, that feature their own gyms,
pools, recreation areas, and nearby shopping.”
In addition, the Dallas area is home to 21 Fortune 500 companies including Exxon Mobil, AT&T, Energy
Transfer Equity, American Airlines, and Kimberly-Clark, just to name a few. Of these 21 companies, 7 are retail
specific businesses or rely on retail as a large portion of their business model. The presence of these kinds of
companies in the Dallas area tells us that not only is the business environment appealing but growth will likely
continue in part due to the economic activity of these companies. Fortune 500 Companies attract top talent
within their respective industries and rely on services from other businesses to operate effectively, ultimately
impacting the aggregate economy.
LOOKING FORWARDThe growth of the retail sector and the focus on career pathways provides benefit and value to the employer
by providing access to a larger and more diverse talent pool that was previously hidden due to talent
acquisition and hiring policies. Additionally, employers are afforded an incumbent talent pool that is more
invested in their employment outcomes. Through the work of WFSDallas, Dallas Regional Chamber and
others these partnerships are advancing the City. This inclues the work of Mayor Rawlings and Neighbor
Up. Neighbor Up focuses on public-private partnerhips for accelerating economic growth in three southern
Dallas neighborhoods. It is part of Mayor Rawlings’ GrowSouth initiative, which is dedicated to strengthening
neighborhoods and economic development in Southern Dallas.
Public/private partnerships advance the ability of jobseekers and current workers to build a better future for themselves, their families and our city.
- Laurie Bouillon Larrea, President, WFS Dallas
IN SUMMARYThe expansion of the retail sector and Earn Dallas will benefit the employees across retail and adjacent
sectors by providing additional opportunities to broaden their career path and facilitates creating motivation
to strive beyond an entry level position and advance higher into the corporate hierarchy. When the workforce
is empowered to skill-up and get training, they are given the reigns to their own future. Workers see that the
skills they are learning in their current retail role have transferability to higher positions within retail or even
within different occupations in entirely different industries.
Innovate+Educate thanks the community of Dallas, the Leadership Advisory Council and Walmart Foundation
for their support and leadership. We look forward to working with the many citizens of Dallas to lead the work
for Earn Dallas.
APPENDIX – MORE DATA1. ECONOMIC GROWTH IN THE CITY
Retail is mature in some cities and growing in others, sometimes due to widespread growth and in others due to specific events.
This analysis will consider various metrics that will show that Dallas is a city that has a vibrant retail trades
industry sector with strong corporate infrastructure that can be used as the backbone for continued economic
prosperity within the retail trades environment.
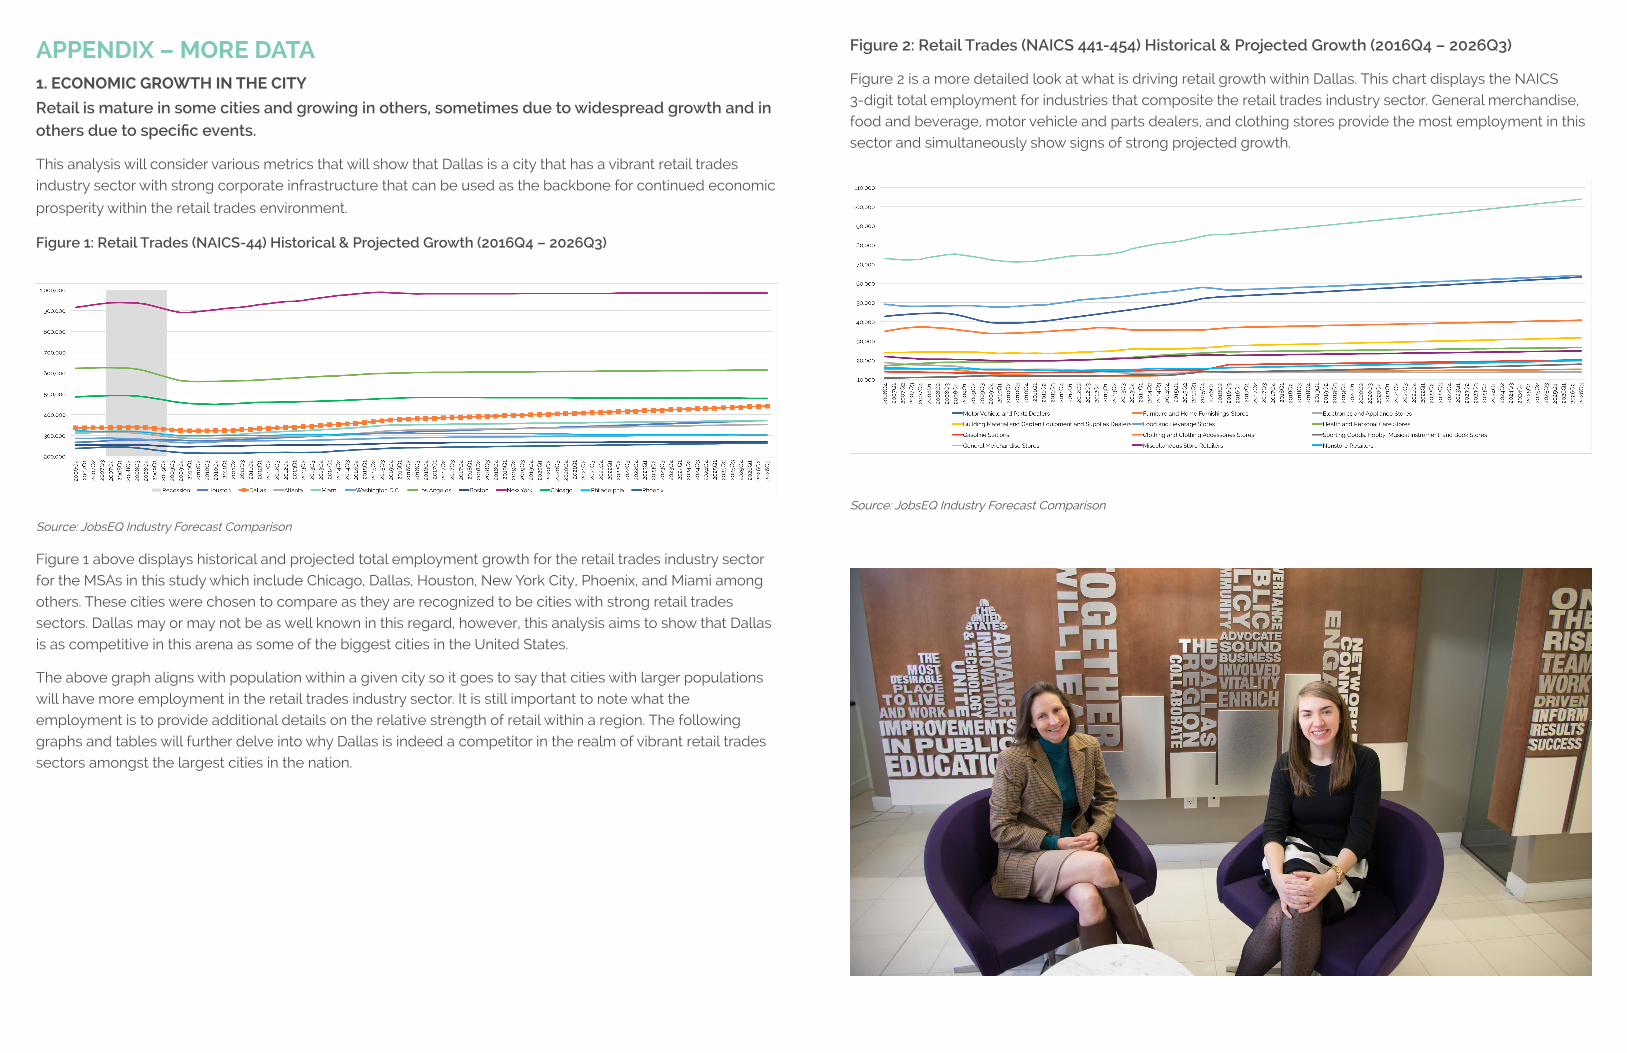
Figure 1: Retail Trades (NAICS-44) Historical & Projected Growth (2016Q4 – 2026Q3)
Source: JobsEQ Industry Forecast Comparison
Figure 1 above displays historical and projected total employment growth for the retail trades industry sector
for the MSAs in this study which include Chicago, Dallas, Houston, New York City, Phoenix, and Miami among
others. These cities were chosen to compare as they are recognized to be cities with strong retail trades
sectors. Dallas may or may not be as well known in this regard, however, this analysis aims to show that Dallas
is as competitive in this arena as some of the biggest cities in the United States.
The above graph aligns with population within a given city so it goes to say that cities with larger populations
will have more employment in the retail trades industry sector. It is still important to note what the
employment is to provide additional details on the relative strength of retail within a region. The following
graphs and tables will further delve into why Dallas is indeed a competitor in the realm of vibrant retail trades
sectors amongst the largest cities in the nation.
Figure 2: Retail Trades (NAICS 441-454) Historical & Projected Growth (2016Q4 – 2026Q3)
Figure 2 is a more detailed look at what is driving retail growth within Dallas. This chart displays the NAICS
3-digit total employment for industries that composite the retail trades industry sector. General merchandise,
food and beverage, motor vehicle and parts dealers, and clothing stores provide the most employment in this
sector and simultaneously show signs of strong projected growth.
Source: JobsEQ Industry Forecast Comparison
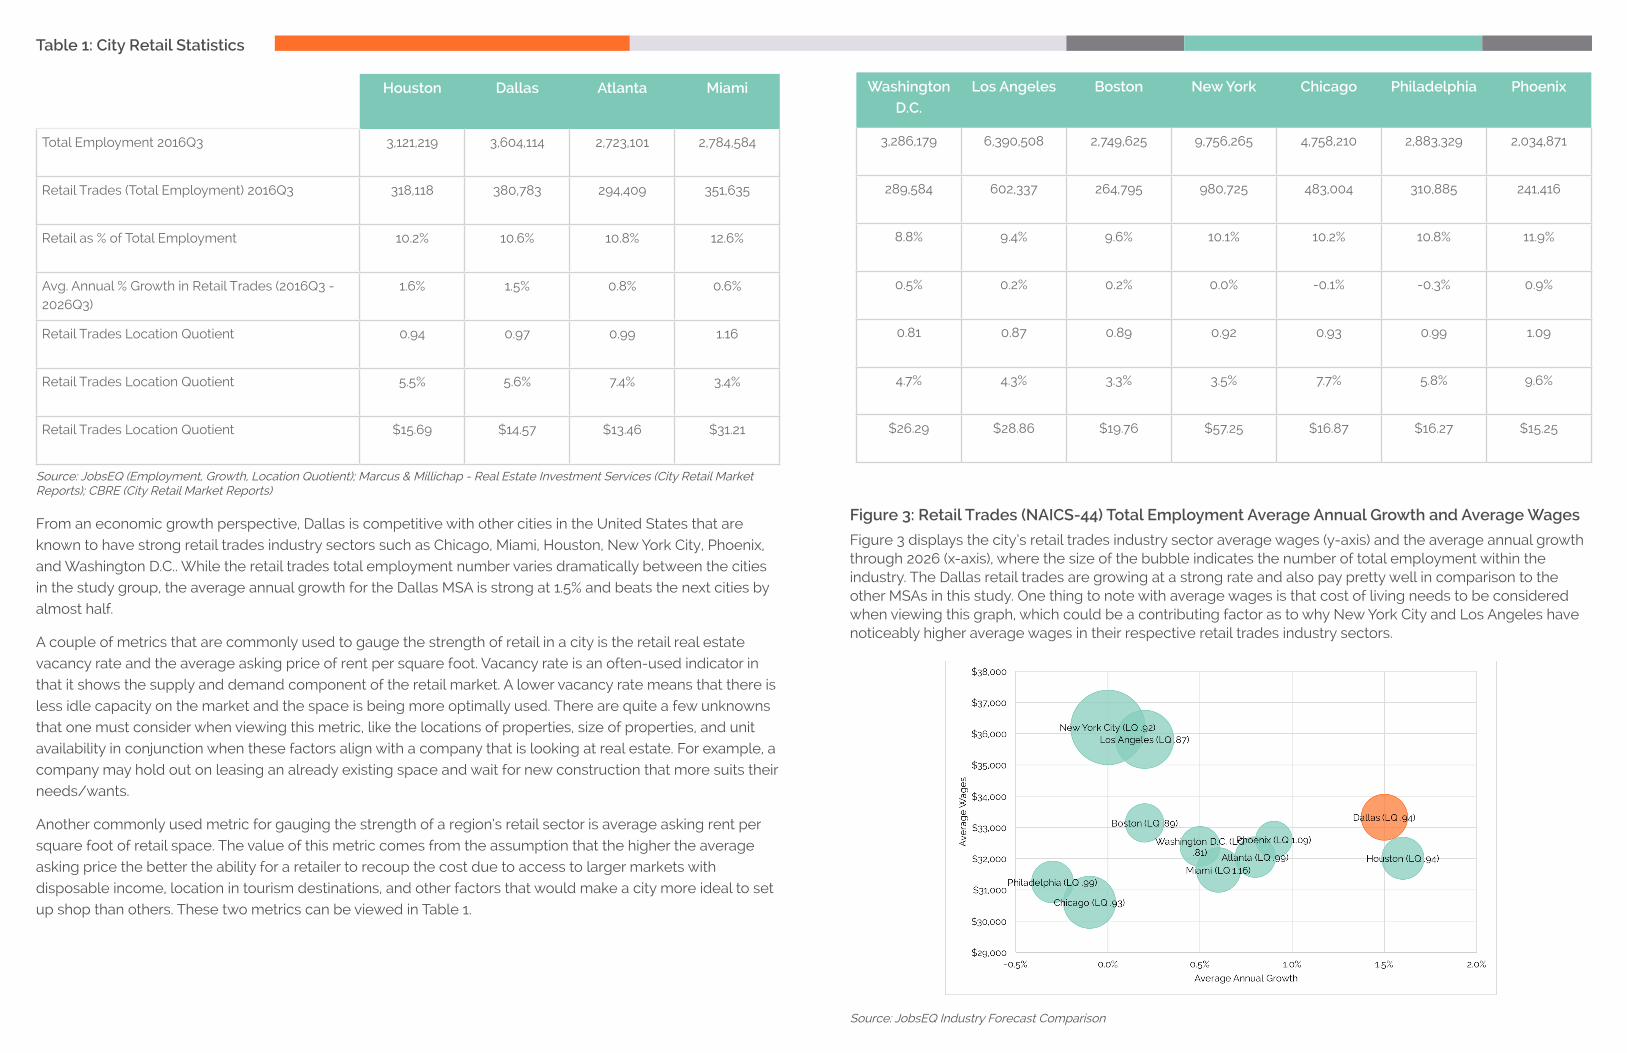
Table 1: City Retail Statistics
Houston Dallas Atlanta Miami
Total Employment 2016Q3 3,121,219 3,604,114 2,723,101 2,784,584
Retail Trades (Total Employment) 2016Q3 318,118 380,783 294,409 351,635
Retail as % of Total Employment 10.2% 10.6% 10.8% 12.6%
Avg. Annual % Growth in Retail Trades (2016Q3 - 2026Q3)
1.6% 1.5% 0.8% 0.6%
Retail Trades Location Quotient 0.94 0.97 0.99 1.16
Retail Trades Location Quotient 5.5% 5.6% 7.4% 3.4%
Retail Trades Location Quotient $15.69 $14.57 $13.46 $31.21
From an economic growth perspective, Dallas is competitive with other cities in the United States that are
known to have strong retail trades industry sectors such as Chicago, Miami, Houston, New York City, Phoenix,
and Washington D.C.. While the retail trades total employment number varies dramatically between the cities
in the study group, the average annual growth for the Dallas MSA is strong at 1.5% and beats the next cities by
almost half.
A couple of metrics that are commonly used to gauge the strength of retail in a city is the retail real estate
vacancy rate and the average asking price of rent per square foot. Vacancy rate is an often-used indicator in
that it shows the supply and demand component of the retail market. A lower vacancy rate means that there is
less idle capacity on the market and the space is being more optimally used. There are quite a few unknowns
that one must consider when viewing this metric, like the locations of properties, size of properties, and unit
availability in conjunction when these factors align with a company that is looking at real estate. For example, a
company may hold out on leasing an already existing space and wait for new construction that more suits their
needs/wants.
Another commonly used metric for gauging the strength of a region’s retail sector is average asking rent per
square foot of retail space. The value of this metric comes from the assumption that the higher the average
asking price the better the ability for a retailer to recoup the cost due to access to larger markets with
disposable income, location in tourism destinations, and other factors that would make a city more ideal to set
up shop than others. These two metrics can be viewed in Table 1.
Washington
D.C.
Los Angeles Boston New York Chicago Philadelphia Phoenix
3,286,179 6,390,508 2,749,625 9,756,265 4,758,210 2,883,329 2,034,871
289,584 602,337 264,795 980,725 483,004 310,885 241,416
8.8% 9.4% 9.6% 10.1% 10.2% 10.8% 11.9%
0.5% 0.2% 0.2% 0.0% -0.1% -0.3% 0.9%
0.81 0.87 0.89 0.92 0.93 0.99 1.09
4.7% 4.3% 3.3% 3.5% 7.7% 5.8% 9.6%
$26.29 $28.86 $19.76 $57.25 $16.87 $16.27 $15.25
Figure 3: Retail Trades (NAICS-44) Total Employment Average Annual Growth and Average Wages
Figure 3 displays the city’s retail trades industry sector average wages (y-axis) and the average annual growth through 2026 (x-axis), where the size of the bubble indicates the number of total employment within the industry. The Dallas retail trades are growing at a strong rate and also pay pretty well in comparison to the other MSAs in this study. One thing to note with average wages is that cost of living needs to be considered when viewing this graph, which could be a contributing factor as to why New York City and Los Angeles have noticeably higher average wages in their respective retail trades industry sectors.
Source: JobsEQ Industry Forecast Comparison
Source: JobsEQ (Employment, Growth, Location Quotient); Marcus & Millichap - Real Estate Investment Services (City Retail Market Reports); CBRE (City Retail Market Reports)
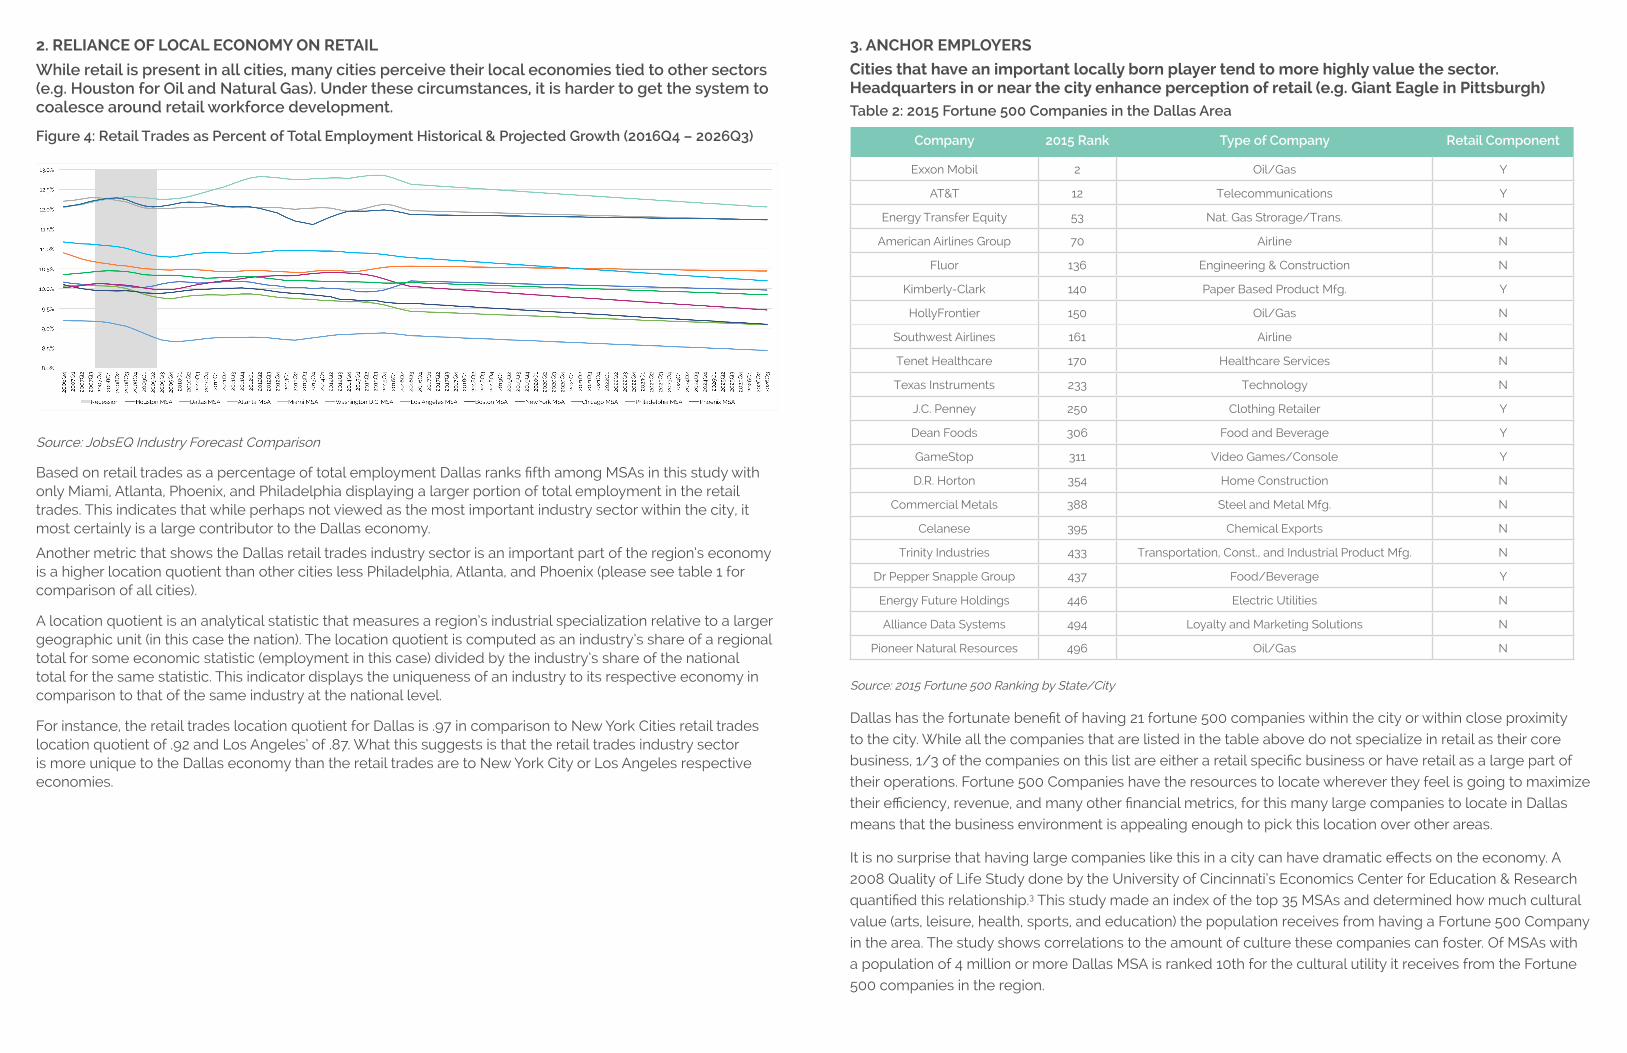
2. RELIANCE OF LOCAL ECONOMY ON RETAIL
While retail is present in all cities, many cities perceive their local economies tied to other sectors (e.g. Houston for Oil and Natural Gas). Under these circumstances, it is harder to get the system to coalesce around retail workforce development.
Figure 4: Retail Trades as Percent of Total Employment Historical & Projected Growth (2016Q4 – 2026Q3)
Source: JobsEQ Industry Forecast Comparison
Based on retail trades as a percentage of total employment Dallas ranks fifth among MSAs in this study with only Miami, Atlanta, Phoenix, and Philadelphia displaying a larger portion of total employment in the retail trades. This indicates that while perhaps not viewed as the most important industry sector within the city, it most certainly is a large contributor to the Dallas economy.
Another metric that shows the Dallas retail trades industry sector is an important part of the region’s economy is a higher location quotient than other cities less Philadelphia, Atlanta, and Phoenix (please see table 1 for comparison of all cities).
A location quotient is an analytical statistic that measures a region’s industrial specialization relative to a larger geographic unit (in this case the nation). The location quotient is computed as an industry’s share of a regional total for some economic statistic (employment in this case) divided by the industry’s share of the national total for the same statistic. This indicator displays the uniqueness of an industry to its respective economy in comparison to that of the same industry at the national level.
For instance, the retail trades location quotient for Dallas is .97 in comparison to New York Cities retail trades location quotient of .92 and Los Angeles’ of .87. What this suggests is that the retail trades industry sector is more unique to the Dallas economy than the retail trades are to New York City or Los Angeles respective economies.
3. ANCHOR EMPLOYERS
Cities that have an important locally born player tend to more highly value the sector. Headquarters in or near the city enhance perception of retail (e.g. Giant Eagle in Pittsburgh)Table 2: 2015 Fortune 500 Companies in the Dallas Area
Company 2015 Rank Type of Company Retail Component
Exxon Mobil 2 Oil/Gas Y
AT&T 12 Telecommunications Y
Energy Transfer Equity 53 Nat. Gas Strorage/Trans. N
American Airlines Group 70 Airline N
Fluor 136 Engineering & Construction N
Kimberly-Clark 140 Paper Based Product Mfg. Y
HollyFrontier 150 Oil/Gas N
Southwest Airlines 161 Airline N
Tenet Healthcare 170 Healthcare Services N
Texas Instruments 233 Technology N
J.C. Penney 250 Clothing Retailer Y
Dean Foods 306 Food and Beverage Y
GameStop 311 Video Games/Console Y
D.R. Horton 354 Home Construction N
Commercial Metals 388 Steel and Metal Mfg. N
Celanese 395 Chemical Exports N
Trinity Industries 433 Transportation, Const., and Industrial Product Mfg. N
Dr Pepper Snapple Group 437 Food/Beverage Y
Energy Future Holdings 446 Electric Utilities N
Alliance Data Systems 494 Loyalty and Marketing Solutions N
Pioneer Natural Resources 496 Oil/Gas N
Source: 2015 Fortune 500 Ranking by State/City
Dallas has the fortunate benefit of having 21 fortune 500 companies within the city or within close proximity
to the city. While all the companies that are listed in the table above do not specialize in retail as their core
business, 1/3 of the companies on this list are either a retail specific business or have retail as a large part of
their operations. Fortune 500 Companies have the resources to locate wherever they feel is going to maximize
their efficiency, revenue, and many other financial metrics, for this many large companies to locate in Dallas
means that the business environment is appealing enough to pick this location over other areas.
It is no surprise that having large companies like this in a city can have dramatic effects on the economy. A
2008 Quality of Life Study done by the University of Cincinnati’s Economics Center for Education & Research
quantified this relationship.3 This study made an index of the top 35 MSAs and determined how much cultural
value (arts, leisure, health, sports, and education) the population receives from having a Fortune 500 Company
in the area. The study shows correlations to the amount of culture these companies can foster. Of MSAs with
a population of 4 million or more Dallas MSA is ranked 10th for the cultural utility it receives from the Fortune
500 companies in the region.
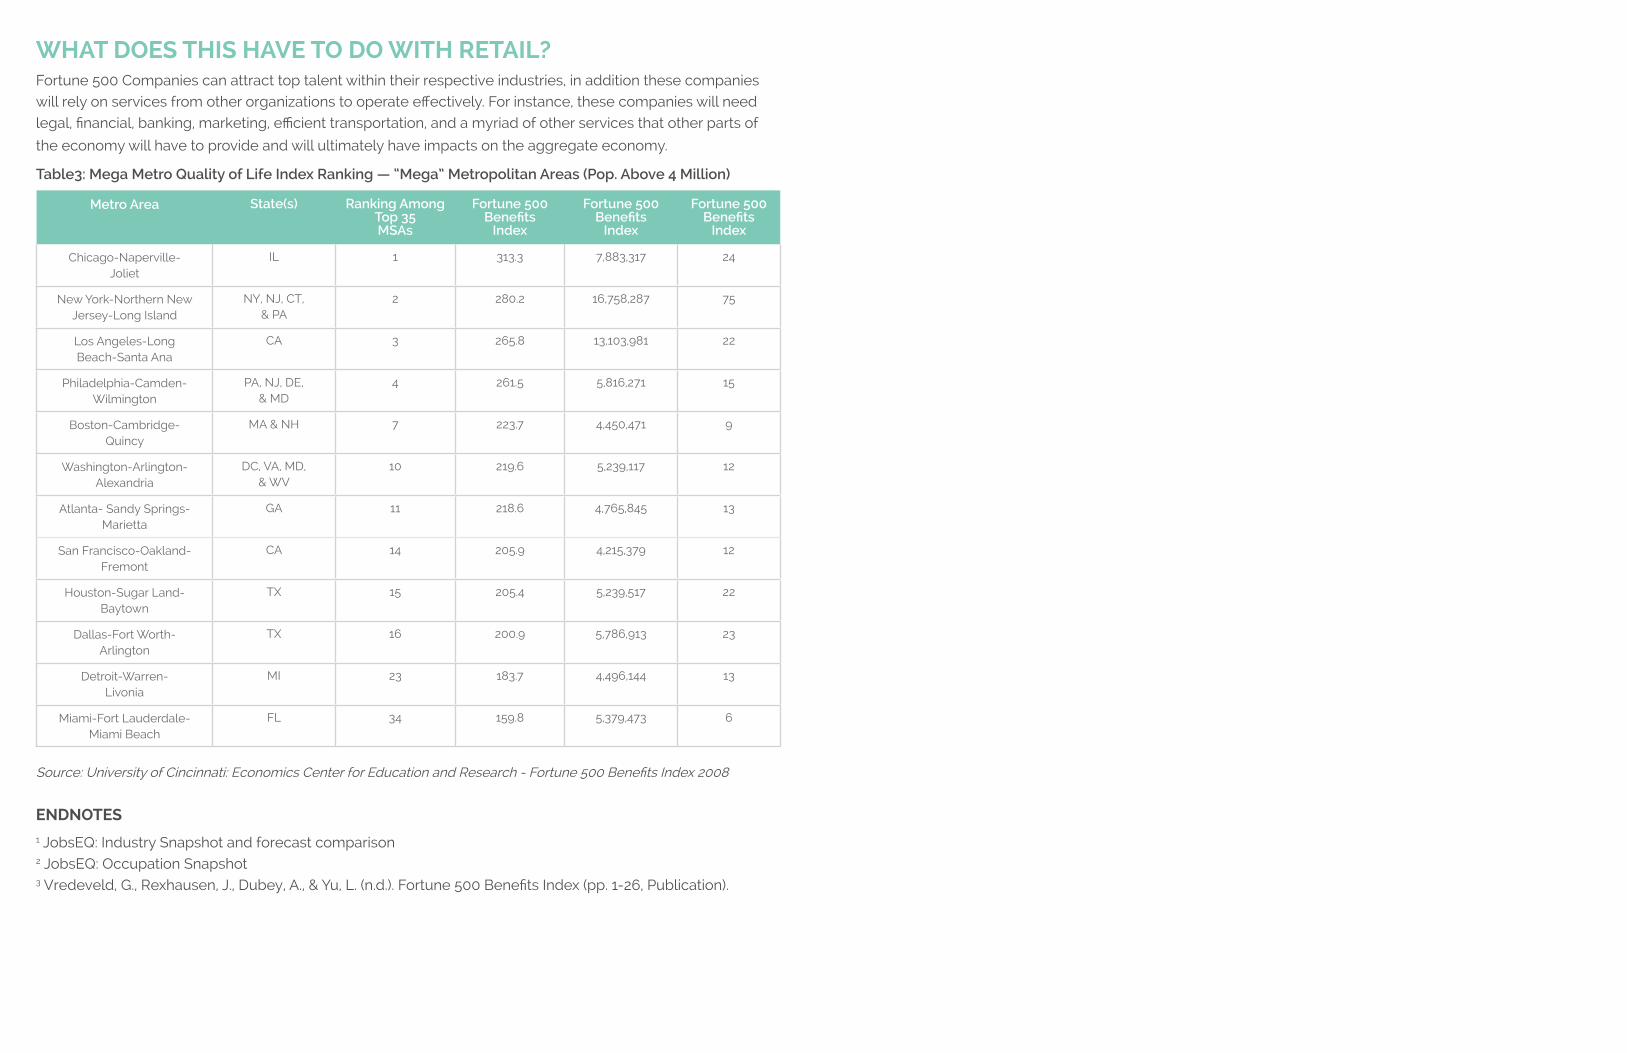
WHAT DOES THIS HAVE TO DO WITH RETAIL?Fortune 500 Companies can attract top talent within their respective industries, in addition these companies
will rely on services from other organizations to operate effectively. For instance, these companies will need
legal, financial, banking, marketing, efficient transportation, and a myriad of other services that other parts of
the economy will have to provide and will ultimately have impacts on the aggregate economy.
Table3: Mega Metro Quality of Life Index Ranking — “Mega” Metropolitan Areas (Pop. Above 4 Million)
Metro Area State(s) Ranking Among Top 35 MSAs
Fortune 500 Benefits
Index
Fortune 500 Benefits
Index
Fortune 500 Benefits
Index
Chicago-Naperville-Joliet
IL 1 313.3 7,883,317 24
New York-Northern New Jersey-Long Island
NY, NJ, CT, & PA
2 280.2 16,758,287 75
Los Angeles-Long Beach-Santa Ana
CA 3 265.8 13,103,981 22
Philadelphia-Camden-Wilmington
PA, NJ, DE, & MD
4 261.5 5,816,271 15
Boston-Cambridge-Quincy
MA & NH 7 223.7 4,450,471 9
Washington-Arlington-Alexandria
DC, VA, MD, & WV
10 219.6 5,239,117 12
Atlanta- Sandy Springs- Marietta
GA 11 218.6 4,765,845 13
San Francisco-Oakland-Fremont
CA 14 205.9 4,215,379 12
Houston-Sugar Land-Baytown
TX 15 205.4 5,239,517 22
Dallas-Fort Worth-Arlington
TX 16 200.9 5,786,913 23
Detroit-Warren-Livonia
MI 23 183.7 4,496,144 13
Miami-Fort Lauderdale-Miami Beach
FL 34 159.8 5,379,473 6
Source: University of Cincinnati: Economics Center for Education and Research - Fortune 500 Benefits Index 2008
ENDNOTES1 JobsEQ: Industry Snapshot and forecast comparison2 JobsEQ: Occupation Snapshot3 Vredeveld, G., Rexhausen, J., Dubey, A., & Yu, L. (n.d.). Fortune 500 Benefits Index (pp. 1-26, Publication).

Related Documents