Dairy Sector Thematic “Consistency is the key to success” Analyst Tushar Chaudhari +91-22 4224 5119 [email protected] Head of Equity Naren Shah +91-22 4224 5274 [email protected]

Welcome message from author
This document is posted to help you gain knowledge. Please leave a comment to let me know what you think about it! Share it to your friends and learn new things together.
Transcript
Dairy
Sector Thematic
“Consistency is the key to success”
Analyst
Tushar Chaudhari
+91-22 4224 5119
Head of Equity
Naren Shah
+91-22 4224 5274

Dairy
Sector Thematic
“Consistency is the key to success”
Executive Summary
Milk is an essential source of protein for human beings. Among the available source of energetic food items, milk is one of the cheapest, nutritious, balanced and easily digestible diet. Although it is necessary for everyone, it is a regular dietary requirement for children, the aged, sick and expectant mothers. It provides essential nutrients such as body building proteins, bone forming minerals, health giving lactose and milk fat. With the Indian population growing at 4% CAGR, demand is not a concern for companies dealing in the product such as milk.
With rising urbanization and higher proportion of working women, time has become a precious commodity and there is higher tendency to use ready to eat quality products of milk such as curd and ghee. With changing lifestyles there is significant change in eating habits as well, which has made value added products (such as cheese and butter) an essential item in the monthly grocery list; at least in urban India and the trend is expected to follow in rural areas as well. Rising disposable income and availability of quality products from private dairy players has aided the growth of value added milk products in last decade. Consumers have become more brand conscious as there is consistency in quality and taste in products supplied by private dairy players vis a vis that of traditional milkmen. Over the last two decades with increasing hectic lifestyle and rising health issues, urban consumers does not mind paying a premium to quality products. We foresee tremendous opportunities of premiumisation for players in dairy space for growth and players who will maintain consistency, systems and processes in milk procurement and deepening product reach will succeed in our view.
The dairy industry in India has been on a steady path of progression since independence led by cooperatives. In India, the dairy sector also plays an important role in socio-economic development, and constitutes an important segment of the rural economy. Dairy industry provides livelihood to millions of homes in villages, ensuring supply of quality milk and milk products to people in both urban and rural areas. Taking cues from success of cooperatives many private dairies have invested in sector over last two decades and successfully integrated operations, increased product portfolio, involved farmers for sustainable raw milk supplies and developed entire milk infrastructure. Companies having direct procurement of milk from farmers have achieved consistency in fat content and developed easier checking system at lower rates than with agents involved. As milk is perishable item, companies have established smaller units near milk producing areas and supplied to the user markets within radius of 400km. Companies selling pure milk and fresh milk products (curd, buttermilk) have higher return ratios as asset turn is higher while few have focused on high margin value added products which are capital intensive, demand expenditure on brands till the time capacity utilization improves and thus ending up with lower return ratios.
Although we had been through a flood season from milk availability point of view, retail prices of milk has been raised recently by few cooperative players in Maharashtra; which depicts pricing power of industry and will be aiding private players to maintain their profitability. Although volatility will persist, long term earning outlook is strong. We remain positive on dairy sector as a whole with priority given to efficient procurement system, distribution reach and optimum product portfolio.
Key tailwinds are recent fall in raw milk prices, rising demand for VAP, deepening distribution reach of brand via VAP in rural India and young population ready to spend money on quality products. Dairy industry in India is highly fragmented; there are n numbers of options available for consumers to choose from. One easy way to get success in the sector is to develop a long lasting taste on Indian consumers tongue and mind; which is not so easy. However many companies such as Amul, Britannia have done it with consistent efforts to understand psyche of Indian consumers and delivering the requisite taste and variety of milk products. For the companies under our coverage competition remains the biggest risk as it will limit pricing freedom. Many large consumer focused players in India (such as ITC, Britannia and Nestle) have larger balance sheets, better geographical presence, better understanding of Indian consumption habits and consumer psyche which can drive consolidation in dairy industry. In order to launch new products and maintain own quality standards, building own milk procurement network is essential. The target would be to acquire smaller dairy companies having access to rural farmers for milk procurement and capture the entire value chain of milk. We believe recent deal of Lotte-Havmor is just a start for the consolidation phase in the industry.
We believe there are two structural themes that are expected to pan out in the Indian dairy industry owing to favorable demographics which will drive multi-year growth in the industry: the shift from ‘unorganized’ to ‘organized’ market and consumer upgradation from ‘pouch milk/ powders’ to ‘value-added dairy products’ (VAP). We initiate coverage on Parag Milk Foods, Kwality, Prabhat Dairy and Heritage Foods with BUY; Hatsun Agro with HOLD ratings. As companies and Dairy industry itself is in growth phase we have used relative valuation method comparing return ratios and earnings growth.

Sector Report DAIRY 13 April 2018
2
Valuation Summary
Exhibit 1: Earnings Summary
Company Revenue (` b) EBITDA Margin (%) EPS (`) Sales CAGR
(%) EBITDA CAGR
(%) EPS CAGR
(%) CMP Rating
FY17 FY18E FY19E FY17 FY18E FY19E FY17 FY18E FY19E FY17-20E FY17-20E FY17-20E (`)
Parag Milk 17 19 21 5.9 9.2 9.1 3.1 9.5 11.7 12 29 64 249 BUY
Prabhat Dairy 14 15 18 9.0 9.6 10.0 2.9 4.4 6.2 14 21 45 177 BUY
Kwality 69 69 76 6.6 7.1 7.3 8.2 5.4 7.2 6 11 2 60 BUY
Heritage Foods 26 25 29 5.4 5.6 6.6 14.4 13.1 20.3 8 18 22 746 BUY
Hatsun Agro 42 46 53 9.0 9.3 9.4 8.8 11.0 14.1 13 17 30 740 HOLD
Exhibit 2: Valuation Summary
Company Dividend Yield (%) Net Debt / Equity (x) RoCE (%) RoE (%) Asset Turnover (x)
FY17 FY18E FY19E FY17 FY18E FY19E FY17 FY18E FY19E FY17 FY18E FY19E FY17 FY18E FY19E
Parag Milk 0.2 0.8 1.2 0.1 0.1 0.0 7 15 16 4 11 12 2.8 2.9 3.0 Prabhat Dairy 0.2 0.2 0.2 0.1 0.1 0.0 11 13 15 4 6 8 2.1 2.2 2.3 Kwality 0.2 0.5 0.6 0.5 0.4 0.4 27 22 22 17 11 13 5.1 4.7 4.5 Heritage Foods 0.4 0.5 0.7 0.2 0.2 0.2 26 21 27 22 17 22 10.7 9.4 8.6 Hatsun Agro 0.4 0.5 0.7 1.1 0.8 0.6 30 32 33 39 37 36 6.9 6.5 7.5
Company Mkt. Cap P/E (x) EV/Sales (x) EV/EBITDA (x) P/BV (x)
(` b) FY17 FY18E FY19E FY17 FY18E FY19E FY17 FY18E FY19E FY17 FY18E FY19E
Parag Milk 20.9 80 26 21 1.3 1.1 1.0 21.4 12.4 10.9 3.1 2.9 2.6 Prabhat Dairy 17.3 62 40 29 1.4 1.3 1.1 15.1 13.1 11.0 2.5 2.4 2.2 Kwality 14.1 7 11 8 0.4 0.4 0.4 6.3 6.2 5.2 1.3 1.2 1.0 Heritage Foods 34.6 52 57 37 1.3 1.3 1.2 23.8 24.3 17.9 11.5 9.8 8.0 Hatsun Agro 112.6 84 67 53 2.8 2.6 2.2 31.3 27.5 23.9 32.4 24.8 19.0
Sector Report DAIRY 13 April 2018
3
Contents
Investment thesis – Good time to accumulate
Milk consumption trend in India …………………………………………………………..……………………………………………………...5
India set to become largest producer of milk ………………………………………………………………………………………………..6
Rise of an organized industry ………………………………………………………………………………………………………………………..7
Key industry growth drivers …………………………………………………………………………………………………………………..……………...8
Product wise scope and dynamics ………………………………………………………………………………………….…….……………………….11
Key success factors for dairy business in India …………………………………………………………………………….………………………..15
Process followed by companies from procurement to dispatch …………………………………………………….……………………..20
Profitability of milk and milk products ……………………………………………………………………………………………………….………...21
Amul model of success ………………………………………………………………………………………………………………………………………...24
Key risks ……………………………………………………………………………………………………………………………………………………………...25
Comparison on key financial matrices …………………………………………………………………………………………………………….…...26
Sector Valuation and Financial Summary………………………………………………………………………………………………………..….…27
Companies Section
Parag Milk Foods (PARAG)………………………………………………………………………………………………………………………………….…..…31
Kwality Ltd (KDL)…………………………………………………………………………………….…………...……………………………………………….…..41
Heritage Foods (HTFL)…………………………………………………………………………………………..…………………………………….…..…….….50
Hatsun Agro Products (HTSFM)……………………………………………………………………………………………..……………………..…..….……58
Prabhat Dairy (PDL)…………………………………………………………………………………..…………………………………………………...….………66
Sector Report DAIRY 13 April 2018
4
Investment Thesis
Good time to accumulate
Dairy Sector – Play on huge unorganized market and rising demand for VAP
With population size of 1.32b growing at 3-4% CAGR, rising urbanization, health awareness and disposable income there is tremendous potential for growth for Indian dairy players. Organized dairy industry is slated to witness higher growth as overall organized share in milk products is less than 25-30%. In fresh milk product category there is huge scope for private dairies as organized market share is as low as 5% in Paneer and ~7-8% in curd. Only ~20% of total Indian milk production is procured, processed and sold through by organized dairies in India. Overall industry clocked 4.5% volume CAGR during FY10-16 with organized segment posting 9.5% volume CAGR over same period. In value terms, dairy sector logged an impressive 16.9% CAGR during the period led by better realization and value-added products (VAP), which grew 23% CAGR Vs 15% for liquid milk. Going forward, we expect industry volumes to post 4.8% CAGR and ~14-15% CAGR in value terms to `8.2tn over FY17-20E.
Improving reach to consumer generating higher demand
With their efficient operations in both procurement as well as processing private players are now increasing their reach by duplicating their success in one markets to others. Few of the companies under coverage are aiming to become pan India players by 2022. Although Amul and other state cooperatives are already milking the gains due to their balance sheet size, private players have made their presence felt with their focus on consumer requirements. Improving reach to consumers generate demand for other dairy products because consumer can see entire products range under one roof. Companies are spending on branding activities and creating a space in consumer mind. We believe premiumisation trend in consumer market will continue as consumers are willing to pay premium for health and leisure.
Winners of the Sector
Companies having deeply rooted distribution network, efficient procurement systems, optimum product portfolio and consistent track record of quality will be the winners in the long run. Companies having transparency in raw milk procurement have developed long lasting relationships with farmers and they benefit in lean production periods. We expect Heritage being an agile player to be ahead of peers as it has expanded its reach of products across 15 states in India and also focusing on VAP to improve its product portfolio. Hatsun is another winner duplicating its success in one state and multiplying in others. Hatsun has also built most transparent milk collection systems which aided to gain trust of farmers and milk producers. However they both have been awarded well by investors. Parag and Prabhat have stated their journey bit late and started focusing on high margin high investment VAP. They have successfully created own brands within dairy space to promote VAP. We expect them to deliver strong earnings performance once capacity utilisation improves as distribution reach is growing. Kwality despite being second largest player has suffered over last one year due to its inefficiency in capital allocation. However if management is able to deliver on its own stated strategic path of focusing on B2C and increasing share of direct procurement, we believe it will be an outperformer.
Valuation of the Sector
With uncertain market environment there are limited opportunities for long term investors and dairy sector being resilient due to stable consumer demand provides good opportunities. Indian Dairy sector is in growth phase as share of organized industry is expected to rise across categories within the space. Companies focused on B2C segment are expected to grow faster than companies focusing on commodity and Fresh milk products. In terms of margins companies focused on Fresh milk products category for B2C are expected to perform better in coming 2-3 years. So the companies who will remain focused on dairy business and deliver higher growth as well as share it with its stakeholders will trade at higher multiples such as Hatsun and Heritage. Parag and Prabhat has an opportunity to deliver higher growth as VAP market is expanding and companies have first mover advantage in certain segments. Kwality can prove itself as a great value buy if it delivers. We initiate coverage with BUY on Prabhat, Parag, Kwality and Heritage and HOLD on Hatsun.

Sector Report DAIRY 13 April 2018
5
Good time to accumulate
Milk consumption trend in India
India’s per capita monthly expenditure on consumption of milk and milk items has shown growth of 9.5% over last four decades, making Indian dairy industry fastest growing in the world valued at ~`6lac crore with estimated production of 169mmt in FY18. Dairy sector contributes 27% to the agriculture GDP of India and involve over 70m rural households in dairying. The overall industry is estimated to record 13-15% CAGR over FY2017-20, to reach `8.2lac crore, underpinned by a growth in volume and realization. India is the world’s largest milk producer and consumer, accounting for 19% of the world’s milk production and 21% for global consumption.
India’s per capita milk consumption, at 97 litres per year, is lower than other major milk markets, except China. India’s per capita milk consumption is estimated to log 3% CAGR versus 1% CAGR globally led by higher population growth and rising yield. Rising population and yield provides further scope for higher per capita consumption, aided by growth in value-added products. Burgeoning demand for dairy products in India is reflected in not only per capita consumption, but is also apparent from rising expenditure on dairy products by households—which has grown at a faster ~10% plus CAGR over the past 10 years. Dairy products account for 19% of household expenditure on food on an average.
Exhibit 3: PCMCE on Milk grew 9.5% CAGR (in `)
Source: MoRD, Trust
Exhibit 4: PCMCE on meat, egg and fish (in `)
Source: MoRD, Trust
Indian dairy industry can be classified into Commodity dairy products having low margin but highest asset turn (Pouch milk, Skimmed milk powders (SMP), Dairy whitener); Fresh Milk Products having higher margins than pouch milk (viz. curd, buttermilk, ghee, butter, ice cream and paneer) and Premium Value Added Products having highest margins but low asset turn and return ratios (cheese, spreads, whey). We believe Fresh milk product category is in sweet spot and will see maximum volume growth as today’s generation has no time to prepare these products at home unlike past. Organized industry is even slated to witness higher growth as overall organized share in milk products is less than 25%. In fresh milk product category there is tremendous scope for private dairies as organised market share is as low as 5% in Paneer and ~7-8% in curd.
India set to become largest producer of milk
India’s milk production stood at ~163mmt in FY17 out of which over 40% of the milk production is retained by producers for household consumption and ~41% share is with the unorganized segment. Only 19% is procured, processed and sold through by organized dairies in India. Overall industry clocked 4.5% volume CAGR during FY10-16 with organized segment posting 9.5% volume CAGR. In value terms, the sector logged an impressive 16.9% CAGR during the period led by better realization and value-added products, which grew 23% annually versus 15% for liquid milk. Going forward, we expect industry volumes to post 4.8% CAGR and ~14-15% CAGR in value terms to `8.2tn over FY17-20E. Organized industry is expected to take lions share out of this mainly led by better systems and processes in place to eradicate pilferage and wastage.
India has emerged as top producer of milk over last few decades inspired by the growth story of Amul (Anand Milk Union Ltd). The Amul Model was initiated with an aim to bring out a much needed change in the socioeconomic conditions of the people. In the meantime the National Dairy Development Board (NDDB) was established in 1965 at Anand. NDDB had come up with the most popular and successful dairy development programme known as “Operation Flood” or “White Revolution”; a national-scale, federally sponsored intervention, was one of the world’s largest rural development programme which has transformed the face of India’s Dairy industry. The Operation Flood Programme, organizing dairy farmers' cooperatives in rural areas and linking them with urban consumers created a strong network for procurement, processing, and distribution of milk over lakh
0
40
80
120
160
200
Dec
-71
Mar
-74
Jun
-76
Sep
-78
Dec
-80
Mar
-83
Jun
-85
Sep
-87
Dec
-89
Mar
-92
Jun
-94
Sep
-96
Dec
-98
Mar
-01
Jun
-03
Sep
-05
Dec
-07
Mar
-10
Jun
-12
Rural Urban
0
16
32
48
64
80D
ec-
71
Ma
r-7
4
Jun
-76
Sep
-78
De
c-8
0
Ma
r-8
3
Jun
-85
Sep
-87
De
c-8
9
Ma
r-9
2
Jun
-94
Sep
-96
De
c-9
8
Ma
r-0
1
Jun
-03
Sep
-05
De
c-0
7
Ma
r-1
0
Jun
-12
Rural Urban

Sector Report DAIRY 13 April 2018
6
villages in rural India. Started with the three fold objectives of increasing milk production, augment rural income and reasonable prices for consumers, this programme has been implemented in three different phases by NDDB. The Operation Flood Programme successfully ran for 26 years and eventually helped India to emerge as the world’s largest milk producer.
Exhibit 5: Milk production in India (mt)
Source: Economic Survey FY17, Trust
Exhibit 6: Per Capita Availability in India (gpd)
Source: MoF, Trust
Rise of an organized industry
Inspired by huge potential in dairy business and to capture the entire value chain of milk, various small scale ambitious entrepreneurs came in front investing in the industry and taking advantage of ineffectiveness of co-operative segment. Over last two decades many such private dairy players have successfully made a remarkable progress. Today the organized dairy sector is gradually enhancing its share in the overall dairy market. It has improved its share from 17% in 2010 to the present level of 22%, and going ahead, it is expected to garner a 26-27% share by 2020 in the overall dairy industry. Led by improving demographics, increasing urbanization, change in consumers’ dietary patterns and a cognizant shift towards packaged food, the organized dairy sector is estimated to grow nearly 2.5x, from an industry size of ~`1.2lac crore to over `2.5lac crore, by 2020.
Dairying has also become an important secondary source of income for millions of rural families and has assumed the most important role in providing employment and income generating opportunities particularly for women and marginal farmers. Most of the milk in the Country is produced by small, marginal farmers and landless laborers. 198 dairy cooperative milk unions have covered about 15.83 million farmers under the ambit of 1,70,992 village level dairy corporative societies up to March 2016. The Cooperative Milk Unions have procured an average of 42.55 million kgs per day of milk during FY16 as compared to 38 million kgs per day in FY15 depicting a growth of 12%. The sale of liquid milk by the Cooperative Dairies has reached 32 million liters per day during FY16 as compared to 31.24 million liters per day in FY15.
Exhibit 7: Organized dairy share growing rapidly
Source: NDDB, Companies, Trust
Exhibit 8: Tremendous scope for new products
Source: NDDB, Companies, Trust
0
40
80
120
160
FY9
2
FY9
3
FY9
4
FY9
5
FY9
6
FY9
7
FY9
8
FY9
9
FY0
0
FY0
1
FY0
2
FY0
3
FY0
4
FY0
5
FY0
6
FY0
7
FY0
8
FY0
9
FY1
0
FY1
1
FY1
2
FY1
3
FY1
4
FY1
5
FY1
6
Production (Million Tonnes)
0
70
140
210
280
350
FY9
2
FY9
3
FY9
4
FY9
5
FY9
6
FY9
7
FY9
8
FY9
9
FY0
0
FY0
1
FY0
2
FY0
3
FY0
4
FY0
5
FY0
6
FY0
7
FY0
8
FY0
9
FY1
0
FY1
1
FY1
2
FY1
3
FY1
4
FY1
5
FY1
6
Per Capita Availibilty (gms/day)
0.41.2
2.51.8
4.2
6.8
2010 2016 2020E
Organised dairy Unorganised dairy
12% cagr
20% cagrLiquid milk, 64
Ghee, 15
Paneer, 7
Curd, 5
Butter, 4
SMP, 1 UHT, 1Cheese, 1 Others, 1
Sector Report DAIRY 13 April 2018
7
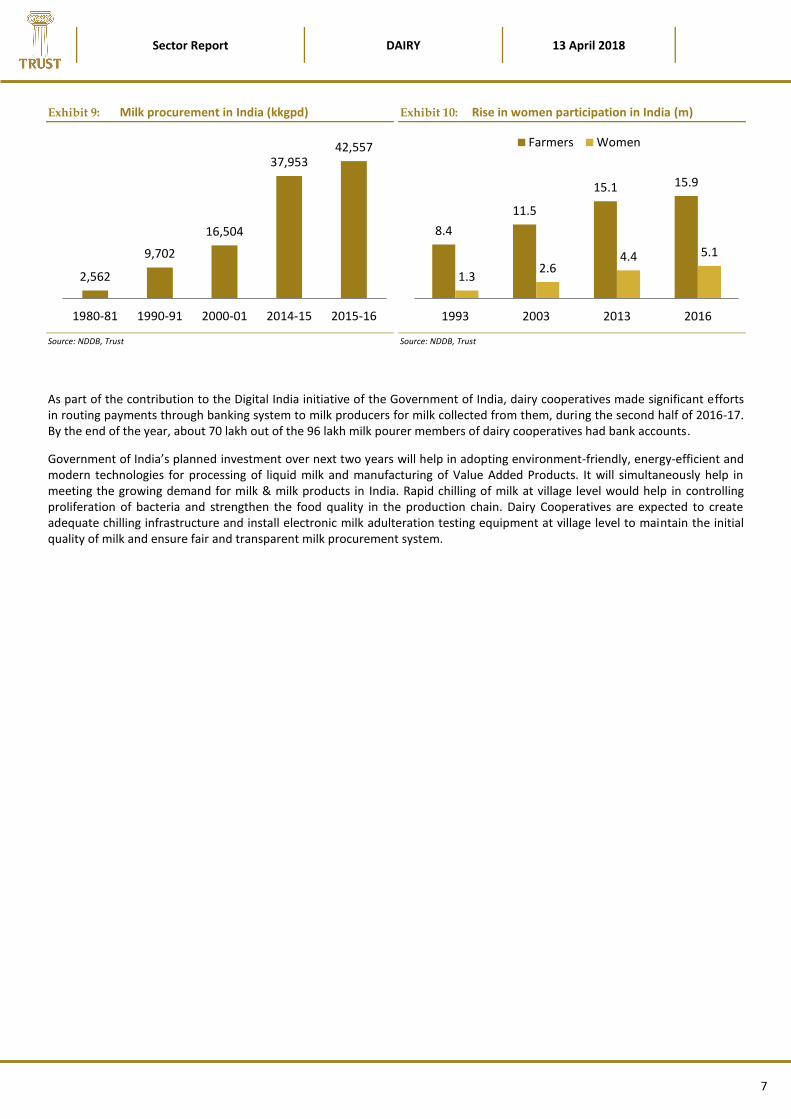
Exhibit 9: Milk procurement in India (kkgpd)
Source: NDDB, Trust
Exhibit 10: Rise in women participation in India (m)
Source: NDDB, Trust
As part of the contribution to the Digital India initiative of the Government of India, dairy cooperatives made significant efforts in routing payments through banking system to milk producers for milk collected from them, during the second half of 2016-17. By the end of the year, about 70 lakh out of the 96 lakh milk pourer members of dairy cooperatives had bank accounts.
Government of India’s planned investment over next two years will help in adopting environment-friendly, energy-efficient and modern technologies for processing of liquid milk and manufacturing of Value Added Products. It will simultaneously help in meeting the growing demand for milk & milk products in India. Rapid chilling of milk at village level would help in controlling proliferation of bacteria and strengthen the food quality in the production chain. Dairy Cooperatives are expected to create adequate chilling infrastructure and install electronic milk adulteration testing equipment at village level to maintain the initial quality of milk and ensure fair and transparent milk procurement system.
2,562
9,702
16,504
37,95342,557
1980-81 1990-91 2000-01 2014-15 2015-16
8.4
11.5
15.1 15.9
1.32.6
4.4 5.1
1993 2003 2013 2016
Farmers Women
Sector Report DAIRY 13 April 2018
8
Key Industry growth drivers
Young India and increase in population
India is the second most populated country in the world with nearly a fifth of the world's total population. According to the 2017 revision of the World Population Prospects, the population stood at 1.32b grew at CAGR of 1.9% over 1960-2016 Vs 1.3% of China and 1% of USA. And India is relatively young country with rising expectations. 65% of India’s population is below 40 and working age population (between 15 and 64 years) is expected to touch 1b mark surpassing China by 2030. With 50% of the population under 25 years of age, the large Indian young population is ready to experiment and try out new milk products. The opportunity is there for domestic players to capitalize understanding taste and preferences of Indians.
Dual income households leading to higher usage of VAP due to lack of time
The number of dual household incomes is gradually increasing, leading to higher disposable incomes and readiness to try out value added products. NSSSO data suggests that over 2005-2012 both rural and urban households have increased their expenditure on VADP at ~16% CAGR compared to liquid milk CAGR of 10-12%. Traditional small dairy shops/ milkmen selling curd have disappeared today at least in urban areas with many of branded dairies launching their better quality curds and buttermilk. The uniformity and consistency of taste is aiding for them to improve mind share among consumers. Over last two decades, middle class population in urban India has been steadily growing backed by increasing job opportunities and improving economic activities; which is driving consumption. Dairy sector will be one of the key beneficiaries of Indian consumption story.
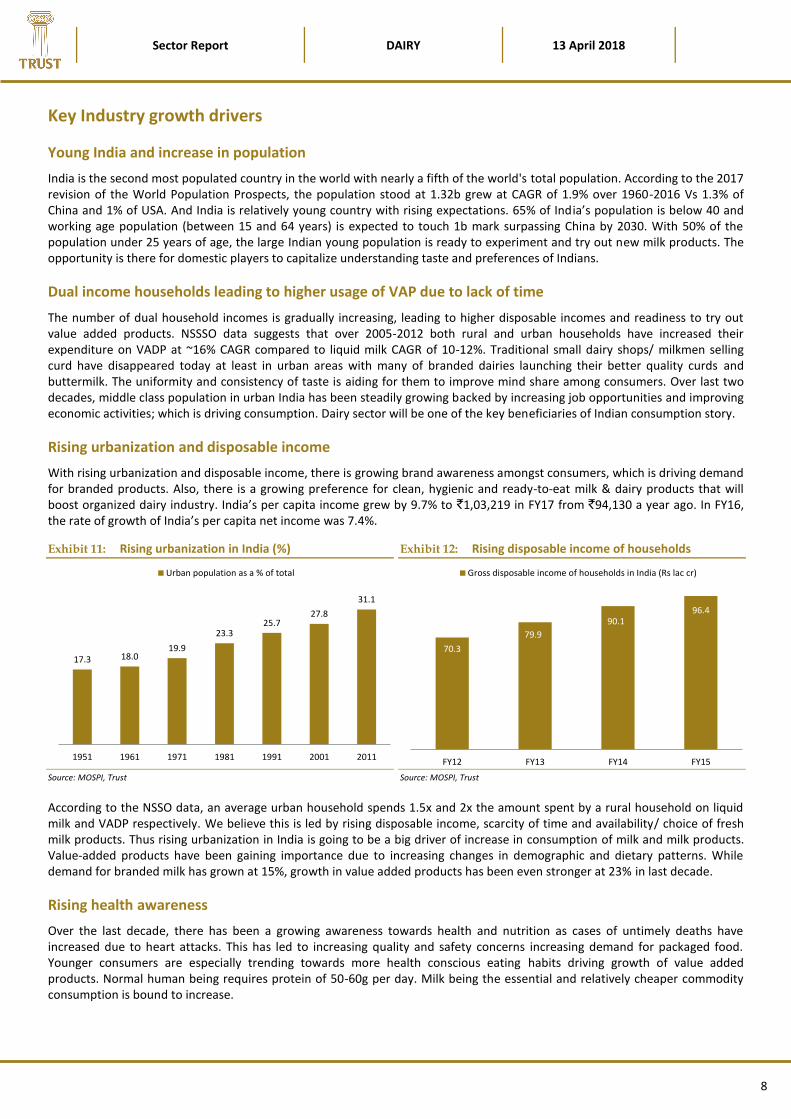
Rising urbanization and disposable income
With rising urbanization and disposable income, there is growing brand awareness amongst consumers, which is driving demand for branded products. Also, there is a growing preference for clean, hygienic and ready-to-eat milk & dairy products that will boost organized dairy industry. India’s per capita income grew by 9.7% to `1,03,219 in FY17 from `94,130 a year ago. In FY16, the rate of growth of India’s per capita net income was 7.4%.
Exhibit 11: Rising urbanization in India (%)
Source: MOSPI, Trust
Exhibit 12: Rising disposable income of households
Source: MOSPI, Trust
According to the NSSO data, an average urban household spends 1.5x and 2x the amount spent by a rural household on liquid milk and VADP respectively. We believe this is led by rising disposable income, scarcity of time and availability/ choice of fresh milk products. Thus rising urbanization in India is going to be a big driver of increase in consumption of milk and milk products. Value-added products have been gaining importance due to increasing changes in demographic and dietary patterns. While demand for branded milk has grown at 15%, growth in value added products has been even stronger at 23% in last decade.
Rising health awareness
Over the last decade, there has been a growing awareness towards health and nutrition as cases of untimely deaths have increased due to heart attacks. This has led to increasing quality and safety concerns increasing demand for packaged food. Younger consumers are especially trending towards more health conscious eating habits driving growth of value added products. Normal human being requires protein of 50-60g per day. Milk being the essential and relatively cheaper commodity consumption is bound to increase.
17.3 18.019.9
23.325.7
27.8
31.1
1951 1961 1971 1981 1991 2001 2011
Urban population as a % of total
70.3
79.9
90.196.4
FY12 FY13 FY14 FY15
Gross disposable income of households in India (Rs lac cr)
Sector Report DAIRY 13 April 2018
9
Protein content in diet Item Protein in regular diet ` per kg Protein per kg Cost per g of protein (`) Chicken 35 g per 110g 350 318 1.1
Eggs* 6 g per unit 6 6 1.0
Fish 22 g per 100g 600 220 2.7
Cow Milk ** 8g per glass 45 35 1.3
Cheese 24-40g per 110g 472 363 1.3
Almond 8 g per 1/4 cup 800 210 3.8
Peanuts 9 g per 1/4 cup 150 260 0.6
Cashews 5 g per 1/4 cup 1,000 180 5.6
Flax seeds 9 g per 1/4 cup 560 180 3.1
Pigeon pea 44g per cup 150 220 0.7
Tofu 9.2 g per 110g 280 80 3.5
Soy beans 14 g per 1/2 cup 400 360 1.1
Source: Companies; Trust; * in piece, ** in litre
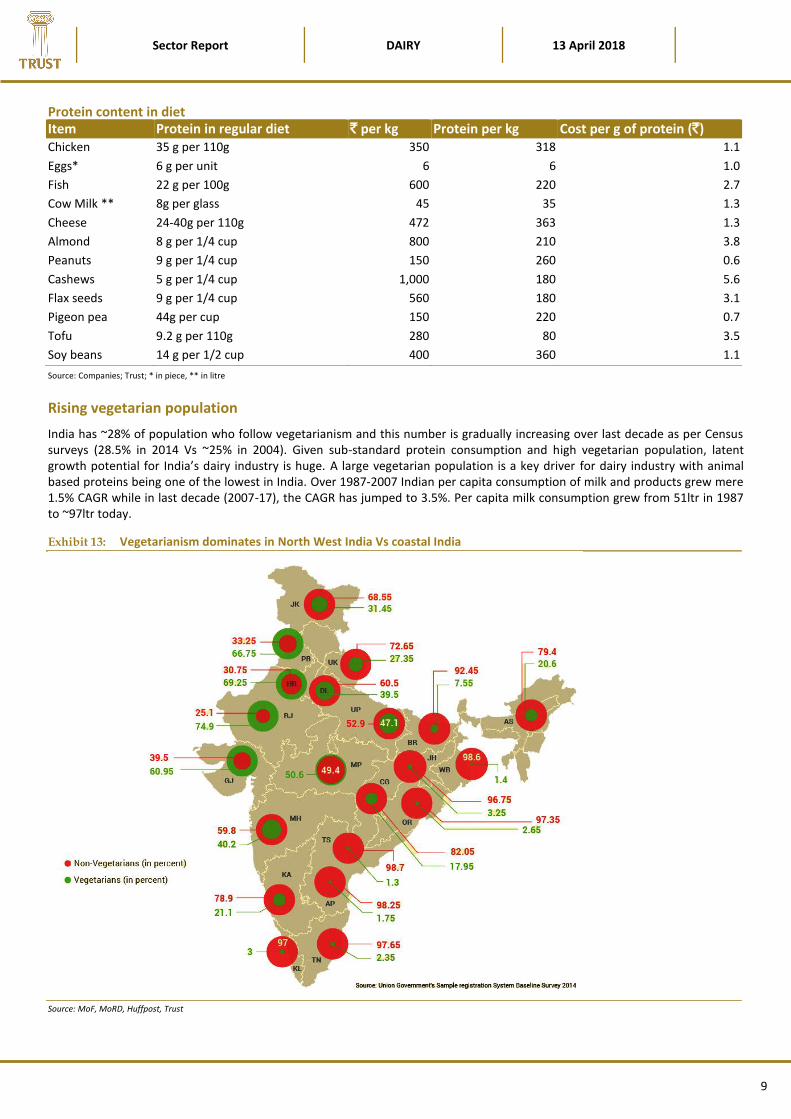
Rising vegetarian population
India has ~28% of population who follow vegetarianism and this number is gradually increasing over last decade as per Census surveys (28.5% in 2014 Vs ~25% in 2004). Given sub-standard protein consumption and high vegetarian population, latent growth potential for India’s dairy industry is huge. A large vegetarian population is a key driver for dairy industry with animal based proteins being one of the lowest in India. Over 1987-2007 Indian per capita consumption of milk and products grew mere 1.5% CAGR while in last decade (2007-17), the CAGR has jumped to 3.5%. Per capita milk consumption grew from 51ltr in 1987 to ~97ltr today.
Exhibit 13: Vegetarianism dominates in North West India Vs coastal India
Source: MoF, MoRD, Huffpost, Trust

Sector Report DAIRY 13 April 2018
10
Coastal Indian region depicts higher percentage of Non Veg eaters due to easy availability of fresh fish. However higher edible oils used in preparations of non veg dishes is impacting health. With a large vegetarian population at ~28-30%, overall protein consumption in India is significantly lower than in other countries and at mere <10% of total calories consumed. Further, animal-based protein consumption is lowest in India at <15 grams per day and ~90% of the daily calorie intake from animal based sources is accounted by dairy. Given the strong correlation between income and current substandard protein consumption in India, we perceive immense growth potential for India’s dairy industry.
Protein content in diet: Milk growing faster than meat Meat Milk Eggs
Per capita consumption (Kg/yr) Per capita consumption (Kg/yr) Per capita consumption (Kg/yr) Region 1987 2007 CAGR 1987 2007 CAGR 1987 2007 CAGR
Developed 81.0 86.6 0.3 208.7 213.7 0.1 14.6 13.7 -0.3
Developing 16.9 29.6 2.8 37.5 55.2 2.0 3.6 7.4 3.7
South Asia 4.7 4.6 -0.1 52.3 72.0 1.6 1.1 2.0 3.2
Brazil 45.9 80.5 2.9 88.7 124.6 1.7 7.9 7.5 -0.3
China 20.4 53.5 4.9 4.5 28.7 9.7 4.9 17.4 6.5
India 4.1 3.3 -1.1 51.0 68.7 1.5 1.1 2.1 3.4
Source: companies; Trust Capital; * in piece, ** in litre
Initiatives taken to improve milk yields by Government and all stakeholders
India ranks first among the world’s milk producing Nations since 1998 and has the largest bovine population in the World. Milk production in India increased from 17mt in FY51 to 163mt in FY16 led by efforts of cooperatives, NDDB, private players and Government of India. Dairying has become an important secondary source of income for millions of rural families and has assumed the most important role in providing employment and income generating opportunities particularly for marginal and women farmers. Most of the milk is produced by animals reared by small, marginal farmers and landless labors.
Government of India has taken measures for strengthening the dairy sector through various Central sector Schemes like “National Programme for Bovine Breeding and Dairy Development”, National Dairy Plan and “Dairy Entrepreneurship Development Scheme”. The restructured Scheme National Programme for Bovine Breeding and Dairy Development (NPBBDD) was launched by merging four existing schemes i.e. Intensive Dairy Development Programme, Strengthening Infrastructure for Quality & Clean Milk Production, Assistant to Cooperatives and National Project for Cattle & Buffalo Breeding with requisite budget provision. The strategy involves improving genetic potential of bovines, producing required number of quality bulls, and superior quality frozen semen and adopting adequate bio-security measures etc. The scheme is being implemented by NDDB through end implementing agencies like state Dairy Cooperative Federations/Unions/Milk Producers Companies. Various programs undertaken by GoI to increase the milk production are: (i) Induction of high yielding milch animals, (ii) Calf rearing programme, (iii) Providing cattle/buffalo breeding services, (iv) Provision of health care to dairy animals, (v) Establishment of milk chilling units, (vi) Feed and fodder supply programme, (vii) Establishment of fodder block making units.
What are private dairies doing to attract farmers?
• Facilitating loans for the purchase of cattle through commercial banks;
• Facilitating cattle insurance;
• Conducting health camps for animals through mobile veterinary clinics at frequent intervals;
• Supply of high quality cattle feed and fodder seeds;
• Helping to source good productive animals to farmers;
• Supply of milk analyzers for ensuring accurate measurement of milk quality.
• And ensuring timely payment to farmers.

Sector Report DAIRY 13 April 2018
11
Indian dairy industry: Product-wise scope and dynamics
Liquid milk
Liquid milk, which constitutes largest segment of Indian dairy industry, is valued at `3.5t and accounts for ~65% of industry sales. While ~77% of liquid milk is sold through unorganized segment, the organized segment is growing much faster. At present, organized segment is strongly dominated by local state co-operatives like Amul, Nandini, and others. However, private players like Hatsun Agro, Heritage, and Parag have established a strong presence in specific geographies. This business helps to develop a strong sourcing and distribution network, to develop strong brands, and to expand retail business. Dairy cooperatives like Amul, Karnataka Milk Federation (Nandini) and Mahanand Dairy are key players in the organized liquid milk market. Nestle and Britannia are predominant in UHT milk segment, which are packaged in tetra packs. These sell at 20-40% premium compared to milk sold in pouches and cater primarily to health conscious consumers and young professionals.
Exhibit 14: Indian liquid milk market (` b)
Source: Companies, Trust
Exhibit 15: Indian Ghee market (` b)
Source: Companies, Trust
Milk Powder
Milk powder manufacture is a simple process now carried out on a large scale. It involves the gentle removal of water at the lowest possible cost under stringent hygiene conditions while retaining all the desirable natural properties of the milk - color, flavor, solubility, nutritional value. Whole (full cream) milk contains, typically, about 87% water and skim milk contains about 91% water. During milk powder manufacture, this water is removed by boiling the milk under reduced pressure at low temperature in a process known as evaporation. The resulting concentrated milk is then sprayed in a fine mist into hot air to remove further moisture and so give a powder. Approximately 13 kg of whole milk powder (WMP) or 9 kg of skim milk powder (SMP) can be made from 100 litres of whole milk.
Ghee
Ghee, the second most consumed product of Indian dairy industry (~`800b), contributes 15% to industry sales, within which organized sector contributes ~20%. Players from cooperatives are strong in this segment. Further, private players are also incrementally gaining a foothold and capitalizing on segments like cow’s ghee owing to its health benefits. While companies like Amul and Parag cater primarily to the retail segment, players like SMC Foods and VRS Foods cater to the bulk segment.
Pure cow ghee currently accounts for less than 15% of India’s total ghee market. The segment is currently growing faster than the overall ghee market and entails higher margin. Parag was a pioneer and is a formidable player in this segment. Other major players include Amul, KMF (Nandini), Patanjali and Schreiber Dynamix.
1,259 1,422 1,619 1,843 2,102 2,3932,722
3,0893,535
3,9004,400
242284
348428
519629
760
918
1,070
1,394
1,668
FY10 FY11 FY12 FY13 FY14 FY15 FY16 FY17 FY18 FY19 FY20
Unorganised Organised
291 339 390 446 508 578657
746830
9401,048
5465
7893
110130
154
181
228
265
319
FY10 FY11 FY12 FY13 FY14 FY15 FY16 FY17 FY18 FY19 FY20
Unorganised Organised

Sector Report DAIRY 13 April 2018
12
Exhibit 16: Indian Cheese market (` b)
Source: Companies, Trust
Exhibit 17: Indian Paneer market (` b)
Source: Companies, Trust
Paneer
The Indian paneer market is huge at `325b with organized players contributing mere 2-3% to industry sales. The segment has humungous potential being majorly dominated by unorganized segment. Going ahead, demand from the institutional segment is expected to drive strong growth led by rising demand from restaurant and cafeteria businesses.
The organized segment is expected to grow faster at 20-22% CAGR than the unorganized segment (14%) over next few years. Given its large size and strong growth potential in the organized segment, it is a very important dairy category. Currently, 80% of demand is from institutional players and it is expected to increase significantly with growth in restaurant and cafeteria industries.
Curd
The Indian curd market (worth `235b) offers huge potential for private players as the organized segment accounts for mere 6-8% of overall market. Within the organized segment, cooperatives like Amul, Nandini, Hatsun and Heritage dominate. Further, it is attracting attention of private players due to strong margin led by convenience of packaged curd.
Curd category is expected to grow to `500b by 2020 growing at 15% CAGR. Institutional sales account for major portion of the category.
Exhibit 18: Indian Curd market (` b)
Source: Companies, Trust
Exhibit 19: Indian Buttermilk market (` b)
Source: Companies, Trust
5 6 8 9 12 1520
2734
43
56
FY10 FY11 FY12 FY13 FY14 FY15 FY16 FY17 FY18 FY19 FY20
161 190 216249
286328
375429
489555
629
512
1315
16
18
19
21
24
27
30
FY10 FY11 FY12 FY13 FY14 FY15 FY16 FY17 FY18 FY19 FY20
Unorganised Organised
118 136 155180
205236
271310
355403
456
512
1315
16
18
19
21
24
27
30
FY10 FY11 FY12 FY13 FY14 FY15 FY16 FY17 FY18 FY19 FY20
Unorganised Organised
6 8 9 1114
1721
2530
38
46
FY10 FY11 FY12 FY13 FY14 FY15 FY16 FY17 FY18 FY19 FY20

Sector Report DAIRY 13 April 2018
13
Cheese
Cheese entails humungous potential, having clocked 27% CAGR over 2007-14 and further expected to post a robust 31% CAGR over FY15-20E to `59.4b in 2020. The spurt will be led by strong growth in India’s fast food market driven by pizzas, burgers, sandwiches, etc. Further, strong consumption trends in tier II/III cities are increasingly driving demand in the HORECA segment. Retail and institutional demand constitute 50% each.
Cheese: Cheese is still a nascent category in India, valued at `11.7bn in 2014 as against ghee, which was valued at `618bn. However, it is among the fastest growing dairy categories in India and saw 27% CAGR in 2007-14. With improving consumption patterns, it is expected achieve 31% CAGR in 2015-20. Retail and institutional businesses account for 50% each of total cheese sales. Maharashtra accounts for 33% of total cheese consumption followed by Gujarat, Delhi, and Tamil Nadu at 16%, 7%, and 7%, respectively. Amul, PARAG, and Britannia are the largest players in cheese.
Buttermilk
Buttermilk category, valued in 2014 at `13.8b, is expected to explode to `43bn by 2020 growing at 21% CAGR. The segment is currently dominated by cooperatives from Gujarat, Tamil Nadu and Karnataka. PARAG has a popular offering, called Go Buttermilk, in this space in Urban markets of Maharashtra.
Exhibit 20: Indian UHT milk market (` b)
Source: Companies, Trust
Exhibit 21: Indian Flavored milk market (` b)
Source: Companies, Trust
Whey
Whey is the by-product that is left after casein and milk-fat are separated from milk by coagulation, while manufacturing cheese. Only 35% of the produced volume, namely sweet whey, is edible. As per IMARC, the sweet whey powder market in India saw ~26% CAGR in 2007-14 to `3bn and volumes were 29,500MT in 2014. Key players include Amul, PARAG, and Schreiber Dynamix. Highly concentrated solutions of whey powder have realizations of more than five-times that of unprocessed whey. PARAG is the only domestic manufacturer of concentrated whey powders and the entire demand which was met by imports is expected to shift. PARAG aims to capitalize on this opportunity in India, which would help it improve realizations and margins.
UHT milk
UHT milk, valued in 2014 at `26b, accounts for less than 1% of the total milk market and 5% of the organized milk market. However, the category is expected to explode to `104bn by 2020 growing at 26% CAGR due to rapid urbanization and changing consumer preferences. UHT milk sells at 30-40% premium to fresh milk and provides higher margins. The segment is currently dominated by cooperatives (more than 80% of sales). PARAG is the largest private player in this space.
10 13 16 21 2633
4253
68
86
108
FY10 FY11 FY12 FY13 FY14 FY15 FY16 FY17 FY18 FY19 FY20
5 6 8 1013
1620
2530
36
45
FY10 FY11 FY12 FY13 FY14 FY15 FY16 FY17 FY18 FY19 FY20

Sector Report DAIRY 13 April 2018
14
Flavored milk
Flavored milk market in India saw 26% CAGR during 2007-2014 to touch `12.6bn in 2014; it is expected to grow to `47.8bn in 2020 (25% CAGR). Currently, dairy co-operatives dominate the organized segment and Amul is the market leader with 33% market share. PARAG is present in the category through the ‘Topp Up’ brand. Compared to liquid milk, which sells at around `45 per litre, flavored milk sells at about `125.
Flavored and frozen yoghurt
Flavored and frozen yoghurt market in India saw 36% CAGR during 2011-2014 to touch ` 2.3bn in 2014; it is expected to grow to ` 12.1bn in 2020 (32% CAGR). Growth in the category has been driven primarily by increasing health consciousness among the urban middle class. The segment was pioneered by Parag Milk Foods in 2010 with the launch of Go Fruit and Dahi. Currently, Amul, Mother Dairy and Britannia are the market leaders in the category.
Exhibit 22: Flavored and Frozen Yoghurt market (` b)
Source: Companies, Trust
Exhibit 23: Indian Lassi market (` b)
Source: Companies, Trust
1 12 2
34
57
10
14
FY11 FY12 FY13 FY14 FY15 FY16 FY17 FY18 FY19 FY20
5 6 8 1013
1619
2227
32
39
FY10 FY11 FY12 FY13 FY14 FY15 FY16 FY17E FY18E FY19E FY20E

Sector Report DAIRY 13 April 2018
15
Key success factors for dairy business in India
Strategically located manufacturing units: As most of the dairy products have low shelf life, it is difficult to
manufacture them at a central location and distribute pan-India like FMCG products. Hence, it is crucial to have a network of multiple production units across the country to have maximum reach.
Procurement of raw milk: One of the ways of ensuring high quality milk is by taking care of the cattle that produce it. For
dairy companies it is crucial to have direct raw material sourcing from farmers as milk selling prices are to some extent controlled by milk cooperatives in India. So developing strong relationships with farmers by aiding them to produce high quality milk from cattle is important as more than 70% of India’s milk production is still produced by farmers and villagers owing 2-5 cattle unlike foreign countries.
Consistency in taste: To gain mind share of consumers’ consistency of taste of any food product along with hygiene is
essential. Amul has scored in this regard with consumers relishing the taste over last many decades now and it will be significant challenge for private players to break the monopoly in value added products. Parag tried to lure consumers with freebies (free puzzle games for kids) on cheese however it will lead to dilution of margins and kids are not the decision makers for buying cheese unless they start loving the taste of it. Building a credible brand in any business takes time, although companies are on right track Amul is decades ahead of its new peer set.
Distribution reach and availability of products: Some dairy products are shelf stable and some require chilled
temperatures. Products such as ice creams require backup of freezers. Fresh milk products are perishable in nature. Establishing distribution is extremely crucial so that products are available to consumers. If product is consistently available to consumers they will try and will come for repeat sales if they like. In our field survey in Mumbai suburbs we have observed that Amul has started dominating other cooperative brands. As seen in the below exhibit 26, it is relatively a big shop than Aarey with almost all products available giving consumers more choice to choose from.
An optimum product portfolio to ensure higher profitability: A range of products is crucial to attract consumers
across income levels and across needs. It is important to have a right mix of milk business as well as value-added products so as to minimize working capital investments and maximize the return ratios. A right mix of fresh milk products and premium VAP will aid margins and return ratios. Companies with high milk sales (Heritage and Hatsun at ~65‐70% of revenue) have seen their direct procurement network scale up resulting in higher RoCE. Now these players are leveraging their established milk brands to expand their premium VAP share. Premium VAP is an attractive opportunity as VAP products are poised to grow at higher rate and command ~1.5‐2x higher EBITDA margins.
Sector Report DAIRY 13 April 2018
16
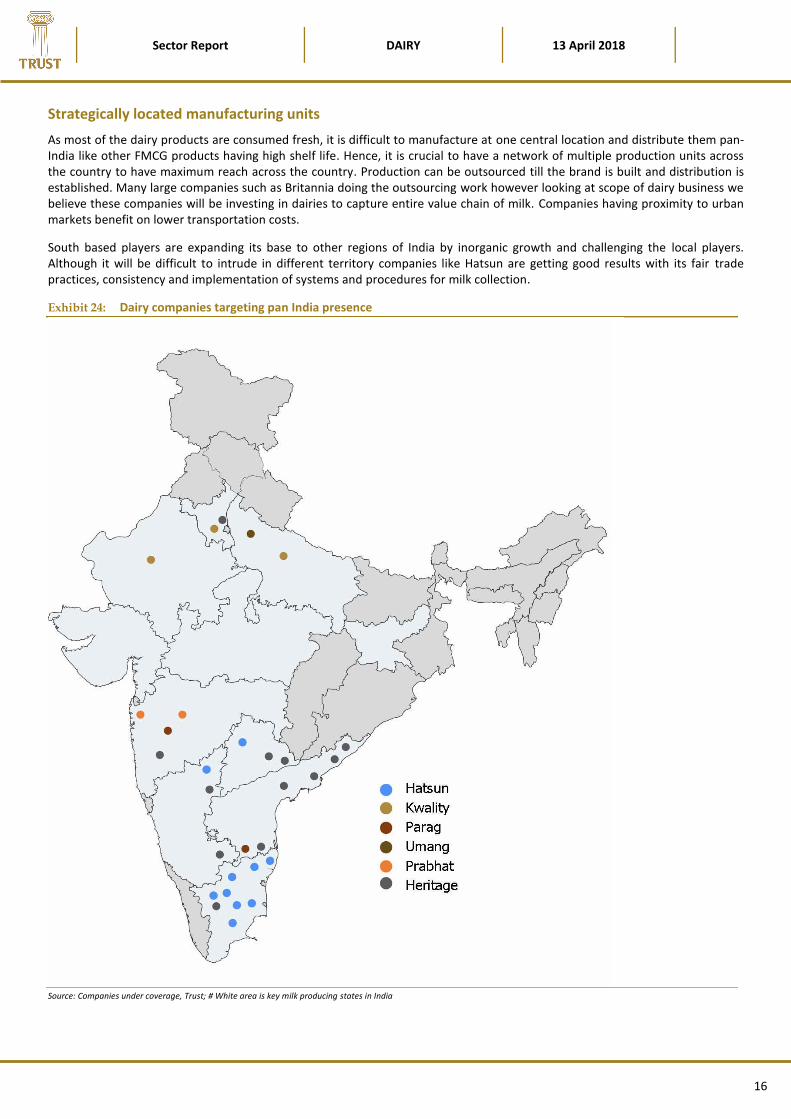
Strategically located manufacturing units
As most of the dairy products are consumed fresh, it is difficult to manufacture at one central location and distribute them pan-India like other FMCG products having high shelf life. Hence, it is crucial to have a network of multiple production units across the country to have maximum reach across the country. Production can be outsourced till the brand is built and distribution is established. Many large companies such as Britannia doing the outsourcing work however looking at scope of dairy business we believe these companies will be investing in dairies to capture entire value chain of milk. Companies having proximity to urban markets benefit on lower transportation costs.
South based players are expanding its base to other regions of India by inorganic growth and challenging the local players. Although it will be difficult to intrude in different territory companies like Hatsun are getting good results with its fair trade practices, consistency and implementation of systems and procedures for milk collection.
Exhibit 24: Dairy companies targeting pan India presence
Source: Companies under coverage, Trust; # White area is key milk producing states in India

Sector Report DAIRY 13 April 2018
17
Procurement of raw milk
One of the ways of ensuring high quality milk is by taking care of the cattle that produce it. For dairy companies it is extremely important to have direct raw material sourcing from farmers as milk selling prices are to some extent controlled by milk cooperatives in India. So developing strong relationships with farmers by aiding them to produce high quality milk from cattle is important as more than 70% of India’s milk production is still produced by farmers and villagers owing 2-5 cattle unlike foreign countries. Proportion of milk sourced from buffaloes is also higher in India as Indians have developed taste for buffalo milk. In North India, usage of milk from buffaloes is much higher than that of South India. With rising awareness of health however urban India has started consuming cow milk over last two decades as cow milk is easier to digest for children.
Dairy companies can procure milk directly or through local agents. Agents may have their own village collection centres or collect milk from the farmer’s door step. While the capital required for setting up own procurement network is substantial, it is profitable in the long run for the dairy company which incurs the same. Selling prices of milk to the end-consumers generally remain similar in any particular region. In this case, the companies need to keep a tab on the costs of milk sourcing. Companies over the last two decades have built infrastructure for direct milk procurement from farmers and enjoying competitive edge as it assures steady milk supply and consistency in milk quality at relatively lower prices. Heritage at ~95%, Hatsun ~100%, Parag ~80% and Amul at 100% score high in terms of direct procurement by increasing geographical reach.
Whenever India faces deficient monsoon cattle productivity generally declines; resulting in lower milk supply and sharp price inflation. A company with direct relationship with farmers may face the heat of steep inflation during such periods but the quality milk supply is relatively assured. And elimination of agents aids in securing better quality milk at relatively lower cost.
Some of the issues faced while procuring milk through the local agents are
• Agents pay the farmers based on the quantity of milk. But qualitative checks (Fat and SNF) are required for more consistency. Capex may be needed to assess and pay based on quality. (Abroad, there are milk trucks that have inbuilt testing and segregated storage facilities for exactly this)
• Lower quality milk cannot be used to produce value added products like paneer, curd, butter milk Agents may not have their own chilling facilities, it is essential that milk be chilled within an hour after milking
• Agents sell milk to companies which pay them the highest, hence dairy companies may not get consistent supplies from agents
• Poor quality milk increases the cost of the dairy companies as they have to reject the bad quality milk and source good quality milk from another source
• Agents are unable to provide inputs; dairy companies will provide inputs to farmers for providing better qual ity milk. A dairy company may provide inputs on the kind of fodder for the livestock, information on veterinary services and prompt payments
It is essential that milk be chilled at +4 degrees C after milking and kept at this temperature until the milk reaches the dairy for further processing. Chilling prevents microbial growth which if left unchecked will lead to spoilage and quality of the final product.
A dairy company looking to set up its own direct procurement network will have to invest in collection centres (where they pay according to quality) and in chillers/coolers for quality maintenance. Before the electrically run coolers were a norm, milk collected had the reach the diary plant by 8:30 AM before day temperatures rose and farmers had to start milking very early. But now they can procure at any time. However consistent supply of power or proper generator back up is required for the smooth functioning of the cooler.
The chilled milk is then transported to the diary processing unit in milk tankers. The distance between the collection point and the diary processing unit should be short as milk cannot be transported over long distances. So, a company needs multiple processing units too – which involves Capex, Real estate and labour cost upfront.
Consistency in taste
To gain mind share of consumers’ consistency of taste of any food product along with hygiene is essential. Amul has scored in this regard with consumers relishing the taste over last many decades now and it will be significant challenge for private players to break the monopoly in value added products. Parag tried to lure consumers with freebies (free puzzle games for kids) on cheese however it will lead to dilution of margins and kids are not the decision makers for buying cheese unless they start loving
Sector Report DAIRY 13 April 2018
18
the taste of it. Building a credible brand in any business takes time, although companies are on right track Amul is decades ahead of its new peer set. Hatsun and Heritage have been successful players in Southern states.
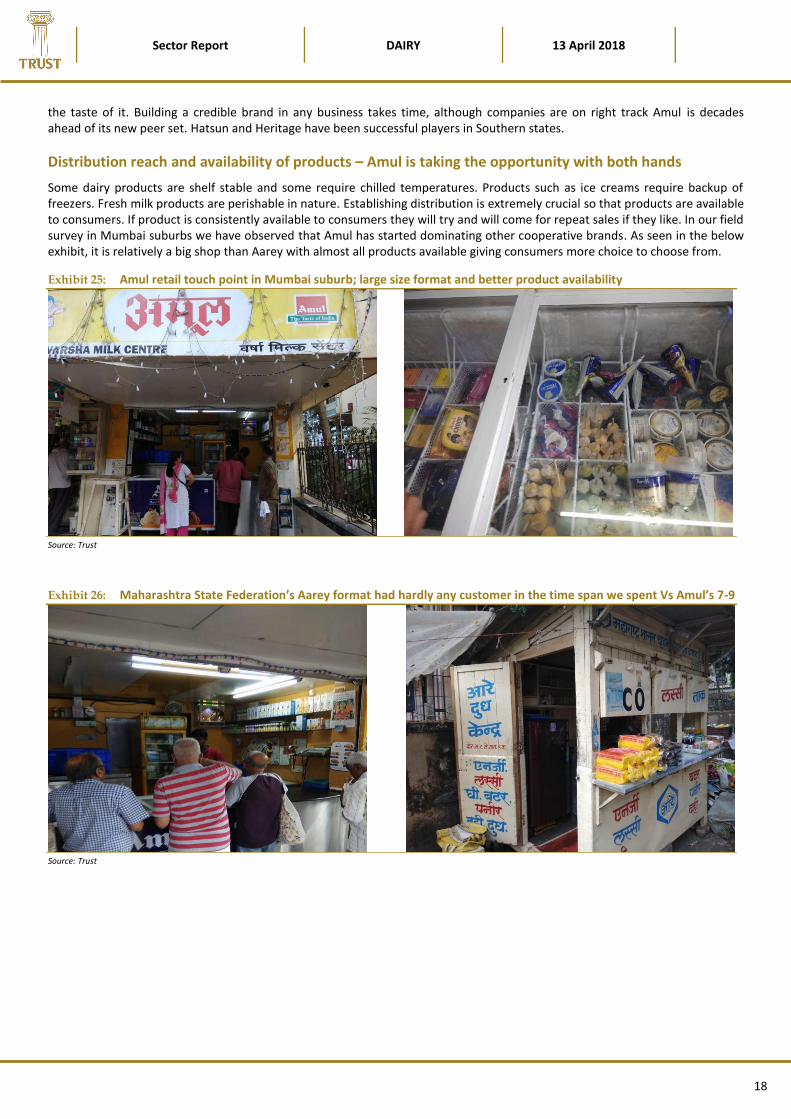
Distribution reach and availability of products – Amul is taking the opportunity with both hands
Some dairy products are shelf stable and some require chilled temperatures. Products such as ice creams require backup of freezers. Fresh milk products are perishable in nature. Establishing distribution is extremely crucial so that products are available to consumers. If product is consistently available to consumers they will try and will come for repeat sales if they like. In our field survey in Mumbai suburbs we have observed that Amul has started dominating other cooperative brands. As seen in the below exhibit, it is relatively a big shop than Aarey with almost all products available giving consumers more choice to choose from.
Exhibit 25: Amul retail touch point in Mumbai suburb; large size format and better product availability
Source: Trust
Exhibit 26: Maharashtra State Federation’s Aarey format had hardly any customer in the time span we spent Vs Amul’s 7-9
Source: Trust

Sector Report DAIRY 13 April 2018
19
Exhibit 27: Seen higher demand for fresh milk products over last 2-3 years; even entire premium products gets sold
Source: Trust
An optimum portfolio of products to ensure higher profitability
A range of products is crucial to attract consumers across income levels and across needs. It is important to have a right mix of milk business as well as value-added products so as to minimize working capital investments and maximize the return ratios. A right mix of fresh milk products and premium VAP will aid margins and return ratios. Companies with high milk sales (Heritage and Hatsun at ~65‐70% of revenue) have seen their direct procurement network scale up resulting in higher RoCE. Now these players are leveraging their established milk brands to expand their premium VAP share. Premium VAP is an attractive opportunity as VAP products are poised to grow at higher rate and command ~1.5‐2x higher EBITDA margins.

Sector Report DAIRY 13 April 2018
20
Process followed by dairy companies from collection to dispatch
Milk producers take care of cows like children, bath, feed cows -Grass and hay, no chemical feed
Keep them healthy and they give hygienic milk in return
Fresh milk is then transported to a nearby collection centre within 1-2km radius area
Milk producers bring the milk to the milk collection centre within one hour of milking
MCC collect the brought in milk, mix it with the dipper and place it in sample machine
Place the sample in the milk analyser machine, enter registered number of producer
Machine shows the FAT and SNF of the milk, pour milk into the bigger cans
Total quantity, rate and total amount is displayed on machine
The same information goes to the producers mobile phones
Milk collected gets transferred to Milk Chilling Centre within half an hour via small milk vans
Variety of tests are carried out on each can in the lactose scan for FAT and SNF
Then through milkoscreen they are checked for adulteration of sucrose, maltose, neutraliser, UCF, urea, etc.
MBRT test checks the bacteria level of milk
Then the milk is chilled to below 15 degree C and sent to the bulk cooler
Then it is chilled to 2.5 degree C and sent to storage centres
Then it is further tested, placed inside insulated trucks/ milk tankers and sent to dairy plant
Temperature of milk is measured at dairy and samples sent to testing
Then the tanker goes to weighing scale and then sampling unit
Organoleptic test on raw chilled milk for any sort of adulteration
32-45 tests including Methylene blue reduction test, acidity test for sourness, adulteration test, and protein levels are
conducted
The unloaded milk is stored in silos at 4 degree C, then standardised and pasteurised. Homogenise the milk by blending
the fat.
Then heat the milk to 82 degree C for 15 seconds, cool it down to 4 degrees immediately and store in silos
Test the milk again to ensure it is safe for consumption and pack it at 4 degrees and dispatch it
Benefits of homogenisation and pasteurisation
Homogenization can be defined as “the process designed to reduce the size of fat globules and making a permanent emulsion of milk fat and serum by the use of machine called as “homogenizer”. Homogenized milk is milk, which has been treated in such a manner as to insure breakup of the fat globules to such extent that after 48 hours of quiescent storage no visible cream separation occurs on the milk
Benefits: No formation of cream layer. Fat in milk does not churn due to rough handling or excessive agitation. Milk becomes more palatable. Produces soft curd and is better digestible, hence recommended for infant feeding.
Issues: Increased cost of production. Fat recovery is a problem - cannot churn. Greater tendency for milk seepage through bottle caps.

Sector Report DAIRY 13 April 2018
21
Profitability of milk and milk products
All the milk products have different profitability as well as return ratios within the dairy space. It is important to have a right product mix for optimization of ROCE at the company level. Liquid milk is low-margin but high ROCE business. Companies that are directly selling milk to end-consumers generate gross margin of 12-15%. As milk processing requires a day, milk distribution to retailers requires a day and the debtor day is also just one. The overall investment in current assets is three days, but the farmers are generally paid once or twice a month. Thus, the fresh milk business operates on a negative working capital basis.
Of the 5 dairy companies under our coverage, Heritage Foods, Hatsun, Kwality, Parag and Prabhat generates 77%, 23%, 34%, 22% and 40% of its revenues from liquid milk business respectively. Milk business provide raw materials for other VAP segments. A litre of milk has three components – fats, SNF and water. 4-5% fats; 7-8% SNF (solid but not fats) which includes protein, calcium and other minerals, while water accounts for rest of the content. When any company sells standard milk, it sells milk with 3-4% fats and saves some fats for manufacturing of other value added products. The pricing differs depending upon fat levels within milk. Dairy companies usually save fats by selling toned milk and raise profitability.
Based on the manufacturing pattern, we divide the products to see profitability as follows:
A. Fresh milk products
B. Ghee/Butter and skimmed milk powder
C. Cheese and whey powder
Amul being behemoth of dairy industry is expanding its footprint across metros and non-metros taking away business from traditional cooperatives and small milk vendors which have stopped keeping the Amul products goods as people prefer buying from Amul store only. However as industry size is large enough and growing, there will be few winners who focus on consistent quality, consumer requirement and distribution. Profitability of the above categories of products is discussed below:
Profitability of FMP: Curd, Buttermilk and Paneer
Region Curd Paneer Buttermilk
MRP (`/kg) 68 323 59
Less: Trade margin @20% 11 54 10
Company selling price 57 269 49
Less: GST 5% 3 13 2
Company net realisation (`/kg) 54 256 47
Milk required (Litres) 1 6.5 0.7
Price of milk (`/litre) 30 30 30
Raw material cost 30 195 21
Other raw materials @ 5% of sales 3 13 2
Packaging material @ 4% of sales 2 10 2
Total raw material cost (`) 35 218 25
Total gross profit 19 38 22
Gross margin (%) 35.4 14.8 46.3
Other costs @5% of sales 3 13 2
Product EBITDA 16 25 19
Product EBITDA margin (%) 30 10 41
Source: companies; Trust Capital; * in piece, ** in litre

Sector Report DAIRY 13 April 2018
22
Profitability of Ghee and Cheese
Region Ghee Cheese
MRP of Ghee (`/kg) 500 MRP of cheese (`/kg) 476
Less: Trade margin @15% 65 Less: Trade margin @15% 95
Company selling price 435 Company selling price 381
Less: GST 12% 47 Less: GST 12% 41
Company net realisation (`/kg) [A]
388 Company net realisation (`/kg) [ A]
340
Value of byproducts Whey powder generated (Kg) 0.2
SMP generated (kg) 2.2 MRP of Whey (`/kg) 3,400
SMP price/kg (`) 250 Whey powder net/kg assumed 680
Revenues of SMP [B] 550 Revenues from whey powder [B]
136
Total revenues [A+B] 938 Total revenues [A+B] 476
Milk required (litres) 24 Milk required (litres) 10
Price of milk (`/litre) 30 Price of milk (`/litre) 30
Raw material cost 720 Raw material cost 300
Other raw materials @5% of sales
47 Other raw materials @5% of sales
24
Packaging material @4% of sales
38 Packaging material @4% of sales
19
Total raw material cost (`) 804 Total raw material cost (`) 343
Total gross profit 134 Total gross profit 133
Gross margin (%) 14 Gross margin (%) 28
Other costs @5% of sales 47 Other costs @5% of sales 24
Product EBITDA 87 Product EBITDA 109
Product EBITDA margin (%) 9 Product EBITDA margin (%) 23
EBITDA /Litre 4 EBITDA /Litre 11
Source: companies; Trust Capital; * in piece, ** in litre, # While manufacturing cheese, the byproduct whey is also generated. Manufacturing of 1kg of cheese requires ~10 litres of milk.
In this process, whey is also generated. Of the total whey, only 33% is good for human consumption.

Sector Report DAIRY 13 April 2018
23
Amul a formidable behemoth in Indian dairy space
The cooperative sector is one of the well-designed segments of Indian economy and has contributed significantly for the growth and development of SMEs in India. In the cooperative segment the growth of dairy cooperatives during the last three decades has been quite impressive. It plays a predominant role in balancing the rural inequality by promoting growth in income, employment and social justice. Dairy cooperatives have enabled India to achieve self-sufficiency in milk and dairy products. AMUL- a pioneering and successful case of dairy cooperative, has changed the lives of poverty stricken farmers through its Operation Flood Programme, which is one of the world’s largest rural development programme.
In this 21st century growth with rapid pace has become a bare necessity for substantial poverty reduction in particular and for long run sustainable growth in general. The challenges which are appearing in the path of inclusive and equitable growth are not less for a developing economy like India, as the interest of all segments of people need to be addressed here. To make the growth process more equitable and inclusive, the 12th Five Year Plan (2012-2017) aimed at “faster, sustainable and more inclusive growth”. India is predominantly an agricultural country and the contribution of national GDP from agriculture is only 16 to 17 percentage and involving around 55 to 58 per cent of population (National Cooperative Union of India, 2012). In spite of this the rural mass of India is always being deprived of the basic necessities. Hence, poverty, food security, unemployment, quality education, and lack of other basic infrastructures are the common problems of rural India. Cooperative societies act as the catalyst to combat the above said problem to a greater extent as they promote inclusion and social upliftment through their unique approach towards business. Co-operatives are significant economic players in a developing economy like India which in general contribute to sustained economic growth and in particular assist to tackle rural poverty, expand poor people’s access to financial services, provides opportunities for self-determination and empowerment, social cohesion and transformation to name a few . Cooperatives in India covers a wide array of activities like credit & banking, fertilizer, sugar, dairy, marketing, consumer goods, handloom, handicraft, fisheries and housing. Among these the success of dairy cooperative has made India the world’s largest milk producer. From a milk-deficit status in the early 1960s, production has been increasing exponentially for the last two decades, growing from 56 million tons in 1991-92 to 127.9 in the year 2011-12. It is also expected that India’s milk production will be equal to that of whole European Union by 2021 (National Dairy Development Board, 2012). The whole credit for this goes to the dairy sector which is now the leading agricultural output in the country. As per IMARC (International Market Analysis Research and Consulting) Group, Indian Dairy Market driven by a strong growth in both urban and rural demand for milk products in India is expected to surpass US$ 163 Billion by 2017. India has achieved this level by involving the poor farmers and other people as producers, distributors and consumers. According to NDDB statistics, twelve million Indian farmers (primarily small, marginal farmers and landless laborers) are engaged in milk production, are organized in 122,500 village Dairy Cooperative Societies (DCS), supplying 23 million kilograms of milk per day, operate in more than 346 districts.
The Amul Model was initiated with an aim to bring out a great change in the socioeconomic conditions of the people. In the meantime the National Dairy Development Board (NDDB) was established in 1965 at Anand. This NDDB had come up with the most popular and successful dairy development programme known as “Operation Flood” or “White Revolution”. Operation Flood, a national-scale, federally sponsored intervention, is one of the world’s largest rural development programme which has transformed the face of India’s Dairy industry. The Operation Flood Programme, organizing dairy farmers' cooperatives in rura l areas and linking them with urban consumers created a strong network for procurement, processing, and distribution of milk over lakh villages in rural India. Started with the three fold objectives of increasing milk production, augment rural income and reasonable prices for consumers, this programme has been implemented in three different phases by the National Dairy Development Board designated by the Government of India. The Operation Flood Programme successfully ran for 26 years and eventually helped India to emerge as the world’s largest milk producer.
The Amul Model of dairy development is a three-tiered structure with the Dairy Cooperative Societies (DCS) at the village level affiliated to a milk union at the District level which in turn is further federated into a Milk Federation at the state level. The first tier- Village dairy cooperative society has membership of milk producers of the village and is governed by an elected management committee consisting of 9-12 elected representatives of the milk producers. The village society further appoints a secretary and member secretary of the management committee for management of day to day functions. A district dairy cooperative- the second tier has membership of village dairy societies of the district and is governed by a board of Directors consisting of 9-18 elected representatives of the village societies. It also appoints a professional MD for management of day to day function. The state level co-operative i.e., GCMMF is the third tier solely responsible for national and international marketing of milk and milk products.
All the chairmen of the district cooperatives are the members of GCMMF and this state level cooperative is managed by a board consist of the elected members from the chairmen of district cooperatives. The above three-tier structure was set up in order to delegate the various functions; milk collection is done at the Village Dairy Societies, milk procurement & processing at the District Milk Union, and milk & milk product marketing at the State Milk Federation. This helps in eliminating not only internal competition but also ensuring that economies of scale are achieved.

Sector Report DAIRY 13 April 2018
24
Exhibit 28: Amul model of success
Source: Amul website, Trust
The rural India represents 68% of India’s population with the total rural population of 845,151,713 as per World Bank Report, 2012. As per the UNDP report currently India’s poverty rate is 32.7% and per capita income is $1,330. We cannot dream for a poverty free nation without thinking about the rural segment. Dairy cooperatives across India are prime example of cooperatives which have promoted and sustained rural development. Today India has progressed from a milk-deficit country to the largest milk-producing nation in the world and for this the whole credit goes to the Amul pattern of dairy cooperatives. In the process, they have generated millions of days of employment for the rural poor and improved their socio-economic condition.
The prime reason behind the success of Amul pattern is its strategy to give benefit both to the farmers and customers i.e., farmers in the terms of fair price for their milk and for customers its high quality milk and milk products. What would have been middlemen’s profits in the earlier system got absorbed into development projects for primary producer or lower cost for the consumer. The Operation Flood Programme of Amul has succeeded in linking and creating a better network among the milk producers throughout India, thereby reducing seasonal and regional price variations while ensuring that the producer gets fair market prices in a transparent manner on a regular basis.
Cooperative dairying on the Amul Pattern forms a source of assured employment and a sustainable basis of competitive advantage for India. Although Operation Flood was not designed to eradicate the problems of poverty and unemployment, it is true that millions of landless, marginal, and small farmers who were engaged in milk production benefited greatly from the increased income and employment opportunities generated by Operation Flood Programme. Presently Amul is providing employment opportunity to millions of people both directly and indirectly in rural and urban areas.
Sector Report DAIRY 13 April 2018
25
Key risks:
Climate change and scarcity of water
Climate change and scarcity of water is a major threat to the dairy industry. The water supply is not sustainable and there is no alternative to water. Milk production could go down by 3 million tonnes over the next three years as the average temperatures rise, creating problems of water and availability of green and dry fodder for the cattle. Dairy company’s manufacturing operations are largely dependent on the supply of cow milk, which is the primary raw material for all the dairy products. Given the seasonal nature of the dairy industry, cattle farming patterns and no formal agreements with the farmers, availability of raw milk keeps on fluctuating which thereby could adversely impact the running of its operations.
Survival of the fittest
We expect competition to increase steadily as more and more companies targeting dairy sector and few MNCs too eyeing for increasing market share. Large established players such as AMUL, Britannia and Nestle are launching new products and mother of all FMCG players, ITC is eyeing for pan India dairy business. With its e-chaupal experience and astounding innovative products it can be difficult for smaller players to procure milk at lower cost. Britannia is also planning to introduce newer products to increase its presence in this category. Nestle generates over 45% of its revenues from the dairy and nutrition segment mainly via Everyday dairy whitener, slim milk and curd, milkmaid and flavored yoghurt. Companies like Patanjali and Coca- Cola have entered the dairy business and Pepsi has expressed its interest to enter the dairy segment. Competition is set to increase in the Indian dairy segment in the future. Few very strong but unlisted Co-operatives brands in competition are Amul (GJ), Nandini (Karnataka), Vijaya (AP), Verka (PB), Saras (RJ), Milma (Kerala), Gokul (Kolhapur) and Sudha (Bihar)
New Product Risk by MNCs who have better brand equity
Over the years few private players have been able to anticipate and respond to changing consumer preferences which helped in building strong consumer franchisee for their brands. However continuous investment in research and development along with introduction of new products and different variants of existing products by MNCs, based on consumer preferences and demand, can be a risk for smaller players as few of the MNCs present in India has better brand equity in consumers mind. The milk products are subject to risks such as contamination, adulteration and product tampering during their manufacture, transport or storage. Any real or perceived contamination in products, could subject it to regulatory action, damage its brand equity and thereby impact its business.
Rising labor cost
Over the last decade labor cost in rural areas has also increased significantly due to MNREGA. Cost of keeping and maintaining bovine is very high, whereas MNREGA provides easy earning to the rural population. However with rising women participation in the dairy sector it is aiding rural economy.
Sector Report DAIRY 13 April 2018
26
Comparison on key financial matrices
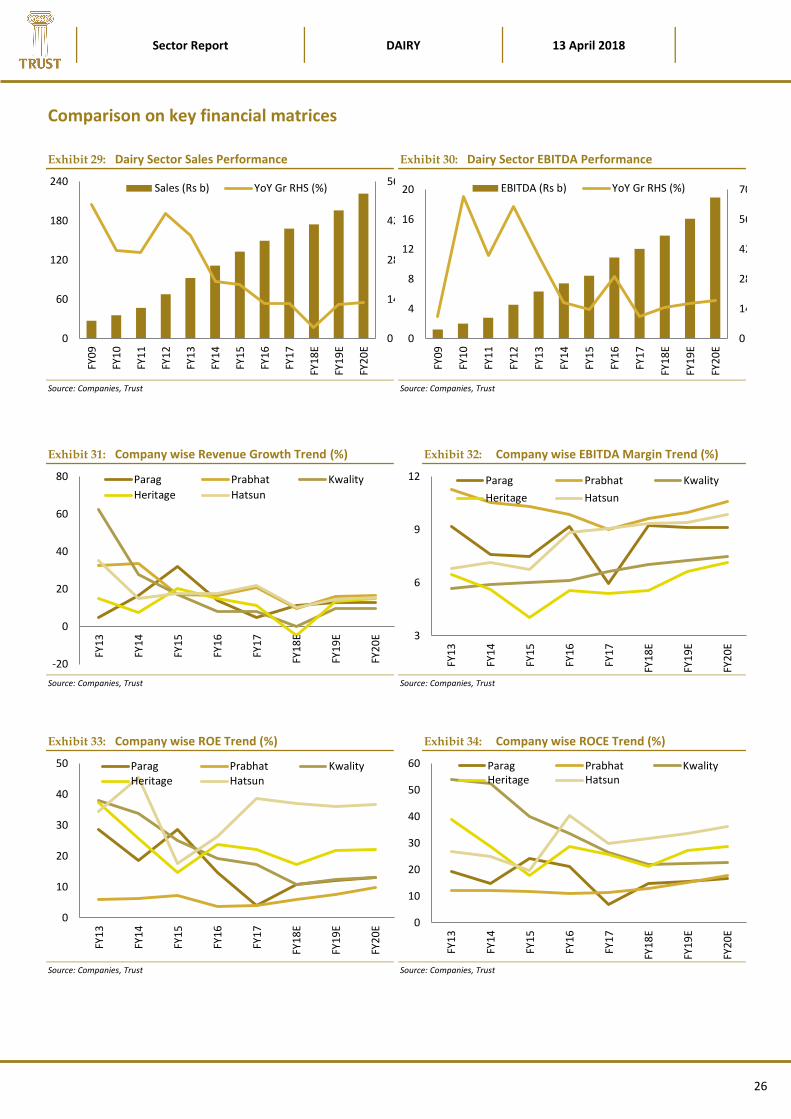
Exhibit 29: Dairy Sector Sales Performance
Source: Companies, Trust
Exhibit 30: Dairy Sector EBITDA Performance
Source: Companies, Trust
Exhibit 31: Company wise Revenue Growth Trend (%)
Source: Companies, Trust
Exhibit 32: Company wise EBITDA Margin Trend (%)
Source: Companies, Trust
Exhibit 33: Company wise ROE Trend (%)
Source: Companies, Trust
Exhibit 34: Company wise ROCE Trend (%)
Source: Companies, Trust
0
14
28
42
56
0
60
120
180
240
FY0
9
FY1
0
FY1
1
FY1
2
FY1
3
FY1
4
FY1
5
FY1
6
FY1
7
FY1
8E
FY1
9E
FY2
0E
Sales (Rs b) YoY Gr RHS (%)
0
14
28
42
56
70
0
4
8
12
16
20
FY0
9
FY1
0
FY1
1
FY1
2
FY1
3
FY1
4
FY1
5
FY1
6
FY1
7
FY1
8E
FY1
9E
FY2
0E
EBITDA (Rs b) YoY Gr RHS (%)
-20
0
20
40
60
80
FY1
3
FY1
4
FY1
5
FY1
6
FY1
7
FY1
8E
FY1
9E
FY2
0E
Parag Prabhat Kwality
Heritage Hatsun
3
6
9
12
FY1
3
FY1
4
FY1
5
FY1
6
FY1
7
FY1
8E
FY1
9E
FY2
0E
Parag Prabhat Kwality
Heritage Hatsun
0
10
20
30
40
50
FY1
3
FY1
4
FY1
5
FY1
6
FY1
7
FY1
8E
FY1
9E
FY2
0E
Parag Prabhat KwalityHeritage Hatsun
0
10
20
30
40
50
60
FY1
3
FY1
4
FY1
5
FY1
6
FY1
7
FY1
8E
FY1
9E
FY2
0E
Parag Prabhat KwalityHeritage Hatsun

Sector Report DAIRY 13 April 2018
27
Sector Valuation
Indian Dairy sector is in growth phase as share of organized industry is expected to rise across categories within the space. Companies focused on B2C segment are expected to grow faster than companies focusing on commodity and Fresh milk products. In terms of margins companies focused on Fresh milk products category for B2C are expected to perform better in coming 2-3 years. So the companies who will remain focused on dairy business and deliver higher growth as well as share it with its stakeholders will trade at higher multiples such as Hatsun and Heritage. Parag and Prabhat has an opportunity to deliver higher growth as VAP market is expanding and companies have first mover advantage in certain segments.
Exhibit 35: PARAG P/E Band
Source: Bloomberg, Trust
Exhibit 36: PARAG P/B Band
Source: Bloomberg, Trust
Exhibit 37: PRABHAT P/E Band
Source: Bloomberg, Trust
Exhibit 38: PRABHAT P/B Band
Source: Bloomberg, Trust
0
16
32
48
64
80
May
-16
Jun
-16
Jul-
16
Au
g-1
6Se
p-1
6O
ct-1
6N
ov-
16
Dec
-16
Jan
-17
Feb
-17
Mar
-17
Ap
r-1
7M
ay-1
7Ju
n-1
7Ju
l-1
7A
ug-
17
Sep
-17
Oct
-17
No
v-1
7D
ec-1
7Ja
n-1
8Fe
b-1
8M
ar-1
8A
pr-
18
P/E (x) Avg(x) Peak(x)
Min(x) Median(x)
2
3
4
5
May
-16
Jun
-16
Jul-
16
Au
g-1
6Se
p-1
6O
ct-1
6N
ov-
16
De
c-1
6Ja
n-1
7Fe
b-1
7M
ar-1
7A
pr-
17
May
-17
Jun
-17
Jul-
17
Au
g-1
7Se
p-1
7O
ct-1
7N
ov-
17
De
c-1
7Ja
n-1
8Fe
b-1
8M
ar-1
8A
pr-
18
P/B (x) Avg(x) Peak(x)
Min(x) Median(x)
20
30
40
50
60
Sep
-15
Oct
-15
No
v-1
5D
ec-1
5Ja
n-1
6Fe
b-1
6M
ar-1
6A
pr-
16
May
-16
Jun
-16
Jul-
16
Au
g-1
6Se
p-1
6O
ct-1
6N
ov-
16
Dec
-16
Jan
-17
Feb
-17
Mar
-17
Ap
r-1
7M
ay-1
7Ju
n-1
7Ju
l-1
7A
ug-
17
Sep
-17
Oct
-17
No
v-1
7D
ec-1
7Ja
n-1
8Fe
b-1
8M
ar-1
8A
pr-
18
P/E (x) Avg(x) Peak(x)
Min(x) Median(x)
0
1
2
3
4
Sep
-15
Oct
-15
No
v-1
5D
ec-
15
Jan
-16
Feb
-16
Mar
-16
Ap
r-1
6M
ay-1
6Ju
n-1
6Ju
l-1
6A
ug-
16
Sep
-16
Oct
-16
No
v-1
6D
ec-
16
Jan
-17
Feb
-17
Mar
-17
Ap
r-1
7M
ay-1
7Ju
n-1
7Ju
l-1
7A
ug-
17
Sep
-17
Oct
-17
No
v-1
7D
ec-
17
Jan
-18
Feb
-18
Mar
-18
Ap
r-1
8
P/B (x) Avg(x) Peak(x)
Min(x) Median(x)
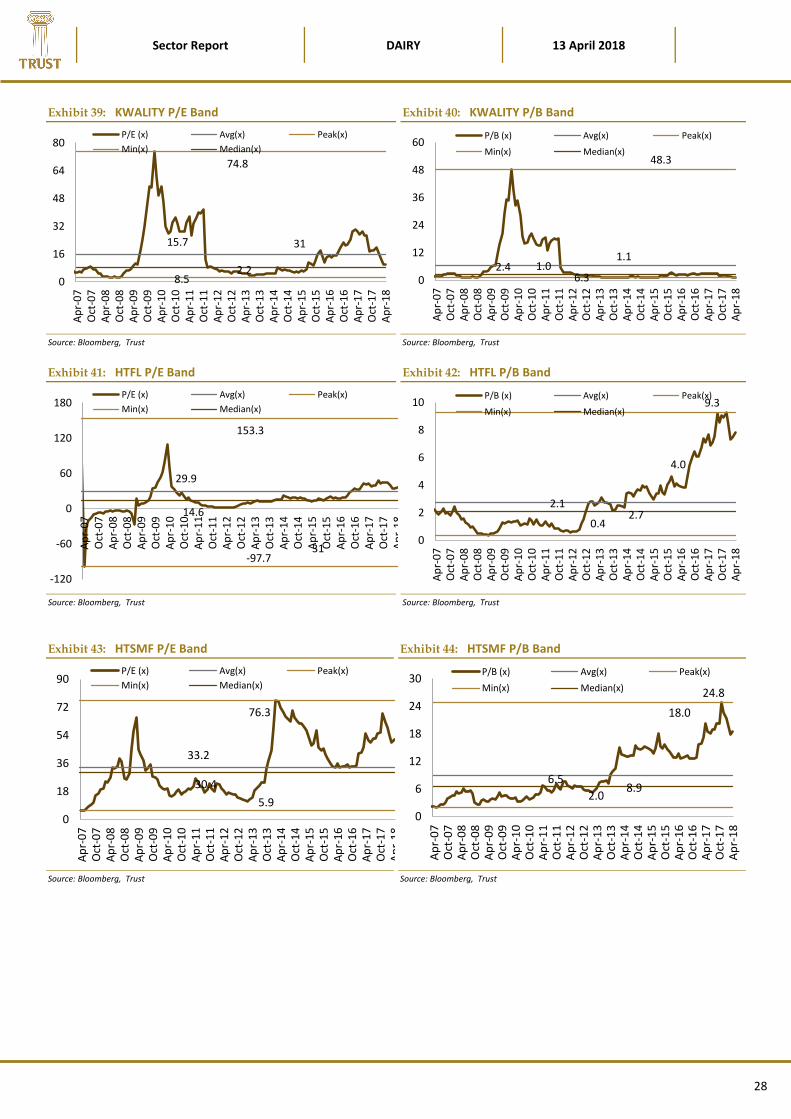
Sector Report DAIRY 13 April 2018
28
Exhibit 39: KWALITY P/E Band
Source: Bloomberg, Trust
Exhibit 40: KWALITY P/B Band
Source: Bloomberg, Trust
Exhibit 41: HTFL P/E Band
Source: Bloomberg, Trust
Exhibit 42: HTFL P/B Band
Source: Bloomberg, Trust
Exhibit 43: HTSMF P/E Band
Source: Bloomberg, Trust
Exhibit 44: HTSMF P/B Band
Source: Bloomberg, Trust
3115.7
74.8
2.28.50
16
32
48
64
80
Ap
r-0
7O
ct-0
7A
pr-
08
Oct
-08
Ap
r-0
9O
ct-0
9A
pr-
10
Oct
-10
Ap
r-1
1O
ct-1
1A
pr-
12
Oct
-12
Ap
r-1
3O
ct-1
3A
pr-
14
Oct
-14
Ap
r-1
5O
ct-1
5A
pr-
16
Oct
-16
Ap
r-1
7O
ct-1
7A
pr-
18
P/E (x) Avg(x) Peak(x)
Min(x) Median(x)
1.1
6.3
48.3
1.02.40
12
24
36
48
60
Ap
r-0
7O
ct-0
7A
pr-
08
Oct
-08
Ap
r-0
9O
ct-0
9A
pr-
10
Oct
-10
Ap
r-1
1O
ct-1
1A
pr-
12
Oct
-12
Ap
r-1
3O
ct-1
3A
pr-
14
Oct
-14
Ap
r-1
5O
ct-1
5A
pr-
16
Oct
-16
Ap
r-1
7O
ct-1
7A
pr-
18
P/B (x) Avg(x) Peak(x)
Min(x) Median(x)
31
29.9
153.3
-97.7
14.6
-120
-60
0
60
120
180
Ap
r-0
7O
ct-0
7A
pr-
08
Oct
-08
Ap
r-0
9O
ct-0
9A
pr-
10
Oct
-10
Ap
r-1
1O
ct-1
1A
pr-
12
Oct
-12
Ap
r-1
3O
ct-1
3A
pr-
14
Oct
-14
Ap
r-1
5O
ct-1
5A
pr-
16
Oct
-16
Ap
r-1
7O
ct-1
7A
pr-
18
P/E (x) Avg(x) Peak(x)
Min(x) Median(x)
4.0
2.7
9.3
0.4
2.1
0
2
4
6
8
10
Ap
r-0
7O
ct-0
7A
pr-
08
Oct
-08
Ap
r-0
9O
ct-0
9A
pr-
10
Oct
-10
Ap
r-1
1O
ct-1
1A
pr-
12
Oct
-12
Ap
r-1
3O
ct-1
3A
pr-
14
Oct
-14
Ap
r-1
5O
ct-1
5A
pr-
16
Oct
-16
Ap
r-1
7O
ct-1
7A
pr-
18
P/B (x) Avg(x) Peak(x)
Min(x) Median(x)
33.2
76.3
5.9
30.4
0
18
36
54
72
90
Ap
r-0
7O
ct-0
7A
pr-
08
Oct
-08
Ap
r-0
9O
ct-0
9A
pr-
10
Oct
-10
Ap
r-1
1O
ct-1
1A
pr-
12
Oct
-12
Ap
r-1
3O
ct-1
3A
pr-
14
Oct
-14
Ap
r-1
5O
ct-1
5A
pr-
16
Oct
-16
Ap
r-1
7O
ct-1
7A
pr-
18
P/E (x) Avg(x) Peak(x)
Min(x) Median(x)
18.0
8.9
24.8
2.0
6.5
0
6
12
18
24
30
Ap
r-0
7O
ct-0
7A
pr-
08
Oct
-08
Ap
r-0
9O
ct-0
9A
pr-
10
Oct
-10
Ap
r-1
1O
ct-1
1A
pr-
12
Oct
-12
Ap
r-1
3O
ct-1
3A
pr-
14
Oct
-14
Ap
r-1
5O
ct-1
5A
pr-
16
Oct
-16
Ap
r-1
7O
ct-1
7A
pr-
18
P/B (x) Avg(x) Peak(x)
Min(x) Median(x)
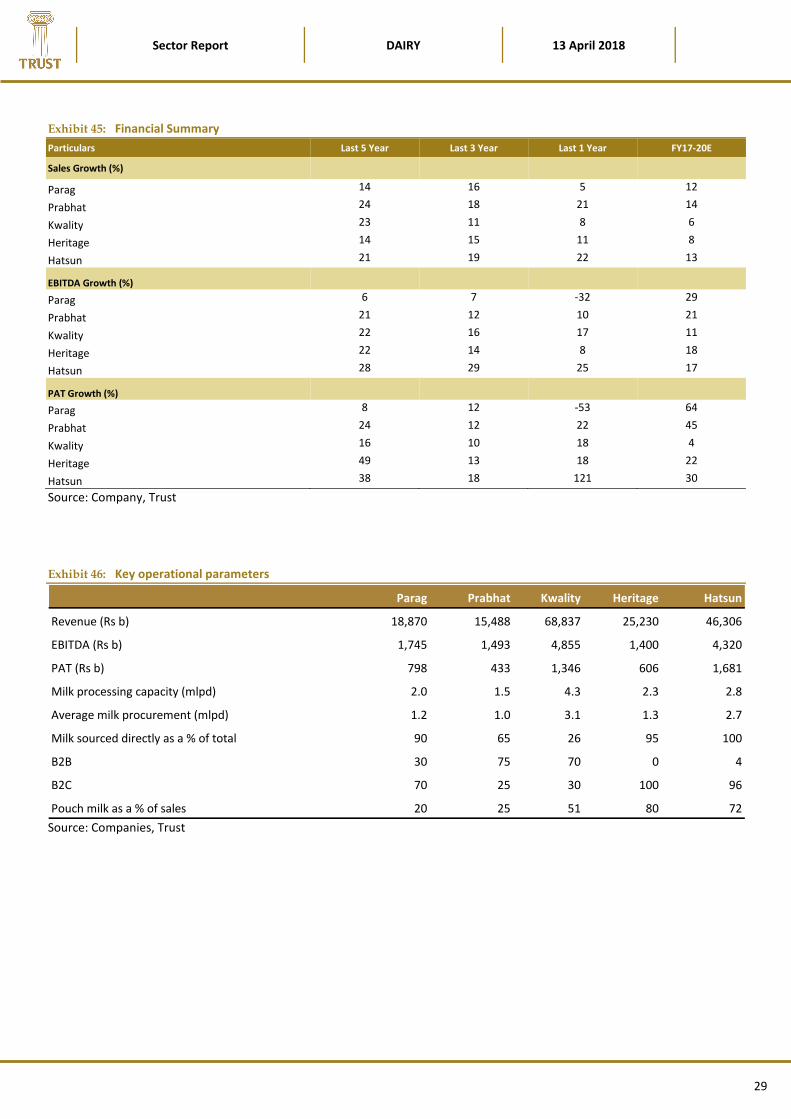
Sector Report DAIRY 13 April 2018
29
Exhibit 45: Financial Summary
Particulars Last 5 Year Last 3 Year Last 1 Year FY17-20E
Sales Growth (%)
Parag 14 16 5 12
Prabhat 24 18 21 14
Kwality 23 11 8 6
Heritage 14 15 11 8
Hatsun 21 19 22 13
EBITDA Growth (%) Parag 6 7 -32 29
Prabhat 21 12 10 21
Kwality 22 16 17 11
Heritage 22 14 8 18
Hatsun 28 29 25 17
PAT Growth (%) Parag 8 12 -53 64
Prabhat 24 12 22 45
Kwality 16 10 18 4
Heritage 49 13 18 22
Hatsun 38 18 121 30
Source: Company, Trust
Exhibit 46: Key operational parameters
Parag Prabhat Kwality Heritage Hatsun
Revenue (Rs b) 18,870 15,488 68,837 25,230 46,306
EBITDA (Rs b) 1,745 1,493 4,855 1,400 4,320
PAT (Rs b) 798 433 1,346 606 1,681
Milk processing capacity (mlpd) 2.0 1.5 4.3 2.3 2.8
Average milk procurement (mlpd) 1.2 1.0 3.1 1.3 2.7
Milk sourced directly as a % of total 90 65 26 95 100
B2B 30 75 70 0 4
B2C 70 25 30 100 96
Pouch milk as a % of sales 20 25 51 80 72
Source: Companies, Trust

Sector Report DAIRY 13 April 2018
30
COMPANY SECTION

Parag Milk Foods
Initiating Coverage
“Capacity utilization is the key for VAP”
Parag Milk Foods (PARAG) is a play on the fast growing value added products within dairy
space. It enjoys first mover advantage in key high premium VAP such as cheese and Whey. It
has not only established itself as an innovative player by creating strong brands in fresh milk
products but also invested wisely in raw material sourcing, processing and distribution. Its
key brands ‘Go’ and ‘Gowardhan’ have become household names at least in Urban India
after ‘Amul’. Its focus on innovation and consistent product mix improvement will lead to
sustained earnings growth and in return improving return ratios over FY17-20E.
Optimum product portfolio focused on premiumisation
PARAG has optimum product portfolio capturing entire value in fresh milk products along with
long shelf life premium products such as cheese and whey protein. PARAG launched fresh milk
products under brand name Gowardhan catering to rural and urban India for every day dairy
requirement. It has successfully identified opportunity within urban India, by setting up a dairy
farm with Holstein cows at Manchar it supplies premium milk today at almost double rate to
cater premium consumers. Over FY09-17 it has increased its capacity of cheese making to
60tpd and captured >30% market share within the organized space after Amul. These high
margins product categories are expected to grow faster than traditional milk and PARAG will
be the biggest beneficiary. With improvement in utilizations we expect operating leverage to
kick in and improve EBITDA margins from average of ~7-8% to 9-10% over FY17-20E.
Consistent capacity addition across faster growing products backed by milk processing
Over the past decade, PARAG has seen always ahead of competition among private dairy
players. It has invested `3.5b in capital intensive cheese and whey plant identifying
tremendous potential in B2C segment. PARAG has spent well in branding and A&P over last
few years to make product available in competition with Amul. PARAG has captured market
share in organised cheese market with the help of freebies in B2C however margins will
improve sharply once utilisations will improve and consumer brand recall persists as branding
expenses will come down. PARAG is constantly adding capacities in VAP supported by planning
to raise milk processing capacities to 3.4mlpd over next few quarters.
Tapping new growth opportunities to cash in rising Indian fitness quotient
PARAG has established itself as an innovative player in private dairy space with launch of Go
cheese in 2008. Since then it has worked on various innovative concepts such as farm-to-home
(2011), dairy tourism (2012), whey for B2B (2014) and finally in 2017 it has launched its own
brand Avvatar for catering demand of whey protein powder in B2C segment. This is a high
margin high growth segment with potential to replace entire whey powder market which is
catered by imports today. Whey protein is a `15b category growing at double digits over many
years dominated by imported brands.
Developing a long lasting taste among consumers a key challenge
Developing a long lasting taste among Indian consumers is a key task and PARAG is trying its
best by making product available to consumers. Although it is almost at par or at premium to
leading brand, by continuously seeing the product on shelf will lead consumer to try it once
and that’s how it begins.
Valuation & Recommendation
PARAG trades at 20xFY20E EPS of `12.5 which is 34% discount to traditional PE multiples
FMCG companies historically traded in their growth phase. With strong focus on
premiumisation, adequate investments in capacities, innovation and branding we expect
PARAG to deliver superior earnings growth over FY17-20E; and will lead to rerating. We expect
PARAG to deliver 12%, 29% and 59% CAGR growth over FY17-20E in revenue, EBITDA & PAT
respectively on the back of economies of scale and remain beneficiary of impending boom in
organized dairy space. The 12-month forward P/E at 22x is at 40% discount as compared to
last 2 year average of 38x. We initiate coverage with BUY.
Market statistics
Current stock price (`) 249
Shares O/S (cr.) 8.4
Mcap (` cr) 2,095
52W H/L (`) 319/206
6m avg. volume 7,29,059
Bloomberg PARAG in
Shareholding pattern
Promoters 48.71
Domestic Institution 12.9
Foreign Institution 15.95
Non-institution 22.44
of which more than 1%
Lucky Securities Pvt. Ltd. 1.73
PARAG vs Nifty
Capital efficiency & valuations
Particulars FY18 FY19E FY20E
RoE (%) 10.9 12.3 13.0
RoCE (%) 14.7 15.6 16.6
P/B (x) 2.9 2.6 2.4
EV/OCF (x) 22.0 13.3 15.4
EV/EBITDA (x) 12.4 10.9 9.5
P/E (x) 26.2 21.3 18.3
Analyst
Tushar Chaudhari
+91-22 4224 5119
Sector: Dairy
CMP: `249
Recommendation: BUY
75
90
105
120
135
Apr-17 Aug-17 Dec-17 Apr-18
Parag Nifty
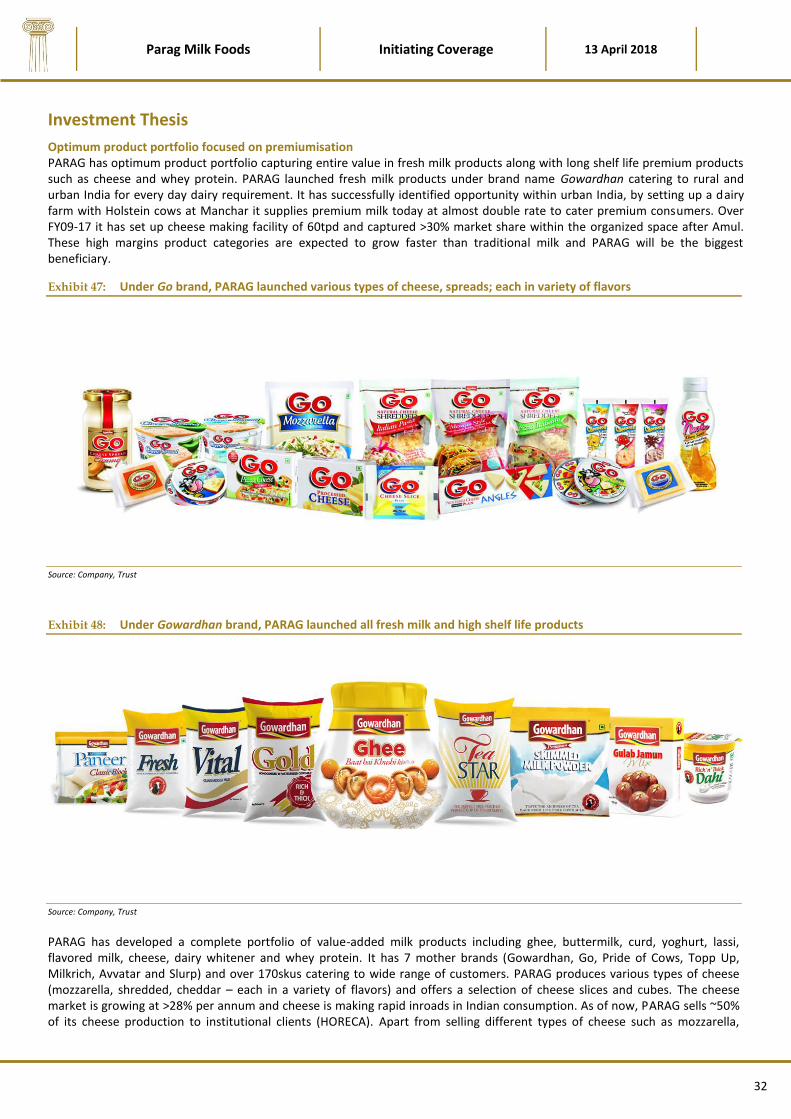
Parag Milk Foods Initiating Coverage 13 April 2018
32
Investment Thesis
Optimum product portfolio focused on premiumisation PARAG has optimum product portfolio capturing entire value in fresh milk products along with long shelf life premium products such as cheese and whey protein. PARAG launched fresh milk products under brand name Gowardhan catering to rural and urban India for every day dairy requirement. It has successfully identified opportunity within urban India, by setting up a dairy farm with Holstein cows at Manchar it supplies premium milk today at almost double rate to cater premium consumers. Over FY09-17 it has set up cheese making facility of 60tpd and captured >30% market share within the organized space after Amul. These high margins product categories are expected to grow faster than traditional milk and PARAG will be the biggest beneficiary.
Exhibit 47: Under Go brand, PARAG launched various types of cheese, spreads; each in variety of flavors
Source: Company, Trust
Exhibit 48: Under Gowardhan brand, PARAG launched all fresh milk and high shelf life products
Source: Company, Trust
PARAG has developed a complete portfolio of value-added milk products including ghee, buttermilk, curd, yoghurt, lassi, flavored milk, cheese, dairy whitener and whey protein. It has 7 mother brands (Gowardhan, Go, Pride of Cows, Topp Up, Milkrich, Avvatar and Slurp) and over 170skus catering to wide range of customers. PARAG produces various types of cheese (mozzarella, shredded, cheddar – each in a variety of flavors) and offers a selection of cheese slices and cubes. The cheese market is growing at >28% per annum and cheese is making rapid inroads in Indian consumption. As of now, PARAG sells ~50% of its cheese production to institutional clients (HORECA). Apart from selling different types of cheese such as mozzarella,

Parag Milk Foods Initiating Coverage 13 April 2018
33
cheddar, ricotta and processed cheese, PARAG is also selling different formats of cheese. It has rolled out cheese sauce for nachos, cheese slices in different flavors, pizza cheese, cheese cubes, cheese spread and cheese creamy spread, and cheese triangles. Share of consumer business is also expanding fast and the investments in cheese business are expected to yield positive results in the coming years.
It is one of the pioneers of the concept of farm-to-home fresh milk, which it supplies to Mumbai and Pune under its brand Pride of Cows; which commands 100% premium to other branded cow milk. However it is not scalable business as it will require PARAG to set up similar dairy farms at various places and transportation eats away margins. As of now expansion of Pride of Cows business is not in company’s priority list, but it showcases PARAG’s innovation and premiumisation capabilities from a commodity like milk. We believe PARAG’s focus on innovation in VAP will aid to outperform peers and cooperative players on both growth and margins in the long term.
Consistent capacity addition across faster growing products backed by milk processing PARAG has consistently added capacities not only in raw milk processing but also in finished products. It has two main milk manufacturing facilities at Manchar (1.2lpd near Pune) and Palamner (Andhra Pradesh) with combined milk processing capacity of 2mlpd. Its Manchar unit is already running at high capacity utilizations and PARAG is expanding the same by end FY18. Palamner is relatively new facility (2010) and has lower capacity utilization. However, with the company’s strategy to increase milk procurement from Andhra Pradesh, we expect these utilization levels to increase. Combined milk processing capacity will be 3.4lpd by end FY18.
Capacity utilization levels for its major product categories vary from 50% to 70% which will cater to growing demand till FY20. PARAG will increase capacities across major categories by using its remaining IPO proceeds over next two years which will be sufficient to cater demand till 2022. As company’s major capex in VAP is already in place, we expect operating cash flows to improve over FY17-20E. Higher capacity utilizations at VAP will also aid improving margins and return ratios which declined sharply in FY17 led by higher raw milk procurement prices.
Tapping new growth opportunities to replace imports and cash in over rising Indian fitness quotient PARAG has established itself as an innovative player in private dairy space with launch of Go cheese in 2008. Since then it has worked on various innovative concepts such as farm-to-home (2011), dairy tourism (2012), whey for B2B (2014) and finally in 2017 it has launched its own brand Avvatar for catering demand of whey protein powder in B2C segment. This is a high margin high growth segment with potential to replace entire whey powder market which is catered by imports today. Whey protein is a `15b category growing at double digits over many years dominated by imported brands. PARAG has invested over `3.5b in cheese and whey plant which has diluted its return ratios compared to pure milk play however it will start improving over next few years as capacity utilization improves.
The fitness industry is highly under penetrated in India with <1% membership as compared to Asia Pacific average of ~4%. The industry, as a whole, is expected to benefit from rising proportion of age group between 20 and 45 in India, which is ~40% of India’s total population. In addition, growing disposable incomes and rising lifestyle related diseases is penting up demand for quality health and fitness services in India.
Exhibit 49: Break up of Nutraceutical market in India
Source: Media, Trust
Exhibit 50: Health & Fitness stats comparison
Country H&F clubs Members (m) Members/club
India 3,800 1.0 263
China 2,700 3.9 1,444
MENA 5,600 3.4 607
APAC 29,000 17.0 586
UK 6,435 9.2 1,430
USA 36,540 57.3 1,567
World 1,87,000 151.0 807
Source: IHRSA 2016, Trust
Post tremendous success of IPL, India has seen similar leagues happening in Kabbadi, Hockey, Soccer, Badminton and even Golf. Corporates and Government of India are waking up to the fact that investment in sports can have high potential tangible ROI. As Indians have become conscious about their health and how they look and feel, participation in marathons in Mumbai has also
Vitamins & Minerals, 48
Herbal supplements,
23
Protein supplements,
21
Chyawanprash, 8

Parag Milk Foods Initiating Coverage 13 April 2018
34
increased over the past decade. Corporates also by recognizing the benefits of running in decluttering, destressing and strategizing, are actively encouraging their staff to participate in the activity. Fitness awareness movement has taken India by storm and increasing shift towards preventive therapies, immunity-developing supplements and wellness-related products offers growth opportunity to industry players.
Indian nutraceutical industry is currently at a very nascent stage and has great potential for growth. It is expected to be more than double in the next 4-5 years to ~USD5b fueled mainly led by favorable demographics and increasing awareness about nutritional supplements. Whey is generated as a byproduct of manufacturing cheese. When one 1kg cheese is manufactured, ~600gm of whey is also generated. Out of the total whey generated, only 33% of whey is good for human consumption. Since 2014 PARAG was selling whey proteins to institutional customers. However, in 2017 it has launched whey protein in retail markets under the brand name of Avvatar. By launching 100% pure veg Avvatar brand PARAG has taken lead in health supplements market. We believe success of high margin Avvatar products will be crucial to drive the profitability of cheese plant.
Exhibit 51: No of participants in StanC Mumbai marathon
Source: Media, Trust
Exhibit 52: No of Marathons planned till November 2018
Source: Indiarunning.com, Trust
Pan India distribution network and developed strong relationships for raw milk sourcing Over the last one decade, PARAG has set up a strong sourcing and distribution network. It sources milk from over 2lac farmers in 3,500 villages across Maharashtra, Andhra Pradesh, Karnataka, and Tamil Nadu, and also procures milk indirectly through wholesalers. The quantity of milk sourced directly and indirectly varies based on the prevalent supply conditions of milk. It also has a dairy farm with 2,000 cows of the Holstein breed maintained mainly for R&D purposes.
It is among the few private dairy players with a pan-India presence for its products. As of 2QFY18, its distribution network consists of 17 depots, 140 super stockiest and over 3,000 distributors across the country. It employs >550 people for distribution and marketing. Parag has two main types of products: a) Fresh Milk products (Pouch milk, curd and paneer) which are distributed across Maharashtra from Manchar plant and in Andhra Pradesh, from Palamner unit; b) premium products having high shelf life (Cheese, ghee, flavored milk and whey) are sold pan-India through distributors and transported by chilled vans. Parag has expanded its distribution network from 60k retail outlets in FY12 to 2.5lac outlets in 2HFY18. PARAG targets to expand its distribution network to grow 4-5% per annum, which will help revenue growth.
In order to support the new product launches as well as rising distribution reach, PARAG has increased it’s A&P expenses from 1.8% as a % of revenue in FY12 to 2.6% in FY17. With strategic sourcing of raw milk and deepening reach of its products to consumers is going to aid the revenue growth and improving margins.
22,000
32,000
38,77540,285
Jan-04 Jan-08 Jan-12 Jan-16
31 23 33 31 20 7 4 7 10 13
308M
um
bai
Delh
i
Ch
enn
ai
Ben
galuru
Hyd
erabad
Gu
rugram
Ch
and
igarh
Ko
lkatta
Gu
jarat
Rajasth
an
Ind
ia

Parag Milk Foods Initiating Coverage 13 April 2018
35
Consolidated Financials
PARAG has consistently delivered robust revenue growth of 21% CAGR over last decade however profitability and return ratios have suffered in recent years due to high intensity of capex in VAP, rising distribution /branding expenses and volatility in raw milk prices. Going forward as capacity utilization of VAP improves profitability and return rations will improve significantly. With strong consumer sentiments and rising propensity to spend on VAP we expect PARAG to deliver 12% and 29% CAGR in revenue and EBITDA growth over FY17-20E.
Exhibit 53: Sales Growth
Source: Company, Trust
Exhibit 54: EBITDA Growth
Source: Company, Trust
Exhibit 55: PAT Performance
Source: Company, Trust
Exhibit 56: Trend Of Operating Cash Flows
Source: Company, Trust
Exhibit 57: ROCE and ROE
Source: Company, Trust
Exhibit 58: Rising Dividend Payout Ratio
Source: Company, Trust
0
10
20
30
40
50
0
6
12
18
24
30
FY0
8
FY0
9
FY1
0
FY1
1
FY1
2
FY1
3
FY1
4
FY1
5
FY1
6
FY1
7
FY1
8E
FY1
9E
FY2
0E
Revenue (Rs b) Growth (%)
0
2
4
6
8
10
12
0
500
1,000
1,500
2,000
2,500
FY0
8
FY0
9
FY1
0
FY1
1
FY1
2
FY1
3
FY1
4
FY1
5
FY1
6
FY1
7
FY1
8E
FY1
9E
FY2
0E
EBITDA (Rs m) Margins (%)
-500
0
500
1000
1500
2000
0
200
400
600
800
1,000
1,200
FY0
8
FY0
9
FY1
0
FY1
1
FY1
2
FY1
3
FY1
4
FY1
5
FY1
6
FY1
7
FY1
8E
FY1
9E
FY2
0E
Adj PAT (Rs m) Growth (%)
-1,500
-1,000
-500
0
500
1,000
1,500
2,000
2,500
FY0
8
FY0
9
FY1
0
FY1
1
FY1
2
FY1
3
FY1
4
FY1
5
FY1
6
FY1
7
FY1
8E
FY1
9E
FY2
0E
OCF FCF
0
10
20
30
40
50
FY0
8
FY0
9
FY1
0
FY1
1
FY1
2
FY1
3
FY1
4
FY1
5
FY1
6
FY1
7
FY1
8E
FY1
9E
FY2
0E
RoE RoCE
0
5
10
15
20
25
30
35
FY0
8
FY0
9
FY1
0
FY1
1
FY1
2
FY1
3
FY1
4
FY1
5
FY1
6
FY1
7
FY1
8E
FY1
9E
FY2
0E
Div Payout ratio (%)

Parag Milk Foods Initiating Coverage 13 April 2018
36
Outlook & Valuation
PARAG trades at 20xFY20E EPS of `12.5 which is 34% discount to traditional PE multiples FMCG companies historically traded in their growth phase. With strong focus on premiumisation, adequate investments in capacities, innovation and branding we expect PARAG to deliver superior earnings growth over FY17-20E; and will lead to rerating. We expect PARAG to deliver 12%, 29% and 59% CAGR growth over FY17-20E in revenue, EBITDA & PAT respectively on the back of economies of scale and remain beneficiary of impending boom in organized dairy space. The 12-month forward P/E at 22x is at 40% discount as compared to last 2 year average of 38x. We initiate coverage with BUY
With strong focus on branding, innovation in VAP, geographical expansion within West and South India and improving management bandwidth we expect Parag to emerge as a significant player within private dairy space. However margin improvement will be seen only at higher volumes of VAP so distribution expansion is critical. Return ratios will also improve at higher capacity utilization of cheese plant; which will lead to rerating of its earnings multiples similar to FMCG companies. We expect PARAG to maintain the strong financial performance over next few years. We initiate coverage with BUY.
Exhibit 59: PARAG 1 Year Forward P/E Band
Source: Bloomberg, Company, Trust
Exhibit 60: PARAG ROE Chart (%)
Source: Bloomberg, Company, Trust
Key risks Lower return ratios of cheese plant Although cheese market is growing 2x than fresh milk business, cheese business generates lower return ratios due to capital intensive nature, higher inventory days as cheese needs maturing period of two months and higher debtor days as significant portion of business comes from institutions. Any economic slowdown premium products are first to get affected as consumers tend to downtrend; which we even saw in case of ITC over last few years. Developing a long lasting taste is difficult task vis a vis competitors like Amul whose taste has won Indian consumer minds.
Rising competition in institutional business Although PARAG has enjoyed first mover advantage over the years, competition has picked up pace with Amul planning to focus institutional business and other smaller private players setting up cheese units which can lead to margin pressure in long run.
0
16
32
48
64
80
May
-16
Jun
-16
Jul-
16
Au
g-1
6Se
p-1
6O
ct-1
6N
ov-
16
Dec
-16
Jan
-17
Feb
-17
Mar
-17
Ap
r-1
7M
ay-1
7Ju
n-1
7Ju
l-1
7A
ug-
17
Sep
-17
Oct
-17
No
v-1
7D
ec-1
7Ja
n-1
8Fe
b-1
8M
ar-1
8A
pr-
18
P/E (x) Avg(x) Peak(x)
Min(x) Median(x)44
20
14
3
3129
19
28
15
4
10 11 12
0
10
20
30
40
50
FY0
8
FY0
9
FY1
0
FY1
1
FY1
2
FY1
3
FY1
4
FY1
5
FY1
6
FY1
7
FY1
8E
FY1
9E
FY2
0E

Parag Milk Foods Initiating Coverage 13 April 2018
37
Company Background
The white revolution led to an increase in milk production many fold which led to the co-operatives declaring milk holidays around Pune. This adversity was circumvented by PARAG by helping farmers by collecting their milk on such milk holidays; and it was a birth of Parag Milk Foods Ltd. From there it transformed itself into one of India's elite private sector dairy company, having diverse portfolio in over 15 categories having 7 mother brands and 170+ skus all made from 100% fresh cow milk. It has successfully identified opportunities within India, by setting up a dairy farm with 2,000 Holstein cows at Manchar, a modern fully automated 60tpd cheese plant, 80tpd curd and 70tpd ghee plant.
PARAG was founded by Mr. Devendra Shah and his family members in 1992. Though the business is promoted and managed by Shah brothers, PARAG has inducted many senior professionals from other consumer companies in various sales, product management and finance roles to steer the growth plans.
Exhibit 61: Revenue Mix FY17
Source: Company, Trust
Exhibit 62: VAP will dominate in FY20E
Source: Company, Trust
Fresh Milk21%
SMP14%
Cheese20%
Ghee24%
Curd6%
Paneer2%
UHT5%
Butter5%
Whey3%
Fresh Milk19%
SMP10%
Cheese19%Ghee
23%
Curd7%
Paneer5%
UHT6%
Butter2%
Whey9%

Parag Milk Foods Initiating Coverage 13 April 2018
38
Financials – Consolidated
P&L Statement
Balance Sheet
Y/E Mar (`mn) FY16 FY17 FY18E FY19E FY20E
Share Capital 704 841 841 841 841
Total Reserves 3,073 5,820 6,459 7,197 8,000
Net Worth 3,777 6,661 7,300 8,038 8,841
Long Term Borrowings 1,243 713 463 263 63
Other LT Liabilities & provisions 365 214 165 165 165
Non Current Liabilities 1,745 1,033 734 534 334
Trade Payables 1,622 3,058 3,102 3,491 3,930
Other Current Liabilities 625 968 968 968 968
Short Term Borrowings 2,357 1,621 1,579 1,237 1,321
Current Liabilities 4,756 5,762 5,764 5,811 6,334
Total Liabilities 10,279 13,456 13,798 14,384 15,509
Net Fixed Assets 2,953 3,068 3,057 3,063 3,057
Capital WIP 278 206 214 214 164
Long term loans & advances 329 737 737 737 737
Current Assets 6,131 8,850 9,212 9,792 10,973
Inventory 2,711 4,267 4,465 4,655 5,292
Account Receivables 2,331 2,113 2,508 2,851 3,242
Cash and Bank Balance 71 1,000 770 817 970
Short term loan & advances 619 1,013 1,013 1,013 1,013
Total Assets 10,279 13,456 13,798 14,384 15,509
Y/E Mar (`mn) FY16 FY17 FY18E FY19E FY20E
Net Sales 16,230 17,011 18,870 21,238 23,907
Change (%) 13.8 4.8 10.9 12.5 12.6
Raw Materials 10,989 11,499 11,888 13,168 14,703
Gross Profit 5,241 5,512 6,982 8,070 9,204
Operating Expenses 3,751 4,501 5,237 6,137 7,024
EBITDA 1,490 1,011 1,745 1,933 2,180
Change (%) 39.9 -32.1 72.6 10.8 12.8
Margin (%) 9.2 5.9 9.2 9.1 9.1
Depreciation 317 473 561 594 655
Int. and Fin. Charges 487 328 225 150 138
Other Income 46 35 38 42 47
Profit before Taxes 732 245 998 1,231 1,433
Tax 174 -17 200 246 287
Tax Rate (%) 23.8 -6.9 20.0 20.0 20.0
Adjusted PAT 558 262 798 985 1,146
Change (%) 45.8 -53.1 204.7 23.4 16.4
Margin (%) 3.4 1.5 4.2 4.6 4.8
Exceptional/Prior Period inc 0 -194 0 0 0
Reported PAT 558 68 798 985 1,146
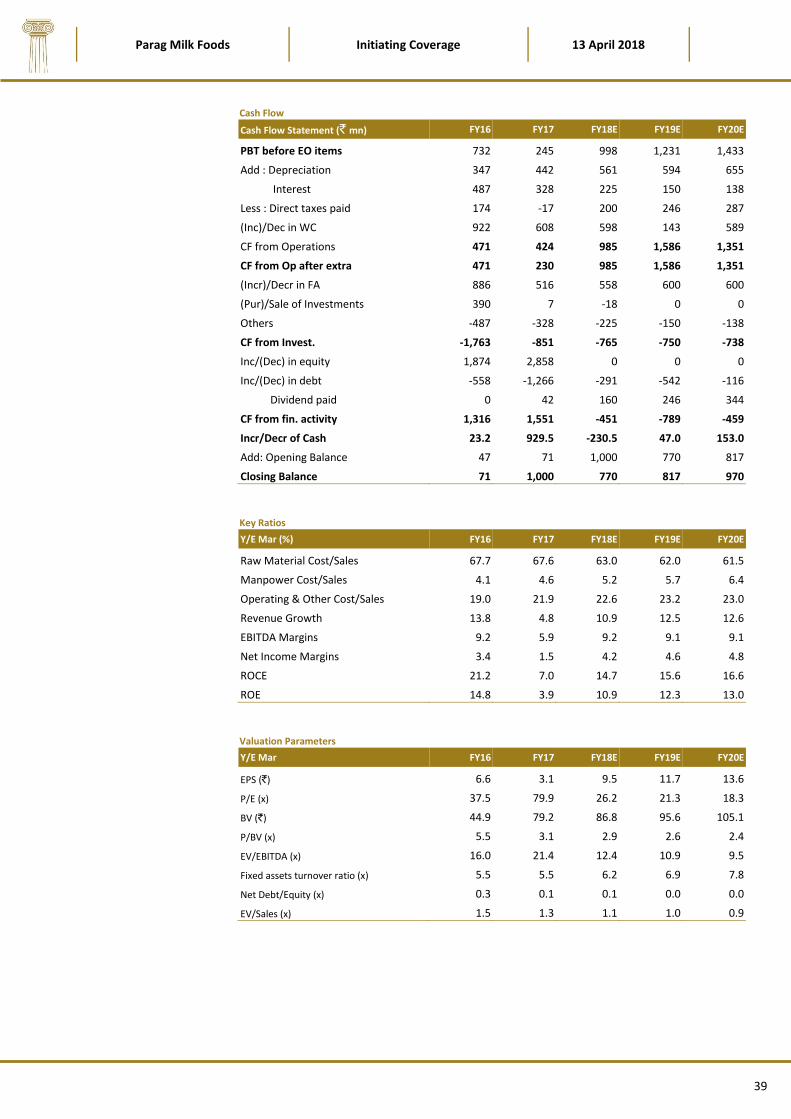
Parag Milk Foods Initiating Coverage 13 April 2018
39
Cash Flow
Cash Flow Statement (` mn) FY16 FY17 FY18E FY19E FY20E
PBT before EO items 732 245 998 1,231 1,433
Add : Depreciation 347 442 561 594 655
Interest 487 328 225 150 138
Less : Direct taxes paid 174 -17 200 246 287
(Inc)/Dec in WC 922 608 598 143 589
CF from Operations 471 424 985 1,586 1,351
CF from Op after extra 471 230 985 1,586 1,351
(Incr)/Decr in FA 886 516 558 600 600
(Pur)/Sale of Investments 390 7 -18 0 0
Others -487 -328 -225 -150 -138
CF from Invest. -1,763 -851 -765 -750 -738
Inc/(Dec) in equity 1,874 2,858 0 0 0
Inc/(Dec) in debt -558 -1,266 -291 -542 -116
Dividend paid 0 42 160 246 344
CF from fin. activity 1,316 1,551 -451 -789 -459
Incr/Decr of Cash 23.2 929.5 -230.5 47.0 153.0
Add: Opening Balance 47 71 1,000 770 817
Closing Balance 71 1,000 770 817 970
Key Ratios
Y/E Mar (%) FY16 FY17 FY18E FY19E FY20E
Raw Material Cost/Sales 67.7 67.6 63.0 62.0 61.5
Manpower Cost/Sales 4.1 4.6 5.2 5.7 6.4
Operating & Other Cost/Sales 19.0 21.9 22.6 23.2 23.0
Revenue Growth 13.8 4.8 10.9 12.5 12.6
EBITDA Margins 9.2 5.9 9.2 9.1 9.1
Net Income Margins 3.4 1.5 4.2 4.6 4.8
ROCE 21.2 7.0 14.7 15.6 16.6
ROE 14.8 3.9 10.9 12.3 13.0
Valuation Parameters
Y/E Mar FY16 FY17 FY18E FY19E FY20E
EPS (`) 6.6 3.1 9.5 11.7 13.6
P/E (x) 37.5 79.9 26.2 21.3 18.3
BV (`) 44.9 79.2 86.8 95.6 105.1
P/BV (x) 5.5 3.1 2.9 2.6 2.4
EV/EBITDA (x) 16.0 21.4 12.4 10.9 9.5
Fixed assets turnover ratio (x) 5.5 5.5 6.2 6.9 7.8
Net Debt/Equity (x) 0.3 0.1 0.1 0.0 0.0
EV/Sales (x) 1.5 1.3 1.1 1.0 0.9

Kwality Ltd (KDL) is one of the largest and fastest growing private dairy companies in India
with milk processing capacity of 4.3mlpd across six plants, strategically located close to key
consumer markets in North India. Over the last few years, KDL has started focusing on B2C
segment by launching fresh milk products and also increased thrust on direct procurement
from farmers across 4,700 villages in UP, Rajasthan and Haryana.
Transforming from B2B to a consumer-oriented Fresh milk dairy products company
Over the last few years, KDL has started focusing on B2C segment by launching fresh milk
products under own brand name ‘Kwality’ and it is spending aggressively on branding and
A&P. Fresh milk products under own brand name is expected to fetch higher realizations and
it’s a high ROE business as asset turnover is higher as compared to other VAP. Revenue
contribution from B2C segment has increased to ~40% in 1HFY18 from 12% in FY12. The target
is to reach 70% by FY20. It has identified low margin but high ROE fresh milk products and
developed its portfolio around it. Its product range includes variants of pouched milk, ghee,
cow ghee, UHT milk, UHT cream, curd, skimmed milk powder, wake up creamer, flavored milk,
buttermilk, and other varied dairy products.
Strengthening its milk procurement model
KDL has focused on improving procurement model and has established a robust procurement
network in UP, Haryana, and Rajasthan. Kwality currently procures ~26% of its total milk
requirements through its own VLCC and remaining from large contractors and aggregators.
KDL started its procurement from it’s own MCCs in 2008 and currently set up 29 MCCs in
northern states near its milk processing facilities. For procurement of quality milk, KDL plans to
open another 30 MCCs in next 2 years to ensure uninterrupted supply of milk and to reach the
target of procuring milk from its own MCCs at 50% in next 3 years.
Aiding farmers in various ways to create long term relationships
KDL has taken many initiatives to strengthen its relationship with farmer in rural areas by
providing them with veterinary doctors to look after animal health and artificial insemination
need, subsidized animal feed and annual FMD vaccination. In FY17 it has inked an MoU with
Bank of Baroda to disburse `40b of [email protected]% to ~1 lac farmers in initial phase, to buy
milching animals, a smart phone & a two-wheeler; to boost direct procurement. The scheme
was aimed to provide financial assistance to improve socio-economic lives of farmers and
steer them towards digitization. This initiative has received well by farmers and expected to
create a win-win situation for both.
Strong distribution network in largest consumption markets of North India
KDL has major presence in NCR, Haryana, Uttar Pradesh and Rajasthan where its products are
available on general and modern trade channels. Kwality aims to enhance its presence to
100,000+ points of sale from 50k at present over next 2-3 years including modern trade
channels, exclusive brand stores, and select online modes in sync with brand salience and
launch of new products.
Valuation & Recommendation
Over FY11-17, KDL has delivered 27%, 29% and 27% CAGR in revenue, EBITDA and PAT,
respectively. We expect KDL to deliver 6%, 11% and 4% CAGR growth over FY17-20E in
revenue, EBITDA & PAT, respectively on the back of its rising focus on B2C business, reduction
of working capital requirement by focusing on higher direct procurement model and
improving product mix.
KDL trades at just 7xFY20E EPS of `8.7 which appear attractive considering the size of business
in strong consumption Northern India market however recent incidences of inefficient
management of capital allocation have created doubts on company’s corporate governance
image. The 12-month forward P/E is 9.1x is 40% discount to last 10 year average while 50%
discount to last one year average. We expect management to learn from its past mistakes,
maintain its focus on dairy business and improve operational efficiencies over next two years.
We initiate coverage with BUY.
Kwality Ltd
Initiating Coverage
“Rising focus on B2C and direct milk procurement”
Market statistics
Current stock price (`) 60
Shares O/S (cr.) 23.8
Mcap (` cr) 1,452
52W H/L (`) 169/53
6m avg. volume 33,05,681
Bloomberg KWALITY in
Shareholding pattern
Promoters 63.94
Domestic Institution 0.7
Foreign Institution 5.2
Non-institution 30.16
of which more than 1%
Sidhant Gupta 1.35
KWALITY vs Nifty
Capital efficiency & valuations
Particulars FY18 FY19E FY20E
RoE (%) 10.8 12.6 13.3
RoCE (%) 22.0 22.3 22.8
P/B (x) 1.2 1.0 0.9
EV/OCF (x) 11.7 6.4 9.2
EV/EBITDA (x) 6.2 5.2 4.5
P/E (x) 10.9 8.3 6.8
Analyst
Tushar Chaudhari
+91-22 4224 5119
Sector: Dairy
CMP: `60
Recommendation: BUY
50
70
90
110
130
Apr-17 Aug-17 Dec-17 Apr-18
Kwality Nifty

Kwality Ltd Initiating Coverage 13 April 2018
41
Kwality: Growth story so far..
1992: Incorporated as Kwality Dairy (India) Ltd as backward integration of Kwality Ice Cream; Listed on BSE in 1995
2007: Strategic Alliance with Britannia Inds for mfg and packing of curd
2010: Set up first MCC in Haryana; launched Ghee, Dairy Whitener under 'Dairy Best' brand
2011: Took on lease processing facility at Ajmer, Sitapur and Jarar; Indian Railways added as a customer
2013: Name changed to Kwality Ltd; Acquired facilities from Varshney Bandhuin, UP; Mktg of UHT milk
2016: Signed Ad-for Equity deal worth Rs600m with ToI & HTM; KKR deal Rs5.2b structured debt for expansion
2017: Inked deal with Bank of Baroda to disburse Rs40b of [email protected]% to its 1 lac farmers; to raise direct procurement
2002: KDIL taken over by Dhigra family along with its manufacturing unit at Haryana
2003: MoU signed with GCMMF for processing and packing milk for Amul brand
2010: Agreement with Pashupati Dairies for milk processing; license recd for processing & mfg low cholesterol ghee
2011: Set up wholly-owned subs in Dubai FTZ; Launched Livlite low cholesterol ghee; set up 2nd mfg unit at Haryana
2014: Acquired two facilities on lease, set-up owned MCCs; Trial of flavored milk/ Lassi, Yoghurt; added VAP capacities
2015: Signed leading Bollywood Actor 'Akshay Kumar' as Brand Ambassador; ESOPs launched
2012: Started marketing of pouched milk, curd, and paneer under 'Dairy Best'

Kwality Ltd Initiating Coverage 13 April 2018
42
Investment Thesis
Transforming from B2B to a consumer-oriented specialty dairy company by focusing on high ROE fresh milk products Kwality Ltd (KDL) is one of the largest and fastest growing private dairy companies in India with milk processing capacity of 4.3mlpd across six plants, strategically located close to key consumer markets in North India. Many consumer centric global FMCG players are on the verge of entering into Indian Dairy business, and Kwality can be biggest beneficiary as it has strong institutional business, highest capacities and repetitive orders from Britannia, Mother dairy, HUL, Coffee Day and ITC. It has worked with largest dairy player in India (Amul) for almost a decade since 2003.
Over the last few years, KDL has started focusing on B2C segment by launching fresh milk products under own brand name ‘Kwality’ and it is spending aggressively on branding and A&P. Fresh milk products under own brand name is expected to fetch higher realizations and it’s a high ROE business as asset turnover is higher as compared to other VAP. Revenue contribution from B2C segment has increased to ~40% in 1HFY18 from 12% in FY12. The target is to reach 70% by FY20. It has identified low margin but high ROE fresh milk products and developed its portfolio around it. Its product range includes variants of pouched milk, ghee, cow ghee, UHT milk, UHT cream, curd, skimmed milk powder, wake up creamer, flavored milk, buttermilk, and other varied dairy products.
Exhibit 63: Revenue Mix FY12
Source: Company, Trust
Exhibit 64: Share of B2C has increased to 40% in 1HFY18
Source: Company, Trust
Commercial production started at its new VAP dedicated facility at Softa, Haryana In 4QFY17, Kwality has commenced commercial production at its new unit at Softa, Haryana, dedicated primarily for VAP (value-added products). The unit has fully automated world-class machinery & quality control systems and R&D lab. The unit has milk handling capacity of 0.9mlpd primarily for VAP such as Flavored Milk, Paneer, Cheese, UHT milk, Cream in tetra packs, Table-Butter and Yoghurts. With this unit cumulative milk processing capacity of Kwality is 4.3mlpd across its six plants in North India.
Exhibit 65: Products launched under own brand ‘Kwality’; roped in Akshay Kumar as brand ambassador
Source: Company, Trust
B2B88%
B2C12%
B2B60%
B2C40%
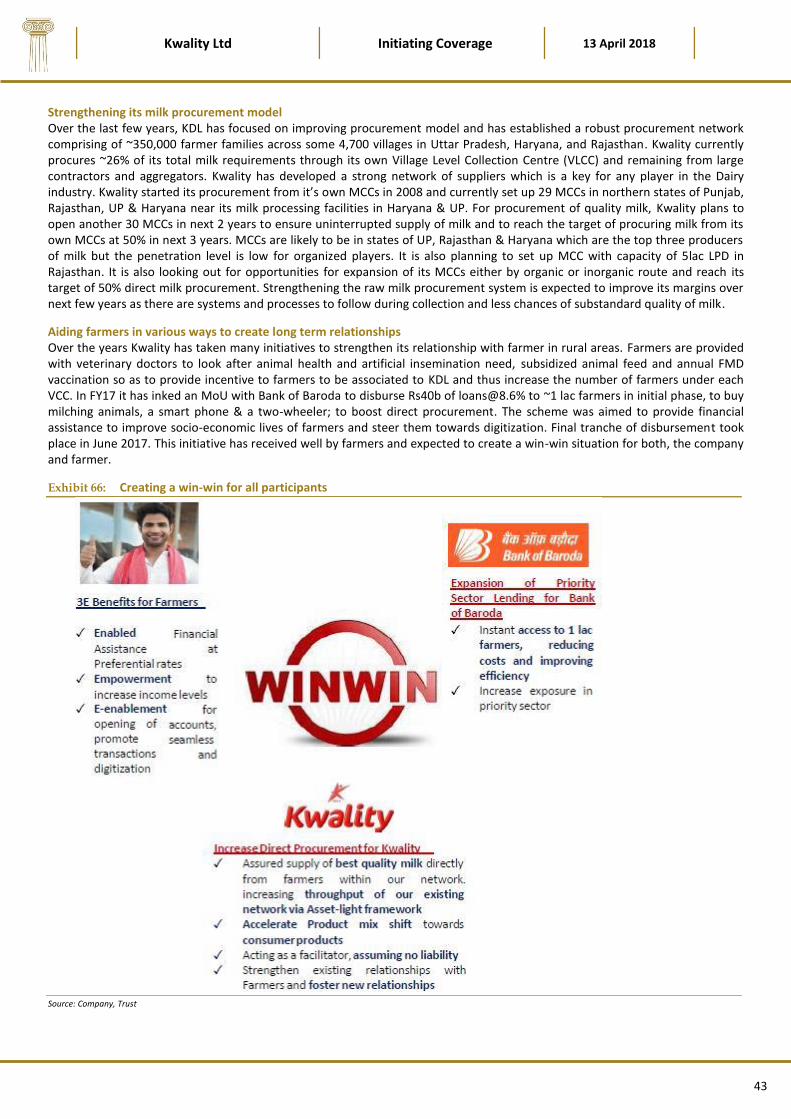
Kwality Ltd Initiating Coverage 13 April 2018
43
Strengthening its milk procurement model Over the last few years, KDL has focused on improving procurement model and has established a robust procurement network comprising of ~350,000 farmer families across some 4,700 villages in Uttar Pradesh, Haryana, and Rajasthan. Kwality currently procures ~26% of its total milk requirements through its own Village Level Collection Centre (VLCC) and remaining from large contractors and aggregators. Kwality has developed a strong network of suppliers which is a key for any player in the Dairy industry. Kwality started its procurement from it’s own MCCs in 2008 and currently set up 29 MCCs in northern states of Punjab, Rajasthan, UP & Haryana near its milk processing facilities in Haryana & UP. For procurement of quality milk, Kwality plans to open another 30 MCCs in next 2 years to ensure uninterrupted supply of milk and to reach the target of procuring milk from its own MCCs at 50% in next 3 years. MCCs are likely to be in states of UP, Rajasthan & Haryana which are the top three producers of milk but the penetration level is low for organized players. It is also planning to set up MCC with capacity of 5lac LPD in Rajasthan. It is also looking out for opportunities for expansion of its MCCs either by organic or inorganic route and reach its target of 50% direct milk procurement. Strengthening the raw milk procurement system is expected to improve its margins over next few years as there are systems and processes to follow during collection and less chances of substandard quality of milk.
Aiding farmers in various ways to create long term relationships Over the years Kwality has taken many initiatives to strengthen its relationship with farmer in rural areas. Farmers are provided with veterinary doctors to look after animal health and artificial insemination need, subsidized animal feed and annual FMD vaccination so as to provide incentive to farmers to be associated to KDL and thus increase the number of farmers under each VCC. In FY17 it has inked an MoU with Bank of Baroda to disburse Rs40b of [email protected]% to ~1 lac farmers in initial phase, to buy milching animals, a smart phone & a two-wheeler; to boost direct procurement. The scheme was aimed to provide financial assistance to improve socio-economic lives of farmers and steer them towards digitization. Final tranche of disbursement took place in June 2017. This initiative has received well by farmers and expected to create a win-win situation for both, the company and farmer.
Exhibit 66: Creating a win-win for all participants
Source: Company, Trust

Kwality Ltd Initiating Coverage 13 April 2018
44
Strong distribution network in largest consumption markets of North India Kwality has major presence in NCR, Haryana, Uttar Pradesh and Rajasthan (largest consumption markets of North India for milk products) where its products are available on general and modern trade channels. Kwality aims to enhance its presence to 100,000+ points of sale from 50k at present over next 2-3 years including modern trade channels, exclusive brand stores, and select online modes in sync with brand salience and launch of new products. In Delhi alone, Kwality aims to reach to 20k touch sales points by FY20. To leverage such a robust network Kwality was also mulling various options to foray into non-dairy FMCG products such as packaged food, juices, water, food products for health-conscious people in future. However it has identified Fresh milk products category to be launched under own brand name and focusing on adding new markets for the same.
Exhibit 67: Growing retail network (nos)
Source: Company, Trust
Exhibit 68: Share of direct milk procurement rising gradually
Source: Company, Trust
Weak international SMP prices impacted UAE subsidiary in last two years Its wholly-owned subsidiary Kwality Dairy Products FZE is located in the free trade zone of UAE; which is engaged in the trading of milk products and export and import of skimmed and whole milk powder and various derivatives of milk, ghee, butter, neutraceuticals and other dairy products. These are sold domestically and also exported to other countries. The objective of the subsidiary is to increase its international presence and cater to new markets. During FY17, Kwality has achieved the sales turnover of `7.4b with profit of `298m. Once international SMP prices improve the contribution from this subsidy will also improve significantly. The subsidiary imports the dairy products from India, Australia, New Zealand and Eastern European Countries including Turkey, Ireland, Holland, Poland and Ukraine, New Zealand which are sold both domestically and exported to GCC, Middle East, Far East, Bangladesh, China, Thailand and Africa, among others.
19,00026,000 27,000
32,00040,000
45,00050,000
0
400
800
1,200
1,600
2,000
0
12,000
24,000
36,000
48,000
60,000
FY1
2
FY1
3
FY1
4
FY1
5
FY1
6
FY1
7
1H
FY1
8
Touch points Distributors (RHS)
Direct27%
rest73%

Kwality Ltd Initiating Coverage 13 April 2018
45
Consolidated Financials
KDL has maintained its consistent growth in revenue and profitability over last decade as demand for milk and milk products improved consistently in its key markets. KDL is also cognizant of its delay in increasing direct procurement of raw milk from farmers and taking steps in right direction. Over last few years it is working strategically improving direct procurement, spending on branding, distribution and covering gaps in its product portfolio. Over FY11-17, KDL has delivered 27%, 29% and 27% CAGR in revenue, EBITDA and PAT, respectively.
Exhibit 69: Sales Growth
Source: Company, Trust
Exhibit 70: EBITDA Growth
Source: Company, Trust
Exhibit 71: PAT Performance
Source: Company, Trust
Exhibit 72: Trend Of Operating Cash Flows (`b)
Source: Company, Trust
Exhibit 73: ROCE and ROE (%)
Source: Company, Trust
Exhibit 74: Rising Dividend Payout Ratio
Source: Company, Trust
0
20
40
60
80
100
120
140
0
20
40
60
80
100
FY0
8
FY0
9
FY1
0
FY1
1
FY1
2
FY1
3
FY1
4
FY1
5
FY1
6
FY1
7
FY1
8E
FY1
9E
FY2
0E
Revenue (Rs b) Growth (%)
0
1
2
3
4
5
6
7
8
0
1,000
2,000
3,000
4,000
5,000
6,000
7,000
FY0
8
FY0
9
FY1
0
FY1
1
FY1
2
FY1
3
FY1
4
FY1
5
FY1
6
FY1
7
FY1
8E
FY1
9E
FY2
0E
EBITDA (Rs m) Margins (%)
-40
-20
0
20
40
60
80
100
120
0
500
1,000
1,500
2,000
2,500
FY0
8
FY0
9
FY1
0
FY1
1
FY1
2
FY1
3
FY1
4
FY1
5
FY1
6
FY1
7
FY1
8E
FY1
9E
FY2
0E
Adj PAT (Rs m) Growth (%)
-2
-1
0
1
2
3
4
5
FY0
8
FY0
9
FY1
0
FY1
1
FY1
2
FY1
3
FY1
4
FY1
5
FY1
6
FY1
7
FY1
8E
FY1
9E
FY2
0E
OCF FCF
0
10
20
30
40
50
60
70
FY0
8
FY0
9
FY1
0
FY1
1
FY1
2
FY1
3
FY1
4
FY1
5
FY1
6
FY1
7
FY1
8E
FY1
9E
FY2
0E
RoE RoCE
0
1
1
2
2
3
3
FY1
2
FY1
3
FY1
4
FY1
5
FY1
6
FY1
7
FY1
8E
FY1
9E
FY2
0E
Div Payout ratio (%)

Kwality Ltd Initiating Coverage 13 April 2018
46
Outlook & Valuation
Over last decade KDL has delivered 27%, 29% and 27% CAGR in revenue, EBITDA and PAT, respectively. We expect KDL to deliver 6%, 11% and 4% CAGR growth over FY17-20E in revenue, EBITDA & PAT, respectively on the back of its rising focus on B2C business, reduction of working capital requirement by focusing on higher direct procurement model and improving product mix.
KDL trades at just 7xFY20E EPS of `8.7 which appear attractive considering the size of business in the strong consumption Northern India market however recent incidences of inefficient management of capital allocation have created doubts on company’s corporate governance image. The 12-month forward P/E is 9.1x is 40% discount to last 10 year average while 50% discount to last one year average. We expect management to learn from its past mistakes, maintain its focus on dairy business and improve operational efficiencies over next two years. We initiate coverage with BUY.
Exhibit 75: KDL 1 Year Forward P/E Band
Source: Bloomberg, Company, Trust
Exhibit 76: KDL ROE Chart
Source: Bloomberg, Company, Trust
Company Background
Kwality Ltd. was set up in 1992 by the then promoters as a backward integration unit of Kwality Ice Cream India Ltd. Sanjay Dhingra and his family, who were then distributors of edible oil, took over the company in 2002. During the period 2003-2010, the company focused on B2B business model, catering to Institutional and HORECA segments. Kwality entered into a tie-up with Amul for providing pouched milk in 2003 and continuously expanded its product portfolio and milk-processing capacities over the years. Kwality’s primary strength is its institutional business, which accounts for 60% of revenue. It supplies bulk milk products such as milk powder, ghee, curd, etc. to well-known FMCG companies such as Britannia, Hindustan Unilever, ITC, Mondelez and Mother Dairy. Kwality has processing units at six locations - Palwal (Haryana), Bulandsahar (UP), Saharanpur (UP), Jarar (UP), Sitapur (UP), and Ajmer (Rajasthan). Its portfolio includes ice cream, ghee, skimmed milk powder, pouched milk, curd, buttermilk, paneer and butter.
Leading Private Equity firm Kohlberg Kravis Roberts & Co. (KKR) has agreed to invest `520 crore in the Company, to be utilized towards capacity expansion for value-added products, debt consolidation, marketing and branding, and strengthening IT infrastructure. The Company has raised `300 crore as of now.
31
15.7
74.8
2.28.50
16
32
48
64
80
Ap
r-0
7O
ct-0
7A
pr-
08
Oct
-08
Ap
r-0
9O
ct-0
9A
pr-
10
Oct
-10
Ap
r-1
1O
ct-1
1A
pr-
12
Oct
-12
Ap
r-1
3O
ct-1
3A
pr-
14
Oct
-14
Ap
r-1
5O
ct-1
5A
pr-
16
Oct
-16
Ap
r-1
7O
ct-1
7A
pr-
18
P/E (x) Avg(x) Peak(x)
Min(x) Median(x)
27
4360
6551
4034
2519 17
10 11 12
0
15
30
45
60
75
FY0
8
FY0
9
FY1
0
FY1
1
FY1
2
FY1
3
FY1
4
FY1
5
FY1
6
FY1
7
FY1
8E
FY1
9E
FY2
0E
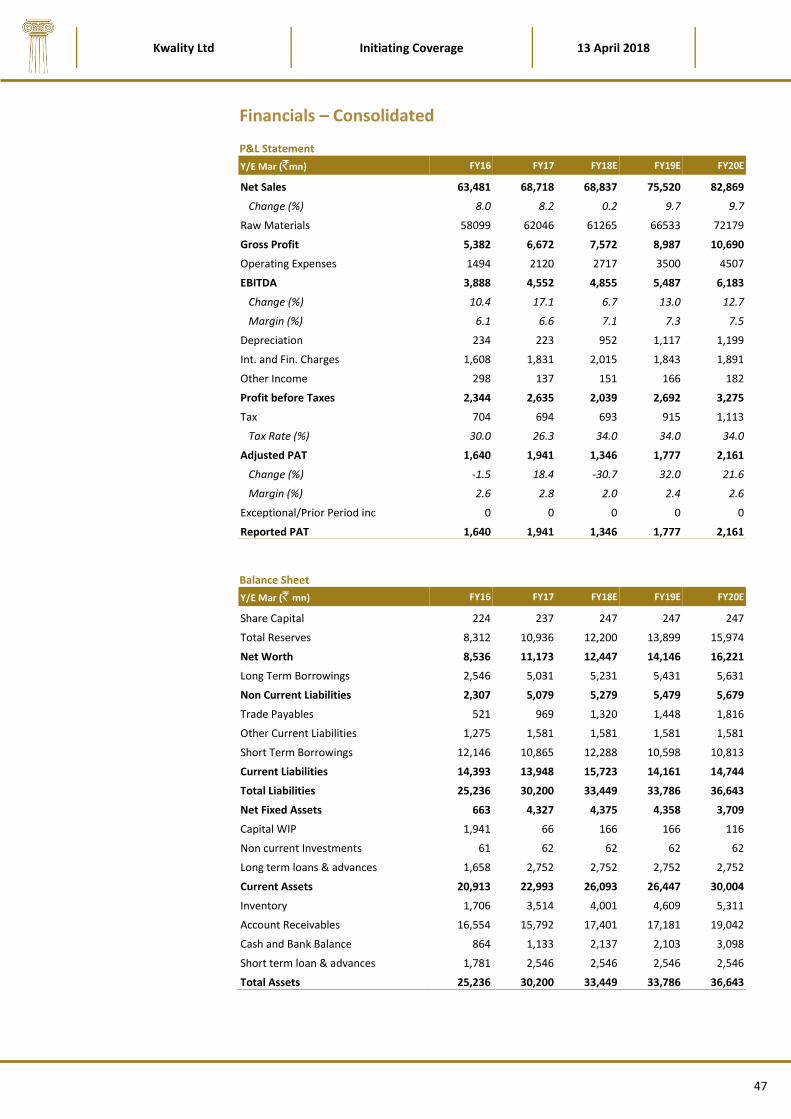
Kwality Ltd Initiating Coverage 13 April 2018
47
Financials – Consolidated
P&L Statement
Balance Sheet
Y/E Mar (` mn) FY16 FY17 FY18E FY19E FY20E
Share Capital 224 237 247 247 247
Total Reserves 8,312 10,936 12,200 13,899 15,974
Net Worth 8,536 11,173 12,447 14,146 16,221
Long Term Borrowings 2,546 5,031 5,231 5,431 5,631
Non Current Liabilities 2,307 5,079 5,279 5,479 5,679
Trade Payables 521 969 1,320 1,448 1,816
Other Current Liabilities 1,275 1,581 1,581 1,581 1,581
Short Term Borrowings 12,146 10,865 12,288 10,598 10,813
Current Liabilities 14,393 13,948 15,723 14,161 14,744
Total Liabilities 25,236 30,200 33,449 33,786 36,643
Net Fixed Assets 663 4,327 4,375 4,358 3,709
Capital WIP 1,941 66 166 166 116
Non current Investments 61 62 62 62 62
Long term loans & advances 1,658 2,752 2,752 2,752 2,752
Current Assets 20,913 22,993 26,093 26,447 30,004
Inventory 1,706 3,514 4,001 4,609 5,311
Account Receivables 16,554 15,792 17,401 17,181 19,042
Cash and Bank Balance 864 1,133 2,137 2,103 3,098
Short term loan & advances 1,781 2,546 2,546 2,546 2,546
Total Assets 25,236 30,200 33,449 33,786 36,643
Y/E Mar (`mn) FY16 FY17 FY18E FY19E FY20E
Net Sales 63,481 68,718 68,837 75,520 82,869
Change (%) 8.0 8.2 0.2 9.7 9.7
Raw Materials 58099 62046 61265 66533 72179
Gross Profit 5,382 6,672 7,572 8,987 10,690
Operating Expenses 1494 2120 2717 3500 4507
EBITDA 3,888 4,552 4,855 5,487 6,183
Change (%) 10.4 17.1 6.7 13.0 12.7
Margin (%) 6.1 6.6 7.1 7.3 7.5
Depreciation 234 223 952 1,117 1,199
Int. and Fin. Charges 1,608 1,831 2,015 1,843 1,891
Other Income 298 137 151 166 182
Profit before Taxes 2,344 2,635 2,039 2,692 3,275
Tax 704 694 693 915 1,113
Tax Rate (%) 30.0 26.3 34.0 34.0 34.0
Adjusted PAT 1,640 1,941 1,346 1,777 2,161
Change (%) -1.5 18.4 -30.7 32.0 21.6
Margin (%) 2.6 2.8 2.0 2.4 2.6
Exceptional/Prior Period inc 0 0 0 0 0
Reported PAT 1,640 1,941 1,346 1,777 2,161

Kwality Ltd Initiating Coverage 13 April 2018
48
Cash Flow
Cash Flow Statement (` mn) FY16 FY17 FY18E FY19E FY20E
PBT before EO items 2,344 2,635 2,039 2,692 3,275
Add : Depreciation -8 398 952 1,117 1,199
Interest 1,608 1,831 2,015 1,843 1,891
Less : Direct taxes paid 704 694 693 915 1,113
Less: Minority Interest 0 0 0 0 0
(Inc)/Dec in WC 2,814 1,958 1,745 260 2,194
CF from Operations 425 2,212 2,568 4,477 3,058
Extraordinary 0 0 0 0 0
CF from Op after extra 425 2,212 2,568 4,477 3,058
(Incr)/Decr in FA 981 2,012 1,100 1,100 500
(Pur)/Sale of Investments 61 1 0 0 0
CF from Invest. -2,650 -3,844 -3,115 -2,943 -2,391
Inc/(Dec) in equity 270 720 1 1 2
Inc/(Dec) in debt 2,326 1,205 1,623 -1,490 414
Dividend paid 24 24 20 36 43
CF from fin. activity 2,572 1,901 1,603 -1,524 373
Incr/Decr of Cash 347.8 268.4 1,056.1 9.9 1,039.7
Add: Opening Balance 516 864 1,132 2,188 2,198
Closing Balance 864 1,132 2,188 2,198 3,238
Key Ratios
Y/E Mar (%) FY16 FY17 FY18E FY19E FY20E
Raw Material Cost/Sales 91.5 90.3 89.0 88.1 87.1
Manpower Cost/Sales 0.6 0.6 0.8 0.9 1.1
Operating & Other Cost/Sales 1.8 2.5 3.2 3.7 4.4
Revenue Growth 8.0 8.2 0.2 9.7 9.7
EBITDA Margins 6.1 6.6 7.1 7.3 7.5
Net Income Margins 2.6 2.8 2.0 2.4 2.6
ROCE 33.7 26.6 22.0 22.3 22.8
ROE 19.2 17.4 10.8 12.6 13.3
Valuation Parameters
Y/E Mar FY16 FY17 FY18E FY19E FY20E
EPS (`) 6.9 8.2 5.4 7.2 8.7
P/E (x) 8.6 7.3 10.9 8.3 6.8
BV (`) 36.0 47.1 50.3 57.2 65.6
P/BV (x) 1.7 1.3 1.2 1.0 0.9
EV/EBITDA (x) 7.2 6.3 6.2 5.2 4.5
Fixed assets turnover ratio (x) 95.7 15.9 15.7 17.3 22.3
Net Debt/Equity (x) 0.3 0.5 0.4 0.4 0.3
EV/Sales (x) 0.4 0.4 0.4 0.4 0.3

Heritage Foods
Initiating Coverage
“Integrated B2C FMP player adding more VAP”
Heritage Foods is an integrated B2C player focused on Fresh Milk Products and pioneer of
packaged curd in South India. It has delivered strong earnings growth over decade aided by
its focus on B2C business. With an ambition of becoming a pan India player, it is acquiring
smaller scale dairy businesses and spreading own brands across 15 states now including
Northern and Western India. Rising focus on VAP along with geographical expansion and
100% direct procurement strategy we expect HTFL to deliver superior earnings growth over
next few years.
Integrated B2C player with strong focus on high margin fresh milk products
Heritage is an integrated B2C player with focus on high margin fresh milk products such as
curd and buttermilk which contributes ~23% of total revenues. Curd is one of the largest dairy
category with `310b size and less than 10% penetration of organized players. Heritage sensed
this opportunity way back in 2006 and launched own branded curd in its home Southern
markets in FY07 which has grown 22% CAGR over FY11 to FY17. With rising geographical
expansion, we expect ~30% contribution from this category in FY20. Post demerger of retail
business, Heritage has become again a pure play dairy company focusing on dairy and vet care
businesses. Dairy business is strong value creator with high return ratios as company has
focused on milk and fresh milk products till date. Pouch milk contributes more than 65% of
revenue which is expected to grow strong 9-10% every year as company has expanded its
operations to 15 states in India.
Geographical expansion in milk procurement to support availability of products
In its bid to become a pan India player, Heritage has expanded its distribution of products to
15 states in India covering West and North India. It has almost 100% direct procurement
network of 3.5lac dairy farmers across nine major milk producing states as Andhra Pradesh,
Telangana, Karnataka, Tamil Nadu, Maharashtra, Gujarat, Rajasthan, Haryana and Punjab. The
direct route of milk procurement enables it to maintain quality at lower prices. The company
also operates 186 bulk coolers and procures ~1.35m liters of milk per day. It operates 15 own
processing plants and 5 leased processing plants with installed milk processing capacity of
1.89m lpd through own plants and 0.4m lpd through leased plants.
Targeting VAP that enjoy higher return rations to achieve 2022 revenue target of Rs60b
The company is largely selling fresh milk value-added products such as dahi, ice cream, paneer,
flavored milk and sweets. Revenue contribution from value-added products has expanded
from ~12% in FY11 to 23% in FY17. Among these products, dahi accounts for >75% of
revenues. Fresh milk value-added products enjoy higher growth rates than the milk business,
and higher EBITDA margins with limited additional capex and working capital.
Valuation & Recommendation
Over last decade HTFL has delivered 25%, 32% and 51% CAGR in revenue, EBITDA and PAT,
respectively on the back of integrated operations and first mover advantage in Fresh Milk
Products. We expect HTFL to deliver 8%, 18% and 22% CAGR growth over FY17-20E in revenue,
EBITDA & PAT, respectively on the back of its rising focus on geographical expansion in
distribution network in West and North India.
HTFL trades at 28xFY20E EPS of `26 which appears expensive however it deserves premium to
peers considering its high return and pay out ratios. The 12-month forward P/E at 35x is 17%
premium to its decade year average of 30x while 15% discount to last one year average of 41x.
We initiate coverage with BUY.
Market statistics
Current stock price (`) 746
Shares O/S (cr.) 4.6
Mcap (` cr) 3,462
52W H/L (`) 889/ 520
6m avg. volume 54,503
Bloomberg HTFL in
Shareholding pattern
Promoters 72.96
Domestic Institution 8.24
Foreign Institution 1.98
Non-institution 16.82
of which more than 1%
Nirvana Holdings P Ltd. 11.09
V Sudha Sarada 3.58
HTFL vs Nifty
Capital efficiency & valuations
Particulars FY18 FY19E FY20E
RoE (%) 17.2 21.7 22.3
RoCE (%) 21.3 27.2 28.7
P/B (x) 9.8 8.0 6.4
EV/OCF (x) 26.9 25.2 20.7
EV/EBITDA (x) 24.3 17.9 14.3
P/E (x) 57.1 36.8 28.7
Analyst
Tushar Chaudhari
+91-22 4224 5119
Sector: Dairy
CMP: `746
Recommendation: BUY

Heritage Foods Initiating Coverage 13 April 2018
50
Investment Thesis
Integrated B2C player with strong focus on high margin fresh milk products Heritage is an integrated B2C player with focus on high margin fresh milk products such as curd and buttermilk which contributes ~23% of total revenues. Curd is one of the largest dairy category with `310b size and less than 10% penetration of organized players. Heritage sensed this opportunity way back in 2006 and launched own branded curd in its home Southern markets in FY07 which has grown 22% CAGR over FY11 to FY17. With rising geographical expansion, we expect ~30% contribution from this category in FY20. Post demerger of reatil business, Heritage has become again a pure play dairy company focusing on dairy and vet care businesses. Dairy business is strong value creator with high return ratios as company has focused on milk and fresh milk products till date. Pouch milk contributes more than 65% of revenue which is expected to grow strong 9-10% every year as company has expanded its operations to 15 states in India.
Exhibit 77: Strong contribution from FMP
Source: Company, Trust
Exhibit 78: Focus on VAP to rise
Source: Company, Trust
Geographical expansion in milk procurement to support availability of products In its bid to become a pan India player, Heritage has expanded its distribution of products to 15 states in India covering West and North India. It has almost 100% direct procurement network of 3.5lac dairy farmers across nine major milk producing states as Andhra Pradesh, Telangana, Karnataka, Tamil Nadu, Maharashtra, Gujarat, Rajasthan, Haryana and Punjab. The direct route of milk procurement enables it to maintain quality at lower prices. The company also operates 186 bulk coolers and procures ~1.35m liters of milk per day. It operates 15 own processing plants and 5 leased processing plants with installed milk processing capacity of 1.89m lpd through own plants and 0.4m lpd through leased plants.
Heritage recently acquired Reliance Retail’s dairy business in a slump sale in September 2017; which used to operate a pan-India dairy procurement, processing and distribution platform under two 2 brands ‘Dairy Life’ and ‘Dairy Pure’ with a wide variety of products—packaged & flavored milk, butter, ghee, curd, dairy whitener, sweets and skimmed milk powder. With Heritage would continue the brands, it will mainly focus on milk procurement from the areas and try to grow milk procurement from North and West India over next few years. With FY16 revenue of `5.5b, this acquisition augurs well for Heritage as it opens up new opportunities in Punjab, Uttarakhand and Rajasthan, where the company was not present earlier, and offers strong synergies in urban markets like Mumbai and Delhi. At present it is rationalizing the existing operations of Reliance and we expect this acquisition to turn around in FY19.
In line with its 2022 target of reaching `60b revenue and become a pan India dairy player, Heritage has increased the reach of its products to 15 states. This brand building and distribution reach will aid Heritage introduce other high margin value-added products in newer markets. Company is also deepening its reach to tier 2/3 towns in existing strong markets which will aid revenue growth. More than 80% of Heritage’s distribution is directly via own agents/parlours. The ice cream business requires investment in cold chains at the retail level. As Heritage has decided not to invest aggressively in cold chains and it also does not have strong presence in indirect distribution of value-added products, it initiated the concept of ice cream parlours. The company has rolled out 1,680 ice cream parlours by FY17 which has grown at a CAGR of 8.5% over FY11-17. The ice cream parlours help the company expand and invest in the ice cream business via the franchisee route. Heritage has complete track of progress of these parlours and depending upon parlour level profitability it keeps on adding/ deleting the parlours or allow them to sell only milk and milk products if ice cream is not viable in that particular area.
0
20
40
60
80
100
0
4,000
8,000
12,000
16,000
20,000
FY1
1
FY1
2
FY1
3
FY1
4
FY1
5
FY1
6
FY1
7
FY1
8E
FY1
9E
FY2
0E
Milk % of Dairy revenue
0
6
12
18
24
30
0
2,000
4,000
6,000
8,000
FY1
1
FY1
2
FY1
3
FY1
4
FY1
5
FY1
6
FY1
7
FY1
8E
FY1
9E
FY2
0E
Value Added Produts % of Dairy revenue

Heritage Foods Initiating Coverage 13 April 2018
51
Exhibit 79: Creating a win-win for all participants
Source: Company, Trust
French JV to tap premium consumers in western India Heritage has established 50-50 JV with Novandie SNC, France in November 2017 for manufacturing and marketing of flavored yogurt and western style deserts. Heritage has planned to set up a 20tpd curd manufacturing facility at Navi Mumbai at Capex of `160m to cater to urban markets in Maharashtra such as Mumbai and Pune. Although we believe there is limited success to foreign frozen dessert brands in India even in urban markets as Indians are still in early stage of premiumisation. They prefer brands offering value for money and as economic development happens entire mentality can change for better.
Targeting value added products that enjoy higher return rations to achieve 2022 revenue target of `60b The company is largely selling fresh milk value-added products such as dahi, ice cream, paneer, flavored milk and sweets. Revenue contribution from value-added products has expanded from ~12% in FY11 to 23% in FY17. Among these products, dahi accounts for >75% of revenues. Fresh milk value-added products enjoy higher growth rates than the milk business, and higher EBITDA margins with limited additional capex and working capital.
Focus on North India: MIlk collection and selective advertisement
Focus on West India: MIlk collection at 0.1 m lpd and branding
VAP: Curd to remain thrust area across new markets + varied Yogurts & ice cream
Existing markets: Focus on tier 2/3 cities and improve milkprocurement
French JV: To set up yogurt plant at Rs160m Capex
5 Prongestrategy to focus in medium term

Heritage Foods Initiating Coverage 13 April 2018
52
Exhibit 80: Developing fresh milk products to achieve 2022 revenue target of `60b
Source: Company, Trust

Heritage Foods Initiating Coverage 13 April 2018
53
Consolidate Financials
Over last decade HTFL has delivered 25%, 32% and 51% CAGR in revenue, EBITDA and PAT, respectively on the back of integrated operations, relentless focus on building its brand and product portfolio in fresh milk products. We expect HTFL to deliver 8%, 18% and 22% CAGR growth over FY17-20E in revenue, EBITDA & PAT, respectively.
Exhibit 81: Sales Growth
Source: Company, Trust
Exhibit 82: EBITDA Growth
Source: Company, Trust
Exhibit 83: PAT Performance
Source: Company, Trust
Exhibit 84: Trend of Operating Cash Flows
Source: Company, Trust
Exhibit 85: ROCE and ROE
Source: Company, Trust
Exhibit 86: Dividend History (Pay out ratio %)
Source: Company, Trust
-20
0
20
40
60
80
100
120
140
0
5
10
15
20
25
30
35
FY0
8
FY0
9
FY1
0
FY1
1
FY1
2
FY1
3
FY1
4
FY1
5
FY1
6
FY1
7
FY1
8E
FY1
9E
FY2
0E
Revenue (Rs b) Growth (%)
0
1
2
3
4
5
6
7
8
0
500
1,000
1,500
2,000
2,500
FY0
8
FY0
9
FY1
0
FY1
1
FY1
2
FY1
3
FY1
4
FY1
5
FY1
6
FY1
7
FY1
8E
FY1
9E
FY2
0E
EBITDA (Rs m) Margins (%)
-200
0
200
400
600
800
0
200
400
600
800
1,000
1,200
1,400
FY1
0
FY1
1
FY1
2
FY1
3
FY1
4
FY1
5
FY1
6
FY1
7
FY1
8E
FY1
9E
FY2
0E
Adj PAT (Rs m) Growth (%)
-1,000
-500
0
500
1,000
1,500
2,000
FY0
8
FY0
9
FY1
0
FY1
1
FY1
2
FY1
3
FY1
4
FY1
5
FY1
6
FY1
7
FY1
8E
FY1
9E
FY2
0E
OCF FCF
-60
-40
-20
0
20
40
60
FY0
8
FY0
9
FY1
0
FY1
1
FY1
2
FY1
3
FY1
4
FY1
5
FY1
6
FY1
7
FY1
8E
FY1
9E
FY2
0E
RoE RoCE
0
10
20
30
40
50
60
FY1
2
FY1
3
FY1
4
FY1
5
FY1
6
FY1
7
FY1
8E
FY1
9E
FY2
0E

Heritage Foods Initiating Coverage 13 April 2018
54
Outlook & Valuation
Over last decade HTFL has delivered 25%, 32% and 51% CAGR in revenue, EBITDA and PAT, respectively on the back of integrated operations and first mover advantage in Fresh Milk Products. We expect HTFL to deliver 8%, 18% and 22% CAGR growth over FY17-20E in revenue, EBITDA & PAT, respectively on the back of its rising focus on geographical expansion in distribution network in West and North India.
HTFL trades at 28xFY20E EPS of `26 which appears expensive however it deserves premium to peers considering its high return and pay out ratios. The 12-month forward P/E at 35x is 17% premium to its decade year average of 30x while 15% discount to last one year average of 41x. We initiate coverage with BUY.
Exhibit 87: HTFL 1 Year Forward P/E Band
Source: Bloomberg, Company, Trust
Exhibit 88: HTFL ROE Chart
Source: Bloomberg, Company, Trust
Company Background
The Heritage Group, founded in the year 1992 by Mr. Nara Chandrababu Naidu, is one of the fastest growing Public Listed Companies in India, with two-business divisions-Dairy and Renewable Energy under its flagship Company Heritage Foods Limited (Formerly known as Heritage Foods (India) Limited). Heritage's milk and milk products have a market presence in Andhra Pradesh, Telangana, Karnataka, Kerala, Tamil Nadu, Maharashtra, Odisha, NCR Delhi, Haryana, Rajasthan, Madhya Pradesh, Punjab, Uttar Pradesh, Gujarat and Uttarakhand.
31
29.9
153.3
-97.7
14.6
-120
-60
0
60
120
180
Ap
r-0
7O
ct-0
7A
pr-
08
Oct
-08
Ap
r-0
9O
ct-0
9A
pr-
10
Oct
-10
Ap
r-1
1O
ct-1
1A
pr-
12
Oct
-12
Ap
r-1
3O
ct-1
3A
pr-
14
Oct
-14
Ap
r-1
5O
ct-1
5A
pr-
16
Oct
-16
Ap
r-1
7O
ct-1
7A
pr-
18
P/E (x) Avg(x) Peak(x)
Min(x) Median(x)
2
-43
6 1
10
37
26
1524 22
1722 22
-60
-45
-30
-15
0
15
30
45
FY0
8
FY0
9
FY1
0
FY1
1
FY1
2
FY1
3
FY1
4
FY1
5
FY1
6
FY1
7
FY1
8E
FY1
9E
FY2
0E
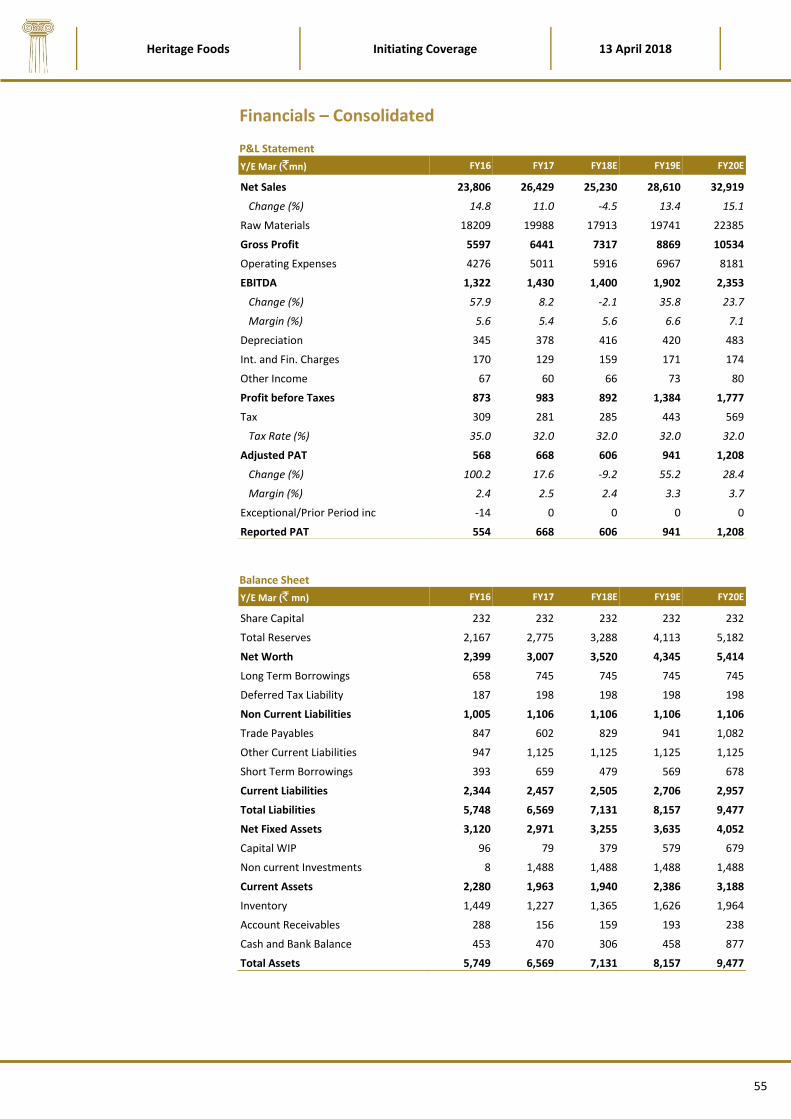
Heritage Foods Initiating Coverage 13 April 2018
55
Financials – Consolidated
P&L Statement
Balance Sheet
Y/E Mar (` mn) FY16 FY17 FY18E FY19E FY20E
Share Capital 232 232 232 232 232
Total Reserves 2,167 2,775 3,288 4,113 5,182
Net Worth 2,399 3,007 3,520 4,345 5,414
Long Term Borrowings 658 745 745 745 745
Deferred Tax Liability 187 198 198 198 198
Non Current Liabilities 1,005 1,106 1,106 1,106 1,106
Trade Payables 847 602 829 941 1,082
Other Current Liabilities 947 1,125 1,125 1,125 1,125
Short Term Borrowings 393 659 479 569 678
Current Liabilities 2,344 2,457 2,505 2,706 2,957
Total Liabilities 5,748 6,569 7,131 8,157 9,477
Net Fixed Assets 3,120 2,971 3,255 3,635 4,052
Capital WIP 96 79 379 579 679
Non current Investments 8 1,488 1,488 1,488 1,488
Current Assets 2,280 1,963 1,940 2,386 3,188
Inventory 1,449 1,227 1,365 1,626 1,964
Account Receivables 288 156 159 193 238
Cash and Bank Balance 453 470 306 458 877
Total Assets 5,749 6,569 7,131 8,157 9,477
Y/E Mar (`mn) FY16 FY17 FY18E FY19E FY20E
Net Sales 23,806 26,429 25,230 28,610 32,919
Change (%) 14.8 11.0 -4.5 13.4 15.1
Raw Materials 18209 19988 17913 19741 22385
Gross Profit 5597 6441 7317 8869 10534
Operating Expenses 4276 5011 5916 6967 8181
EBITDA 1,322 1,430 1,400 1,902 2,353
Change (%) 57.9 8.2 -2.1 35.8 23.7
Margin (%) 5.6 5.4 5.6 6.6 7.1
Depreciation 345 378 416 420 483
Int. and Fin. Charges 170 129 159 171 174
Other Income 67 60 66 73 80
Profit before Taxes 873 983 892 1,384 1,777
Tax 309 281 285 443 569
Tax Rate (%) 35.0 32.0 32.0 32.0 32.0
Adjusted PAT 568 668 606 941 1,208
Change (%) 100.2 17.6 -9.2 55.2 28.4
Margin (%) 2.4 2.5 2.4 3.3 3.7
Exceptional/Prior Period inc -14 0 0 0 0
Reported PAT 554 668 606 941 1,208

Heritage Foods Initiating Coverage 13 April 2018
56
Cash Flow
Cash Flow Statement (` mn) FY16 FY17 FY18E FY19E FY20E
PBT before EO items 873 983 892 1,384 1,777
Add : Depreciation 344 389 416 420 483
Interest 170 129 159 171 174
Less : Direct taxes paid 306 315 285 443 569
(Inc)/Dec in WC -270 -360 -86 183 241
CF from Operations 1,352 1,546 1,267 1,348 1,623
CF from Op after extra 1,339 1,546 1,267 1,348 1,623
(Incr)/Decr in FA 665 211 1,000 1,000 1,000
(Pur)/Sale of Investments 0 1,480 0 0 0
CF from Invest. -835 -1,821 -1,159 -1,171 -1,174
Inc/(Dec) in equity 55 79 93 116 139
Inc/(Dec) in debt -374 352 -180 90 109
Inc/(Dec) in Minority Interest 0 0 0 0 0
Dividend paid 139 139 186 232 278
CF from fin. activity -458 292 -273 -26 -30
Incr/Decr of Cash 45 17 -164 152 419
Add: Opening Balance 408 453 470 306 458
Closing Balance 453 470 306 458 877
Key Ratios
Y/E Mar (%) FY16 FY17 FY18E FY19E FY20E
Raw Material Cost/Sales 76.5 75.6 71.0 69.0 68.0
Manpower Cost/Sales 5.9 6.2 7.8 7.9 7.9
Operating & Other Cost/Sales 12.1 12.7 15.6 16.4 16.9
Revenue Growth 14.8 11.0 -4.5 13.4 15.1
EBITDA Margins 5.6 5.4 5.6 6.6 7.1
Net Income Margins 2.4 2.5 2.4 3.3 3.7
ROCE 28.7 25.6 21.3 27.2 28.7
ROE 23.7 22.2 17.2 21.7 22.3
Valuation Parameters
Y/E Mar FY16 FY17 FY18E FY19E FY20E
EPS (`) 12.2 14.4 13.1 20.3 26.0
P/E (x) 60.9 51.8 57.1 36.8 28.7
BV (`) 51.7 64.8 75.9 93.7 116.7
P/BV (x) 14.4 11.5 9.8 8.0 6.4
EV/EBITDA (x) 26.6 23.8 24.3 17.9 14.3
Fixed assets turnover ratio (x) 7.6 8.9 7.8 7.9 8.1
Net Debt/Equity (x) 0.3 0.2 0.2 0.2 0.1
EV/Sales (x) 1.5 1.3 1.3 1.2 1.0

Hatsun Agro Products
Initiating Coverage
“Integrated B2C player entering into VAP”
Hatsun is the largest integrated Fresh Milk Products company in Tamil Nadu and pioneer in
applying technology for its raw milk procurement. Its systems and processes have built trust
amongst farmers aiding it to achieve 100% direct procurement of raw milk. Over the decade
it has established strong brands in pouch milk and ice creams. With an aim to become a pan
India player, Hatsun has grown in other Southern states applying its success formula. With
its rising focus on VAP and ability to multiply its integrated operation in other states, we
expect Hatsun to deliver strong performance over next few years.
Mastered the art by establishing adequate systems and processes for raw milk procurement
Hatsun procures nearly 100% of its milk requirement directly from the farmers. Direct sourcing
is Hatsun’s biggest strength within peers as it has developed own systems and processes over
the years; which has aided it to increase scale to other states too. Focus on direct milk
procurement from farmers and building pouch milk business complemented by focus on
technology helped Hatsun to gain market share from cooperatives. We expect Hatsun to
increase market share in milk/curd in South India by FY20 with curd contributing >20% of sales
(9-10% currently) and outside Tamil Nadu revenue contribution of ~40%.
Developed strong own brands over the period with consistent product quality
Developing a brand and register it in consumers’ minds can take years. Hatsun has achieved
great success in developing own product brands over last two decades. Hatsun has maintained
stringent quality checks, improved procurement and production processes with the help of
technology, supplied volumes to other regions and then set up facilities in and around
consumer markets. Arun is a well-established ice cream brand that is sold in more than 17,000
retail outlets. Hatsun also operates ~120 Ibaco outlets in the four Southern states and has
some presence in Kerala. Hatsun plans to take Ibaco to Maharashtra and other western
markets over the next two years.
Targeting geographical expansion to move closer to end user markets
Hatsun focused on rural and suburban areas with its toned pouch milk along with higher fat
content milk in Tamil Nadu. This helped Hatsun to cater to B2B markets using buffalo milk.
Initially Hatsun transported milk over a distance of ~400km in refrigerated vans from the milk
producing region to consumer and once brand got established it set up a processing plant. This
has worked well in gaining foot print in neighbouring states in Southern India. Now company is
evaluating various ways of geographical expansion in Western India.
Forward integration into premium products such as pizza provides great potential
Hatsun has evolved itself from ice cream producer to full-fledged dairy player and now
introducing premium products keeping milk business at its core. Hatsun’s latest foray is into a
range of frozen ready-to-cook snacks and a sumptuous spread of frozen ready-to-eat gravy
under the brand name Oyalo. This range promises to bring taste and convenience into the
kitchen. Oyalo does not contain any trans-fat, artificial colours or preservatives whatsoever,
and are made with choicest of ingredients to deliver the best nutrition. We believe there is
great opportunity in this space as today’s consumers are ready to experiment.
Valuation & Recommendation
As Hatsun has grown faster than its peers in dairy space over FY11-17, it is trading at 39x
FY20E EPS of `19.2. We expect Hatsun to deliver 13%, 17% and 30% CAGR growth over FY17-
19E in revenue, EBITDA & PAT respectively on the back of its consistent addition of new
customer areas, capacity addition, 100% backward integration and rising focus on VAP.
Hatsun trades at higher multiples than peers which make it expensive however it deserves
premium to peers considering its high return and pay out ratios, focus on growth and
perceived higher ethical standards. The 12-month forward P/E at 48x is 45% premium to its
decade year average of 33x while 11% discount to last one year average of 54x. We initiate
coverage with HOLD.
Market statistics
Current stock price (`) 740
Shares O/S (cr.) 15.2
Mcap (` cr) 11,276
52W H/L (`) 970/541
6m avg. volume 83,377
Bloomberg HTSMF in
Shareholding pattern
Promoters 72.51
Domestic Institution 3.17
Foreign Institution 5.22
Non-institution 19.1
of which more than 1%
Raju Ravi Shah 2.86
HTSMF vs Nifty
Capital efficiency & valuations
Particulars FY18 FY19E FY20E
RoE (%) 37.0 36.1 36.8
RoCE (%) 31.8 33.4 36.3
P/B (x) 24.8 19.0 14.2
EV/OCF (x) 54.8 32.1 27.3
EV/EBITDA (x) 27.5 23.9 19.6
P/E (x) 67.0 52.6 38.6
Analyst
Tushar Chaudhari
+91-22 4224 5119
Sector: Dairy
CMP: `740
Recommendation: HOLD
90
120
150
180
Apr-17 Aug-17 Dec-17 Apr-18
Hatsun Nifty
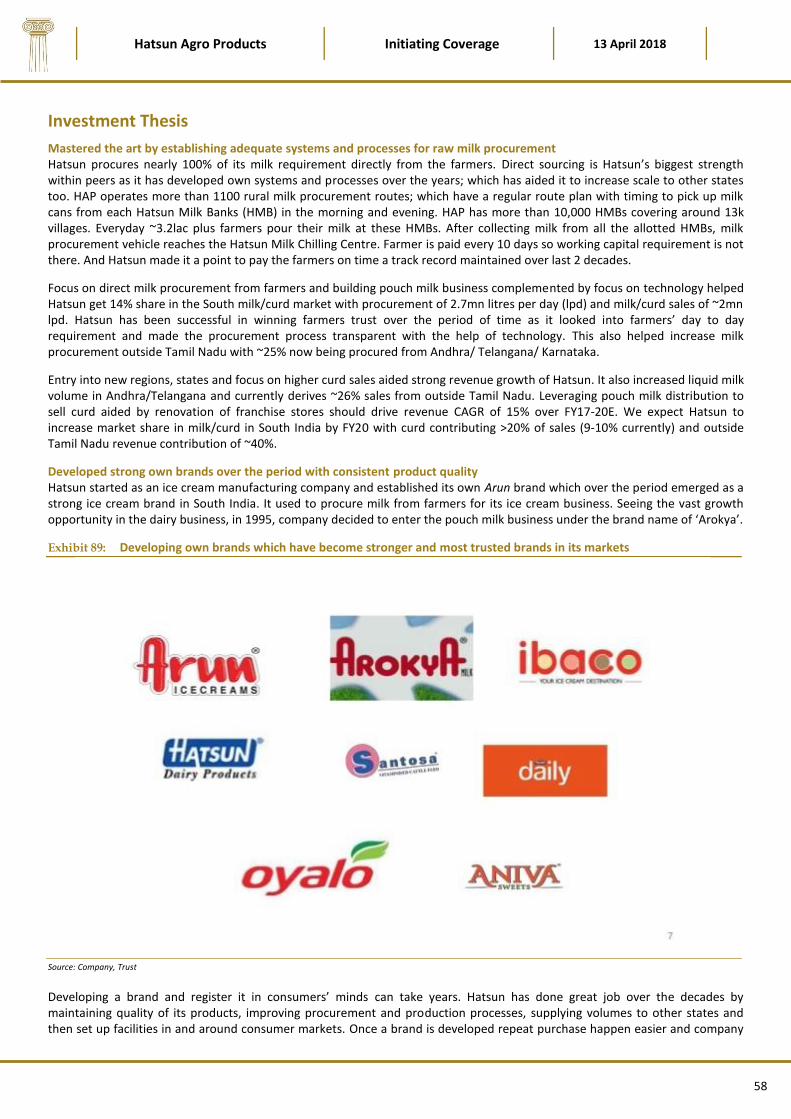
Hatsun Agro Products Initiating Coverage 13 April 2018
58
Investment Thesis
Mastered the art by establishing adequate systems and processes for raw milk procurement Hatsun procures nearly 100% of its milk requirement directly from the farmers. Direct sourcing is Hatsun’s biggest strength within peers as it has developed own systems and processes over the years; which has aided it to increase scale to other states too. HAP operates more than 1100 rural milk procurement routes; which have a regular route plan with timing to pick up milk cans from each Hatsun Milk Banks (HMB) in the morning and evening. HAP has more than 10,000 HMBs covering around 13k villages. Everyday ~3.2lac plus farmers pour their milk at these HMBs. After collecting milk from all the allotted HMBs, milk procurement vehicle reaches the Hatsun Milk Chilling Centre. Farmer is paid every 10 days so working capital requirement is not there. And Hatsun made it a point to pay the farmers on time a track record maintained over last 2 decades.
Focus on direct milk procurement from farmers and building pouch milk business complemented by focus on technology helped Hatsun get 14% share in the South milk/curd market with procurement of 2.7mn litres per day (lpd) and milk/curd sales of ~2mn lpd. Hatsun has been successful in winning farmers trust over the period of time as it looked into farmers’ day to day requirement and made the procurement process transparent with the help of technology. This also helped increase milk procurement outside Tamil Nadu with ~25% now being procured from Andhra/ Telangana/ Karnataka.
Entry into new regions, states and focus on higher curd sales aided strong revenue growth of Hatsun. It also increased liquid milk volume in Andhra/Telangana and currently derives ~26% sales from outside Tamil Nadu. Leveraging pouch milk distribution to sell curd aided by renovation of franchise stores should drive revenue CAGR of 15% over FY17-20E. We expect Hatsun to increase market share in milk/curd in South India by FY20 with curd contributing >20% of sales (9-10% currently) and outside Tamil Nadu revenue contribution of ~40%.
Developed strong own brands over the period with consistent product quality Hatsun started as an ice cream manufacturing company and established its own Arun brand which over the period emerged as a strong ice cream brand in South India. It used to procure milk from farmers for its ice cream business. Seeing the vast growth opportunity in the dairy business, in 1995, company decided to enter the pouch milk business under the brand name of ‘Arokya’.
Exhibit 89: Developing own brands which have become stronger and most trusted brands in its markets
Source: Company, Trust
Developing a brand and register it in consumers’ minds can take years. Hatsun has done great job over the decades by maintaining quality of its products, improving procurement and production processes, supplying volumes to other states and then set up facilities in and around consumer markets. Once a brand is developed repeat purchase happen easier and company
Hatsun Agro Products Initiating Coverage 13 April 2018
59
can introduce other milk products under one mother brand. Arun is an open-market brand that is sold in more than 17,000 retail outlets. The firm currently operates ~120 Ibaco outlets in the four Southern states and also has a presence in Kerala. Hatsun plans to take Ibaco to Maharashtra and other western markets over the next two years. Hatsun also has its own Hatsun Daily retail outlets, which sells all its brands of products. It currently has more than 1,500 outlets and is adding another 1,500 outlets in a phased manner over the next 12 months.
Targeting geographical expansion to move closer to end user markets Due to domination of state cooperatives, Hatsun focused on rural and suburban areas with its toned pouch milk and also launched standardized milk containing higher fat content than toned milk. This helped Hatsun to cater to B2B markets in Tamil Nadu using buffalo milk as well. For tapping under-penetrated rural and semi urban markets, Hatsun transported milk over a distance of ~400km in refrigerated vans from the milk producing region of Salem to Nagarcoil. Although these operations were unprofitable initially, operations turned profitable as volumes increased in these smaller towns. Owing to its first mover advantage and investments in creating a brand in these new regions, other dairy companies failed to get break-even volumes from these markets.
Hatsun followed a similar growth strategy in Karnataka, where it set up a factory in Belgaum in 1999 and focused on North Karnataka instead of the highly competitive Bangalore milk market which was dominated by Karnataka milk co-operative’s Nandini brand. As Hatsun’s liquid milk business expanded in Andhra, the company set up regional milk processing and pouching factories. This brought the production of milk closer to the end-user market, thus reducing logistics costs. In 2013, Hatsun acquired Jyothi Dairy which had a plant near Hyderabad and one in Chitoor with daily milk procurement of ~70,000 litres. As Hatsun installed its processes of direct milk procurement from farmers at Jyothi Dairy, procurement dropped to as low as ~35,000 litres per day due to opposition from bulk milk vendors. Hatsun’s transparency in milk procurement, timely payment and high milk procurement price allowed it to attract farmers to its network. Milk procurement has grown rapidly over the last 30 months to ~3 lakh litres per day. Initially, consumer acceptance was low for Hatsun’s cow milk in Andhra Pradesh and Telangana which are largely buffalo milk markets. Hatsun followed its usual strategy of first entering the smaller towns instead of larger markets like Hyderabad, Vijayawada and Vishakhapatnam. Through extensive sampling activities and competitive pricing, Hatsun is now amongst the top 5 liquid milk players in the AP and TS markets.
Hatsun has created a network of 16 milk processing and pouching plants across Tamil Nadu, Karnataka, Andhra Pradesh and Telangana. This network of plants has been mapped in a way that the end-market is within a 200km radius of the plant, thus keeping logistics cost low. Higher capacity utilization of the regional dairy plant increases its profitability. Regional dairy plants also give Hatsun more flexibility to adjust to local demand. Hatsun is also eyeing Western India by way of inorganic growth. It began procuring milk from Maharashtra in 2016 but sells milk only in a few pockets of the state. It now plans to expand in the state by selling milk under its Arokya brand more widely, starting with southern Maharashtra. The firm is also looking at retailing its oldest brand – Arun ice creams–and Hatsun curd in the state. In case of an inorganic acquisition, Hatsun prefer buying a company of a smaller size where restructuring can be done according to its requirements so it can modify the procurement system, the distribution model and advertising.
Continuous engagement with its entire supply chain indicates focus To strengthen its ties with farmers, Hatsun launched the White Gold project in FY07 to provide technical inputs to dairy farmers to increase the milk yield. In FY10, the company also started cattle feed manufacturing through third-party premises. This was sold under the ‘Santosa’ brand only to farmers supplying milk to Hatsun regularly. Hatsun takes care of its distributors as well by providing them spaces on rent while giving franchisee and thus reducing risk of it to become multi company brand distributor. In 2007, Hastun started selling its other dairy products through its network of Arun ice cream parlours; which led to growth in ice cream business too. Over 1995-2010, Hatsun invested in building a very strong pouch milk business in Tamil Nadu. Starting 2011, the strength and learning from this business was leveraged to enter new regions and product categories. Hatsun started selling curd under the Arokya and Hatsun brands in 2011. The branded pouch curd market in South India has been dominated by Heritage Foods earlier. Hatsun leveraged the distribution backbone of its liquid milk business to grow its curd business. Over the last few years, Hatsun has renovated its HDCs into the new Hatsun Daily format stores. Under the new format, the stores do the distribution activities in the morning and then operate like retail stores through the day. These outlets help Hatsun to exhibit its expanded product range to consumers and add one more income stream to its franchise owners.
Hatsun acquired a cattle feed plant in Tamil Nadu in FY14 followed by another in Dec’15. Through these acquisitions, Hatsun plans to bring production of cattle feed in-house and save costs. Driving initiatives to augment the existing business To strengthen its existing pouch milk business, Hatsun has been investing in farm management software and setting up Active Bulk Coolers to increase milk procurement. Hatsun is investing in ABCs to increase milk procurement at its existing collection centres. Hatsun is also investing in wind power and pouch film plants. Hatsun was one of the first dairy companies in India to install ERP software in FY03. In FY10, this was upgraded with Oracle being replaced by SAP. Hatsun has checks and balances throughout the procurement chain to check for pilferage.
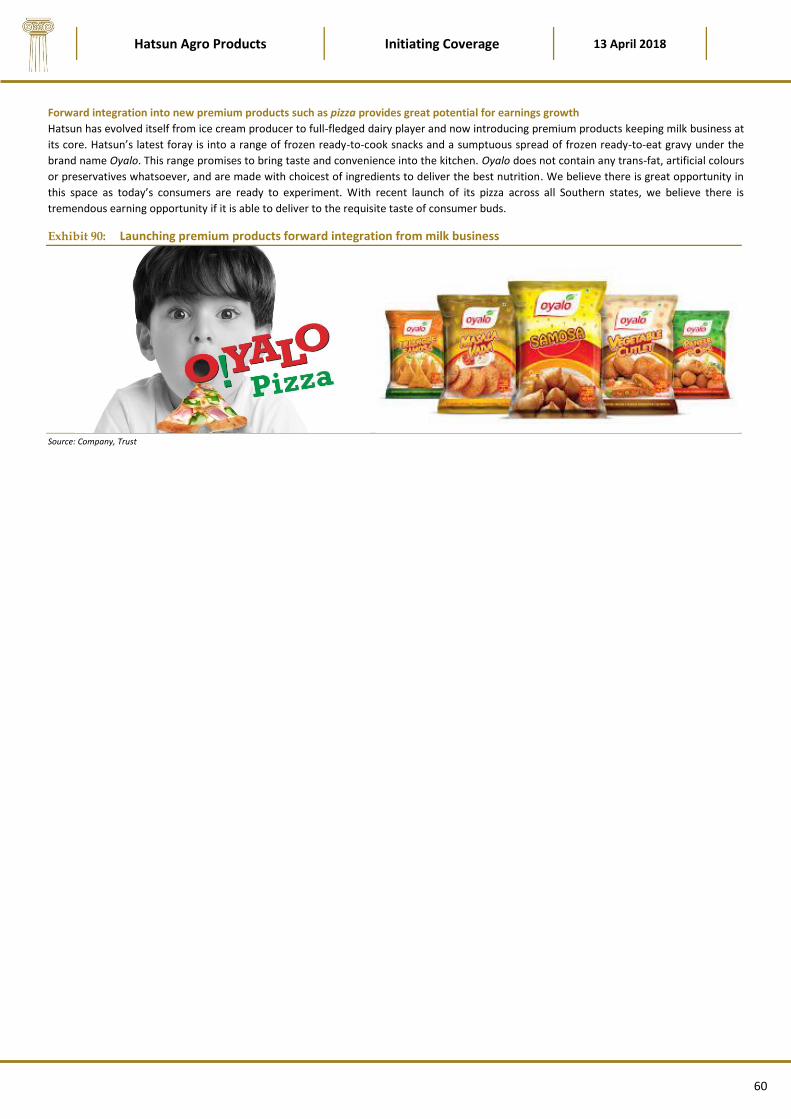
Hatsun Agro Products Initiating Coverage 13 April 2018
60
Forward integration into new premium products such as pizza provides great potential for earnings growth
Hatsun has evolved itself from ice cream producer to full-fledged dairy player and now introducing premium products keeping milk business at
its core. Hatsun’s latest foray is into a range of frozen ready-to-cook snacks and a sumptuous spread of frozen ready-to-eat gravy under the
brand name Oyalo. This range promises to bring taste and convenience into the kitchen. Oyalo does not contain any trans-fat, artificial colours
or preservatives whatsoever, and are made with choicest of ingredients to deliver the best nutrition. We believe there is great opportunity in
this space as today’s consumers are ready to experiment. With recent launch of its pizza across all Southern states, we believe there is
tremendous earning opportunity if it is able to deliver to the requisite taste of consumer buds.
Exhibit 90: Launching premium products forward integration from milk business
Source: Company, Trust

Hatsun Agro Products Initiating Coverage 13 April 2018
61
Consolidated Financials
Over last decade Hatsun has delivered 19%, 24% and 26% CAGR in revenue, EBITDA and PAT, respectively on the back of integrated operations in Ice cream and other Fresh Milk Product, focus on building its brand and direct procurement from farmers to maintain highest quality standards. We expect Hatsun to deliver 13%, 17% and 30% CAGR growth over FY17-20E in revenue, EBITDA & PAT, respectively.
Exhibit 91: Sales Growth
Source: Company, Trust
Exhibit 92: EBITDA Growth
Source: Company, Trust
Exhibit 93: PAT Performance
Source: Company, Trust
Exhibit 94: Trend Of Operating Cash Flows
Source: Company, Trust
Exhibit 95: ROCE and ROE
Source: Company, Trust
Exhibit 96: Dividend Payout Ratio
Source: Company, Trust
0
5
10
15
20
25
30
35
40
0
10
20
30
40
50
60
70
FY0
8
FY0
9
FY1
0
FY1
1
FY1
2
FY1
3
FY1
4
FY1
5
FY1
6
FY1
7
FY1
8E
FY1
9E
FY2
0E
Revenue (Rs b) Growth (%)
0
2
4
6
8
10
12
0
1,000
2,000
3,000
4,000
5,000
6,000
7,000
FY0
8
FY0
9
FY1
0
FY1
1
FY1
2
FY1
3
FY1
4
FY1
5
FY1
6
FY1
7
FY1
8E
FY1
9E
FY2
0E
EBITDA (Rs m) Margins (%)
-200
-100
0
100
200
300
400
500
600
700
0
500
1,000
1,500
2,000
2,500
3,000
3,500
FY0
8
FY0
9
FY1
0
FY1
1
FY1
2
FY1
3
FY1
4
FY1
5
FY1
6
FY1
7
FY1
8E
FY1
9E
FY2
0E
Adj PAT (Rs m) Growth (%)
-1
0
1
2
3
4
5
6
FY0
8
FY0
9
FY1
0
FY1
1
FY1
2
FY1
3
FY1
4
FY1
5
FY1
6
FY1
7
FY1
8E
FY1
9E
FY2
0E
OCF FCF
0
10
20
30
40
50
FY0
8
FY0
9
FY1
0
FY1
1
FY1
2
FY1
3
FY1
4
FY1
5
FY1
6
FY1
7
FY1
8E
FY1
9E
FY2
0E
RoE RoCE
0
50
100
150
200
250
300
FY0
8
FY0
9
FY1
0
FY1
1
FY1
2
FY1
3
FY1
4
FY1
5
FY1
6
FY1
7
FY1
8E
FY1
9E
FY2
0E
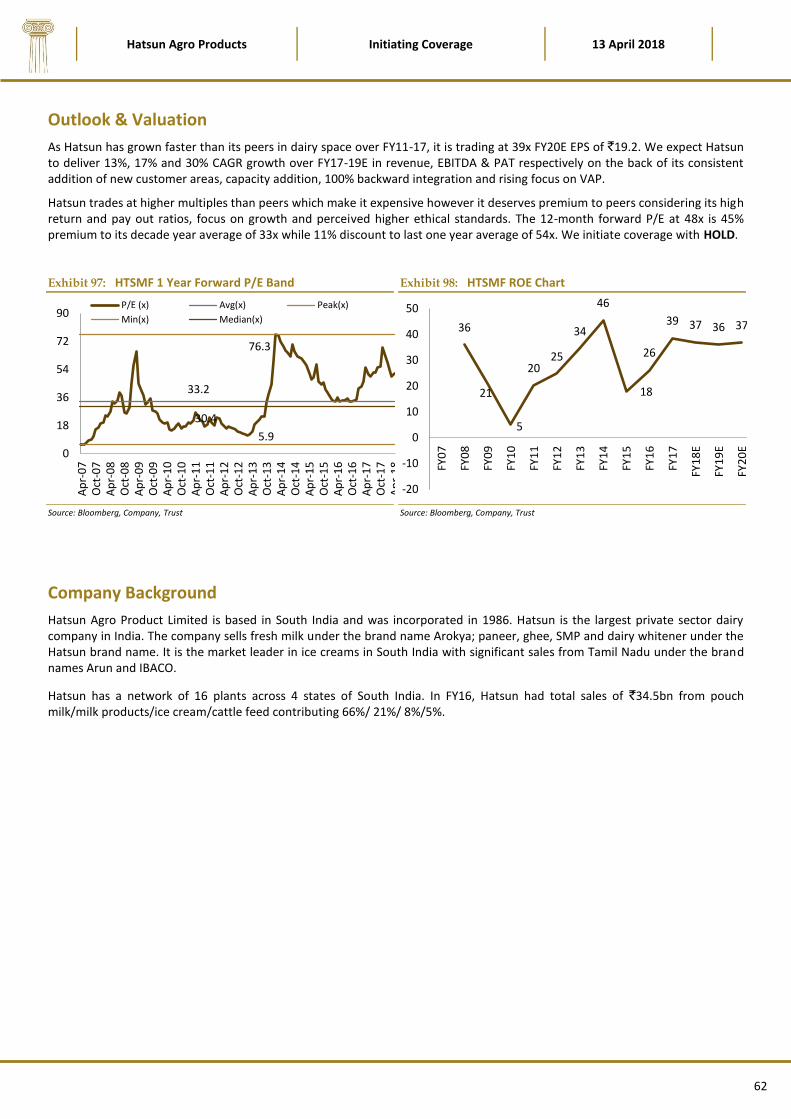
Hatsun Agro Products Initiating Coverage 13 April 2018
62
Outlook & Valuation
As Hatsun has grown faster than its peers in dairy space over FY11-17, it is trading at 39x FY20E EPS of `19.2. We expect Hatsun to deliver 13%, 17% and 30% CAGR growth over FY17-19E in revenue, EBITDA & PAT respectively on the back of its consistent addition of new customer areas, capacity addition, 100% backward integration and rising focus on VAP.
Hatsun trades at higher multiples than peers which make it expensive however it deserves premium to peers considering its high return and pay out ratios, focus on growth and perceived higher ethical standards. The 12-month forward P/E at 48x is 45% premium to its decade year average of 33x while 11% discount to last one year average of 54x. We initiate coverage with HOLD.
Exhibit 97: HTSMF 1 Year Forward P/E Band
Source: Bloomberg, Company, Trust
Exhibit 98: HTSMF ROE Chart
Source: Bloomberg, Company, Trust
Company Background
Hatsun Agro Product Limited is based in South India and was incorporated in 1986. Hatsun is the largest private sector dairy company in India. The company sells fresh milk under the brand name Arokya; paneer, ghee, SMP and dairy whitener under the Hatsun brand name. It is the market leader in ice creams in South India with significant sales from Tamil Nadu under the brand names Arun and IBACO.
Hatsun has a network of 16 plants across 4 states of South India. In FY16, Hatsun had total sales of `34.5bn from pouch milk/milk products/ice cream/cattle feed contributing 66%/ 21%/ 8%/5%.
33.2
76.3
5.9
30.4
0
18
36
54
72
90
Ap
r-0
7O
ct-0
7A
pr-
08
Oct
-08
Ap
r-0
9O
ct-0
9A
pr-
10
Oct
-10
Ap
r-1
1O
ct-1
1A
pr-
12
Oct
-12
Ap
r-1
3O
ct-1
3A
pr-
14
Oct
-14
Ap
r-1
5O
ct-1
5A
pr-
16
Oct
-16
Ap
r-1
7O
ct-1
7A
pr-
18
P/E (x) Avg(x) Peak(x)
Min(x) Median(x)36
21
5
2025
34
46
18
26
39 37 36 37
-20
-10
0
10
20
30
40
50
FY0
7
FY0
8
FY0
9
FY1
0
FY1
1
FY1
2
FY1
3
FY1
4
FY1
5
FY1
6
FY1
7
FY1
8E
FY1
9E
FY2
0E

Hatsun Agro Products Initiating Coverage 13 April 2018
63
Financials – Consolidated
P&L Statement
Balance Sheet
Y/E Mar (` mn) FY16 FY17 FY18E FY19E FY20E
Share Capital 109 152 152 152 152
Total Reserves 2,198 3,319 4,391 5,769 7,774
Net Worth 2,307 3,471 4,543 5,921 7,926
Long Term Borrowings 2,304 3,699 3,674 3,654 3,634
Non Current Liabilities 2,569 4,337 4,312 4,292 4,272
Trade Payables 1,368 1,700 1,903 2,174 2,511
Other Current Liabilities 2,352 3,478 3,478 3,478 3,478
Short Term Borrowings 2,889 3,205 3,401 3,713 4,093
Current Liabilities 6,699 8,418 8,817 9,400 10,117
Total Liabilities 11,575 16,226 17,671 19,613 22,315
Net Fixed Assets 6,472 9,886 8,884 7,835 6,739
Capital WIP 325 903 903 2,403 3,903
Long term loans & advances 85 778 778 778 778
Current Assets 4,682 4,647 7,095 8,586 10,883
Inventory 3,468 2,965 5,139 6,166 7,477
Account Receivables 149 410 236 288 356
Cash and Bank Balance 294 553 1,001 1,413 2,331
Short term loan & advances 735 692 692 692 692
Total Assets 11,575 16,226 17,671 19,613 22,315
Y/E Mar (`mn) FY16 FY17 FY18E FY19E FY20E
Net Sales 34,447 41,997 46,306 52,908 61,108
Change (%) 17.4 21.9 10.3 14.3 15.5
Raw Materials 24,889 30,490 32,970 37,670 43,081
Gross Profit 9,558 11,507 13,336 15,237 18,027
Operating Expenses 6511 7712 9016 10272 12008
EBITDA 3,047 3,795 4,320 4,965 6,019
Change (%) 53.6 24.5 13.8 14.9 21.2
Margin (%) 8.8 9.0 9.3 9.4 9.8
Depreciation 1,071 1,456 1,503 1,549 1,596
Int. and Fin. Charges 683 702 778 810 850
Other Income 46 56 62 68 75
Profit before Taxes 1,340 1,693 2,101 2,674 3,648
Tax 451 361 420 535 730
Tax Rate (%) 54.8 20.9 20.0 20.0 20.0
Adjusted PAT 605 1,340 1,681 2,139 2,918
Change (%) 54.5 121.4 25.5 27.3 36.4
Margin (%) 1.8 3.2 3.6 4.0 4.8
Exceptional/Prior Period inc 0 0 0 0 0
Reported PAT 605 1,340 1,681 2,139 2,918

Hatsun Agro Products Initiating Coverage 13 April 2018
64
Cash Flow
Cash Flow Statement (` mn) FY16 FY17 FY18E FY19E FY20E
PBT before EO items 1,340 1,693 2,101 2,674 3,648
Add : Depreciation 1,047 1,824 1,503 1,549 1,596
Interest 683 702 778 810 850
Less : Direct taxes paid 735 353 420 535 730
(Inc)/Dec in WC 238 -1,007 1,798 807 1,043
CF from Operations 2,097 4,873 2,164 3,691 4,321
Extraordinary 0 0 0 0 0
CF from Op after extra 2,097 4,873 2,164 3,691 4,321
(Incr)/Decr in FA 1,312 5,448 500 2,000 2,000
(Pur)/Sale of Investments -5 0 0 0 0
CF from Invest. -1,984 -6,151 -1,278 -2,810 -2,850
Inc/(Dec) in equity -56 281 0 0 0
Inc/(Dec) in debt 459 1,712 171 292 359
Dividend paid 457 457 609 761 913
CF from fin. activity -54 1,537 -438 -469 -554
Incr/Decr of Cash 59 259 448 412 918
Add: Opening Balance 236 294 553 1,001 1,413
Closing Balance 294 553 1,001 1,413 2,331
Key Ratios
Y/E Mar (%) FY16 FY17 FY18E FY19E FY20E
Raw Material Cost/Sales 72.3 72.6 71.2 71.2 70.5
Manpower Cost/Sales 3.2 3.0 3.1 3.1 3.1
Operating & Other Cost/Sales 15.7 15.3 16.4 16.3 16.6
Revenue Growth 17.4 21.9 10.3 14.3 15.5
EBITDA Margins 8.8 9.0 9.3 9.4 9.8
Net Income Margins 1.8 3.2 3.6 4.0 4.8
ROCE 40.5 30.0 31.8 33.4 36.3
ROE 26.2 38.6 37.0 36.1 36.8
Valuation Parameters
Y/E Mar FY16 FY17 FY18E FY19E FY20E
EPS (`) 4.0 8.8 11.0 14.1 19.2
P/E (x) 186.1 84.1 67.0 52.6 38.6
BV (`) 15.2 22.8 29.9 38.9 52.1
P/BV (x) 48.8 32.4 24.8 19.0 14.2
EV/EBITDA (x) 38.6 31.3 27.5 23.9 19.6
Fixed assets turnover ratio (x) 5.3 4.2 5.2 6.8 9.1
Net Debt/Equity (x) 1.0 1.1 0.8 0.6 0.5
EV/Sales (x) 3.4 2.8 2.6 2.2 1.9
Prabhat Dairy
Initiating Coverage
“Biggest beneficiary of falling raw milk prices”
Prabhat Dairies (PDL) has evolved itself from a specialty dairy ingredients company to an
emerging brand in milk and premium dairy products. PDL sells products under its own retail
consumer brands as well as ingredient products and also as co-manufactured products to a
number of institutional and MNCs. With rising focus on B2C business and branding we
believe PDL is set to grow faster than its peers as it has best locational advantage.
Beneficiary of robust milk procurement system aided by fragmented cooperatives
Prabhat Dairy (PDL) sources ~65-70% of its milk requirements directly from farmers in
Maharashtra; which gives it a distinct advantage over peers as raw milk procurement prices in
Maharashtra are lower than other states due to stiff competition amongst cooperative and
state federation dairies. Maharashtra district milk unions, state cooperatives, and the state
government dairies compete amongst themselves for market share unlike single brand Amul
of GCMMF and lose out on economies of scale. PDL procures its milk requirement directly
from the farmers in order to maintain the high quality of milk and led by consistent fat
content. PDL has highest operating margin amongst the companies under our coverage.
Aggressive product launches focusing on B2C segment
PDL has evolved itself from an integrated specialty ingredients manufacturer for dairy
products like Sweetened condensed milk and SMP to a promising B2C player catering to rich
urban consumption areas like Mumbai and Pune. PDL enjoys key advantage of being in close
proximity to institutional customers as well as retail consumers. Over FY12-17, B2B business
grew at robust 18% CAGR while retail business grew whopping 51% over same period. To
leverage its strategic locations, PDL aggressively invested into VAP facilities and launched
products in the last two years. Over the last five years revenue contribution from B2C segment
has become 30% which management targets to reach 50% by FY20.
Building PAN India distribution network for long shelf life premium products
PDL commissioned its cheese manufacturing facility with a capacity of 30mtpd in September
2015 and initially focused selling cheese to HORECA and B2B segments in Maharashtra and
Gujarat. As the capacity utilization of cheese plant gradually increases, it will have a positive
impact on company’s overall gross margin. PDL plans to firm up its presence in various
Northern, Eastern, Western and Central Indian markets, by focusing on Tier II and Tier III
towns with higher disposable incomes by end FY18. It has planned to launch a range of VAP in
Delhi, Punjab, Himachal Pradesh, Assam and further strengthen its presence in Madhya
Pradesh and Maharashtra. PDL’s fresh milk products like Curd, Shrikhand, Meethi Lassi, Butter
Milk, Masala Chaas, Paneer etc. are now creating space in the shelves of India’s biggest
modern retail chains. It has reached to 289 modern trade outlets in India. In general trade, it
has 6 depots across India and 1375 distributors. It plans to double the general retail reach
from 100,000 to 200,000 stores in coming two years. It also exports to Bhutan and plans to
commence exports to the SAARC countries.
Valuation & Recommendation
Over FY12-17 PDL has delivered 24%, 21% and 24% CAGR in revenue, EBITDA and PAT,
respectively on the back of strategic locations of its processing plants, relationships with MNCs
and operational efficiencies. With rising focus on own brands, geographical expansion in
product reach and rising direct procurement pie we expect PDL to continue delivering superior
earnings growth. We expect PDL to deliver 14%, 21% and 45% CAGR growth over FY17-20E in
revenue, EBITDA & PAT, respectively aided by higher capacity utilization of VAP.
PDL trades at 20xFY20E EPS of `8.8 which is attractive considering its track record of superior
earnings growth. We initiate coverage with BUY.
Market statistics
Current stock price (`) 178
Shares O/S (cr.) 9.8
Mcap (` cr) 1,743
52W H/L (`) 258/93
6m avg. volume 3,71,458
Bloomberg PRABHAT in
Shareholding pattern
Promoters 50.1
Domestic Institution 5.14
Foreign Institution 7.55
Non-institution 37.21
of which more than 1%
PRABHAT vs Nifty
Capital efficiency & valuations
Particulars FY18 FY19E FY20E
RoE (%) 6.0 7.7 9.9
RoCE (%) 12.8 15.0 17.9
P/B (x) 2.4 2.2 2.0
EV/OCF (x) 36.8 25.7 22.0
EV/EBITDA (x) 13.3 11.1 9.0
P/E (x) 40.6 29.1 20.5
Analyst
Tushar Chaudhari
+91-22 4224 5119
Sector: Dairy
CMP: ` 178
Recommendation: BUY
80
130
180
230
Apr-17 Aug-17 Dec-17 Apr-18
Prabhat Nifty

Prabhat Dairy Initiating Coverage 13 April 2018
66
Investment Thesis
Beneficiary of robust milk procurement system aided by fragmented cooperatives in Maharashtra Prabhat Dairy (PDL) sources ~65% of its milk requirements directly from farmers in Maharashtra; which gives it a distinct advantage over peers as raw milk procurement prices in Maharashtra are lower than other states due to stiff competition amongst cooperative and state federation dairies. Maharashtra district milk unions, state cooperatives, and the state government dairies compete amongst themselves for market share unlike single brand Amul of GCMMF and lose out on economies of scale. PDL procures its milk requirement directly from the farmers in order to maintain the high quality of milk and led by consistent fat content. PDL has highest operating margin amongst the companies under our coverage.
PDL secures ~65-70% direct sourcing from 1,200 villages twice a day involving more than 1lac farmers. Procurement happens from Ahmednagar, Pune, Nashik and adjoining districts in Maharashtra; which is 4
th largest cow milk producing state in India.
The collected raw milk is tested through specialized automated machines and then transported to production facilities at Shrirampur and Navi Mumbai. PDL has invested in 475 milk collection centres, 150 bulk milk coolers and 20 milk chilling plants to ensure minimum wastage of raw milk. PDL has a total milk processing capacity of 1.5mlpd and procures around 1mlpd from farmers and registered vendors.
Exhibit 99: Integrated operations leading to efficient cost structure and high quality products
Source: Company, Trust
Farmer friendly initiatives ensure access to high quality milk Various initiatives taken by PDL over the years such as a) “Prabhat Mitras” – Coordinate milk procurement and help farmers on cattle health, cattle finance and insurance; b) “Pashu Mitras” – PDL partnered veterinary doctors / para-veterinary workers helping on cattle medication, deworming, vaccination etc. have helped farmers to maintain their cattle healthy and safe at affordable cost; in return guarantee of quality supply to PDL. Being a private player PDL has also maintained transparent pricing to farmers who get the best price; compared to state cooperatives. Farmers also receive detailed receipt mentioning quality (Fat & Non-Fat content), quantity and price. These farmer friendly initiatives have given PDL credit relative to state cooperatives where timely payment can be an issue.
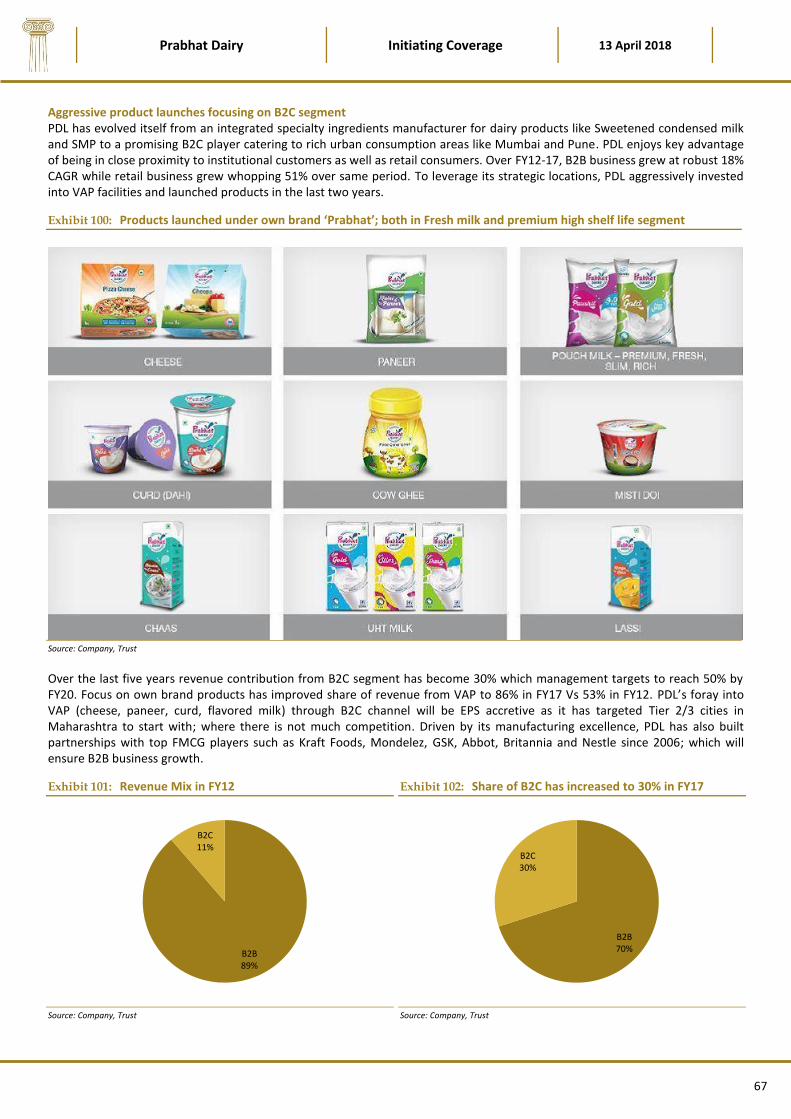
Prabhat Dairy Initiating Coverage 13 April 2018
67
Aggressive product launches focusing on B2C segment PDL has evolved itself from an integrated specialty ingredients manufacturer for dairy products like Sweetened condensed milk and SMP to a promising B2C player catering to rich urban consumption areas like Mumbai and Pune. PDL enjoys key advantage of being in close proximity to institutional customers as well as retail consumers. Over FY12-17, B2B business grew at robust 18% CAGR while retail business grew whopping 51% over same period. To leverage its strategic locations, PDL aggressively invested into VAP facilities and launched products in the last two years.
Exhibit 100: Products launched under own brand ‘Prabhat’; both in Fresh milk and premium high shelf life segment
Source: Company, Trust
Over the last five years revenue contribution from B2C segment has become 30% which management targets to reach 50% by FY20. Focus on own brand products has improved share of revenue from VAP to 86% in FY17 Vs 53% in FY12. PDL’s foray into VAP (cheese, paneer, curd, flavored milk) through B2C channel will be EPS accretive as it has targeted Tier 2/3 cities in Maharashtra to start with; where there is not much competition. Driven by its manufacturing excellence, PDL has also built partnerships with top FMCG players such as Kraft Foods, Mondelez, GSK, Abbot, Britannia and Nestle since 2006; which will ensure B2B business growth.
Exhibit 101: Revenue Mix in FY12
Source: Company, Trust
Exhibit 102: Share of B2C has increased to 30% in FY17
Source: Company, Trust
B2B89%
B2C11%
B2B70%
B2C30%
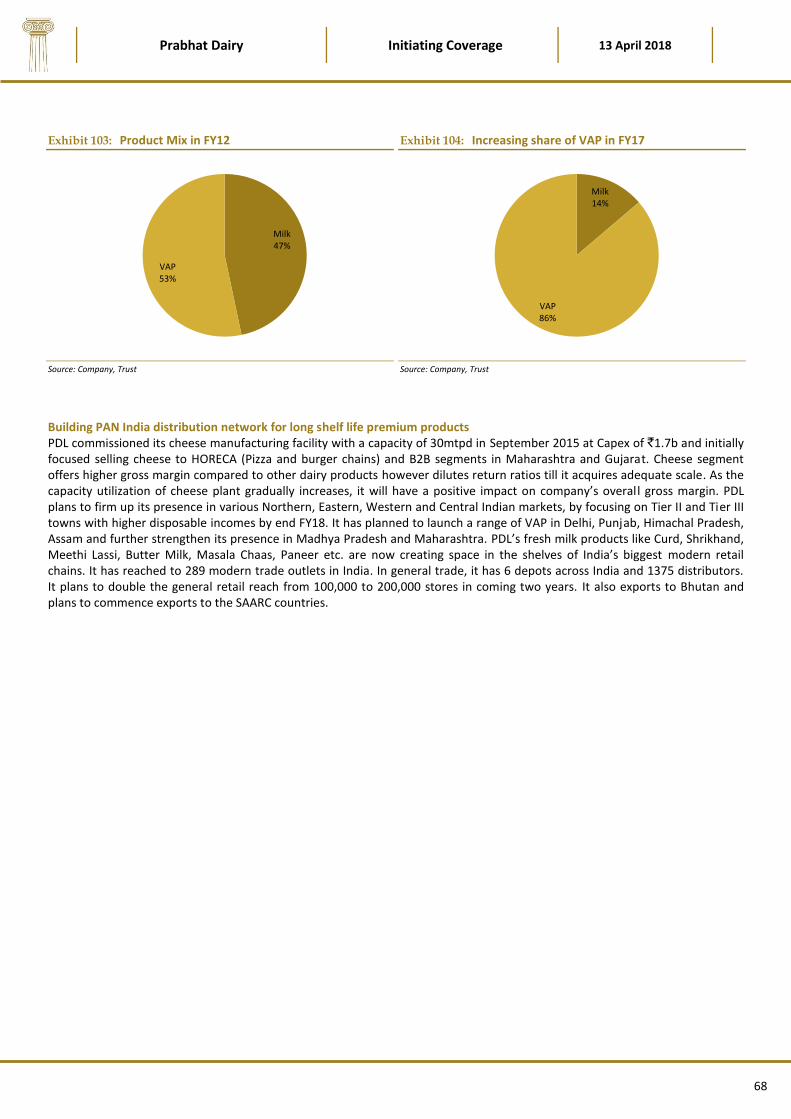
Prabhat Dairy Initiating Coverage 13 April 2018
68
Exhibit 103: Product Mix in FY12
Source: Company, Trust
Exhibit 104: Increasing share of VAP in FY17
Source: Company, Trust
Building PAN India distribution network for long shelf life premium products PDL commissioned its cheese manufacturing facility with a capacity of 30mtpd in September 2015 at Capex of `1.7b and initially focused selling cheese to HORECA (Pizza and burger chains) and B2B segments in Maharashtra and Gujarat. Cheese segment offers higher gross margin compared to other dairy products however dilutes return ratios till it acquires adequate scale. As the capacity utilization of cheese plant gradually increases, it will have a positive impact on company’s overal l gross margin. PDL plans to firm up its presence in various Northern, Eastern, Western and Central Indian markets, by focusing on Tier II and Tier III towns with higher disposable incomes by end FY18. It has planned to launch a range of VAP in Delhi, Punjab, Himachal Pradesh, Assam and further strengthen its presence in Madhya Pradesh and Maharashtra. PDL’s fresh milk products like Curd, Shrikhand, Meethi Lassi, Butter Milk, Masala Chaas, Paneer etc. are now creating space in the shelves of India’s biggest modern retail chains. It has reached to 289 modern trade outlets in India. In general trade, it has 6 depots across India and 1375 distributors. It plans to double the general retail reach from 100,000 to 200,000 stores in coming two years. It also exports to Bhutan and plans to commence exports to the SAARC countries.
Milk47%
VAP53%
Milk14%
VAP86%

Prabhat Dairy Initiating Coverage 13 April 2018
69
Consolidated Financials
Over FY12-17 PDL has delivered 24%, 21% and 24% CAGR in revenue, EBITDA and PAT, respectively on the back of strategic locations of its processing plants, relationships with MNCs and operational efficiencies. With rising focus on own brands, geographical expansion in product reach and rising direct procurement pie we expect PDL to continue delivering superior earnings growth. We expect PDL to deliver 14%, 21% and 45% CAGR growth over FY17-20E in revenue, EBITDA & PAT, respectively aided by higher capacity utilization of VAP.
Exhibit 105: Sales Growth
Source: Company, Trust
Exhibit 106: EBITDA Growth
Source: Company, Trust
Exhibit 107: PAT Performance
Source: Company, Trust
Exhibit 108: Trend Of Operating Cash Flows (` m)
Source: Company, Trust
Exhibit 109: ROCE and ROE
Source: Company, Trust
Exhibit 110: Dividend Payout Ratio (%)
Source: Company, Trust
0
5
10
15
20
25
30
35
40
0
5
10
15
20
25
FY1
2
FY1
3
FY1
4
FY1
5
FY1
6
FY1
7
FY1
8E
FY1
9E
FY2
0E
Revenue (Rs b) Growth (%)
0
2
4
6
8
10
12
0
500
1,000
1,500
2,000
2,500
FY1
2
FY1
3
FY1
4
FY1
5
FY1
6
FY1
7
FY1
8E
FY1
9E
FY2
0E
EBITDA (Rs m) Margins (%)
-20
-10
0
10
20
30
40
50
60
0
200
400
600
800
1,000
FY1
2
FY1
3
FY1
4
FY1
5
FY1
6
FY1
7
FY1
8E
FY1
9E
FY2
0E
Adj PAT (Rs m) Growth (%)
-1,000
0
1,000
2,000
3,000
4,000
FY1
2
FY1
3
FY1
4
FY1
5
FY1
6
FY1
7
FY1
8E
FY1
9E
FY2
0E
OCF FCF
0
5
10
15
20
FY1
2
FY1
3
FY1
4
FY1
5
FY1
6
FY1
7
FY1
8E
FY1
9E
FY2
0E
RoE RoCE
0
2
4
6
8
10
12
14
16
FY1
2
FY1
3
FY1
4
FY1
5
FY1
6
FY1
7
FY1
8E
FY1
9E
FY2
0E
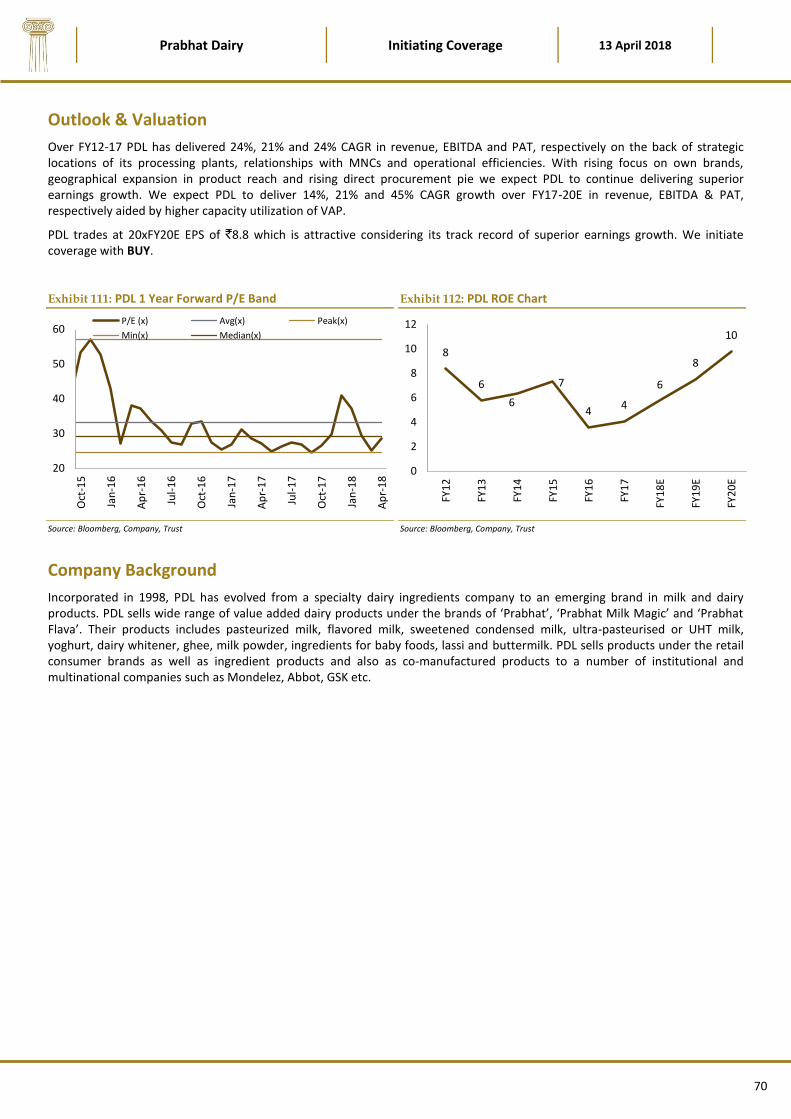
Prabhat Dairy Initiating Coverage 13 April 2018
70
Outlook & Valuation
Over FY12-17 PDL has delivered 24%, 21% and 24% CAGR in revenue, EBITDA and PAT, respectively on the back of strategic locations of its processing plants, relationships with MNCs and operational efficiencies. With rising focus on own brands, geographical expansion in product reach and rising direct procurement pie we expect PDL to continue delivering superior earnings growth. We expect PDL to deliver 14%, 21% and 45% CAGR growth over FY17-20E in revenue, EBITDA & PAT, respectively aided by higher capacity utilization of VAP.
PDL trades at 20xFY20E EPS of `8.8 which is attractive considering its track record of superior earnings growth. We initiate coverage with BUY.
Exhibit 111: PDL 1 Year Forward P/E Band
Source: Bloomberg, Company, Trust
Exhibit 112: PDL ROE Chart
Source: Bloomberg, Company, Trust
Company Background
Incorporated in 1998, PDL has evolved from a specialty dairy ingredients company to an emerging brand in milk and dairy products. PDL sells wide range of value added dairy products under the brands of ‘Prabhat’, ‘Prabhat Milk Magic’ and ‘Prabhat Flava’. Their products includes pasteurized milk, flavored milk, sweetened condensed milk, ultra-pasteurised or UHT milk, yoghurt, dairy whitener, ghee, milk powder, ingredients for baby foods, lassi and buttermilk. PDL sells products under the retail consumer brands as well as ingredient products and also as co-manufactured products to a number of institutional and multinational companies such as Mondelez, Abbot, GSK etc.
20
30
40
50
60
Oct
-15
Jan
-16
Ap
r-1
6
Jul-
16
Oct
-16
Jan
-17
Ap
r-1
7
Jul-
17
Oct
-17
Jan
-18
Ap
r-1
8
P/E (x) Avg(x) Peak(x)
Min(x) Median(x)
8
6
6
7
44
6
8
10
0
2
4
6
8
10
12
FY1
2
FY1
3
FY1
4
FY1
5
FY1
6
FY1
7
FY1
8E
FY1
9E
FY2
0E

Prabhat Dairy Initiating Coverage 13 April 2018
71
Financials – Consolidated
P&L Statement
Balance Sheet
Y/E Mar (` mn) FY16 FY17 FY18E FY19E FY20E
Share Capital 977 977 977 977 977
Total Reserves 5,480 5,905 6,300 6,865 7,665
Net Worth 6,456 6,882 7,277 7,842 8,641
Long Term Borrowings 384 386 386 386 386
Deferred Tax Liability 57 159 159 159 159
Non Current Liabilities 456 559 545 545 545
Trade Payables 521 538 636 738 863
Short Term Borrowings 1,193 3,193 3,285 3,341 3,408
Current Liabilities 1,871 4,045 4,236 4,394 4,585
Total Liabilities 8,784 11,486 12,057 12,780 13,771
Net Fixed Assets 4,132 4,150 4,106 4,022 3,896
Capital WIP 245 265 315 365 415
Long term loans & advances 321 332 332 332 332
Current Assets 4,082 6,706 7,303 8,061 9,128
Inventory 879 1,333 1,697 1,988 2,346
Account Receivables 2,263 2,711 3,187 3,733 4,406
Cash and Bank Balance 120 1,656 1,413 1,333 1,370
Short term loan & advances 813 996 996 996 996
Total Assets 8,784 11,486 12,057 12,780 13,771
Y/E Mar (`mn) FY16 FY17 FY18E FY19E FY20E
Net Sales 11,677 14,099 15,488 17,964 20,990
Change (%) 16.4 20.7 9.9 16.0 16.8
Raw Materials 9,284 11,359 12,297 14,192 16,456
Gross Profit 2,393 2,740 3,190 3,773 4,534
Operating Expenses 1241 1472 1697 1979 2315
EBITDA 1,152 1,268 1,493 1,793 2,219
Change (%) 11.3 10.1 17.8 20.1 23.7
Margin (%) 9.9 9.0 9.6 10.0 10.6
Depreciation 396 432 494 535 576
Int. and Fin. Charges 405 294 367 373 379
Other Income 15 13 14 16 17
Profit before Taxes 366 555 647 902 1,281
Tax 135 274 213 298 423
Tax Rate (%) 36.9 49.4 33.0 33.0 33.0
Adjusted PAT 231 281 433 604 858
Change (%) -10.8 21.6 54.2 39.4 42.1
Margin (%) 2.0 2.0 2.8 3.4 4.1
Exceptional/Prior Period inc 0 189 0 0 0
Reported PAT 231 470 433 604 858

Prabhat Dairy Initiating Coverage 13 April 2018
72
Cash Flow
Cash Flow Statement (` mn) FY16 FY17 FY18E FY19E FY20E
PBT before EO items 366 555 647 902 1,281
Add : Depreciation 276 534 494 535 576
Interest 405 294 367 373 379
Less : Direct taxes paid 135 274 213 298 423
(Inc)/Dec in WC 1,039 925 755 736 906
CF from Operations -128 184 539 776 907
CF from Op after extra -128 373 539 776 907
(Incr)/Decr in FA 124 471 500 500 500
(Pur)/Sale of Investments -89 29 -32 0 0
Others -405 -294 -367 -373 -379
CF from Invest. -439 -793 -835 -873 -879
Inc/(Dec) in equity 2,709 -5 0 0 0
Inc/(Dec) in debt -2,238 2,001 92 57 67
Dividend paid 0 39 39 39 59
CF from fin. activity 471 1,956 53 18 8
Incr/Decr of Cash -96 1,536 -243 -79 36
Add: Opening Balance 215 120 1,656 1,413 1,333
Closing Balance 120 1,656 1,413 1,333 1,370
Key Ratios
Y/E Mar (%) FY16 FY17 FY18E FY19E FY20E
Raw Material Cost/Sales 79.5 80.6 79.4 79.0 78.4
Manpower Cost/Sales 2.4 2.5 2.8 3.0 3.2
Operating & Other Cost/Sales 8.2 8.0 8.2 8.0 7.8
Revenue Growth 16.4 20.7 9.9 16.0 16.8
EBITDA Margins 9.9 9.0 9.6 10.0 10.6
Net Income Margins 2.0 2.0 2.8 3.4 4.1
ROCE 10.9 11.2 12.8 15.0 17.9
ROE 3.6 4.1 6.0 7.7 9.9
Valuation Parameters
Y/E Mar FY16 FY17 FY18E FY19E FY20E
EPS (`) 2.4 2.9 4.4 6.2 8.8
P/E (x) 74.8 61.5 39.9 28.6 20.1
BV (`) 66.1 70.5 74.5 80.3 88.5
P/BV (x) 2.7 2.5 2.4 2.2 2.0
EV/EBITDA (x) 16.3 15.1 13.1 11.0 8.9
Fixed assets turnover ratio (x) 2.8 3.4 3.8 4.5 5.4
Net Debt/Equity (x) 0.1 0.1 0.1 0.0 0.0
EV/Sales (x) 1.6 1.4 1.3 1.1 0.9

Prabhat Dairy Initiating Coverage 13 April 2018
73
Institutional Equity Team
Names Designation Sectors Email ID's Desk-Number
Naren Shah Head Of Equity
[email protected] +91-22-4084-5074
Sales Trading & Dealing
Rajesh Ashar Sales Trader
[email protected] +91-22-4224-5123
Dealing Desk
[email protected] +91-22-4084-5089
Sales
Vijay Shah Sales [email protected] +91-22-4084-5090
Mayur Joshi Sales [email protected] +91-22-4084-5028
Research Team
Binyam Taddese Analyst Rates & Credit Research [email protected] +91-22-4224-5037
Naushil Shah Analyst Technology, Media & Telecom [email protected] +91-22-4224-5125
Tushar Chaudhari Analyst Commodities, Consumer & Mid-caps [email protected] +91-22-4224-5119
Prabhat Dairy Initiating Coverage 13 April 2018
74
DISCLAIMER
This document has been prepared by Trust Financial Consultancy Services Private Limited (hereinafter referred to as TFCSPL) to provide information about the company (ies)
and/sector(s), if any, covered in the report. This report is for personal information of the selected recipient/s and does not construe to be any investment, legal or taxation advice to
you. This research report does not constitute an offer, invitation or inducement to invest in securities or other investments and TFCSPL is not soliciting any action based upon it. This
report is not for public distribution and has been furnished to you solely for your general information and should not be reproduced or redistributed to any other person in any form.
This report does not constitute a personal recommendation or take into account the particular investment objectives, financial situations, or needs of individual clients. Before acting
on any advice or recommendation in this material, investors should consider whether it is suitable for their particular circumstances and, if necessary, seek professional advice.
Information and opinions presented in this report were obtained or derived from sources that TFCSPL believes to be reliable, but TFCSPL makes no representations or warranty,
express or implied, as to their accuracy or completeness or correctness. TFCSPL accepts no liability for loss arising from the use of the material presented in this report, except that this
exclusion of liability does not apply to the extent that liability arises under specific statutes or regulations applicable to TFCSPL. Information, opinions and estimates contained in this
report reflect a judgment of its original date of publication by TFCSPL and are subject to change without notice. Past performance should not be taken as an indication or guarantee of
future performance, and no representation or warranty, express or implied, is made regarding future performance.
Other Disclosures by Trust Financial Consultancy Services Private Limited (hereinafter referred to as TFCSPL) under SEBI (Research Analysts) Regulations, 2014 with reference to the
subject companies(s) covered in this report:
TFCSPL is engaged in the business of Retail & Institutional Stock Broking. TFCSPL is a member of the National Stock Exchange of India Limited, BSE Limited and Metropolitan Stock
Exchange of India Limited.
The associate/subsidiary companies of TFCSPL are engaged in the businesses of Merchant Banking, portfolio management, lending, wealth management etc.
TFCSPL’s activities were neither suspended nor has it defaulted with any stock exchange authority with whom it has been registered in the last five years.
TFCSPL has not been debarred from doing business by any Stock Exchange / SEBI or any other authority.
No disciplinary action has been taken by any regulatory authority against TFCSPL impacting its equity research analysis activities.
TFCSPL and it’s associate/subsidiary companies may have managed or co-managed public offering of securities, may have received compensation for merchant banking or brokerage
services, may have received any compensation for products or services other than merchant banking or brokerage services from the subject company in the past 12 months.
TFCSPL and it’s associate/subsidiary companies have not received any compensation or other benefits from the subject company or third party in connection with the research report.
Subject Company may have been a client of TFCSPL or its associate/subsidiary companies during twelve months preceding the date of distribution of the research report. TFCSPL
and/or its associate/subsidiary companies and/or employees may have interests/positions, financial or otherwise of over 1 % at the end of the month immediately preceding the date
of publication of the research in the securities mentioned in this report.
TFCSPL is registered as a Research Analyst under SEBI (Research Analyst) Regulations, 2014. SEBI Reg. No. INH000001543.
Analyst Certification: The views expressed in this research report accurately reflect the personal views of the analyst(s) about the subject company securities or issues, and no part of
the compensation of the research analyst(s) was, is, or will be directly or indirectly related to the specific recommendations and views expressed by research analyst(s) in this report.
The research analysts, strategists, or research associates principally responsible for preparation of TFCSPL research receive compensation based upon various factors, including quality
of research, investor client feedback, stock picking, competitive factors and firm revenues
Disclosure of Interest Statement Name of Company
Analyst Ownership of Stock No
Served as Director or Employee No
Stock Ratings are defined as follows :-Recommendation Interpretation
Recommendation Expected absolute returns (%) over 12 months
Buy More than 15%
Hold 15% to -15%
Sell Less than -15%
Regional Disclosures (outside India): This report is not directed or intended for distribution to or use by any person or entity resident in a state, country or any jurisdiction, where such
distribution, publication, availability or use would be contrary to law, regulation or which would subject TFCSPL or its associate/subsidiaries
Related Documents