Ajmal Abdulsamad Gary Gereffi October 2016 Dairy Value Chains in East Africa

Welcome message from author
This document is posted to help you gain knowledge. Please leave a comment to let me know what you think about it! Share it to your friends and learn new things together.
Transcript

Ajmal Abdulsamad Gary Gereffi October 2016
Dairy Value Chains in East Africa

About the Duke Center on Globalization, Governance & Competitiveness The Center on Globalization, Governance & Competitiveness (CGGC), an affiliate of the Social Science Research Institute at Duke University, is built around the use of the Global Value Chain (GVC) methodology, developed by the Center’s Director, Gary Gereffi. The Center uses GVC analysis to study the effects of globalization on various topics of interest including: industrial upgrading, international competitiveness, the environment, global health, engineering and entrepreneurship, and innovation in the global knowledge economy. More information about CGGC is available at http://www.cggc.duke.edu/ The International Growth Centre sponsored the research for this report. It draws on primary information from field interviews carried out in Rwanda and Uganda in May and June, 2015, as well as secondary information sources. Errors of fact or interpretation remain the exclusive responsibility of the author(s). The opinions expressed or conclusions made in this study are not endorsed by the project sponsor. We welcome comments and suggestions. The lead author may be contacted at [email protected] © October 2016 Center on Globalization, Governance & Competitiveness, Duke University

Table of Contents Acronyms ......................................................................................................................................... i Executive Summary ........................................................................................................................ 1
1. Introduction ............................................................................................................................. 5
1.1. Research Methods ............................................................................................................ 5
1.2. Limitations ....................................................................................................................... 6
1.3. Report Organization ......................................................................................................... 6
2. The Dairy Global Value Chain ................................................................................................ 7
2.1. Milk Production ................................................................................................................ 8
2.2. Milk Processing .............................................................................................................. 10
2.3. Distribution and Markets ................................................................................................ 11
2.3.1 International Trade ......................................................................................................... 13
3. Lead Firm Capabilities and Value Chain Relationships ........................................................ 14
4. Recent Trends in International Dairy Markets ...................................................................... 20
5. The Dairy Industry in East Africa ......................................................................................... 25
5.1. Uganda ........................................................................................................................... 27
5.1.1. Milk production .......................................................................................................... 28
5.1.2. Milk Collection and Trade .......................................................................................... 29
5.1.3. Milk Processing and Distribution ............................................................................... 31
5.2. Rwanda ........................................................................................................................... 34
5.2.1. Milk production .......................................................................................................... 34
5.2.2. Milk Collection and Trade .......................................................................................... 36
5.2.3. Milk Processing and Distribution ............................................................................... 37
6. Recent Developments in Rwanda’s Industry Governance and Regional Integration Initiatives....................................................................................................................................... 39
7. Potential Upgrading Trajectories: Policy and Strategy Recommendations........................... 43
7.1. Summary Upgrading Challenges and Opportunities ...................................................... 43
7.2. Potential Upgrading Trajectories ................................................................................... 44
7.3. Policy and Strategy Recommendations .......................................................................... 45
8. References ............................................................................................................................. 48

List of Boxes Box 1: Examples of Processors’ Investment in the Absence of Organized Retail Networks ....... 18 Box 2: Transformation of Dairy Policies in European Union and the United States ................... 21 Box 3: Brookside Dairy Limited................................................................................................... 40 List of Figures Figure 1: Dairy Global Value Chain ............................................................................................... 7 Figure 2: Global Distribution of Milk Production in Volume, 2013 .............................................. 8 Figure 3: Consolidation of Dairy Farming in the United States, 1987-2012 .................................. 9 Figure 4: Dairy Product Categories, Global Market in 2015 ........................................................ 12 Figure 5: Geographic Distribution of Global Dairy Markets, Volume Shares ............................. 12 Figure 6: International Trade, Dairy Products, 2014 .................................................................... 13 Figure 7: Dairy Firms’ Business-Orientation and the Corresponding Value Chain Capabilities . 15 Figure 8: Timeline of Dairy Policies in the EU (light blue) and the U.S. (light red), 1960s-2015....................................................................................................................................................... 22 Figure 9: Milk Production Trend for Major Exporters, 2000-2015 .............................................. 23 Figure 10: Trend in Monthly Raw Milk Prices in the U.S., 1980-2015 ....................................... 24 Figure 11: Trend in Cattle Stock in Uganda, 2000-2014 .............................................................. 28 Figure 12: Overview of Milk Collection and Trade Channels in Uganda .................................... 30 Figure 13: Uganda's Largest Categories of Consumer Products, 2013 Sale Values and 2013-08 Projections..................................................................................................................................... 33 Figure 14: Overview of Milk Collection and Trade System in Rwanda ...................................... 36 List of Tables Table 1: Dairy Processing Industry: Firm Capabilities for Competitiveness and Export ............... 2 Table 2: Consolidation in EU Dairy Farms, 2006-2013 ............................................................... 10 Table 3: The Ten Largest Global Dairy Firms, Ranked by 2014 Annual Dairy Revenue ........... 11 Table 4: World Top Dairy Exporters: Shares in 2010-13 Average Volumes ............................... 13 Table 5: World’s Top Dairy Importers: Shares in 2010-13 Average Volumes ............................ 14 Table 6: Dairy Markets with the Largest Private Label Penetration, Percent of 2015 Retail Sales....................................................................................................................................................... 19 Table 7: International and Local Brands of Leading Dairy Firms: Scope and Revenue Distribution ................................................................................................................................... 20 Table 8: Total Number of Acquisitions in Dairy Processing Industry, Distributed by Acquirer and Target Regions, 2004-09 (2010-15) ....................................................................................... 25 Table 9: Change in Annual Quantity of Dairy Trade for the EAC Countries .............................. 26 Table 10: Leading Dairy Processors in Uganda ........................................................................... 32 Table 11: 'SWOT' Characterizing Dairy Value Chains in Uganda and Rwanda .......................... 43

Acronyms CAP Common Agricultural Policy CET Common External Tariff DCL Dairy Corporation Limited DDA Dairy Development Authority DPPs Dairy Product Price Support EAC East African Community EADDP East Africa Dairy Development Program EADRAC East African Dairy Regulatory Authorities Council ESADA East and Southern Africa Dairy Association EU European Union FAO Food and Agriculture Organization of the United Nations GVC Global Value Chain GoR Government of Rwanda HACCP Hazard Analysis and Critical Control Point M&A Mergers and Acquisitions MCCs Milk Collection Centers OECD Organization for Economic Cooperation and Development NDFFR National Dairy Farmers’ Federation of Rwanda PSF Private Sector Federation RDCP II Rwanda Dairy Competitiveness Program II RNDP Rwanda National Dairy Platform SNV Netherlands Development Organization SPS Sanitary and Phytosanitary SMP Skimmed Milk Power UNDPA Uganda Dairy Processors’ Association UNDFA Uganda National Dairy Farmers Association UNDATA Uganda National Dairy Traders Association UHT Ultra-Heat Treatment U.S. United States WMP Whole Milk Powder

1
Executive Summary The scope for dairy processing and marketing is predominantly local, with some of the largest dairy firms serving only or almost entirely domestic markets (Euromonitor, 2015). The two important underlying factors leading to this configuration have been highly protected dairy markets as well as the bulky and perishable characteristics of milk. While international trade of dairy products in milk equivalent terms has increased twice as fast as milk production over 2010-13, it still is less than 10% of global milk production (FAOSTAT, 2015). International dairy trade, an estimated US$67.5 billion in 2014, is also limited to processed, mainly dried and/or preserved products, such as: cheese (27%), whole milk powder (WMP) (21%), skimmed milk powder (SMP) (16%), butter (5%), and whey (6%), ranked in terms of export values (UNComtrade, 2015). Although regional dairy trade in East Africa is far lower than the global average and only stands at below 1% of regional milk production, its recent rapid growth is promising. During 2010-13, the annual average quantity of dairy products traded intra-regionally was more than 10 fold the same amount for the 2002-05 period (FAOSTAT, 2015). This astonishing growth was achieved against the background of strengthening capacity in East African Community’s (EAC) trade institutions and policy environment, such as: the EAC’s Single Customs Territory; institution of a Common External Tariff (CET) of 60% applied to dairy imports from outside the region; and remarkable efforts in harmonizing regional standards for dairy products (Bingi & Tondel, 2015). Combined with these efforts on the policy and regulatory fronts, public and private stakeholders have made substantial investments in rehabilitating and/or establishing national cattle stocks, milk collection infrastructure, and processing plants in both Rwanda and Uganda (see Section 5). Despite these positive developments, national dairy value chains in both Rwanda and Uganda still face pervasive capability constraints, particularly of an organizational and “relational” nature, compared to dairy processor firms and value chains from the leading international exporters. A number of “tangible” and “intangible” features characterize dairy firm and value chain capabilities for the leading international exporter countries or regions, which are only a handful, led by New Zealand, the European Union (EU), and the United States (U.S.) (see Sections 2-3). First, high milk productivity of dairy farms that leverage scale efficiencies and have increasingly consolidated over the last 15 years. Second, the leading dairy processor firms, including cooperatives, with competitive capabilities linked to their ‘business-orientations’: (i) process-orientation; (ii) product-orientation; and (iii) market-orientation. These ‘business-orientations’ draw on certain capabilities that vary with the position of firms along the value chain (Section 3, Figure 7). The corresponding capabilities for process-, product-, and market-orientations, respectively, of the leading dairy firms are: (i) a ‘trust-based’ relationship with milk suppliers; (ii) innovation and branding; and (iii) strong ‘distribution networks’ primarily characterized by brand leadership and being a ‘solution provider’ to big downstream customers.

2
These ‘intangible’ capabilities are mostly lacking in EAC dairy value chains although dairy firms in Rwanda and Uganda, led by Inyange Industries and Brookside Dairy Ltd1, respectively, have adequate firm-level resources, or “tangible” capabilities such as: financial resources, large-scale nameplate capacity in owned/operated processing plants as well as capabilities in packaging, certifications and quality control at the plant level (see Section 5). However, dairy processors lack supply chain coordination capability and are generally ‘outcompeted’ by the ‘informal’ market operators in securing milk supplies. Insufficient supply of quality milk leads to plant level operations at far below capacity, a major inefficiency challenge. Whereas the underlying problem is absence of a form of “regulated” transactional relationship, possibly through ‘trust and reputation’ and/or contracts, between dairy processors and milk suppliers, the resulting inefficiencies inflict considerable transaction costs on the entire system. In summary, findings from our analysis of the global and regional dairy value chains identified a range of critical capabilities required to help dairy processors enter and expand their footprint in domestic and export markets. These are summarized in Table 1. Table 1: Dairy Processing Industry: Firm Capabilities for Competitiveness and Export
Capability Trait Internal Resource Value Chain Relation* Competitive Access to Capital √ Scale of Processing Plant √ Strong Scheduling and Management Skills √ Food Safety Certification √ √ Innovation and Product Development (Packaging, Recipes, Cultures, etc.)
√ √
“Trust-based” Transaction Relation Upstream: Quality Milk Supply
√
Strong Distribution Network: “Solution Provider” and/or “Brand Leadership”
√
*Refers to principle value chain segments not supporting industries. Source: Authors Absence of these capabilities is also one of the main challenges facing EAC dairy processors in domestic markets. The resulting outcome is a dual “formal” and “informal” market structure, in which the dairy processing industry remains a marginal player, accounting for 15-20% of total milk marketed (Makoni, Redda, van der Lee, Mwai, & van der Zijpp, 2014). In contrast, a large number of independent and predominantly small entrepreneurs—loosely connected through local or national networks of traders, transporters, wholesalers, and retailers—control at least 80% of dairy markets in Uganda and Rwanda (Makoni et al., 2014). These small actors, often classified as the “informal” market operators, largely due to their lack of business registration, but also dispossession of capacity in milk pasteurization, directly supply ‘raw’ or ‘boiled’ milk to a range of customers in urban areas. This market condition challenges dairy processors to expand their market footprint. Although Inyange Industries have recently invested in an innovative distribution network, called “milk zones,” the current market configuration is likely to continue in the short- to medium-terms.
1 In 2015, Brookside Dairy Ltd acquired Sameer Agriculture & Livestock Ltd. (SALL), the leading dairy firm in Uganda.

3
As outlined in Section 7 of the report, the way forward for dairy value chains in Rwanda and Uganda is contingent upon addressing the gap in ‘intangible’ capabilities. The following are policy and strategy recommendations targeted at addressing these constraints and aimed at upgrading dairy industry in the region, concentrating in Uganda and Rwanda: x Pursue joint regional investment promotion strategies to expand regional capabilities in
manufacturing of exportable dairy products. Participation in export markets predominantly depends on a competitive dairy processing industry to convert milk into exportable dairy products – mainly preserved or dried products. Recent dynamics in the U.S. and EU dairy markets offer opportunities to attract further investment from the leading global dairy firms to the region. The EAC countries, however, can strengthen their negotiation position in dealing with these large global firms if they follow a regional investment strategy and negotiate investment deals as a ‘regional block.’ Under certain conditions, which largely depend on the bargaining position of the EAC countries, foreign investments could provide very effective vehicles to develop dairy processing capabilities in the region. These could be targeting foreign investment to fill capability gaps in specific areas related to innovation and product development, distribution and marketing, and backward linkages to strengthen milk-dairy supply chains in the EAC countries
x Improve governance in trade relationships between processing and dairy farm segments in
the chain. This intervention should focus on strengthening the capability of dairy cooperatives to better ‘negotiate’ long-term supply relationships with dairy processors. Milk suppliers and processors need to collaboratively work together in managing seasonal boom-bust cycles in milk supply and prices, and establish mechanisms to minimize risks of opportunistic behavior. Casaburi and Macchiavello (2015) illustrated that ‘trustworthiness’ can better position dairy processors to secure sufficient supply of quality milk even at lower prices than competitors provided that they focus on building farmer capabilities, in this case, addressing saving constraints of farmers in Kenya.
x Train and license milk collectors to improve quality of milk supplied to processors. As the
recent experience from harmonization of regional standards illustrated, regulatory measures and policy directives on their own, although necessary tools, are insufficient to promote compliance with quality standards. A sustainable solution demands simultaneous capability enhancement of value chain operators and reforming the current organization of milk collection and trade. This requires intervening on several fronts involving regulatory agencies, dairy processors, and milk collectors or their representative associations. The strategic goal should be to: (i) build capacity of milk collectors and traders; (ii) license milk collection so local traders can operate at a scale that justifies investment in equipment and skills needed for adherence to quality standards; and (iii) implement quality-based pricing to provide market incentives needed to change behavior of milk collectors.
x Transform regional dairy markets by improving opportunities for collaboration between
public and private sector actors related to the dairy industry, and between them and the international development programs. Transforming the sizeable ‘informal’ dairy markets to ‘formal’ markets strongly depends on a coordinated and inclusive approach in the EAC

4
countries. In general, limited availability of statistics and market information in Uganda and Rwanda, like many other developing countries, complicates proper planning and evaluation of alternative policy and investment decisions. Although this is a big challenge, the situation is exacerbated by a lack of coordinated approach that can strategically bring together stakeholders from the public, private, and international development agencies. Establishment of Rwanda National Dairy Platform (RNDP) in Rwanda is a major step in the right direction. Alliances, such as RNDP, provide the opportunity to create a shared vision and follow a coordinated long-term intervention strategy for market upgrading. Although it is still in its early stages of development, RNDP could potentially develop into a strong mechanism to coordinate policy action, private investment, and financial allocations by donor programs, still an important source of fund for the dairy industry in the region.
x There is a need for further research in determining potential for regional trade in dairy-
related ‘supporting’ industries. While this report focused on assessing ‘principle’ segments of the regional dairy value chain, the rising milk production and consumption in the region has obviously helped grow opportunities for regional trade in supporting industries. As outlined in Section 2, a range of supporting industries contribute to competitive functioning of dairy value chains, but the findings from this research point to ‘packaging material’ and ‘cold chain services’ as the two priority industries for further research.

5
1. Introduction The agriculture sector accounts for over 33 and 23% of the gross domestic product (GDP) in Rwanda and Uganda, respectively, and it is a major source of employment (Makoni et al., 2014). Governments in Rwanda and Uganda, supported by programs from international development agencies, have prioritized the dairy sector to deliver economic growth, generate employment, and achieve food security objectives. Over the last 15 years, the livestock rehabilitation programs, such as Girinka in Rwanda, built households’ livelihood assets and helped create a dairy sector in which very large numbers of farm families participate. Furthermore, public investment in infrastructure created a strong foundation to improve milk collection and trade, connecting dairy farms and processing plants. Combined with these public investment programs, private investment in dairy processing plants has remarkably enhanced physical assets and infrastructure in dairy value chains in the two countries. Accounting for just less than 1% of total milk production in the region, regional dairy trade among the EAC countries is disproportionately smaller than the 10% global average (FAOSTAT, 2015). Although the dairy processing industry has a rather small footprint even in domestic markets in Rwanda and Uganda, it has rapidly grown in the last five years. This is against the backdrop of strong efforts to facilitate trade and regional integration through strengthening the capacity of the trade institutions and policy environment. These regional initiatives include the EAC’s Single Customs Territory, adoption of harmonized regional standards for dairy products, and institution of a 60 % CET applied to dairy products imported from outside the region (Bingi & Tondel, 2015). However, less is known about the regional trade impact of dairy value chain actors (including stallholder farmers) and their capabilities. Within this context, this report aims to enhance understanding of the opportunities and challenges facing dairy value chain actors in the EAC countries, focusing on Rwanda and Uganda, and the ensuing implications for regional trade. Country-level research and analysis is guided by the following three clusters of key questions:
x How are the dairy value chains structured in each country? o What are the different products? How do end markets differ? o Who are the relevant actors?
x How do lead firms govern the chain? o How are production and trade coordinated? o Which value chain segments constitute weak nodes or gaps in the chain? o What are the implications for upgrading and for national and regional dairy
markets? x What are specific policy actions and private sector strategies that can help Rwanda and
Uganda upgrade in the regional dairy value chains?
1.1.Research Methods This report draws upon primary and secondary sources of information. Because of the constraints associated with export and production statistics in Rwanda and Uganda, Duke CGGC focused its research efforts on literature reviews and in-depth interviews with industry stakeholders,

6
supplementing when possible with data from the public and proprietary databases. Field research was conducted by Andrew Guinn on trips to Kampala and Kigali in May and June, 2015. Together with phone or Skype interviews, Duke CGGC spoke with approximately 15-20 officials with direct ties to the dairy value chain in the region, including government officials and private sector actors in various segments of the chain. The report relies on the global value chain (GVC) analytical framework, which is a systems-based and actor-centric approach. It combines broad analyses of global industry structures and trends with detailed mapping of national industries and local economic clusters based on existing economic statistics. As the primary actors within value chains, firms are of central importance in the GVC methodology—GVC analysis seeks to determine what makes firms productive in the context of dispersed supply chains, how private-sector governance and public policies influence performance in the value chain, and what factors and strategies allow actors to move into higher-value segments of the chain. Specifically, it involves mapping the input-output structure, geographic scope, and the governance role played by lead firms, and market trends in a particular value chain. The analysis benchmarks productivity capabilities and the position of a specific firm, cluster or country relative to competitors in regional and global markets. This helps identify potential capability requirements and trajectories for acquiring those capabilities to move into higher-value-added positions and/or enter and expand market footprint at the national, regional and global levels. 1.2.Limitations In the course of pursuing these objectives, this study focused primarily on principle value-adding activities of dairy value chains in Rwanda and Uganda. Where appropriate, related dynamics from the other countries in the region, particularly, Kenya, were incorporated into the analysis in order to provide additional context and insight; however, the primary focus was Rwanda and Uganda. There were at least two reasons for limiting the study to these two countries: (i) a scope covering all five EAC countries risked being too expansive; and (ii) International Growth Center counseled Duke CGGC on focusing on the countries where it had a strong presence (Rwanda and Uganda). 1.3. Report Organization
The next section of the report concentrates on the global dairy industry by first mapping the value adding activities before proceeding to an analysis of the related dynamics in value chain segments and prominent actors. Subsequently, the report outlines capabilities of lead firms and their corresponding business-orientations. This section is followed by an analysis of the recent trends in global markets and the likely implications for the dairy sector in the region. Section 5 examines the EAC dairy value chain, focusing primarily on Uganda and Rwanda. After outlining the industry characteristics in both countries, it identifies important recent developments. The last section summarizes both opportunities and key constraints before outlining priority policy and strategy recommendations to address the gaps and support industry upgrading.

7
2. The Dairy Global Value Chain The dairy GVC encompasses: milk production, milk collection and trade, dairy processing, distribution and marketing (Douphrate et al., 2013). These principle value adding activities in the chain are supplemented by a range of supporting industries (Figure 1). Efficient milk production at the farm level depends on availability of competitive services by feed and fodder suppliers, veterinary and animal health service providers, and research and extension services focusing on animal breeding and genetic improvement. As a perishable product, ‘raw’ milk collection and trade linking dairy farms and processing plants critically depend on cold chain and logistics services. Similarly, dairy processing firms rely on a cost-efficient access to products and services supplied by industries from packaging material, to parts and equipment manufacturers for dairy processing plants. Dairy processors, especially, small and medium firms that generally face limitations in maintaining in-house research capabilities, also buy flavors, recipes and cultures for various dairy products from market or partner firms. As for the milk collection & trade activities, cold chain services are also crucial to post-processing distribution and marketing of dairy products in consumer markets. Figure 1 illustrates the value adding activities, range of actors involved, and supporting industries for the dairy GVC. The remainder of this section focuses on explaining in detail the principle value adding activities in along the dairy GVC and the recent dynamics in global markets. Figure 1: Dairy Global Value Chain
Source: Authors

8
2.1. Milk Production At a global level, vast majority of dairy farmers are smallholder producers although the number of dairy farms is decreasing while herd sizes continue to increase. A unique feature of the dairy industry is this socioeconomic position of dairy farmers that have weak and vulnerable position in the dairy market and are only able to adjust to market trends in a limited, slow and gradual way (Douphrate et al., 2013). To improve their value chain position, these actors, therefore, generally form cooperatives that often have different and varied functions. Africa is a rather small global player in milk production. The content, together with the other developing regions, has pursued an extensive growth strategy, which is increasingly facing natural resource constraints and competitive disadvantage compared to the leading dairy exporter regions (OECD/FAO, 2015). Global milk production at farm level was estimated approximately 800 million tons in 2013 (FAO, 2015). More than 50% of the global volume is produced in Southeast Asia, the EU, and the U.S. (Figure 2). At an individual country level, India with approximately 18% of world’s share in 2013 is the leading producer, followed by the U.S. (12%), China (5%), Pakistan (5%), Brazil (4%), and Germany (4%) (FAOSTAT, 2015).
Figure 2: Global Distribution of Milk Production in Volume, 2013
Source: FAOSTAT, 2015
Whereas milk production has increased approximately 3% per year globally over 2004-14, the underlying factors driving growth starkly differed between the developed and developing countries (OECD/FAO, 2015). According to the 2015 Agricultural Outlook, jointly published by the Organization for Economic Cooperation and Development (OECD) and Food and Agriculture Organization of the United Nations (FAO), the growth in developing countries, where dairy farming is pervasively small-scale, has been fuelled by an expanding cattle stock, delivering over two-thirds of the additional supply. This extensive strategy, though increasingly abated by the constraints in water and pasture availability, is projected to continue spurring growth in developing countries, expected to account for approximately 75% of the additional milk supply over the next decade (OECD/FAO, 2015).

9
In contrast, milk productivity has driven growth in developed countries, particularly, in major dairy exporters (OECD/FAO, 2015). During 2004-14, milk yield, measured in annual milk production per cow, has increased 17.4% in the U.S. and approximately 13% in both EU and New Zealand (DairyNZ/LIC, 2015; European Union, 2015; MacDonald, Cessna, & Mosheim, 2016). By 2014, productivity was approximately 10 tons per cow in the U.S., followed by EU at 7.4 tons, although very diverse across the region, and then New Zealand at 4.4 tons per cow. In general, enhancement in milk productivity is a function of multiple variables, such as improvements in feeding technology, animal breeding, and farm management practices, which all offer considerable scale economies (Gelan & Muriithi, 2015; MacDonald et al., 2016; Singbo & Larue, 2015; VandeHaar et al., 2016). According to milk production statistics from the U.S. in 2010, the herd size shows a strong negative correlation with dairy farms’ average unit cost2 (MacDonald et al., 2016). To realize the scale efficiencies, dairy farming in developed countries has increasingly consolidated at an increasingly higher rate since the early 2000s. In the U.S., the midpoint (median) herd size, has more than tripled, increasing from 275 to 900 heads over 2002-12 (Figure 3). The big difference, according to Figure 3, between the median and mean numbers reveals two important structural dimensions of dairy farming in the U.S. First, there are still many small dairy farms, i.e., <100 cows per farms, despite a 63% drop in the overall number of this category of farms in the country during 1992-2012 (MacDonald et al., 2016). Second, most of dairy cows are now kept on much larger farms, managing more than 1,000 cows per farms. Figure 3: Consolidation of Dairy Farming in the United States, 1987-2012
Source: MacDonald et al., 2016
2 Average unit costs falls sharply from an estimated US$39.11 per 45 kilograms (100 pounds) milk in the smallest farms, managing 50-100 cows, to US$13.80 in the largest, keeping 2,000 or more cows. In the same year, the average net return, after accounting for costs, was US$2.82 per 45 kilograms (100 pounds) milk sold for the largest farms (>2,000 cows), 36 cents for the next largest category (1,000-1,999), and negative for all smaller farm categories.
10
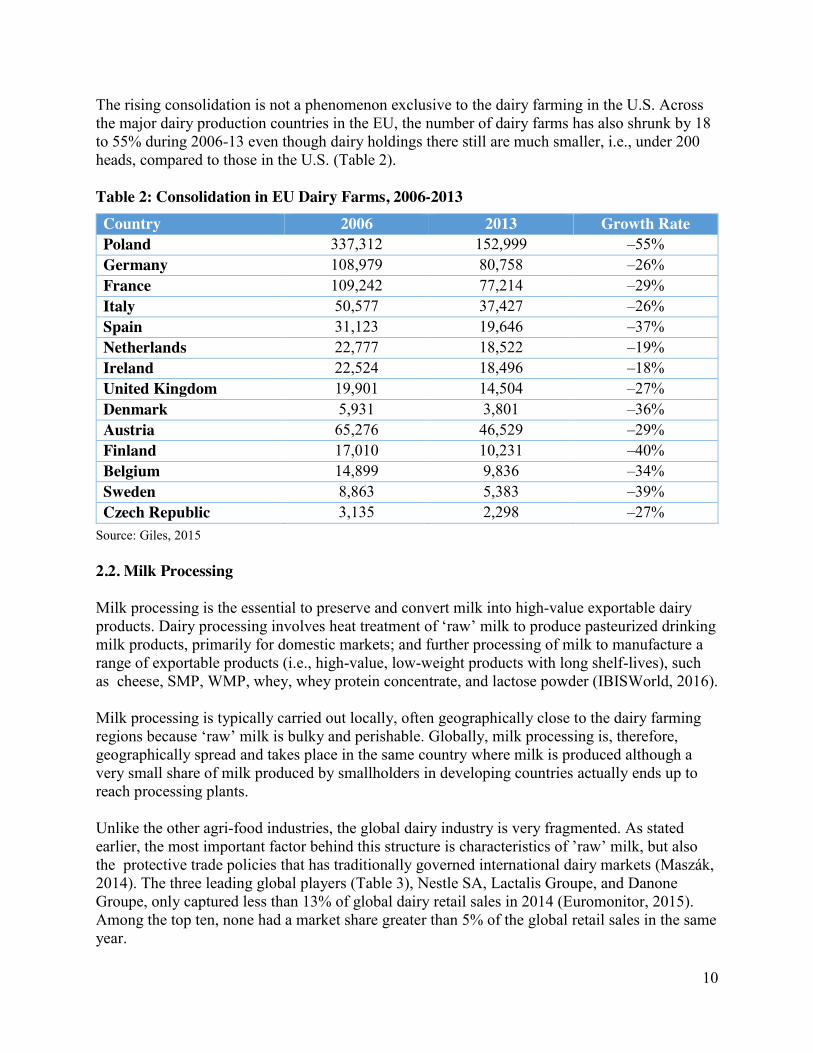
The rising consolidation is not a phenomenon exclusive to the dairy farming in the U.S. Across the major dairy production countries in the EU, the number of dairy farms has also shrunk by 18 to 55% during 2006-13 even though dairy holdings there still are much smaller, i.e., under 200 heads, compared to those in the U.S. (Table 2). Table 2: Consolidation in EU Dairy Farms, 2006-2013 Country 2006 2013 Growth Rate Poland 337,312 152,999 –55% Germany 108,979 80,758 –26% France 109,242 77,214 –29% Italy 50,577 37,427 –26% Spain 31,123 19,646 –37% Netherlands 22,777 18,522 –19% Ireland 22,524 18,496 –18% United Kingdom 19,901 14,504 –27% Denmark 5,931 3,801 –36% Austria 65,276 46,529 –29% Finland 17,010 10,231 –40% Belgium 14,899 9,836 –34% Sweden 8,863 5,383 –39% Czech Republic 3,135 2,298 –27%
Source: Giles, 2015
2.2. Milk Processing
Milk processing is the essential to preserve and convert milk into high-value exportable dairy products. Dairy processing involves heat treatment of ‘raw’ milk to produce pasteurized drinking milk products, primarily for domestic markets; and further processing of milk to manufacture a range of exportable products (i.e., high-value, low-weight products with long shelf-lives), such as cheese, SMP, WMP, whey, whey protein concentrate, and lactose powder (IBISWorld, 2016). Milk processing is typically carried out locally, often geographically close to the dairy farming regions because ‘raw’ milk is bulky and perishable. Globally, milk processing is, therefore, geographically spread and takes place in the same country where milk is produced although a very small share of milk produced by smallholders in developing countries actually ends up to reach processing plants. Unlike the other agri-food industries, the global dairy industry is very fragmented. As stated earlier, the most important factor behind this structure is characteristics of ’raw’ milk, but also the protective trade policies that has traditionally governed international dairy markets (Maszák, 2014). The three leading global players (Table 3), Nestle SA, Lactalis Groupe, and Danone Groupe, only captured less than 13% of global dairy retail sales in 2014 (Euromonitor, 2015). Among the top ten, none had a market share greater than 5% of the global retail sales in the same year.

11
Table 3: The Ten Largest Global Dairy Firms, Ranked by 2014 Annual Dairy Revenue
Company Headquarter Ownership Annual Sales (US$ billion) Nestlé SA Switzerland Public 27.8 Lactalis, Groupe France Public 19.5 Danone, Groupe France Public 19.5 Fonterra New Zealand Cooperative 18.5 Dairy Farmers of America United States Cooperative 17.9 FrieslandCampina Netherlands Cooperative 14.8 Arla Foods Demark/
Sweden Cooperative 13.6
Saputo Inc. Canada 9.8 Dean Foods United States Public 9.0 Inner Mongolia Yili China Public 8.6 Total 159
Source: Statista, 2016
A range of private sector actors, i.e., private and public companies as well as dairy cooperatives, undertake milk processing, with some of the largest dairy firms, such as China’s Yili, prominently positioned in serving only or almost entirely domestic markets (Euromonitor, 2015). Regardless of the ownership structure, dairy processors directly undertake or coordinate pivotal value chain activities, including: milk collection and bulking, processing, product development and brand manufacturing, and increasingly post-processing distribution and delivery services in a business-to-business (B2B) relation with customers, mainly in food retail, food manufacturing, restaurants and food service industries (Douphrate et al., 2013; IBISWorld, 2016; USDA, 2005).
2.3. Distribution and Markets
The distribution and marketing segments of the chain are generally organized according to characteristics of local demand and business environment. A well-organized retail network and efficient cold chain service are essential capabilities for distribution and marketing of perishable dairy products. At a global level, supermarket chains are the dominant distributor channels, marketing over 63% of dairy products in 2014, followed by independent retailers (15%), specialist retailers (10%), convenience stores (9%), and others (3%) (Hanisch, Müller, & Rommel, 2012). The global dairy retail market was valued approximately US$446 billion in 2015, equivalent to 234 million tons of dairy products (Euromonitor, 2015). The main dairy products ranked by value of market share are: drinking milking (40%), cheese (30%), yogurt and fermented milk products (19%) (Figure 4). Although cheese accounted for nearly a third of global retail sales in 2015, the corresponding total volume was only 7%, indicating the highest value-to-weight ratio on average among dairy products. On the other end of this spectrum are products from the drinking milk category.

12
Figure 4: Dairy Product Categories, Global Market in 2015
Source: Euromonitor International, 2015
Asia and Western Europe are by far the largest dairy markets, together accounting for more than half of the global volume (Figure 5). Western Europe, coupled with North America, however, is a mature market, where demand for dairy products is stagnant or declining for some products, such as drinking milk. Asia, followed by Middle East, Africa, and Latin America, has experienced the fastest market growth during 2010-15 (Figure 5).
Figure 5: Geographic Distribution of Global Dairy Markets, Volume Shares
Region Average Annual Growth Rate, 2010-15
Asia Pacific 7.30% Middle East & Africa 3.50% Oceania 2.80% Latin America 1.60% Eastern Europe 1.00% Western Europe -0.20% North America -0.60%
Source: Euromonitor International, 2015

13
2.3.1 International Trade
Trade in dairy products is predominantly localized, serving domestic markets. International trade is below 10% of global milk production in milk equivalent terms, despite its recent rapid growth, increasing twice as fast as milk production during 2010-13 (FAOSTAT, 2015). Measured in export value, an estimated US$67.5 billion in 2014, international trade is also concentrated in a handful of manufactured, dried and/or preserved, products, cheese (27%), WMP (21%), SMP (16%), butter (5%), and whey (6%) ranked by share of trade value in 2014 (Figure 6).
Figure 6: International Trade, Dairy Products, 2014
International export of dairy products also originates from a handful of countries. The top six countries control major shares of global export: butter (91%), SMP (87%), WMP (82%), whey (85%) and cheese (70%) (Table 4). New Zealand leads the list, controlling approximately half of global butter and WMP exports in milk equivalent terms. Section 4 presents more detailed market analysis for the U.S. and EU, the other two major global exporters. Table 4: World Top Dairy Exporters: Shares in 2010-13 Average Volumes
Countries/Regions Butter Cheese Skimmed Milk Powder
Whole Milk Powder
Whey (dry)
New Zealand 52% 12% 20% 48% 1%
European Union (EU-28)* 16% 31% 27% 18% 37%
United States 7% 11% 27% 2% 35%
Belarus 9% 6% 4% 2% 5%
Australia 5% 7% 8% 5% 3%
Argentina 2% 2% 1% 8% 5%
World Total* (Million tons) 0.8 2.3 1.7 2.2 1.3 *Excludes EU-28 internal trade
Source: FAOSTAT, 2015
Source: UNComtrade, 2016

14
Global demand for international trade primarily comes from the Asian and Latin American countries, but it is obviously very fragmented (Table 5). China is the leader in global import of milk powders and whey products while Russia leads the list for butter and cheese categories, accounting for over 15 and 20% of global imports, respectively, for butter and cheese products. Mexico and Algeria, respectively, are the other leading global importers of SMP and WMP., following China. Table 5: World’s Top Dairy Importers: Shares in 2010-13 Average Volumes
Countries/Regions Butter Cheese Skimmed Milk Powder
Whole Milk Powder
Whey (dry)
China (mainland) 3% 2% 9% 20% 31% Russia 15% 21% 4% 1% 5% Mexico 4% 4% 11% 1% 5% Indonesia 2% 1% 8% 3% 8% Algeria 1% 1% 7% 8% 0.3% Saudi Arabia 7% 6% 3% 5% 0.3% World Total* (Million tons) 0.8 2.3 1.7 2.2 1.3
*Excludes EU-28 internal trade Source: FAOSTAT, 2015
3. Lead Firm Capabilities and Value Chain Relationships Dairy processors strategically concentrate their business-orientations to manufacture ‘commoditized’ dairy products, be flexible brand manufacturer supplying large supermarkets, and/or focus on serving or creating niche markets through product development and branding, particularly, in the health and wellness domains (Euromonitor International, 2010). Whatever their business-orientation, which typically vary according to their dominant position along the value chain, they strive to main competitiveness in a range of value chain capabilities. These value chain capabilities are: (i) a ‘trust-based’ relationship with milk suppliers; (ii) the reach and scope of their distribution networks; and (iii) innovation and branding. Figure 7 illustrates these capabilities and their variation with respect to the different business-orientations, categorized as “process-, market- and product-orientated.” Dairy processors primarily positioned upstream in the value chain, such as Dairy Farmers America Inc. (DFA), mainly manufacturing commoditized products, are more “process-oriented.” They seek to gain competitiveness through cost-leadership and efficiency in their supply chains (USDA, 2005). For them, a “trust-based” relationship with milk suppliers is the most important capability that allows them to secure adequate supplies of quality milk. They often partner or collaborate with those processors positioned further downstream and with strong distribution networks in global markets. DFA, for instance, had entered into a long-term agreement with the New Zealand-based Fonterra that distributed FDA’s SMP products through its global distribution networks and received a commission on sales of the product (Blayney et al., 2006).

15
Figure 7: Dairy Firms’ Business-Orientation and the Corresponding Value Chain Capabilities
Source: Authors
“Market-orientated” firms, such as Danone Groupe, and Nestle SA, on the other hand, have concentrated on downstream capabilities, focused on brand manufacturing and distribution (Euromonitor International, 2010). They closely coordinate market relationships with supermarket retailers. For product development, they increasingly resort to ‘acquisition-led’ innovation (Euromonitor International, 2010; van Rensburg, 2015). Through their strong “distribution networks,” they seek to establish market-leadership in the increasingly consolidated retail food markets. Finally, “product-oriented” firms, such as Chobani LLC, primarily rely on capabilities for “product innovation and branding”(Gehlhar, Regmi, Stefanou, & Zoumas, 2009; Moreau, 2016). They often partner or collaborate with the “market-oriented” firms to penetrate new markets and/or expand their product footprint in national, regional, and global markets. In summary, “trust-based” relationship with milk suppliers, strong “distribution network,” and (often disruptive) “innovation and branding” are the principle ‘intangible’ capabilities that, respectively, are linked to “process-, market- and product-orientation” of the processor firms in dairy value chains (Figure 7). This pattern also exists in other agricultural value chains involving capital-intensive processing and brand manufacturing, such as coffee and cocoa (Abdulsamad, Stokes, & Gereffi, 2015). The following paragraphs explain these capabilities and their relationships with the different ‘business-orientation’ of dairy processor companies.

16
2.2.1 A “trust-based” relationship with milk suppliers is critical to secure adequate supply of quality milk. The importance of this capability is heightened by a number of industry-specific features. First, the dairy farming and processing activities are capital-intensive and characterized by high levels of asset specificity (IBISWorld, 2016; Maszák, 2014). This results in mutual-dependence, particularly, in developing countries where vertical integration is economically infeasible due to the dominant smallholder dairy farming structure. Second, milk suppliers need stability in market access to manage the daily production cycle of dairy farming. In doing so, they generally rely on the processing sector because milk is highly perishable and it has to be marketed or processed within a short period after production to prevent spoilage. Third, perishability and bulkiness turn ‘raw milk’ into a non-tradable commodity over long distance, particularly, in regions where cold-chain infrastructure is weak or non-existent. These features are unique to dairy industry and put dairy farmers, particularly, smallholders, in a low-bargaining position vulnerable to high risk of opportunistic behavior. The risk facing dairy farmers is multiplied by seasonal variability of milk output, common in pasture-based dairy farming (Makoni et al., 2014; World Bank, 2015)
Under these conditions, characterized by mutual dependence, and an institutional context where contract enforcement is challenging, a “relational” governance typology coordinates value chain transactions, regulated by ‘trust’ or reputation (Gereffi, Humphrey, & Sturgeon, 2005). Buyer ‘trustworthiness’ has been found paramount in encouraging milk suppliers to invest and upgrade of the quantity and quality of their milk output quantity and quality (Gorton et al., 2015) To establish a ‘trust-based’ relationship in governing transactions upstream in the dairy value chains, cooperatives are commonly formed. ‘Trust’ is established through share-holding, but more importantly through frequent transactions in a long-term relationship that guarantees milk market and price. While cooperatives serve to ensure long-term market stability to members, they subsequently either process the ‘raw’ milk and/or sell it under long-term contracts to downstream processors. In many countries, cooperatives control major shares of the milk market. Dairy cooperatives process and market more than 80% of milk in the U.S., and 55% of milk in the EU (Douphrate et al., 2013; IBISWorld, 2016). Cooperatives represent ten among the top 20 largest dairy companies in the EU, and are also the leading global exporters, such as New Zealand’s Fonterra (Hanisch et al., 2012). Whereas the primary objective of dairy cooperatives has been to minimize transaction risks in dairy value chains, they progressively upgraded and adopted their business-orientations and capabilities (USDA, 2005):
x Bargaining-only cooperatives exclusively focus on negotiating milk prices. They lack processing capability to convert milk to storable dairy products. This weakens negotiating position and increases market risks for them, particularly, during surplus milk seasons.
x Commodity-manufacturing cooperatives market some or major share of their members’
milk supply and internally process the rest. Relying on cost-leadership in dairy markets, they own and operate large-scale processing plants that produce undifferentiated or commoditized but storable dairy products, such as butter and skimmed milk powder. The alternative market channels strongly enhance their bargaining capability vis-à-vis their downstream buyers.
x Niche marketing cooperatives, contrasting the commodity-manufacturing cooperatives,
produce specialty dairy products and are often small and mediums-sized in scale. They

17
rely on differentiation and strong market strategies as their critical resources. They mostly manufacture branded cheese that allows them to capture additional value from branding and marketing.
x Fluid milk processing cooperatives process and market commoditized fluid milk, as well
as soft dairy products, such as yogurt, sour cream, and ice cream. This market is consolidated, extremely competitive, and requires adequate financial resources and strong distribution network capabilities to succeed.
x Diversified cooperatives operate a system of plants and manufacture a variety of dairy products, commodity and differentiated. Some of them are sophisticated marketers of branded dairy products at the global level.
2.2.2 A strong distribution network, referring to both the presence of well-organized retail channels and the characteristics of ‘processor-retailer’ trade relationship, is among the most important capabilities to brand manufacturers in dairy value chains. The nature of this relationship has become ever more important with the structural changes in the retail sector. The rise of consolidated retail markets, and the strategic shift in retailers’ marketing emphasis from manufacturers’ brand to retail categories, popularly known as “category management3,” has weakened the primacy of manufacturer brands (Chimhundu & Hamlin, 2007; Lindblom & Olkkonen, 2006). Unlike the traditional approaches whereby brand manufacturers exclusively concentrated on maximizing their own return from brand and advertising investment, their branding strategies increasingly need to complement retailers’ “category management” strategies. Complementing, or at best maintaining some degree of influence over, the retailers’ category-management tactics, broadly classified as, assortment planning, pricing, shelf-space allocation, and in-store promotional activities, is now crucial to the performance of dairy manufacturers (Lindblom & Olkkonen, 2006). This goal congruence offers brand manufacturers access to a strong distribution network and mutually advantageous relations. Such a relationship is not readily imitable and is built over time (Gereffi et al., 2005). This challenge of organic growth leads dairy processors to seek alternatives, such as partnerships, alliances or outright acquisitions of the established dairy processor firms when they enter new markets or market relationships (Blayney et al., 2006; Euromonitor International, 2010). Although partnerships and/or alliances will not have the growth impact provided by an acquisition, they still offer immediate and more cost-efficient ways of getting fast access to distribution channels in a new market. In the absence of well-organized retail markets, dairy processors usually have to bear the additional cost and risks of investing in, often innovative, distribution networks (Makoni et al., 3 Category management describes a process whereby supermarket retailers focus on specific product categories, such as dairy, as small business units and not individual product brands. The business units are responsible for developing their respective strategic plans, overseeing implementation, evaluating progress, making appropriate adjustments, and being responsible for results. The benchmark is to establish category leadership and increase market share, revenue, and profitability.

18
2014; Nestle, 2010). This market condition, pervasive in suburban and rural areas of developing countries, often remains a barrier to growth and development of the processing sector as well. Processor companies had to invest in distribution networks in order to reach the large customer-base outside the catchment zones of the modern retail networks (Box 1). Processors usually approach this challenge through social business models, proven to have their own limitations in terms of sustainability and scale (Abdulsamad et al., 2015). Box 1: Examples of Processors’ Investment in the Absence of Organized Retail Networks The Grameen Danone Foods Ltd started its yogurt distribution network through “Grameen Danone Ladies” in Bangladesh in 2006. The distribution network involves a group of local micro-entrepreneurs who also receive micro-financing solutions. The joint venture is expected to provide business strategy lessons to launch affordable distribution networks in Southeast Asia, particularly, in India. The traditional direct selling of yogurt is an integral part of Danone’s emerging market distribution strategy in Southeast Asia and Brazil. Nestlé’s direct delivery model on motor bikes began distributing pasteurized milk in Lahore city of Pakistan in 2015. The company responds to a growing demand for pasteurized milk among high-income households. The main packaged milk players are strong in Ultra-Heat Treatment (UHT) but do not offer a pasteurized variant. The pilot, if successful, will be rolled out to rural areas. Nestlé’s floating supermarket, an investment initiative of US$560,000 since 2010, directly distributes the company’s products to customers in the Brazilian Amazon. A barge carries over 300 Nestlé brands on-board, including Ninho, Maggi and Nescafé, aiming to reach 800,000 customers per month. A key element of the strategy is also to offer smaller and cheaper versions to lower income groups.
2.2.3. Branding and Innovation are important capabilities that enable dairy manufactures to capture value in dairy value chains; integrate marketing strategies across products and geographies, and finally to create a strong identity crucial for product differentiation and grow market footprint in national, regional and international markets. First, to create but also capture value, dairy manufacturers depend on the value proposition of their brands and the bargaining power it brings vis-à-vis the large supermarket retailers. The importance of this capability is more salient in consolidated retail channels, where private label has established a strong market presence (Table 6). Linked to their ‘category management’ strategy, supermarket retailers only elevate the position of some dairy brands to ‘category manager’ or ‘captains’ when they prove valuable in terms of return per square foot of shelf space (Gehlhar et al., 2009; Lindblom & Olkkonen, 2006). For those manufacturer brands, this position brings the ability to strongly influence product features and standards of practice for in-store competing brands of the retail chain (Chimhundu, Hamlin, & McNeill, 2010).

19
Table 6: Dairy Markets with the Largest Private Label Penetration, Percent of 2015 Retail Sales Market Butter Market Drinking
Milk Market Yogurt Market Cheese
Austria 40 Switzerland 68 Switzerland 60 Netherlands 40 Italy 35 Germany 68 Turkey 35 USA 33 Germany 35 United
Kingdom 66 Netherlands 32 United
Kingdom 32
Spain 34 Belgium 60 Austria 29 Germany 31 USA 29 USA 54 Finland 27 North
America 30
Switzerland 25 Spain 48 Portugal 26 Australia 28 Netherlands 24 Netherlands 47 Spain 26 France 28 Australia 23 Austria 46 Germany 24 Austria 26 France 23 France 41 Belgium 23 Ireland 24 Canada 23 Czech
Republic 36 Slovenia 22 Portugal 23
World 13 World 15 World 7 World 17
Source: Euromonitor International, 2015 Upgrading to this brand leadership, however, requires dairy manufacturers to position their brand(s) as “a total solutions provider,” a brand manufacturing feature adopted by “market-oriented” dairy firms. It demands adaptability from brand manufacturers to retailers’ needs in their brand architecture, and brand supportive programs, such as post-processing distribution services, i.e., logistical support and timeliness of delivery (Beverland, Napoli, & Lindgreen, 2007). Second, through brand architectures and/or corporate endorsements, brands function as anchors to help integrate marketing strategies across products and geographies (Douglas, Craig, & Nijssen, 2001; Jakubanecs & Supphellen, 2012). Although the literature lacks consensus on the definition (Melewar, Small, Whitelock, & Fastoso, 2007), international brands here refer to those which could be find in multiple countries with generally similar or centrally coordinated marketing activities. They have been widely used by leading dairy manufacturers that draw a sizeable share of their revenue from only a handful of international brands (Table 7). In general, the impetus behind this strategy was cost-saving (Schuiling & Kapferer, 2004). International brands can generate cost-efficiencies in all areas of brand-manufacturing, including research and product development, manufacturing, logistics and advertisement expenses. A more localized branding approach, particularly, for bulky products, however, is followed. Local branding is also adopted to cater cultural and dietary preferences of consumers in core and/or large domestic markets (Banerjee, 2008; Melewar, Badal, & Small, 2006).

20
Table 7: International and Local Brands of Leading Dairy Firms: Scope and Revenue Distribution
Firm (Product Category)
International National/Local Brands # of Brands Countries Share of Category
Revenue # of Brands Range of market share
(largest country market) (Cheese) Lactalis, Groupe 2 45 45% 71 <1% to 30% (Tunisia) Arla Foods Amba 2 17 56% 29 <1% to 27% (Sweden) Saputo Inc. 0 0 0 10 <1% to 13% (Canada) Fonterra 3 13 38% 11 <1% to 29% (Malaysia) (Butter) Arla Foods Amba 2 28 78% 4 <1% to 29% (UAE) Lactalis, Groupe 2 28 49% 22 <1% to 43% (Vietnam) Fonterra 2 21 50% 10 <1% to 55% (Taiwan) (Yogurt) Danone, Group 8 59 73% 49 <1% to 36% (Argentia) Inner Mongolia Yili Industrial Group Co
0 0 0 2 4% to 11% (China)
Lactalis, Group 2 10 13% 52 <1% to 54% (Dominican Republic)
Nestle SA 1 9 37% 17 <1% to 29% (UAE) (Drinking Milk) Inner Mongolia Yili Industrial Group Co
0 0 0 1 21% (China)
Nestle SA 5 36 35% 27 <1% to 43% (Cameron) Lactalis, Groupe 5 26 34% 55 <1% to 40% (Croatia) FrieslandCampina 2 11 30% 26 <1% to 28% (Nigeria) Danone, Groupe 3 13 38% 27 <1% to 40% (Morocco)
Source: Euromonitor International, 2015 Third, a strong brand identity or image, predominantly built through innovations and responsiveness to consumer preferences, is an important driver supporting market entry and growth for dairy processors. The Greek Yogurt brand allowed Chobani to emerge and become an eminent player, reaching US$1 billion sales in the U.S. yogurt market in only 6 years (van Rensburg, 2015). This rapid growth was achieved despite the dominant presence of global firms, such as Danone Groupe and General Mills in the U.S. (Euromonitor, 2015). Capitalizing on functional health and wellness dimensions, the WhiteWave Food Company penetrated the already mature drinking milk markets and spurred 41% sales growth between 2010 and 2014 (Euromonitor, 2015). Dairy firms pursue multiple innovation and product development strategies, including the traditional approaches of maintaining internal research units but increasingly through inter-organizational linkages, partnerships, and acquisitions (Euromonitor International, 2010).
4. Recent Trends in International Dairy Markets Since the early 2000s, the global dairy market has increasingly liberalized, partly driven by the commitments of two of the leading global exporters, EU and U.S. from the Uruguay Round of multilateral trade negotiations (Burrell, 2009). Policy intervention there has progressively shifted from the most market-distortive tools, such as ‘price support’ and ‘market stabilization,’ to

21
subsidized insurance and other tools focusing on the ‘farmer income’ and with the least effect on dairy markets (Box 2). Three major outcomes have resulted from this transformation. First, there has been a rapid surge in global milk supply when the policy-induced constraints on milk production, particularly, the restrictive production quota system in EU, were eliminated. Second, milk price volatility has increased with the liberalization and rising international trade. Third, outflow of international investment in dairy processing, led by the mergers and acquisitions (M&A), has increased from the surplus EU and US markets to developing dairy markets, including Africa. The likely outcome of these global market trends for Africa depends on the ability of national or regional stakeholders to identify and attract the right type of firms and leverage those investments develop local milk-dairy supply chains. A less attractive scenario would be the overflow of milk powder imports that could be used to locally manufacture dairy and food products for African markets. Box 2: Transformation of Dairy Policies in European Union and the United States Over the last decade, the focus of dairy policies in both the EU and U.S. has substantially shifted. Historically, the essential characteristics of the policy interventions, i.e., the Common Agricultural Policy (CAP) in EU, and the Dairy Product Price Support (DPPs) in the U.S., centered on ‘price support’ to farmers, stabilization of domestic dairy markets, and trade protectionism (Burrell, 2009; MacDonald et al., 2016). While these highly distortive policy instruments achieved the objective of increased investment and productivity in the dairy sector, the system created persistent overproduction and structural surpluses, obligating state programs to purchase large volumes of butter and skimmed milk powder. To cut oversupply, the introduction of milk production quotas in the EU in 1984 was the most important policy response(European Union, 2014). Similarly, during the 1980s-90s, ‘price support’ was progressively reduced in the U.S. to discourage over production (MacDonald et al., 2016). Later, in the 1990s, pressure for policy change came from various fronts, led by the Uruguay Round of Multilateral Trade Negotiations (launched in 1986) that critically attacked prohibitive tariffs and persistent dumping of subsidized surplus products on world markets (Swinbank & Daugbjerg, 2006). Although the 1992 CAP reforms in the EU, known as Mac Sharry Reform, was a major overhaul that decoupled policy interventions from the milk production, substituting ‘price support’ with direct payments to farmers per hectare of land or animal head regardless of actual production, implementation of reforms in the dairy sector took much longer and was actually only effected a decade later. The related CAP policy instruments, and the milk production quotas, have remained unchanged over 1984-2003 (Burrell, 2009). In the early 2000s, the Fischler Reform in EU, and the Milk Income Loss Contract (MILC) Program in the U.S., influenced by the Uruguay Round, has introduced deeper policy change. The 2003 Fischler Reform amalgamated commodity-specific direct payments into a Single Payment System, which was also linked to adherence to standards with respect to food safety, environment, and animal health and welfare (Daugbjerg & Swinbank, 2009). In 2004, the target price for milk, used to provide a benchmark for ‘price support’ interventions, was abolished. ‘Market stabilization’ interventions were also capped for butter with intervention prices cut by 25% for butter and 15% for milk powder(Burrell, 2009). The 2002 MILC program in the U.S. introduced fundamental dairy policy change, shifting focus to risk management and ‘farmer income’ from its traditional focus on stabilizing ‘milk prices.’ MILC would compensate farmers for 45% of the loss or price gap, the difference between the market price for milk and a benchmark price (MacDonald et al., 2016). MILC, however, imposed certain limitations on the volume and size of its target group. Policy support was capped to 1.36 thousand tons (3 million pounds) per farm, and it initially did not account for volatility in feed prices. Radical dairy policy reforms were introduced since 2008. Policy measures were refined to directly target farmer income and effectively remove the implicit or explicit restrictions on milk production. Initially, MILC was amended to account for feed price volatility in 2008, and was later substituted by the Dairy Margin Protection Program (MPP-Dairy) in 2014 (MacDonald et al., 2016). In the EU, production quotas were gradually removed from 2009 and they were completely abolished in April 2015(European Union, 2014). The MPP-Dairy in the U.S. is basically a subsidized and voluntary insurance program that offers protection to dairy farmers when the ‘margin’

22
or difference between national average milk and feed prices falls below a certain dollar amount. It has actually eliminated the coverage limits under the MILC program. Whereas the EU and U.S. dairy sectors are now set on a more market-oriented course, a reformed set of policy instruments, under the Dairy Export Incentive Program (DEIP) and the Tariff-Rate Quotas (TRQS) in the U.S. as well as in EU through the specific super levies on imports; and subsidies for export of dairy products to non-EU countries. Figure 8: Timeline of Dairy Policies in the EU (light blue) and the U.S. (light red), 1960s-2015
Spurred by these policy changes, milk production in the EU region and the U.S. has rapidly increased, growing by 15 and 10 million tons, respectively, over 2009-15 (Figure 9). Their combined additional supply amounted to 75% of growth among the six major dairy exporting countries (USDA, 2015). With the stagnant domestic demand, the additional supply has to find international market outlets. It is equivalent to 12% of global trade or 18 times Africa’s total dairy exports in milk equivalent terms in 2013 (FAOSTAT, 2015).

23
Figure 9: Milk Production Trend for Major Exporters, 2000-2015
Source: USDA, 2015
In the post-reform period, price volatility in dairy markets has astonishingly increased. Measured by the coefficient of variation (CV)—the ratio of the standard deviation of prices to the mean value—volatility in monthly U.S. milk prices was only 6% in 1990-94 (Figure 10). It increased to 15% in 2000-04, and further grew to 20% in 2005-09, before falling back to 15% in 2010-14 (MacDonald et al., 2016). Volatility in monthly milk prices traced a comparable trajectory in the EU, increasing to 13% in 2005-09 from 5-6% in 1990-04 and 2000-04 periods, before returning to 9% in 2010-14 (European Commission, 2015).

24
Figure 10: Trend in Monthly Raw Milk Prices in the U.S., 1980-2015
Source: MacDonald et al., 2016 Price volatility is increased by the less elastic characteristics of dairy supply-- milk supplies and cow inventories are less responsive to short-term price changes. In 2009, U.S. milk prices spiraled down (Figure 10) due to the shocks, arising from a sharp reduction in domestic consumption and exports due to recession at home and post-drought recovery in rival export countries from Oceania (MacDonald et al., 2016). Very recently, the reduced foreign demand caused by the declining Chinese import of milk powder and the 2014 Russian ban on import of dairy products, had drastic effects on international milk prices. In January 2016, the weighted average milk prices in the EU and the U.S. were down, respectively, by 25% and 32% compared to January 2014 (CLAL, 2016). While dairy farms sustained substantial financial loss, approximately US$15 billion in the U.S. over 2008-09 (MacDonald et al., 2016), short-term production levels defied downward price pressure. Finally, outflow of international investment from the US and EU has significantly increased in tandem with the liberalization trend of their dairy industries. Although deal values for all acquisitions were not disclosed, the known values indicate a considerable rise in the size of deals in addition to a rise in total number of acquisitions. The average amount of known values has grown from U$122 million during 2004-09 to US$300 million during 2010-15 while the largest deal value has risen, respectively, from US$580 million to US$3.6 billion over the period (MarketLine, 2015b). Total number of acquisitions by the European dairy firms, the dominant group, has since doubled, rising from 49 during 2004-09 to 101 in 2010-15 (Table 8). While most of these acquisitions (67) have occurred within the EU region itself, driven by the ongoing industry adjustments as a result of market liberalization and abolition of milk production quotas, the rising number of acquisitions in Africa indicates the growing importance of this content in global dairy markets. The prominent investments deals in Africa were: Danone Groupe invested nearly US$1billion in two deals in 2012 and 2014 in Centrale Laitiere in Morocco, and the company acquired 40% stake in Brookside Dairy in Kenya in 2014; and FrieslandCampina, which invested US$19 million to acquire Olam International’s dairy business in Ivory Coast

25
(MarketLine, 2015b). A number of Africa-originated acquisitions have also added to the recent dynamics. For example, Brooks Dairy have also made a number of acquisitions in East Africa, Bueziki Dairy in Kenya in 2013, and Sameer Agriculture & Livestock in Uganda in 2015 (MarketLine, 2015b). Table 8: Total Number of Acquisitions in Dairy Processing Industry, Distributed by Acquirer and Target Regions, 2004-09 (2010-15)
Acquirer Region
Target Region
Total Asia-Pacific
Europe
Middle East & Africa
North America
South & Central
America
Asia-Pacific 10 (16) 1 (3) 0 (2) 0 (1) 11 (22) Europe 4 (8) 41 (67) 0 (9) 3 (13) 1 (4) 49 (101) Middle East & Africa 0 (2) 5 (7) 5 (9) North America 0 (1) 2 (3) 24 (34) 1 (2) 27 (40) South & Central America 1 (1) 2 (0) 6 (6) 9 (7) Total 14 (25) 45 (76) 5 (18) 29 (48) 8 (12) 101(179)
Source: MarketLine, 2015b As briefly indicated earlier, these trends have important implications for development of dairy industry in Africa. Although the rising private investment by the regional and global firms is a positive development, the emerging issue from these acquisitions in East Africa is the impact on competition in an already consolidated dairy industry in the region. Additionally, investments by the EU dairy firms will have different growth outcomes on whether dairy firms with the relevant business-orientations are attracted to fill the existing capability gaps in the region. A “process-orientated” firm is more likely to offer the technology and management expertise needed to establish backward linkages and develop local milk supply chains. On the other hand, a “product-oriented” firm could support research and culturally-sensitive product development for the markets in East Africa and the wider African content. A “market-oriented” firm will potentially focus to further develop regional distribution networks and connect local value chains with the regional and global markets. In an alternative scenario, large dairy process might attempt to open up markets to increase export of milk powder from their production bases outside the region. Analysis of the current status and recent dynamics in the regional dairy industry in East Africa is presented in the subsequent sections of this report.
5. The Dairy Industry in East Africa Whereas the EAC countries have accomplished much in terms of market integration and intra-regional trade, such as: the EAC’s Single Customs Territory; institution of a CET applied to dairy imports from outside the region; and remarkable efforts in harmonizing regional standards for dairy products (Bingi & Tondel, 2015; World Bank, 2014), trade in dairy products in the region predominantly remains a domestic, or even localized, business (Bingi & Tondel, 2015). Across the region, dairy markets are commonly structured into a dual system of “formal” and “informal” markets, respectively, here referred to as the market for pasteurized milk and other processed products versus the market where ‘raw’ or ‘boiled’ milk is directly supplied to

26
consumers, i.e., by-passing the dairy processing firms. The informal market channel still constitutes between 80-90% of total marketed milk output in the region (Makoni et al., 2014). Less than 1% of total milk output, measured in milk equivalent terms, is actually trade within or outside the region (FAOSTAT, 2015). Although the current volume of regional trade in dairy products is still small4, it has grown remarkably. The average annual quantity of dairy products traded intra-regionally during 2010-15 has increased nearly eleven fold compared to that in 2002-05 (Table 9). The extra-regional export of dairy products has also followed a growing trajectory, rising nearly six fold over the same period (Table 9). This has been combined with an increase in extra-regional imports, the average annual volume rising just 4% in 2010-13 compared to 2002-05. Table 9: Change in Annual Quantity of Dairy Trade for the EAC Countries
Trade Average Annual Quantity (tons) Percent Change 2002-05 2010-13 Intra-Regional Export 1,530 18,449 +1,106% Extra-Regional Export 1,576 10,988 +597% Extra-Regional Import 10,055 10,460 +4%
Source: FAOSTAT, 2015 Recent regional investments offer the potential to further expand dairy trade among the EAC countries although only Kenya and Uganda have been able to attract large foreign investors. Combined with these foreign acquisition and greenfield investments, respectively, Danone Group in Kenya and Amos Dairies in Uganda, the leading regional firm, Brookside Dairy, has also made a number of investments in Kenya and Uganda over the past five years. (MarketLine, 2015b). These recent trends strongly point towards further integration of EAC dairy value chains through increasing trade and investment in dairy processing. High ambient temperatures in the tropical region and inadequate cold chain infrastructure, however, still limit regional trade only in shelf-stable products, such as milk powder and UHT milk (Bingi & Tondel, 2015). While all countries in the region have established capability to produce UHT milk now, only Kenya and Uganda have the capacity to process liquid milk to powder (Makoni et al., 2014). SMP and WMP constituted more than 80% of extra-regional exports from the region in 2013 (FAOSTAT, 2015). Although the rising public and private investments have improved “tangible” capabilities in the EAC dairy industry, there are important issues of value chain “relationships” that challenge realization of the potential growth offered by dairy markets in the region. Dairy processors across the region mostly suffer from a lack of “trust-based” relationship with milk suppliers. The absence of this value chain capability results in chronic underutilization of the installed capacity in dairy processing plants as well as in some of the Milk Collection Centers (MCCs), predominantly due to the shortage of quality milk supply. The situation is exacerbated by seasonal variations in milk output and opportunistic behaviors by the value chain actors. In the meantime, this ‘trust’ deficit leads dairy farmers to seek alternatives and the readily available 4 Although an “unknown” quantity, informal cross-border trade is reportedly common in the region, mainly involving exports to DRC and Burundi (USAID, 2013).
27
option for them is the resilient and widely spread “informal” milk markets in the region. The strength of “distribution networks” vary across the region, with Kenya as the obvious leaders. Nevertheless, dairy processors in both Uganda and Rwanda are disadvantaged with respect to the “scope and reach of their distribution networks.” Only recently, the Rwandan dairy firm, Inyange Industries, invested in an innovative distribution network, called “milk zones.” According to field interviews (Blessed Dairy, 2015), dairy processors concentrated on production of “commoditized” products, such as pasteurized milk, UHT, milk powders, butter and there is also limited but growing production of yogurt for which recopies and cultures are primarily imported from outside. The low regional consumption of dairy products, especially, higher value added products, such as cheese, has turned “product-orientation” less of a priority most of the dairy processors in Uganda and Rwanda. These challenges and opportunities are presented in detail in the following country-specific analyses involving dairy industries in Uganda and Rwanda.
5.1.Uganda
Despite its long history, Uganda’s dairy processing industry only began its recent development trajectory since the 1990. It was founded by the first Dairy Industry Act in the 1960s, which set up the Dairy Corporation, a government body responsible for dairy industry regulation, growth, and market development (Toye, 2012). The Dairy Corporation experienced major setbacks inflicted by the political instability and civil war in the next decades. By the 1990s, the national cattle stock was cut by more than 50%, from eight to 3.5 million heads; the state-controlled cooperative marketing structure had collapsed; and from the two milk processing plants, built in Mbale and Kampala in the 1960s, only the latter was operational (Toye, 2012). In the post-conflict period, the 1993 Dairy Sector Master Plan established the framework to liberalize milk marketing, create a dairy board, and privatize the Dairy Corporation (Mbowa, Shinyekwa, & Lwanga, 2012). By 1998, implementation of the master plan culminated into creation of the Dairy Development Authority (DDA), and the Dairy Corporation Limited (DCL), the commercial company, which was later privatized and leased to Sameer Agriculture & Livestock Ltd. (SALL) in 2006 (Toye, 2012). Besides the assets of DCL, the delivery of the veterinary/extension services has also been privatized and delegated to the district level administrations. Uganda’s ‘raw milk’ market also transformed from a stated-controlled system to a more competitive industry in which private sector, including a large number of independent local traders, has taken an increasing role in local milk collection and trade. Private investment has rapidly expanded processing capacity which has reached 1,454,480 liters per day in 2015, from just 160,000 at the time liberalization (Makoni et al., 2014). By 2014, there were 14 registered dairy processors companies operating in the Uganda. The country now manufactures a diverse range of dairy products: pasteurized milk, UHT milk, yogurt, butter, cheese, and milk power for domestic and export markets (Makoni et al., 2014). These developments are, nevertheless, overshadowed by relatively underdeveloped value chain capabilities and the presence of a sizeable ‘informal’ milk market that supplies lower-priced ‘raw’ or ‘boiled’ milk directly to consumers. The following sections describe the current status, dynamics, and challenges facing Uganda’s dairy value chain.

28
5.1.1. Milk production
While milk production in Uganda has more than doubled since the early 2000s, milk productivity remains low and varies seasonally. Although low milk productivity is associated with the smallholder farming structure, the poor feeding system and animal breeds are also important contributing factors. Combined with these farming issues, limited access to markets, especially for remote areas during the rainy season, are value chain constraints that undermine investment to improve milk productivity in dairy farms. Uganda’s national milk production has increased approximately 7% per year, growing from 0.5 to 1.2 million ton during 2000-13 (FAOSTAT, 2015). This growth in production volume was primarily achieved by expanding the country’s cattle population, restocked by the post-conflict livestock rehabilitation programs (Mbowa et al., 2012). Uganda’s cattle population5, estimated at 14 million head in 2014, has more than doubled since 2000 (Figure 11). Milk productivity, however, remains low and is undermined by the smallholder dairy farming structure and low investment in farming practices, linked to the underdeveloped and poorly configured relationship between dairy farmers and ‘raw’ milk buyers.
Figure 11: Trend in Cattle Stock in Uganda, 2000-2014
Source: FAOSTAT, 2015 Approximately 90% of cattle stock in Uganda is managed in small dairy farms, averaging herd size of 6.9 cattle per farm (Balikowa, 2011). The predominantly small-scale structure prevents realization of scale efficiencies experienced in the U.S., EU and other major dairy exporting regions. Milk productivity of a typical farm in Uganda was estimated less than 500kg per cow per year (Ndambi & Hemme, 2009), that is, 5% of U.S. productivity.
5 The drastic increase in cattle numbers in 2008 is attributed to previously inaccurate data reporting on the number of livestock in the country before the first comprehensive 2009 census of agriculture conducted by the Ministry of Agriculture, Animal Industry and Fisheries in collaboration with Uganda Bureau of Statistics (Mbowa et al., 2012).
29
Currently, three production systems characterize dairy farming in Uganda. First, traditional open grazing or low-input rural dairy farming, dominated by the indigenous cattle breed, is the most common production system. Although it ensues no expenses related to feeding, this system yields the lowest milk productivity. An estimated 85% of cattle stock in the country are kept in this system (Makoni et al., 2014). The second production system, involving mixed grazing and feeding, has developed post-liberalization and encompasses small-scale mixed crop and livestock farms in peri-urban areas around Kampala. Most of these farms graze cattle in the rainfall season and shift to complementary feeding in the dry season. This category of farms is also small in size, around 10 dairy cows of mixed breeds (Makoni et al., 2014). Third, zero-grazing or intensive feeding system is commonly practiced in large commercial farms, with herd sizes of 20 to 100 exotic (pure- and cross-bred) cattle. This farming system is concentrated in large commercial farms located around the Western and Central regions, and it only accounts for 6% of total cattle population in the country (Balikowa, 2011; Makoni et al., 2014). Some smallholders, mainly the beneficiaries of rehabilitation programs since 2000, have also adopted zero-grazing, but these investment efforts are yet to generate profit. Milk productivity in a typical zero-grazing farm is over 2,000kg per cow per year, nearly fourfold a comparable farm under the open-grazing system (Mbowa et al., 2012; Ndambi & Hemme, 2009). The zero-grazing farms also incur higher production costs which are offer considerable scale economies, as evidenced from the farming sectors in the U.S. and EU. The highest cost components are those for the purchased feed—fodder and concentrate-- followed by labor in large commercial farms. The cost difference between the zero- and open-grazing systems can reach as much as 75% per 100kg of milk produced (Ndambi & Hemme, 2009). Because of the high costs, it is the least common dairy farming system in Uganda, and it has been found that inflation adjusted returns for smallholders were negative when they adopted the zero-grazing system (Ndambi & Hemme, 2009). Profit margins are strongly influenced by the price gap between feed and raw milk, which both are very volatile. Supply variations and conditions of market access between the rainfall and dry seasons are important drivers of volatility in raw milk prices in Uganda (Balikowa, 2011). With better market access in Southwestern and Central regions, farmers experience relatively smaller difference in seasonal prices, ranging 30-40% (Mbowa et al., 2012). This contrasts the Northern and Eastern regions, where seasonal prices can differ as much as 100% (Mbowa et al., 2012). During the exceptionally dry seasons, August-September of 2009 and 2010, raw milk prices were twice higher than a typical dry season. The seasonality patterns impact both farmers and processors, and it perhaps is in great needs of a solution that can possible be achieved when these value chain actors can collaboratively work together.
5.1.2. Milk Collection and Trade
Milk collection and trade in Uganda had a rather “unbalanced” development trajectory in the post-liberalization era. Since the early 1990s, there has been significant investment in reviving milk collection infrastructure, initially controlled by the state-owned firm DCL, later by SALL

30
after privatization in 2006 (Mbowa et al., 2012). With respect to value chain operators, privatization, however, led to a fragmented and loosely connected large number of small independent milk collectors. Including the processing industry, the resulting multi-channel milk collection and trade system leads to a complicated market system (Figure 12). While the dairy processing industry, crucial to produce exportable dairy products, is undersupplied throughout the year, the “informal” market channels that directly supply ‘raw’ or ‘boiled milk to consumers have emerged as the dominant market players, accounting for 80-85% of milk markets (Balikowa, 2011; Makoni et al., 2014). Figure 12: Overview of Milk Collection and Trade Channels in Uganda
Source: Authors Since the early 1990s, public investment in MCCs, mainly financed by funding from the government and international development agencies (ADF, 2011; Mokoro Ltd, 2006), has remarkably improved milk collection infrastructure; in 2012, there were approximately 170 MCCs in the country (Balikowa, 2011; Toye, 2012). Milk collection infrastructure, however, has concentrated in the Southwestern (75%) and Central (15%) regions (Makoni et al., 2014; Toye, 2012). These regions represent the traditional supply and infrastructure base of DCL, now controlled by SALL, now Brookside Dairy. While these initial investments later helped SALL’s prominence with respect to infrastructure capabilities for milk collection, the other emerging processors made little or no investment. SALL, therefore, achieved an enviable control over the milk collection system compared to the other dairy processor (Mbowa et al., 2012). Despite infrastructural improvements, the underdeveloped “relational” capability in supply chain coordination and governance has obviously spurred a rather ‘fragmented and ‘erratic’ milk collection and trade system in Uganda. It is now characterized by ‘at least’ three different organizational structures, each involving different trade relationships and offering varying scopes for value addition and upgrading. First, milk produced in peri-urban areas is directly delivered to consumers without any treatment (e.g., cooling) and in “raw” form. As the shortest chain with limited potential for value addition, this chain accounts for an estimated 20 to 30% of total milk sales in Uganda (Makoni et al., 2014). Directly connecting farmers to urban consumers, a large number of independent small local traders engage this business, typically incurring little or no cost except transportation. They normally do not tend to trade with processors because processors offer them low buying price, and also are slow in their payments while requiring more stringent milk quality standards

31
(Makoni et al., 2014). However, perishability of ‘raw’ milk, and the need to boil milk within 4 to 5 hours of milking, limits the catchment zones of this system to only the areas, located within 20-30 kilometers of major consumption centers (Makoni et al., 2014). While the second marketing channel passes through ‘bulking and cooling’ at MCCs, it by-passes dairy processors and directly delivers milk to households and consumers in urban markets. This system has a wider catchment zone and it accounts for approximately 50-60% of total milk marketed (Makoni et al., 2014). Besides the local traders as in the previous system, this channel engages additional intermediaries, such as roadside bulking centers, transporters, MCCs, wholesalers or associations, and retailers. The wholesalers, mainly Kampala-based, although better resourced than local traders, also lack pasteurizing capability and only ‘boil’ milk before selling it to consumers or a network of retail outlets in urban areas. According to Makoni et al. (2014), there are five registered Kampala-based such retailers that manage a network of outlets and supply a range of urban customers, including shops and restaurants. Only, the third marketing channel involves dairy processors that own and/or operate processing plants and can produce pasteurized packaged dairy products. This is the only channel that can supply dairy export markets within and beyond the region, but it only accounts for the smallest share, or less than 15-20%, or total milk marketed (Makoni et al., 2014). This channel is primarily supplied from the Central and Southwestern regions, where the country’s MMC infrastructure is concentrated and approximately 80% of dairy cooperatives are located (Balikowa, 2011; Mbowa et al., 2012). While the presence of large number of independent local traders create a buffer to the otherwise monopsonistic market power of processors, they limit supply of quality milk to MCCs and the expanding dairy processing industry in the country. Several of the undersupplied MCCs had to at times suspend operations because MCCs’ profitability is highly sensitive to the dairy volume of milk they handle (Toye, 2012). Dairy processors also are faced with a similar challenge of low capacity utilization. The status and recent dynamics in Uganda’s dairy processing sector are presented in the next section.
5.1.3. Milk Processing and Distribution
Over the last decade, Uganda’s dairy processing capacity has grown more than fourfold, but it has not resulted in a comparable increase in quantity and quality of dairy products produced in the country. The processing industry suffers from a chronic underutilization of installed capacity due to a limited supply of quality milk. An exception is, the “process-oriented” business model pursued by JESA Farm that focused on a “trust-based” relation with its milk suppliers. Although the initiative, similar to an ‘outgrower’ scheme, is rather small and only accounts for less than 40% of the company’s milk supply (Toye, 2012), it can offer valuable lessons adaptation and replicability by other processors in the country. Milk processing capacity in the country has expanded from nearly 160,000 at the time of liberalization to 330,000 in 2004, and 1,454,480 liters per day in 2015 (Balikowa, 2011; Bingi & Tondel, 2015; Mbowa et al., 2012). Whereas privatization ended state-control of the processing industry, the industry still remains very consolidated despite the presence of 14 dairy processing
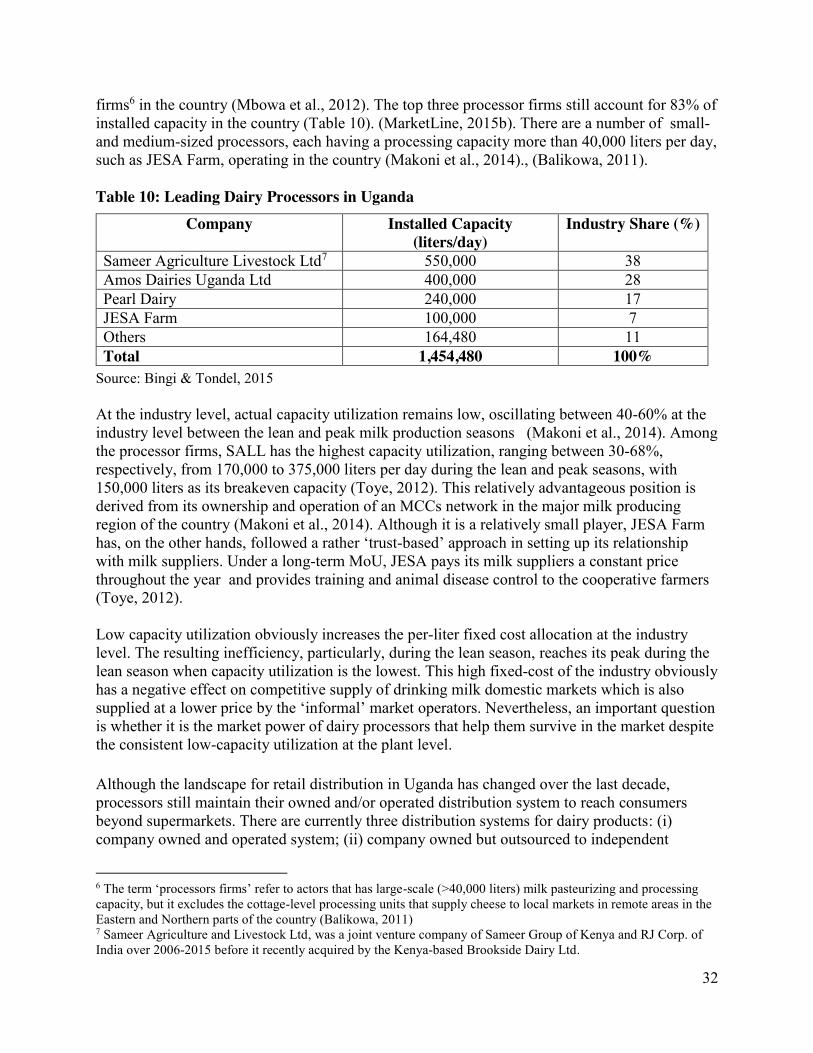
32
firms6 in the country (Mbowa et al., 2012). The top three processor firms still account for 83% of installed capacity in the country (Table 10). (MarketLine, 2015b). There are a number of small- and medium-sized processors, each having a processing capacity more than 40,000 liters per day, such as JESA Farm, operating in the country (Makoni et al., 2014)., (Balikowa, 2011). Table 10: Leading Dairy Processors in Uganda
Company Installed Capacity (liters/day)
Industry Share (%)
Sameer Agriculture Livestock Ltd7 550,000 38 Amos Dairies Uganda Ltd 400,000 28 Pearl Dairy 240,000 17 JESA Farm 100,000 7 Others 164,480 11 Total 1,454,480 100%
Source: Bingi & Tondel, 2015 At the industry level, actual capacity utilization remains low, oscillating between 40-60% at the industry level between the lean and peak milk production seasons (Makoni et al., 2014). Among the processor firms, SALL has the highest capacity utilization, ranging between 30-68%, respectively, from 170,000 to 375,000 liters per day during the lean and peak seasons, with 150,000 liters as its breakeven capacity (Toye, 2012). This relatively advantageous position is derived from its ownership and operation of an MCCs network in the major milk producing region of the country (Makoni et al., 2014). Although it is a relatively small player, JESA Farm has, on the other hands, followed a rather ‘trust-based’ approach in setting up its relationship with milk suppliers. Under a long-term MoU, JESA pays its milk suppliers a constant price throughout the year and provides training and animal disease control to the cooperative farmers (Toye, 2012). Low capacity utilization obviously increases the per-liter fixed cost allocation at the industry level. The resulting inefficiency, particularly, during the lean season, reaches its peak during the lean season when capacity utilization is the lowest. This high fixed-cost of the industry obviously has a negative effect on competitive supply of drinking milk domestic markets which is also supplied at a lower price by the ‘informal’ market operators. Nevertheless, an important question is whether it is the market power of dairy processors that help them survive in the market despite the consistent low-capacity utilization at the plant level. Although the landscape for retail distribution in Uganda has changed over the last decade, processors still maintain their owned and/or operated distribution system to reach consumers beyond supermarkets. There are currently three distribution systems for dairy products: (i) company owned and operated system; (ii) company owned but outsourced to independent
6 The term ‘processors firms’ refer to actors that has large-scale (>40,000 liters) milk pasteurizing and processing capacity, but it excludes the cottage-level processing units that supply cheese to local markets in remote areas in the Eastern and Northern parts of the country (Balikowa, 2011) 7 Sameer Agriculture and Livestock Ltd, was a joint venture company of Sameer Group of Kenya and RJ Corp. of India over 2006-2015 before it recently acquired by the Kenya-based Brookside Dairy Ltd.

33
entrepreneurs; and (iii) grocery retailers and modern supermarkets. In 2006, SALL outsourced its distribution activities to independent small enterprises that operate SALL’s retail outlets and are given exclusive distribution rights in specific market areas within Kampala and across the country(Balikowa, 2011). Small and medium-sized processors have also adopted the outsourced distribution model although some still internally run company-owned retail outlets (Balikowa, 2011). Supermarket retailers, dominated by multinational chains, such as Uchumi, Nakumatt, Tuskys, Shoprite and a few local chains, such as, Quality Supermarket, Capital Shoppers, generally contract dairy manufacturers (URWA, 2014). They consider dairy a key product line and market a range of dairy products manufactured by local and regional dairy processors: pasteurized milk (SALL, JESA); UHT milk (SALL, JESA, Brookside, Kenya Cooperative Creameries Ltd); powdered milk (Nido from Nestle, SALL); yogurt (SALL, JESA, Brookside); and cheese (Paramount, foreign suppliers) (Toye, 2012). For small retailers, UHT milk is the preferred product to avoid the need for refrigeration. Cold chain is not adequately developed in the country and some processors do not have the capability to deliver pasteurized milk in refrigerated trucks.
Uganda has been identified as one of the 20 Markets of the Future that will offer the most opportunities for consumer goods companies(Euromonitor, 2015). Uganda’s modern retail outlets are expected to increase their sale of dairy processed products at 11% CAGR during 2013-18 (Figure 13). A young and growing population, with one of the fastest economic growth rates in Africa and strong purchasing power in the capital Kampala is anticipated to augment sales of consumer goods across all categories (Figure 13). Figure 13: Uganda's Largest Categories of Consumer Products, 2013 Sale Values and 2013-08 Projections
Source: Euromonitor International, 2015

34
5.2. Rwanda
Unlike Uganda, the dairy industry in Rwanda has a rather short history. Prior to the conflict in the early 1990s, Rwanda’s fledgling dairy industry, constituted of just two small dairy firms, Laiterie de Rubirizi Milk established in 1985, and Laiterie de Gishwati Milk in 1988(Gathani & Stoelinga, 2013). During the conflict, the processing capability and the country’s cattle stock were devastated. Following the end of genocide in 1994, the modern dairy industry was founded, and by the early 2000s, the government starkly transformed the country’s economic policies as a specific effort improve investment climate and engender private-sector driven growth. This policy transformation was a major inflection point from the traditional import substitution and state-controlled economy towards increased liberalization and privatization in manufacturing and agribusiness sectors. The new policy environment and targeted public investment stimulated strong growth since the mid-2000s. Investment by the Government of Rwanda (GoR), international development agencies, and the private sector has improved capabilities in milk production, collection, as well as processing. Various initiatives, but very specifically, the “one cow per poor family” or Girinka program, has helped create a dairy sector in which very large numbers of farm families participate (Klapwijk et al., 2014). Alongside Girinka, the Dairy Cattle Development Support Project, which supported construction of MCCs across the country, provided the impetus needed to rapidly drive the industry forward (ADF, 2011). In the dairy processing segment, private investment, led by Inyange Industries, has tripled processing capacity in the country since the early 2000s, reaching 160,000 liter per day in 2014 (Bingi & Tondel, 2015; Makoni et al., 2014). A major investment was Inyange’s development of Tetra Pak packaging capabilities, allowing it to emerge as one of the leading dairy processing firms in the region. Currently, a number of challenges threaten further sustainable expansion of the industry and the ability to realize the potential of regional markets. Rwanda is a small landlocked country with particular natural resource constraints. Dairy farming in Rwanda, mainly reliant on intensive stall feeding system, therefore, should have access to higher value markets to remain profitable (Makoni et al., 2014). Low per capita consumption, estimated 40 liters per capita (FAOSTAT, 2015), limits domestic market opportunities although the national program, One Cup of Milk per Child program, launched in 2010, and innovative distribution models recently set up by the private sector in 2014, stride to stimulate domestic demand. A price-sensitive consumer base has also favored the lower-cost informal dairy channels, often leaving MCCs and processing plants to operate well below installed capacity. The current status and recent dynamics in Rwanda’s dairy industry are discussed in detail in the following sections.
5.2.1. Milk production
The same as in Uganda, an extensive growth strategy, relying on expansion of cattle stock, provided the impetus for growth in milk production in Rwanda. As a relatively smaller but densely populated country, Rwanda, however, faces much more natural resource constraint than Uganda. Rwanda cannot support widespread open grazing system, particularly, in areas of the country with better access to urban markets. Accordingly, zero-grazing is more common in Rwanda and was promoted by government policy, which imported exotic breeds for distribution

35
to dairy farmers. In Rwanda, the predominantly small-scale dairy farms face several challenges, including unreliable markets, milk quality issues, together with higher production costs. In the past 15 years, Rwanda’s milk production has increased more than tenfold, rising from just 58,000 tons in 2000 to approximately 700,000 tons in 2014 (CountrySTAT, 2015). This astonishing growth was achieved primarily by expanding the cattle population through major national restocking program, popularly, known as, “One Cow Per Poor Family.” Since its launch in 2006, the program has distributed more than 200,000 dairy cattle, nearly a fifth of the country’s total cattle stock, estimated 1.14 million heads in 2014 (MINAGRI, 2016). The program aims to reach a target of 350,000 cows distributed by the end of 2017. Limited landholdings, on average of 0.7 hectares per household at the national level, however, restrain significant expansion of per-household cattle stock in the country; farms own on average two cows (Makoni et al., 2014). Although the restocking program imported cattle breeds of improved genetics to country, the indigenous breed still is dominant, accounting for 70 % of total cattle stock in the country (Makoni et al., 2014). The pure- and cross-breeds have milk productivity, respectively, 6.7 and 4.6 liters per day compared to the local breed with a potential milk productivity of 1.2 liters per day (USAID, 2015, 2016). Despite the dominance of small-scale production, a handful of large dairy farms, mainly keeping exotic breeds, have been established in Kigali peri-urban areas(Makoni et al., 2014). There are at least three distinctly different feeding systems across the country: First, open grazing is common in the remote Northern t and Northwestern regions because of land availability. Milk production in this system, and elsewhere in the country, is largely influenced by rainfall conditions, leading to seasonal variations in milk supply and prices. Milk production has shrunk by nearly 11% in 2002/03 and 13% in 2007/08, both major drought years in Rwanda; the negative impact on milk yield was even higher: 18.3 percent and 20.8 percent drops in milk yield in these same years, respectively (World Bank, 2015). However, reliable market access is a major issue for dairy farmers in these regions although IAAKIB cooperative and Blessed Dairy Ltd has connected milk supply from this region with the demand in Kigali and also the neighboring country Democratic Republic of Congo (Makoni at al., 2014; USAID 2013). Second, the mixed livestock-crop grazing system, country is the dominant feeding system in the country, particularly in the Eastern region where landholdings are large and allow fodder production (Makoni et al., 2014). Dairy farming in this system is also challenged by the poor access to clean water, land degradation, and protracted drought. Third, aligned with the government policy, zero-grazing, or intensive farming, is common in Kigali peri-urban areas as well as in the Southern and Western regions of the country. In the absence of readily accessible pastureland in peri-urban areas where land shortage and population pressure are paramount, this system is inevitable. Although farmers in this system bear the highest production costs, and they are affected the most by seasonal milk prices because they
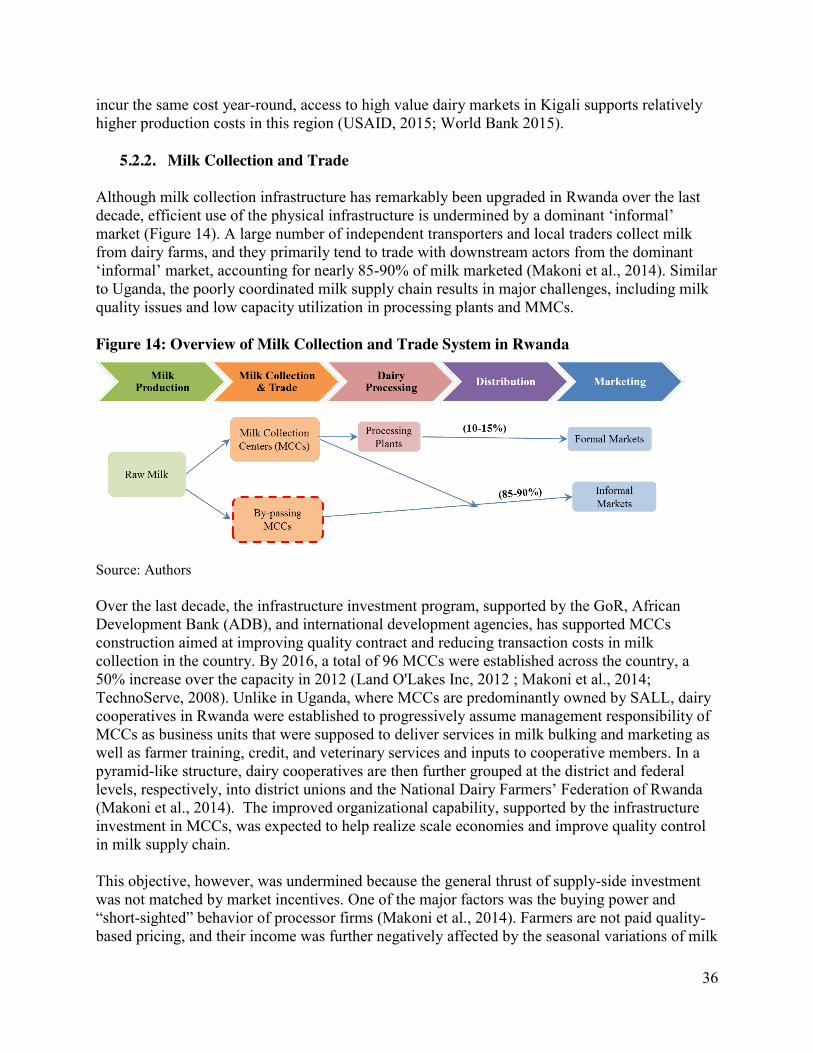
36
incur the same cost year-round, access to high value dairy markets in Kigali supports relatively higher production costs in this region (USAID, 2015; World Bank 2015).
5.2.2. Milk Collection and Trade
Although milk collection infrastructure has remarkably been upgraded in Rwanda over the last decade, efficient use of the physical infrastructure is undermined by a dominant ‘informal’ market (Figure 14). A large number of independent transporters and local traders collect milk from dairy farms, and they primarily tend to trade with downstream actors from the dominant ‘informal’ market, accounting for nearly 85-90% of milk marketed (Makoni et al., 2014). Similar to Uganda, the poorly coordinated milk supply chain results in major challenges, including milk quality issues and low capacity utilization in processing plants and MMCs. Figure 14: Overview of Milk Collection and Trade System in Rwanda
Source: Authors Over the last decade, the infrastructure investment program, supported by the GoR, African Development Bank (ADB), and international development agencies, has supported MCCs construction aimed at improving quality contract and reducing transaction costs in milk collection in the country. By 2016, a total of 96 MCCs were established across the country, a 50% increase over the capacity in 2012 (Land O'Lakes Inc, 2012 ; Makoni et al., 2014; TechnoServe, 2008). Unlike in Uganda, where MCCs are predominantly owned by SALL, dairy cooperatives in Rwanda were established to progressively assume management responsibility of MCCs as business units that were supposed to deliver services in milk bulking and marketing as well as farmer training, credit, and veterinary services and inputs to cooperative members. In a pyramid-like structure, dairy cooperatives are then further grouped at the district and federal levels, respectively, into district unions and the National Dairy Farmers’ Federation of Rwanda (Makoni et al., 2014). The improved organizational capability, supported by the infrastructure investment in MCCs, was expected to help realize scale economies and improve quality control in milk supply chain. This objective, however, was undermined because the general thrust of supply-side investment was not matched by market incentives. One of the major factors was the buying power and “short-sighted” behavior of processor firms (Makoni et al., 2014). Farmers are not paid quality-based pricing, and their income was further negatively affected by the seasonal variations of milk

37
prices (Land O'Lakes Inc, 2012 ). Thus, dairy farmers opted to supply the ‘informal’ markets and tended to avoid a consolidated dairy industry, which remained undersupplied and accounted for less than 20% the milk market (Makoni et al., 2014). The ‘informal’ market and involves a large number of independent entrepreneurs. Although the resulting market structure spurs competition and dilutes buying power of processors in an otherwise highly concentrated industry, it imposes unintended high transaction costs on the system:
x First, milk handled by local transporters is often adulterated and transported under unhygienic conditions, leading to a major barrier to improve quality milk supply to the processing market (USAID, 2015). It is partly because the processing industry has not yet been able to introduce quality-based pricing although it does already require more stringent quality standards than the competitors in the alternative markets. Milk transfer from the farms to MCC, satellite milk aggregation points, or other buyers is undertaken by milk transporters who collect and mix milk from several farmers (Makoni et al., 2014). Despite training of milk farmers and transporters on hygiene and best practices in milk handling by several development programs, such as the East Africa Dairy Development Program (EADDP), Rwanda Dairy Competitiveness Program II (RDCP II), and Netherlands Development Organization (SNV), and the related policy action by the GoR , banning milk transportation in plastic jerry cans, quality control is still a challenge for dairy processors and total bacteria count (TBC)8 levels affect milk suitability for production of shelf-stable products, such as UHT and milk powder (Makoni et al., 2014). This strongly influences the quality of processed products and the ability of dairy industry to produce exportable products, meeting harmonized regional standards (Bingi & Tondel, 2015).
x Second, the alternative or ‘informal’ markets often lead to low capacity utilization for MCCs that have to operate at far below installed capacity. A large number of MCCs fail to operate at profit, mostly as a consequence of collecting insufficient milk. At times for MCCs, failure to collect breakeven milk quantities (2,000 or 2,500 liters/day) has led to suspension of their operations. According to Land O'Lakes Inc (2012 ), 21 of the 61 MCCs had suspended operations in 2011 while the remaining that were active were operating at variable utilization capacity, each on average selling 1,123 liters per MCC per day in 2011. The absence of value chain coordination capability of processor firms and demand conditions facing dairy farmers are obviously the underlying factors, inflicting these inefficiencies upstream in the value chain.
5.2.3. Milk Processing and Distribution
Although milk processing capacity in Rwanda has increased since the early 2000s, capacity utilization at plant level remains very low. The underlying factors are limited supply of quality milk and a fragmented milk collection and distribution system in domestic market, similar to that in Uganda. The ‘informal’ distribution channels control over 80% of milk market while the
8 Doyle et al. (2015) has illustrated that the mean total bacteria count (TBC) of transporters, MCCs, and kiosk samples were 670,000 (colony forming unit per milliliter) CFU/ml (SD± 1,100,000), 1,500,000 CFU/ml (SD± 930,000), and 9,800,000 CFU/ml (SD± 8,900,000), respectively, and greater than the 200,000 CFU/ml that makes raw milk unsuitable for HUT production (Jaffee, 2011)

38
processing industry struggles with low capacity utilization, high cost of packaging materials, and limited scope and reach of the retail distribution networks. Recent positive developments, although small steps, in distribution network were the establishment of “milk zones” by Inyange Industries and Blessed Dairy’s supply contract from RwandAir. Total dairy processing capacity in Rwanda has tripled over the last 15 years, reaching 160,000 liters per day in 2014 (Bingi & Tondel, 2015). The processing industry in the country consists of just six firms. Inyange Industries Ltd is the dominant leader, controlling over 60% of total installed capacity. The medium sized processors are Masaka Farms, Nyanza Dairy and Blessed Dairy, each individually processing less than 10,000 liters per day (Makoni et al., 2014). Additionally, there are 15 registered cheese-processing associations, concentrated primarily in the Western Region of the country (Bingi & Tondel, 2015). Rwanda’s processing industry still accounts for a very small share of dairy market in the country. Less than 10-15% of the total milk marketed is processed in Rwanda although an estimated 30% was of total market milk was reportedly channeled through MCCs (Land O'Lakes Inc, 2012 ; Makoni et al., 2014). Currently, Rwanda manufactures a limited range of dairy products. Inyange mainly produces pasteurized whole and skimmed milk, fermented milk, UHT milk, fresh cream and yoghurt. Masaka Farms, Nyanza, and Blessed Dairy, relatively small producers, mainly produce yogurt, mozzarella cheese, and fresh cream (Makoni et al., 2014). Yogurt, whether flavored and plain, accounts for over 90% and 50%, respectively, of Masaka Farms and Blessed Dairy portfolio (Abreu, 2015; Blessed Dairy, 2015), although Inyange and Masaka are the main players in the yogurt segment. In the fluid milk market, a largely undifferentiated commodity product, the processing industry faces tough competition from the ‘informal’ sector, which offers a cheaper alternative which is popular among local customers due to low purchasing power. Rwanda currently lacks the capability to convert surplus milk into powder, a shelf stable product for export markets. For processor firms, including Inyange Industries, supply chain constraints have meant consistent low capacity utilization, particularly in dry seasons (Makoni et al., 2014). To alleviate this supply chain glitch, Inyange Industries in 2012 invested in backward integration, expanded its own cooling and storage infrastructure, and entered into a milk supply contract for a minimum of 35,000 liters a day with Nyagatare Farmer Union located in the Eastern Region (Makoni et al., 2014). Inyange Industries, a subsidiary of CVL group, has access to substantial managerial and financial resources (Gathani & Stoelinga, 2013; The SERVICEMAG, 2013). For Inyange, and the other dairy processors, supply of quality milk is a critical challenge leading to very low capacity utilization, estimated at 20% at the industry level (Makoni et al., 2014). Low capacity utilization obviously increases the per-liter fix cost of processed milk products and it has been a challenge for both processors and MCC units in Rwanda. The cost of Rwandan milk doubles if processed through the ‘formal’ channels (USAID, 2016). Besides inefficiencies in milk collection and processing, competitiveness of processed or pasteurized packaged milk in Rwanda is negatively affected by the high cost of packaging (Makoni et al., 2014). For the smaller firms, that do not have the scale efficiency of Inyange in procuring inputs, the packaging cost ranges between15-20% of the total production costs even for the yogurt cups (Abreu, 2015). Polythene-based packaging, banned in Rwanda, costs one-tenth of the Tetra Pak packaging for

39
drinking milk products (MINAGRI, 2013). Partly driven by the costly packaging, the retail price of pasteurized packaged milk then becomes inevitably high, marketed in Kigali for US$1 to US$1.2 per liter compared to boiled milk for only US$0.45 per liter, 160% retail price difference (Makoni et al., 2014). The wedge is a challenge for processors to gain market share, and it undercuts competitiveness of the ‘formal’ dairy actors in a consumer market that is largely price sensitive. Dairy products reach consumers through several distribution outlets, such as supermarkets, hotels, restaurants, and recently also RwandAir. Pasteurized milk, UHT, and yogurt are normally distributed through supermarkets while cheese and fresh cream are mainly marketed through hotels and restaurants (Abreu, 2015; Blessed Dairy, 2015). Since 2015, Blessed Dairy has also entered into a contract to supply RwandAir 600 yogurt cups per week (Nsekanabo, 2015). To expand the sale of processed milk, a recent innovative distribution strategy, launched by Inyange Industries in 2014, has been the introduction of “milk zones,” or franchised outlets. In contrast to pasteurized packaged milk distributed through supermarkets, the “milk zones” retail ‘unpackaged’ pasteurized milk at about half the price while consumers bring in their own containers. Within 18 months of its launch, Inyange Industries had established 70 milk zones, with daily sales of pasteurized milk reaching 28,000 liters—an increase of 17,000 liters per day (Makoni et al., 2014). The strategy has strongly enhanced price-competitiveness of processed milk and made the product more accessible through a scattered distribution network, resembling competitors in the ‘informal’ market. The latter consists of approximately 1,500 kiosks, scattered around Kigali, that mostly retail ‘raw’ or ‘boiled’ milk directly to consumers (Makoni et al., 2014). Quality and safety is a major difference of the ‘formal’ distribution channel from the ‘informal’ market, which by its nature restricts the ability to monitor and enforce quality standard. In the ‘formal’ market, Rwanda Bureau of Standards (BRS) regularly conducts inspection and testing. Noncompliance has led to shut down of dairy processing plants and/or removal of dairy products from the market. RBS also helps train quality control teams in processing companies. Supported by these programs, Inyange Industries acquired ISO 22000-2005 in 2012, and Blessed Dairy acquired Hazard Analysis and Critical Control Point (HACCP) certification in 2014, a competitive advantage for its supply contract with RwandAir in 2015 (Nsekanabo, 2015; USAID, 2016).
6. Recent Developments in Rwanda’s Industry Governance and Regional Integration Initiatives
6.1. “Firm-driven” regional integration of the dairy industry in East Africa Recent investment in Uganda by the leading regional firm(s) is major milestone to strengthening regional integration and trade in dairy value chains. Brookside Dairy Ltd’s acquisition of SALL in Uganda in 2015, has set the stage for increased regional dairy trade more through an ‘industry- or firm-driven’ angle for the regional integration, building upon the regional market integration efforts over the last decade. As the largest dairy firm in East Africa, with US$176 million revenue in 2013 (PrivCo, 2015), Brookside has attracted investment to the East African from the
40
leading global firm, Danone, which purchased a 40% stake in Brookside in 2014 (MarketLine, 2015b).
This recent investment provides Brookside, and its regional milk supply base, a platform with strong capabilities in product innovation and branding as well as distribution networks within and beyond the East Africa region. Brookside Dairy now has access to Danone’s innovation team and can locally manufacture its product range, including yogurts, such as Activia and Actimel that can be modified to local dietary needs and consumer preference (EMIS, 2015). It can also be used to tap the strong distribution network that Danone has in North Africa, where its local brand, Centrale Laitiere, controls 60% of dairy market in Morocco; and in West Africa through its Fan Milk brand in six countries, including Nigeria and Ghana (MarketLine, 2015a).
Additional investments came from the Indian company, Amos Dairies Ltd. a greenfield investment creating Amos Dairies Uganda Ltd for an estimated US$25 million in 2013 (Bingi & Tondel, 2015; Bloomberg, 2016). Other leading multinational dairy firms have shown interest in the Eastern African dairy sector. Nestle has launched piloting milk quality improvement schemes in Western Kenya and was considering expansion in the region to enter the dairy industry in Uganda, Rwanda, and Tanzania. Box 3: Brookside Dairy Limited Following the deregulation of the dairy industry in Kenya in the 1990s, Brookside Dairy Ltd was founded and began operating as a mini-dairy in 1993 (Euromonitor International, 2016). Today, it is the largest dairy firm in East Africa. It has reached this prominent position through both organic and acquisition-led growth. It has recently sought to expand its presence within and outside East Africa to maintain its established leadership in the region. In 2013, Brookside Dairy first set up its branches in Uganda and Tanzania. It managed to attract investment from one of the leading global dairy firms, Danone Groupe, in 2014, and it acquired the leading Ugandan dairy processor, SALL, in 2015 (MarketLine, 2015b). These recent acquisitions provided Brookside a strong milk supply source in the region and a strong distribution network within and beyond the region. Brookside has also been able to raise money from a range of other investors, such as: Aureos Capital, a private equity fund, present in Mauritius and South Africa; Dubai-based private equity firm Abraaj Group (Bingi & Tondel, 2015). By 2016, Brookside has progressively strengthened its value chain capabilities in the region, commanding a processing capacity of over 2 million liters per day in Kenya and Uganda (Bingi & Tondel, 2015).
6.2. Emergence of public-private collaboration in industry governance Since liberalization of EAC dairy industries began in the 1990s, a range of dairy institutions at the local, national and regional levels have emerged (Kurwijila & Bennett, 2011). A distinct characteristic of recent trend in Rwanda is the prominent role afforded to private sector in industry governance and development. Founded in 2014, the Rwanda National Dairy Platform (RNDP) has replaced the traditional National Dairy Board. This development is unique. It is different from the previously established private-sector-led institutions, i.e., farmer cooperatives, the National Dairy Farmers’ Federation of Rwanda (NDFFR), Nyagatare Dairy Farmers Union, or the associations of dairy traders, Milk Sellers Association (Makoni et al., 2014). First, as an

41
umbrella organization, RNDP represents all value chain operators, including supporting service and input providers, such as the feed manufacturers, livestock producers, breeders, and agro-input dealers. Second, it has direct and easy access to high level policy making bodies in the government; RNDP is directly under the Private Sector Federation (PSF), and then the Rwanda Development Board. This feature can help better coordinate policy action and private investment and position RNDP to effectively serve as a platform coordinating the initiatives by Rwandan government, industry actors, and NGOs that support the dairy sector in the country. This contrasts the trend in Uganda where the Dairy Development Authority (DDA) has continued to predominantly maintain its post-liberalization mission. The DDA was established by the Dairy Industry Act in 1998 and mandated to develop and regulate Uganda’s dairy industry. Specifically, it is tasked to coordinate implementation of all government policies, focused on self-sufficiency in production of milk. The other dairy institutions in Uganda are the Uganda National Dairy Traders Association (UNDATA) and the Uganda Dairy Processors’ Association (UNDPA), respectively, established in 1999 and 2003 (Balikowa, 2011; Mbowa et al., 2012). Although the country had a farmer associations, the Uganda National Dairy Farmers Association (UNDFA), this has recently become inactive due to financial constraints (Makoni et al., 2014). The recent institutional development trends for the dairy industry in Rwanda will likely lead to more participatory policy-making processes and industry governance, more effectively incorporating the perspectives of public and private actors. While the participatory policy making processes can be complex and involve protracted processes before reaching consensus and policy decisions, the resulting policies are likely to have higher feasibility of implementation and the needed buy-in from the implementing stakeholders. 6.3. The ‘de facto’ compliance to regional quality standards has been challenged by
capability gaps in the industry Whereas both Rwanda and Uganda, and the other EAC countries, have approved the harmonized EAC Protocol on Sanitary and Phytosanitary (SPS) measures, none has yet ratified these measures. Effective implementation has proven challenging for a number of reasons. First, the principle of mutual recognition of national quality marks and SPS certificates is not always applied to regional trade in food products, especially, dairy (Jensen & Keyser, 2010). This leads to cumbersome testing and certification procedures. Second, a more important challenge is compliance capability of ‘smallholder’ dairy farmers, who dominate milk production in the region, as well as the large network of milk traders and/or transporters, who operate in the pervasive ‘informal’ milk markets. Due to the absence of quality-based payment system in the dairy markets, dairy farmers broadly lack market incentives to upgrade their operations. Actual implementation of harmonized regional standards purely through regulation and inspection has, therefore, proven problematic. The implementation process still remains a work in progress. Although national agencies have taken the initiative to bridge the capability gap, the effort needs longer-term sustainable investment. After a successful pilot implementation in Kenya, a training and certification (T&C) scheme has been up-scaled in the country and also expanded to Uganda and Tanzania (Blackmore, Alonso, & Grace, 2015). It still remains in its nascent stages. Under the scheme, and

42
for an affordable fee, a group of accredited service providers offer training on hygienic milk handling, quality control and entrepreneurship. The trainees then receive official certification, registered as qualified milk traders, and issued license to operate in the sector. The stakeholders involved in the T&C scheme are regulatory agencies and the business service providers. The scheme, however, does yet not directly involve large dairy processors (Cherono, Kurwijila, & Omore, 2012). Not directly engaging the dairy processors through the T&C scheme, and the regional standard development processes, has obviously been a missed opportunity and resulted in implementation and enforcement barriers due to the mismatch between the adopted standards and the capabilities in the industry. The process for regional harmonization of standards, led by the East African Dairy Regulatory Authorities Council (EADRAC), basically constituted from the National Dairy Boards in 2006, did not directly involve the broader range of value chain stakeholders responsible for adoption, implementation and enforcement of regulations and quality standards in the dairy sector (Jensen & Keyser, 2010). Instead, it had a predominantly technical focus; EADRAC, assisted by the Association for Strengthening Agricultural Research in Eastern and Central Africa (ASARECA), and the International Livestock Research Institute (ILRI), have led the process. A more private-sector oriented institution, the East and Southern Africa Dairy Association (ESADA), primarily led by processors, had emerged, more as a parallel agency, since 2004(Bingi & Tondel, 2015; Jensen & Keyser, 2010).

43
7. Potential Upgrading Trajectories: Policy and Strategy Recommendations
7.1. Summary Upgrading Challenges and Opportunities This section presents summary findings from the preceding analysis at the country-level and recent trends in the region. It is aimed to synthesize the common and some of the major country-specific Strengths, Weaknesses, Opportunities, and Threats (SWOT). In the subsequent sections, this summary is followed by outlining potential upgrading trajectories and policy and strategy recommendations that focus on realizing the potential upgrading opportunities. Table 11: 'SWOT' Characterizing Dairy Value Chains in Uganda and Rwanda
Strengths Weaknesses x Growing regional trade and private investment
in dairy industry x Investment by lead regional/global firms in
dairy industry in Uganda x Common external tariff (CET) of 60% on milk
and milk products x Large and growing cattle stock and an
established infrastructure base for milk collection
x Adequate pastureland and low-cost feeding system in milk production in Uganda
x Poor capability of dairy processors in supply chain coordination
x Underdeveloped distribution network and an ‘informal’ market that accounts for 80-90% of milk marketed in Uganda and Rwanda
x Consistent low capacity utilization of processing plants and MCCs due to limited supply of quality milk
x Low milk productivity and high investment risk facing dairy farmers
Opportunities Threats x RNDP can enhances coordination in policy
action and private investment in Rwanda x Investment by lead regional/global firms in
dairy industry in Uganda x Strong economic growth in the region and rising
purchasing power of EAC citizens x Wider regional trade and collaboration through
annual conferences organized by the ESADA
x Abrupt policy changes targeting industry operations, particularly, adherence to quality standards
x Trade barriers ‘selectively’ imposed and justified by noncompliance to harmonized regional standards
x Very concentrated industry becoming even more consolidated by M&A in the absence of strong regulatory capabilities
x Market oversupply due to a slow growing domestic demand and rapidly growing milk supply in Rwanda
x Droughts and extreme seasonal variations in milk supply and prices

44
7.2. Potential Upgrading Trajectories The Rwandan and Ugandan dairy industries have accomplished major milestones in increasing milk production, expanding milk collection infrastructure, and attracting private investment in processing plants. While these achievements, coupled with improvements in regional trade institutions and policy environment, created the foundation for potential growth in regional trade, Rwanda and Uganda can realize this potential if they further strengthen industry competitiveness and address inefficiencies that arise from the dominant ‘informal’ dairy markets in the respective countries. Specifically, the industry stakeholders should concentrate on the following upgrading trajectories.
1. Functional upgrading in Rwanda and Uganda to expand processing capability and manufacturing of exportable dairy products. Participation in export markets entirely depends on processing capabilities to convert milk into exportable dairy products – mainly preserved or dried products. Although milk production has rapidly grown in Rwanda and Uganda over the last decade, industry stakeholders should investment in expanding capabilities in processing industry to channel the additional milk supply to export markets. This is more urgently needed in Rwanda where a small domestic market necessitates access to export outlets. Combined with further investment in installing plant capacity, value chain governance in upstream segments needs to be strengthened to allow processors secure sufficient volume of quality milk suitable for manufacturing of exportable products.
2. Organizational upgrading in Rwanda and Uganda to ensure sufficient supply of quality milk to dairy processing plants. Although milk production has rapidly grown in Uganda and Rwanda over the last decade, it does not adequately reach processing plants. Processors struggle to secure sufficient supplies of quality milk and they generally operate at far below capacity. This challenge is a major source of inefficiency, contributing to higher product prices, and thus lower competitiveness of processed dairy products vis-à-vis the ‘informal’ markets. Working in collaboration with dairy farmers and/or milk suppliers, processors have to ‘reconfigure’ their upstream trade relationships so that they can manage systemic risks emanating from the seasonal boom-bust cycles in milk supply and prices.
3. Process upgrading to ensure adherence to the EAC harmonized dairy standards. Whereas both Rwanda and Uganda, and the other EAC countries, have adopted harmonized regional standards, implementation of the adopted protocols is predominantly challenged by capability constraints in milk collection, transport, and trade upstream the processing segment. Process upgrading in these value chain activities is not just critical to compliance with harmonized quality standards but also to increasing quality milk supplies to the processing industry. A more sustainable and inclusive solution demands simultaneous regulation and capability enhancement for a large network of independent and predominantly small entrepreneurs—loosely connected through local or national networks of traders, transporters, wholesalers, and retailers—that now control at least 80% of milk trade and markets in Uganda and Rwanda.

45
4. Market upgrading in Rwanda and Uganda to increase market share of processed dairy products. Market growth for processed dairy products is competitively challenged by the low-cost ‘informal’ supplies in both Uganda and Uganda. Local traders in the ‘informal’ markets incur little or no cost except transport in their operations. Adjustment to a more demand-driven marketing strategy is needed for dairy processor so they can better understand dynamics in the EAC markets and then more effectively segment their marketing strategies, especially, to serve preferences of the more price-sensitive consumers in drinking milk markets, primarily served by informal operators.
7.3. Policy and Strategy Recommendations
7.3.1. Functional upgrading: The EAC countries should pursue joint regional investment promotion strategies to expand regional capabilities in manufacturing of exportable dairy products. Recent dynamics in the U.S. and EU dairy industries offer opportunities to attract further investment and has actually led to investment in dairy processing industry in the region. For instance, Danone’s invested in Brookside Dairy, and they jointly have expanded their footprint in the region. The EAC countries, however, can strengthen their negotiation position in dealing with these large global firms if they follow a regional investment strategy and negotiate investment deals as a ‘regional block.’ Under certain conditions, which strongly depend on the bargaining position of the EAC countries in negotiating the deals, these investments could provide very effective vehicles to develop the capabilities of dairy processing industry in the region. These could be targeting foreign investment to fill capability gaps in specific areas related to innovation and product development, distribution and marketing, and backward linkages to strengthen milk-dairy supply chains in the EAC countries. The plausible alternatives for these investments, perhaps, could be that the investor firms import milk powder or other dairy ingredients from outside the region and then locally manufacture dairy products for regional and extra-regional markets in Africa. 7.3.2. Organizational upgrading: Improve governance in trade relationships between processing and dairy farm segments in the chain. The intervention goal should be to minimize the currently high risk of opportunistic behavior for both sides of the transaction, dairy processors and milk suppliers. A one-sided policy intervention to directly target eliminating the ‘symptom’ of the problem, i.e., the pervasive ‘informal’ actors, cannot resolve the challenge. A range of successful experiences from within and outside the region can help plan pilot interventions to shift this upstream governance typology towards a ‘trust-based’ and/or ‘relational governance model:
i) The regional experience suggests that it is not necessarily only the price of ‘raw’ milk paid to farmers. For instance, Casaburi and Macchiavello (2015) illustrated that ‘trustworthiness’ can better position dairy processors to secure adequate supply of quality milk even at lower prices than competitors provided that they focus on building farmer capabilities, in this case, addressing saving constraints of farmers in Kenya.
46
ii) Findings from the dairy GVC analysis suggest strengthening the capability of dairy cooperatives to better ‘negotiate’ long-term supply relations or contracts with dairy processors.
iii) To improve their negotiating power, dairy cooperatives, perhaps, at the national level, can explore economic feasibility of investing and entering into the processing segment. Whereas dairy cooperatives were formed in Rwanda and Uganda over the last years, they are primarily ‘bargaining-only cooperatives.’ The exception is Blessed Dairy in Rwanda that has recently begun producing yogurt that is sold to a range of customers, including, RwandAir. It simultaneously supplies ‘raw’ milk to other processors, including Masaka Dairy and Inyange Industries. In Uganda, UCCCU has obtained the license and been working to install a dairy processing plant in Mbarara (Bingi & Tondel, 2015). These alternative market options strengthen bargaining position of cooperatives/milk suppliers and can facilitate change in upstream governance relationships. The other cooperatives in Rwanda and Uganda, however, have an exclusive operational focus as ‘bargaining-only cooperatives,’ and they inevitably seek to work with the ‘informal’ market operators, practically as the only ‘alternative’ to consolidated processing industry. This supply chain ‘configuration’ is problematic and increases ‘transaction costs’ for the entire industry. Inclusive upgrading is inevitable, and it demands long-term solutions to gradually transition the ‘informal’ to ‘formal’ market through capability building and regulation.
7.3.3. Process upgrading: Train and license milk collectors to improve quality of milk supplied to processors to improve adherence to the EAC harmonized standards. The intervention should primarily target milk collectors/traders/transporters. Because the ‘informal’ market actors dominate upstream segments of the chain, implementing quality control measures inevitably requires transforming the capability of these third-party milk collectors and traders. As the recent regional experience illustrated, regulatory measures and policy directives on their own, although necessary tools, are insufficient to promote compliance to quality standards. A sustainable solution demands simultaneous capability enhancement and regulation. This rather longer-term approach requires intervening on different fronts and involvement of the regulatory agencies, dairy processors, and the milk collectors or their representative associations:
x First, there is the need for capacity building and incentives to drive adoption of reforms by milk collector and traders. The capacity building initiative can build on learning from the pilot T&C scheme initially implemented in Kenya and was later expanded to Uganda as well.
x Second, the role of these intermediary actors should be regulated and they should be assisted with access to affordable finance by industry stakeholders. They need to operate at an appropriate scale and a more stable business environment that justifies investment in equipment and skills needed for adoption of quality standards, e.g., undertaking milk quality testing and inspection as close to the dairy farms as possible.
x Third, processors need to commit and act on quality-based pricing. Lower grade milk is commonly used by processors for pasteurized drinking milk products. Higher quality
47
grades are, however, needed for products intended for longer storage- or shelf-lives. A quality-based pricing system is, thus, more important for processors because access to higher quality milk will only allow them to upgrade and manufacture exportable dairy product categories While it can be initiated by processors’ commitment and action, a quality-based pricing mechanism has systemic advantages, including, in realizing the policy objectives of expanding ‘formal’ dairy market and implementing harmonized regional standards in Uganda and Rwanda.
7.3.4. Market upgrading: Improve opportunities for collaboration between public and private sector actors related to the dairy industry, and between them and the international development programs. Transforming the sizeable ‘informal’ dairy markets to ‘formal’ markets strongly depends on a coordinated approach, especially for interventions listed under 7.3.1-7.3.3. In general, limited availability of statistics and market information in Uganda and Rwanda, like many other developing countries, complicates proper planning and evaluation of alternative policy options and investment decisions. Although this poses a major challenge, the situation is exacerbated by stakeholders not following a coordinated approach that can effectively bring together actors from the public, private, and international development agencies. Establishment of RNDP in Rwanda is a major step in the right direction. In Rwanda, RNDP offers the potential to create a shared vision and a coordinated long-term intervention strategy for market upgrading. Although it is still in its early stages of development, it could potentially grow into a strong mechanism to coordinate policy action, private investment, and financial allocations by donor programs, still an important source of fund for the dairy industry in the region. While national platforms could help address some of the isolated and more country specific ‘upgrading’ constraints, a similar public-private mechanism could provide the pathway for coordinating regional upgrading efforts, including, a joint investment promotion strategy as well as practical solutions to effectively implement the harmonized regional standards. 7.3.5. There is a need for further research in determining potential for regional trade in dairy-related supporting industries. While this report focused on assessing ‘principle’ segments of the regional dairy value chain, the rising milk production and consumption in the region has obviously helped grow opportunities for regional trade in supporting industries. As outlined in Section 2, a range of supporting industries --from finance to suppliers of manufacturing equipment, packaging material, feed and fodder, veterinary and animal health services, and logistics and cold chain systems-- contribute to competitive functioning of dairy value chains. As the dairy manufacturing industry increasingly expands in all countries across the region, the opportunity for regional collaboration and trade in these supporting industries has also grown, so does the need for better understanding of the situation and dynamics in a priority set of these support industries. The findings from this research point to ‘packaging material’ and ‘cold chain services’ as the two most important supporting industries that could offer potential for regional collaboration.
48
8. References Abdulsamad, A., Stokes, S., & Gereffi, G. (2015). Public-Private Partnerships in Global Value
Chains: Can They Actually Benefit the Poor? Leveraging Economic Opportunities. United States Agency for International Development.
Abreu, E. E. G. (2015, July 2015). [Field Research Dominican Republic. Conjunto Productivo del Coco del la Republica Dominicana].
ADF. (2011). Livestock Infrastructure Support Programme: Appraisal Report. African Development Fund.
Balikowa, D. (2011). Dairy Development in Uganda: A Review of Uganda's Dairy Industry: Food and Agriculture Organization of the United Nations, Ministry of Agriculture Animal Husbandry and Fisheries, Dairy Development Authority.
Banerjee, S. (2008). Strategic brand-culture fit: A conceptual framework for brand management. Journal of Brand Management, 15(5), 312-321.
Beverland, M., Napoli, J., & Lindgreen, A. (2007). Industrial global brand leadership: A capabilities view. Industrial Marketing Management, 36(8), 1082-1093.
Bingi, S., & Tondel, F. (2015). Recent developments in the dairy sector in Eastern Africa: Briefing note No. 78–September 2015, European Centre for Development Policy Management (ECDPM), Maastricht.
Blackmore, E., Alonso, S., & Grace, D. (2015). Legitimising informal markets: A case study of the dairy sector in Kenya.
Blayney, D., Gehlhar, M., Bolling, C. H., Jones, K., Langley, S., Normile, M. A., & Somwaru, A. (2006). U.S. Dairy at a Global Crossroads. Economic Research Report No 28. Economic Research Service. United States Department of Agricultue.
Blessed Dairy (2015). [Field Research in Kampla, Rwanda]. Bloomberg. (2016). Company Overview of Amos Dairies Uganda Limited. Retrieved from
http://www.bloomberg.com/research/stocks/private/snapshot.asp?privcapId=345158134 Burrell, A. (2009). The CAP: Looking back, looking ahead. European Integration, 31(3), 271-
289. Casaburi, L., & Macchiavello, R. (2015). Firm and Market Response to Saving Constraints:
Evidence from the Kenyan Dairy Industry. Cherono, P., Kurwijila, L., & Omore, A. (2012). Commercialized supply of training and
certification in milk quality assurance in eastern Africa: A guide for practitioners. Chimhundu, R., & Hamlin, R. (2007). Future of the brand management structure in FMCG.
Journal of Brand Management, 14(3), 232-239. Chimhundu, R., Hamlin, R. P., & McNeill, L. (2010). Impact of manufacturer brand innovation
on retailer brands. International Journal of Business and Management, 5(9), 10. CLAL. (2016). Farm-Gate Milk Prices Retrieved from: http://www.clal.it/en/?section=latte_usa CountrySTAT. (2015). Distribution of Production of Milk. Retrieved from:
http://www.countrystat.org/home.aspx?c=RWA&tr=7 DairyNZ/LIC. (2015). New Zealand Dairy Statistics 2014-15. Daugbjerg, C., & Swinbank, A. (2009). Ideational Change in the WTO and its Impacts on EU
Agricultural Policy Institutions and the CAP. European Integration, 31(3), 311-327. Douglas, S. P., Craig, C. S., & Nijssen, E. J. (2001). Integrating branding strategy across
markets: Building international brand architecture. Journal of International Marketing, 9(2), 97-114.

49
Douphrate, D. I., Hagevoort, G. R., Nonnenmann, M. W., Lunner Kolstrup, C., Reynolds, S. J., Jakob, M., & Kinsel, M. (2013). The Dairy Industry: A Brief Description of Production Practices, Trends, and Farm Characteristics Around the World. Journal of agromedicine, 18(3), 187-197.
Doyle, M. M., Garcia, S., Bahati, E., Karamuzi, D., Cullor, J. S., & Nandi, S. (2015). Microbiological Analysis of Raw Milk in Rwanda. Afr. J. Food Sci. Technol, 6(5), 141-143.
EMIS. (2015). Brookside Gets Access to French Partner's Flavors. Retrieved from http://www.businessdailyafrica.com/Corporate-News/Brookside-gets-access-to-French-partner-s-flavours-/539550-2905208-cp2308/index.html
Euromonitor. (2015). Euromonitor Global Market Information Database. Retrieved May 2015 Passport Database
Euromonitor International. (2010). Diverse Corporate Strategies to Exploit Opportunities in Global Dairy.
Euromonitor International. (2016). Brooksdie Dairy Ltd in Packaged Food. Passport. European Commission. (2015). EU Milk Market Observatory. Retrieved from:
http://ec.europa.eu/agriculture/market-observatory/milk/ European Union. (2014). Smooth Phasing-Out of the Milk Quotas in the EU. European Union. (2015). EU Dairy Farms Report Based on 2013 FADN Data. FAO. (2015). Milk and Milk Products: Major Dairy Exporters and Importers. Food and
Agriculture Organization of the United Nations. FAOSTAT. (2015). Food and Agricultural Organization of the United Stations. Statistics
Division Gathani, S., & Stoelinga, D. (2013). Understanding Rwanda's Agribusiness and Manufacturing
Sectors. International Growth Center. Gehlhar, M. J., Regmi, A., Stefanou, S. E., & Zoumas, B. L. (2009). Brand leadership and
product innovation as firm strategies in global food markets. Journal of Product & Brand Management, 18(2), 115-126.
Gelan, A., & Muriithi, B. W. (2015). Examining Returns to Scale in Smallholder Dairy Farms in East Africa. Quarterly Journal of International Agriculture, 54(3), 239-261.
Gereffi, G., Humphrey, J., & Sturgeon, T. (2005). The governance of global value chains. Review of international political economy, 12(1), 78-104.
Giles, J. (2015). Change in the EU Dairy Sector Post Quota: More Milk, More Exports and A Changing Farmer Profile.
Gorton, M., Angell, R., Dries, L., Urutyan, V., Jackson, E., & White, J. (2015). Power, buyer trustworthiness and supplier performance: Evidence from the Armenian dairy sector. Industrial Marketing Management, 50, 69-77.
Hanisch, M., Müller, M., & Rommel, J. (2012). Support for Farmers' Cooperatives: Sector Report Dairy: Wageningen UR.
IBISWorld. (2016). Dairy Product Production in the U.S. Jakubanecs, A., & Supphellen, M. (2012). Blank endorsement: The added value of unknown
corporate brands. Journal of Brand Management, 19(9), 788-800. Jensen, M. F., & Keyser, J. C. (2010). Non-Tariff Measures on Goods Trade in the East African
Community. Danish Institute for International Studies. Klapwijk, C., Bucagu, C., van Wijk, M., Udo, H., Vanlauwe, B., Munyanziza, E., & Giller, K.
(2014). The ‘One cow per poor family’programme: Current and potential fodder

50
availability within smallholder farming systems in southwest Rwanda. Agricultural Systems, 131, 11-22.
Kurwijila, L. R., & Bennett, A. (2011). Dairy Development Institutions in East Africa: Lessons Learned and Options. Food and Agriculture Organization of the United Nations (FAO).
Land O'Lakes Inc. (2012 ). Rwanda Dairy Competitiveness Program II (RDCP II): Baseline Survey Report.
Lindblom, A., & Olkkonen, R. (2006). Category management tactics: an analysis of manufacturers' control. International Journal of Retail & Distribution Management, 34(6), 482-496.
MacDonald, J. M., Cessna, J., & Mosheim, R. (2016). Changing Structure, Financial Risks, and Government Policy for the U.S. Dairy Industry. Economic Research Report 205. Economic Research Service. United States Department of Agriculture.
Makoni, N., Redda, T., van der Lee, J., Mwai, R., & van der Zijpp, A. (2014). White gold: Opportunities for dairy sector development collaboration in East Africa: Centre for Development Innovation Wageningen UR.
MarketLine. (2015a). Company Profile: Danone SA. MarketLine. (2015b). MarketLine: Global Market Dataset on M&A in Consumer Goods. Maszák, I. S. (2014). Development of dairy sector related agricultural policies in the European
Union, the way to the 2013 cap reform. International Law(24), 83-111. Mbowa, S., Shinyekwa, I., & Lwanga, M. M. (2012). Dairy sector reform and transformation in
Uganda since the 1990s. Economic Policy Research Centre (EPRC) In Collaboration with Africa Growth Initiative (AGI), Brookings.
Melewar, T., Badal, E., & Small, J. (2006). Danone branding strategy in China. Journal of Brand Management, 13(6), 407-417.
Melewar, T., Small, J., Whitelock, J., & Fastoso, F. (2007). Understanding international branding: defining the domain and reviewing the literature. International Marketing Review, 24(3), 252-270.
MINAGRI. (2013). National Dairy Strategy. Ministry of Agriculture and Animal Resources (MINAGRI), Republic of Rwanda.
MINAGRI. (2016). One Cow per Poor Family Pro-gram “GIRINKA”. Retrieved June 2016, from http://www.minagri.gov.rw/index.php?id=28
Mokoro Ltd. (2006). Evaluation of Danish Aid to Uganda 1987-2005: Thematic Papers Volume 4.
Moreau, R. (2016). Innovations Driving Growth in Yogurt: Greek, Icenlandic and On-the-Go. Retrieved from Passport
Ndambi, O. A., & Hemme, T. (2009). An economic comparison of typical dairy farming systems in South Africa, Morocco, Uganda and Cameroon. Tropical animal health and production, 41(6), 979-994.
Nestle. (2010). Nestle Launches First Floating Supermarket in the Brazilian North Region [Press release]
Nsekanabo, E. (2015). Dairy Takes to the Skies: A Dairy Farmer's Journey to Supplying Rwanda's Largest Airline. Retrieved July 2016, from https://www.landolakesinc.com/Blog/May-2015/Dairy-takes-to-the-skies
OECD/FAO. (2015). OECD-FAO Agricultural Outlook 2015: OECD Publishing. PrivCo. (2015). The Private Company Financial Intelligence. PrivCo Database

51
Schuiling, I., & Kapferer, J.-N. (2004). Executive insights: real differences between local and international brands: strategic implications for international marketers. Journal of International Marketing, 12(4), 97-112.
Singbo, A., & Larue, B. (2015). Scale Economies, Technical Efficiency, and the Sources of Total Factor Productivity Growth of Quebec Dairy Farms. Canadian Journal of Agricultural Economics/Revue canadienne d'agroeconomie.
Swinbank, A., & Daugbjerg, C. (2006). The 2003 CAP Reform: accommodating WTO Pressures. Comparative European Politics, 4(1), 47-64.
TechnoServe. (2008). The Dairy Value Chain in Rwanda. The SERVICEMAG. (2013). Inyange Industries Expected to Breakeven Next Year, (12). 26-28.
December 2012 - February 2013. Toye, O. (2012). Dairy Industry in Uganda: Value Chain Analysis: TechnoServe. UNComtrade. (2015). United Nations Commodity Trade Statistics Database. Retrieved July
2015 United Nations Statistics Division URWA. (2014). Review of Uganda's Retail Industry. Retrieved July 2016, from
http://ugandaretailersandwholesalers.blogspot.com/2014/12/review-of-ugandas-retail-industry.html
USAID. (2015). Mid-Term Performance Evaluation of the Rwanda Dairy Competitiveness Program II (RDCP II): United States Agency for International Development.
USAID. (2016). Cost-Benefit Analysis of USAID/Rwanda's Dairy Value Chain Intervention: Final Report: United States Agency for International Development.
USDA. (2005). Cooperatives in the Dairy Industry. Cooperative Information Report 1. United States Department of Agriculture.
USDA. (2015). Database: Production, Supply and Distribution. Retrieved from: http://www.fas.usda.gov/data
van Rensburg, D. J. (2015). In-sourcing disruptive brands as a corporate entrepreneurship strategy. International Entrepreneurship and Management Journal, 11(4), 769-792.
VandeHaar, M., Armentano, L., Weigel, K., Spurlock, D., Tempelman, R., & Veerkamp, R. (2016). Harnessing the Genetics of the Modern Dairy Cow to Continue Improvements in Feed Efficiency. Journal of dairy science, 99(6), 4941-4954.
World Bank. (2014). EAC Common Market Scorecard 2014: Tracking EAC Compliance in Movement of Capital Services and Goods. East African Community.
World Bank. (2015). Rwanda Agricultural Sector Sector Risk Assessment. . Agriculture Global Practice Note 18.
Related Documents