3rd MEDITERRANEAN SEMINAR LACTIMED ALEXANDRIA, EGYPT, 17-18 SEPTEMBER 2014 DAIRY VALUE CHAIN AT THE INDUSTRIAL LEVEL Mr. Fethi KHAMASSI Deputy Director on Animal processing – Ministry of Energy, Industry and Mines, Tunisia

Welcome message from author
This document is posted to help you gain knowledge. Please leave a comment to let me know what you think about it! Share it to your friends and learn new things together.
Transcript

3rd MEDITERRANEAN SEMINAR LACTIMED ALEXANDRIA, EGYPT, 17-18 SEPTEMBER 2014
DAIRY VALUE CHAIN AT THE INDUSTRIAL LEVEL
Mr. Fethi KHAMASSI Deputy Director on Animal processing – Ministry of Energy, Industry and Mines,
Tunisia

REPUBLIC OF TUNISIA
MINISTRY OF ENERGY INDUSTRY AND MINES
DAIRY VALUE CHAIN AT INDUSTRIAL LEVEL
Fethi khamassi
Deputy Director on Animal Product Processing
Alexandria 09 / 18 /2014
2

SUMMARY 1. Economic indicators of the Agro Food
Industries 2. The importance of the dairy sector , 3. The current situation of the sector, - at the industrial level - on the commercial plan 4. Regulatory mechanisms
3

This sector represents:
3.7% of the GDP,
19% of the add value of the industry sector ,
22% of the value of the industry investments,
10% of the value of the total exportations
Economic indicators of the AFI sector
4

Entreprises en partenariat
France (35)
29%
Répartition par pays
Italy (33)
53%
31%
Activities Number of companies TE
Fruis and vegetables Packaging 82
Processing and preserving of fish 38
Other food insdustries 23
Oils and fats 22 Fruits and vegetables processing 29
Cereals and derivatives 11 Drinks 5 Suggar and derivatives 4 Other countries (60)
Totally exporting companies
Number of enterprises of the sector 6500 1047 enterprises (> 10 jobs), 201 totally exporting companies, 113 collaborating enterprises,
Number of jobs: 90.000 (70.985 for enterprises which job > 10)
5
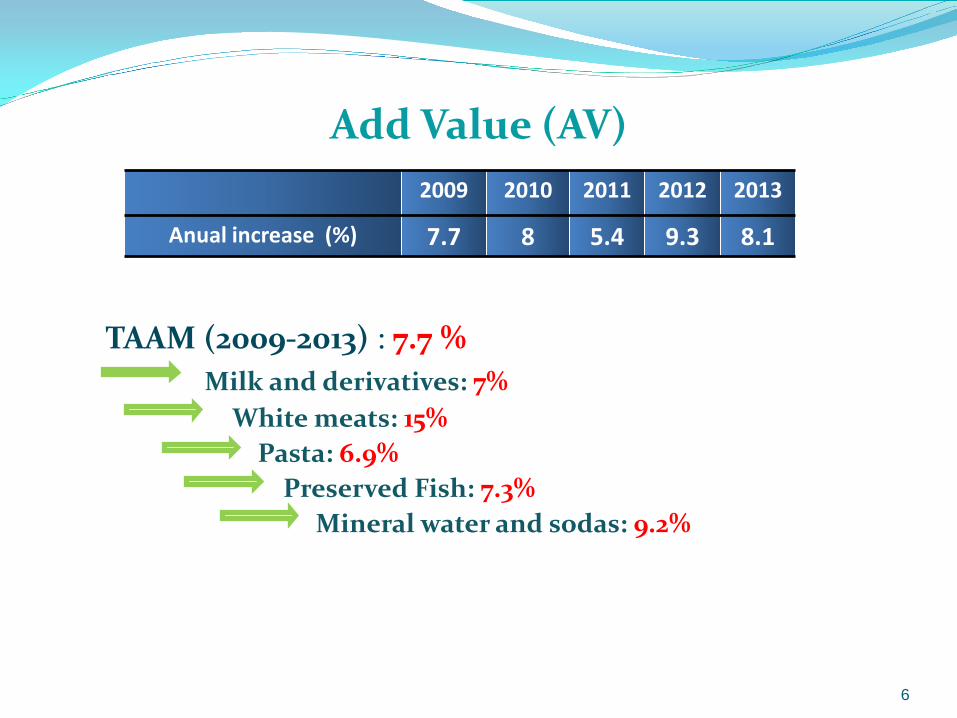
Add Value (AV)
TAAM (2009-2013) : 7.7 % Milk and derivatives: 7% White meats: 15% Pasta: 6.9% Preserved Fish: 7.3% Mineral water and sodas: 9.2%
6
2009 2010 2011 2012 2013
Anual increase (%) 7.7 8 5.4 9.3 8.1
6

Investments
7
2009 2010 2011 2012 2013
Value (MD) 300 320 357 385 425
Average investment structure of the AFI in 2013
cereals derivatives 9%
milk and derivatives 7%
oils and fats; 17%
drinks 10%Preserved food 17%
other products 41%
7

Exportations
2009 2010 2011 2012 2013
Valeur (MD) 1631 1651 2126 2065 2431
Average export structure of the AFI in 2013
Oils and fats43%
Dattes16%
Fishery products10%
Cereals derivatives
9%
Preserved food4%
Drinks3%
Milk and derivatives4%
Other products11%
8

Importations
2009 2010 2011 2012 2013
Value (MD) 1593 2209 2828 3156 3545
Average importations structure of the AFI in 2013
Cereals47%
Oils and fats14%Suggar
9%
Fishery products 3%
Coffe and tea3%
Soybean cakes3%
Milk and derivatives
2%
Other products19%
9

MAIN BRANCHES OF ACTIVITIES (type primary processing)
Olive Oil, Cereal derivatives, Milk and derivatives, Sea food, Canned fruits and vegetables, Packaging of dattes, Wine products,
10

• The milk sector represents: • 11% of the value of the agricultural production, • 25 % of the value of animal production, • 7 % of the value on the food industry
Importation: milk powder, cheese for melting, condensed milk and (sometimes) drinking milk
Exportation : drinking milk, melted cheese, yogurt and dairy dessert.
The importance of the milk sector
11

• 9 functional dairies ( 3,9 ML/Day),
1 unit producing only milk derivatives,
40 cheese dairies (280 mL/Day) of which 4 units of melted cheese,
1 unit for drying milk (150 mL/Day) , 4 unities for yogurt production (250 mL/Day) .
Important processing capacity 3,9 ml / Day higher
than the collecting capacity 2,5 ML/ Day
INDUSTRIAL STRUCTURE
12

13
• Manufactured quantity (2013) : 850 milions of liters meaning 65% of the national production, as follows: Drinkig milk: (60 %),
Derivatives: (Yogurt, dairy desserts, cheeses, leben, raïeb, etc.) (38.4 %),
Dried: Powder milk (1.6 %).

National Milk Production (ML)
14
2009 2010 2011 2012 2013 Production Nat. 1030 1059 1096 1124 1150 collecte 602 650 664 709 747
0
200
400
600
800
1000
1200
1400

15
2009 2010 2011 2012 2013 Prod. dérivés 84 75 89 110 84 Lait UHT 400 428 475 508 503
400 428
475 508 503 84 75
89 110
84
0
100
200
300
400
500
600
700
UHT Milk production and derivatives(ML)

Production and milk sales (ML)
2009 2010 2011 2012 2013 Prod.lait UHT 400 456 447 509 510 Vente lait 400 428 475 508 503
400
456 447
509 510
400 428
475 508 503
0
100
200
300
400
500
600
16

17
Criteria in Europe Criteria in Tunisia
38> 30> MG g/l
32> 28> Protein g/l
Less of 300 milles /ml
I Less of 1 ML/ml
Microbial burden Million germs/ml
Not considered 1028≥ Density à 20 °c
Quality criteria applied

18
Lait stérilisé ½ écrémé en
bouteille plastique 3 couches
5%
Lait stérilisé ½ écrémé en
bouteille Plastique
10 %
Lait UHT demi de 1 litre écrémé en paquet
85 %
Price of a litre ( 2013 )
1020 1010 1060 Retail price ( DT)
Retail price of a litre of milk is 1060 DT = 0,5 euro
Price of 1 litre of milk mil/l

19
Lait stérilisé ½ écrémé en
bouteille plastique 3 couches
5%
Lait stérilisé ½ écrémé en
bouteille Plastique
10 %
Lait UHT demi de 1 litre écrémé
en paquet 85 %
709 709 709 Costs of raw material
190 160 260 Costs of conditioning and packaging
69 60 72 Logistics costs at the manufactured level
184 160 154 Industrial costs
31 31 31 Distribution margin
1183 1120 1226 Total costs
1020 1010 1060 Retail price
120 120 120 Subsidies
The P.R of a litre of stirilized milk

Regulatory mechanisms
20

Regulatory mechanisms
21
Buffer stock; Exportation; Drying process

Buffer Stock
22
Since 1999, it exists a fresh milk buffer stock; The buffer stock on sterilized fresh milk is set each
year; ( 50 ML ) Government subsides: 50 mL/litre /month
market supply throughout the year

10 MD
12 MD 3,5 MD
4 MD 10 MD
Regulatory
2009 2010 2011 2012 2013 Stock lait en ML 48,6 55,7 39 37,8 46,5
0
10
20
30
40
50
60
23
Subsides

24
Year 2007 2008 2009 2010 2011 2012
Exportation 6 2 - - 7,5 -
Importation 3,3 7,5 - - - 0,8
Exportation- Importation
Unity : ML

2009 2010 2011 2012 2013
Qt. Fresh milk ( ML) 0 0 9,75 0 13,6
Qt. Dried milk (T) 0 0 750 0 1072
The drying process
The drying process is an important regulatory mechanism on dairy sector.
25

Subside policy
26

Subside policy
FODEC (competitiveness development funds), FODECAP (competitiveness development funds for agriculture and fishing sector)
- CAISSE GENERALE DE COMPENSATION
At collecting level, ( 60 ML/litre) At buffer regulatory level, ( 50 ML/litre/month ) At industry level, ( 120 ML / manufactured litre ) At drying process level ( subsides from the gouvernment at drying costs)
27

Thank you
28
Related Documents