09/09/2015 © IFCN 2015 | 1 IDF Conference 2015 Lithuania Dairy farm structure and its changes over the last 10 years – trends and drivers Wyrzykowski Łukasz IFCN Dairy Research Network [email protected]

Dairy farm structure and its changes over the last 10 years – trends and drivers
Apr 11, 2017
Welcome message from author
This document is posted to help you gain knowledge. Please leave a comment to let me know what you think about it! Share it to your friends and learn new things together.
Transcript
09/09/2015 © IFCN 2015 | 1
IDF Conference 2015 Lithuania
Dairy farm structure and its changes
over the last 10 years – trends and drivers
Wyrzykowski Łukasz
IFCN Dairy Research Network

09/09/2015 © IFCN 2015 | 2
Agenda
1. IFCN concept
2. Dairy farms worldwide
3. Analysis of the farm structure
4. Summary

09/09/2015 © IFCN 2015 | 3
Mission:
We create a better understanding
of the dairy world by providing
comparable data,
knowledge and inspiration.
IFCN - The Global Dairy Research Network
The network approach – of a three pillars
- the network of researchers,
- the network of companies/institutions and
- the IFCN center with > 15 dairy economists.

09/09/2015 © IFCN 2015 | 4
Research partners in 100 countries
Status of the IFCN Network in 2015
Supporting partners (> 100)
Institutional partners
57 Countries where we collect farm economic data & country data
43 Countries where we collect country profile data

09/09/2015 © IFCN 2015 | 5
3
1 11
6
9
12
2
4
5
10
8
Activities
in the
different
months of
the year
IFCN - An ongoing knowledge creation system
IFCN Dairy Conference IFCN Supporter Conference
Data collection,
validation & analysis
Kick off meeting Kiel IFCN Regional Workshop
7

09/09/2015 © IFCN 2015 | 6
Agenda
1. IFCN concept
2. Dairy farms worldwide
3. Analysis of the farm structure
4. Summary
09/09/2015 © IFCN 2015 | 7
Source: IFCN database
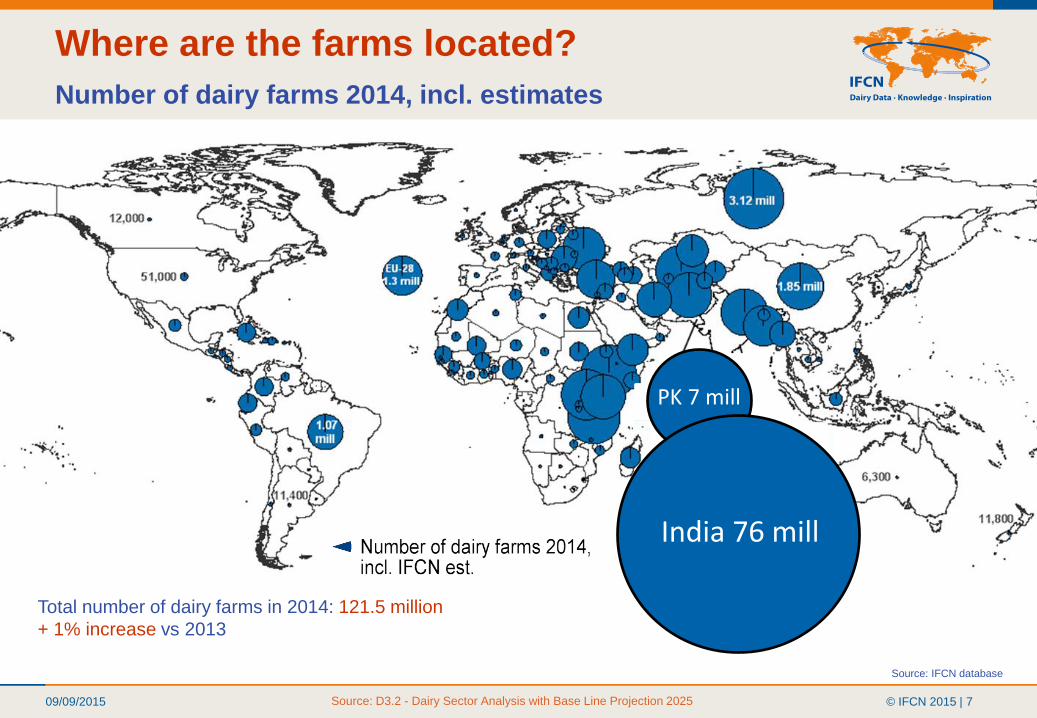
Where are the farms located?
Number of dairy farms 2014, incl. estimates
Source: D3.2 - Dairy Sector Analysis with Base Line Projection 2025
Total number of dairy farms in 2014: 121.5 million
+ 1% increase vs 2013
PK 7 mill
India 76 mill

09/09/2015 © IFCN 2015 | 8
Source: D3.2 - Dairy Sector Analysis with Base Line Projection 2025
Trends in farms development
Change in farm numbers 2009 - 2014
2009 – 117 mill dairy farms
2014 – 121 mill dary farms
2009 - 2014 = 3.8% increase
09/09/2015 © IFCN 2015 | 9
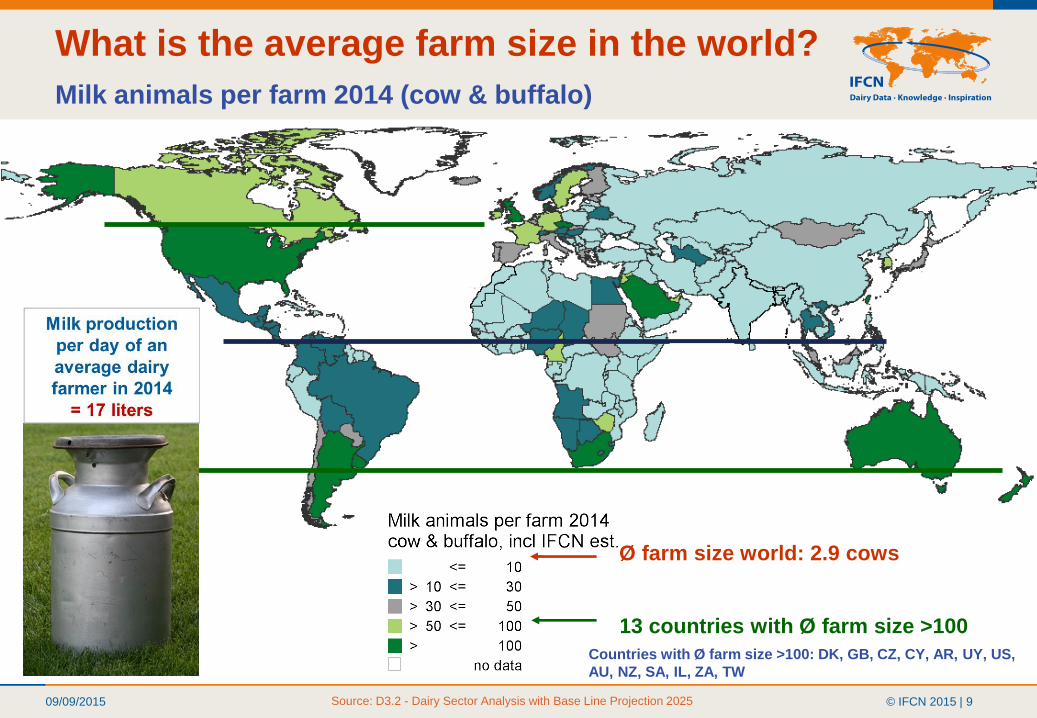
13 countries with Ø farm size >100
difference of margin over compound feed cost to bound
January 2015 in %
>15%
>-15% <= 15%
<= -15%
no data
What is the average farm size in the world?
Milk animals per farm 2014 (cow & buffalo)
Source: D3.2 - Dairy Sector Analysis with Base Line Projection 2025
Ø farm size world: 2.9 cows
Countries with Ø farm size >100: DK, GB, CZ, CY, AR, UY, US,
AU, NZ, SA, IL, ZA, TW

09/09/2015 © IFCN 2015 | 10
The dairy world 2004-2014
What are the main changes in world milk supply in last 10 years
Source: D3.2 - Dairy Sector Analysis with Base Line Projection 2025
* Data representing cow and buffalo milk only.
ECM- Energy Corrected Milk; 4% fat, 3.3% protein
2004 2014 Absolute % CAGR
%/ year
Milk Supply
Milk production* Mill t ECM 606 778 172 28.5% 2.5%
Supply Drivers
Number of milk
animalsMill head 319 363 44 13.7% 1.3%
Average milk yieldt / milk
animal / year1.9 2.15 0.2 13.0% 1.2%
Dairy farm number Mill 108 121 13 12.3% 1.2%
Average farm size Head/farm 2.8 2.9 0.1 2.3% 0.2%
Variables UnitChange 2004 vs 2014
09/09/2015 © IFCN 2015 | 11
Agenda
1. IFCN concept
2. Dairy farms worldwide
3. Analysis of the farm structure
4. Summary
09/09/2015 © IFCN 2015 | 12
For what do we need farm structure data? Meaning of farm dairy farm structure data to industry
• To better understand the regional & national structure of the
dairy farms
• To monitor the development pattern and dynamics
• To predict milk supply and pattern for farm input use
09/09/2015 © IFCN 2015 | 13
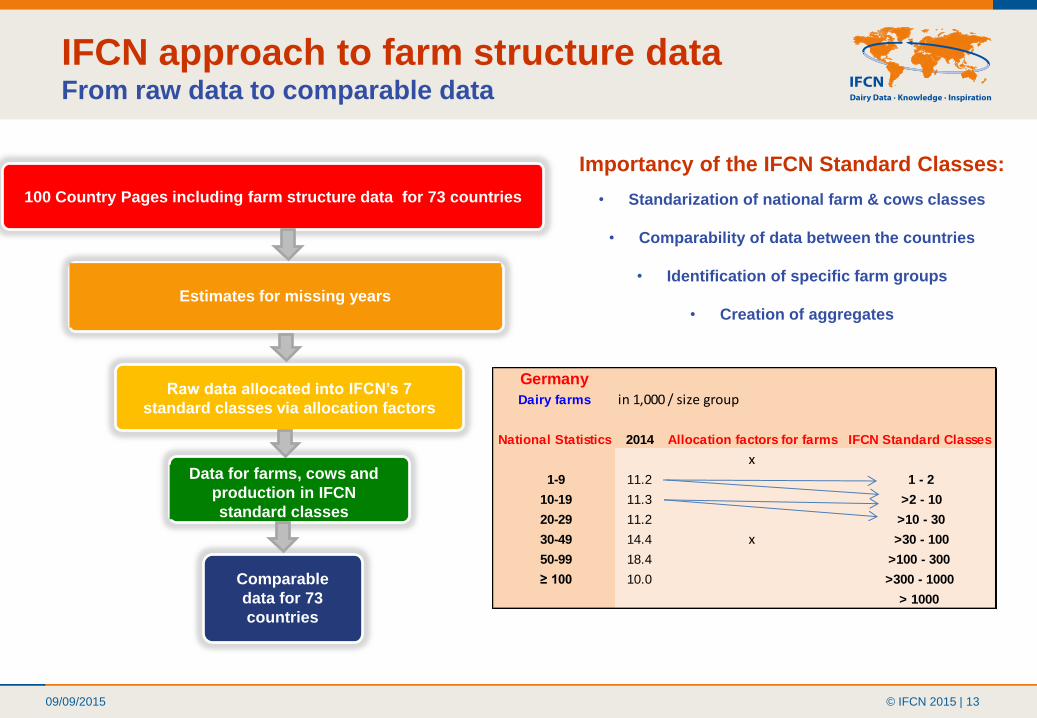
IFCN approach to farm structure data From raw data to comparable data
Data for farms, cows and
production in IFCN
standard classes
Raw data allocated into IFCN’s 7
standard classes via allocation factors
100 Country Pages including farm structure data for 73 countries
Estimates for missing years
Comparable
data for 73
countries
Importancy of the IFCN Standard Classes:
• Standarization of national farm & cows classes
• Comparability of data between the countries
• Identification of specific farm groups
• Creation of aggregates
Germany
Dairy farms in 1,000 / size group
National Statistics 2014 Allocation factors for farms IFCN Standard Classes
x
1-9 11.2 1 - 2
10-19 11.3 >2 - 10
20-29 11.2 >10 - 30
30-49 14.4 x >30 - 100
50-99 18.4 >100 - 300
≥ 100 10.0 >300 - 1000
> 1000

09/09/2015 © IFCN 2015 | 14
Farm ownership & their key drivers
Smaller farms - Household perspectives Key characteristics: Small farms 1-9 cows, dairy is one income source,
50% of the milk is consumed on the farm, 50% sold.
Key driver: Selling milk provides daily cash for family needs.
Medium size farms - Family labor perspective Key characteristics: Work is mainly done by the family,
Size in developed countries 10 up to 100 (can go up to 300)
Key driver: Generate an income.
Larger farms - Business perspective Key characteristics: Work is mainly done by employees,
Size in developed countries > 100 cows or more?
Key driver: Generate the expected ROI.

09/09/2015 © IFCN 2015 | 15
Share of cows per size class in 2014
• IN: dominated via smaller
farms with household
perspective
• BR, PL, FR: dominated
via medium farms with
family labour perpectives
• US, NZ: dominated via
larger farms with a
bussines perspective
Cows in the world
Distribution in IFCN standard classes 2014
Source: D3.2 - Dairy Sector Analysis with Base Line Projection 2025
Note: average farm size refers to cows and buffaloes only
0%
10%
20%
30%
40%
50%
60%
70%
80%
90%
100%
India Brazil Poland France US NZØ Herd
Size 2014: 2 21 8 55 181 410
Legend:
85%
56% 68%
80%
85%
99%

09/09/2015 © IFCN 2015 | 16
What is dominating farm size category? The most dominant farm type in number of cows per country 2014
Source: IFCN Standard Classes based on national statistics and allocation factors. Data preliminary or est. for 2014:AM, AT, AU, AZ, BE, BG, CA, CH, CO, CR, CY, CZ, DK, DZ, EE,
ES, ET, HU, ID, IE, IN, IS, IT, JM, KG, KZ, LK, LU, MA, MK, MN, MX, MY, NG, NP, NZ, PH, PK, PT, RO, RS, RU, SA, SI, TH, TJ, TM, TR, TW, UK, US, UY, UZ, VN

09/09/2015 © IFCN 2015 | 17
% Share in size classes
96.1% 59.8%
Smaller farms/
household
farms
3.6% 25.6% Medium farms/
family farms
0.3% 14.6%
17%
Farms Cows
Larger farms/
business farms
Source: IFCN Standard Classes based on national statistics and allocation factors. Data preliminary or est. for 2014: CH, IS, AT, BE, LU, DK, IE, IT, PT, ES, UK, CZ, SI, HU, EE, AM,
KZ, RU, ZU, BG, RO, RS, CO, UY, CA, US, AU, NZ, IN, PK, LK, TH, ET, NG, TW, DZ, KG, CY, AZ, TJ, NP and TR
A global picture of dairy farm structure
Analysis covers 95% of the countries in the world
73%
31%
23%
29%
11%
15%
6%
5% 3%
0%
10%
20%
30%
40%
50%
60%
70%
80%
90%
100%
Dairy Farms Dairy cows

09/09/2015 © IFCN 2015 | 18
Shares of cows per size classes
Distribution in IFCN standard classes 1996-2014
Source: D3.2 - Dairy Sector Analysis with Base Line Projection 2025
Ø herd size change 1996-2014: 2.0 - 1.7 9.0 - 22 72 - 182
Ø annual %-change in farm number: 2.8% -2.3% -3.4%
Brazil USA India
09/09/2015 © IFCN 2015 | 19
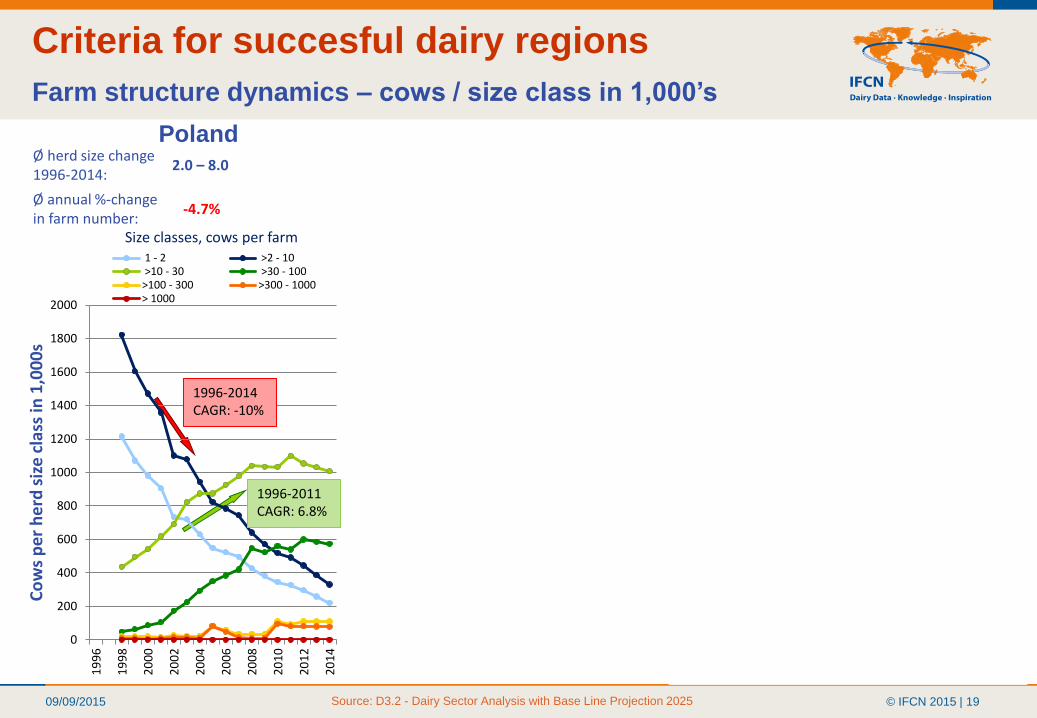
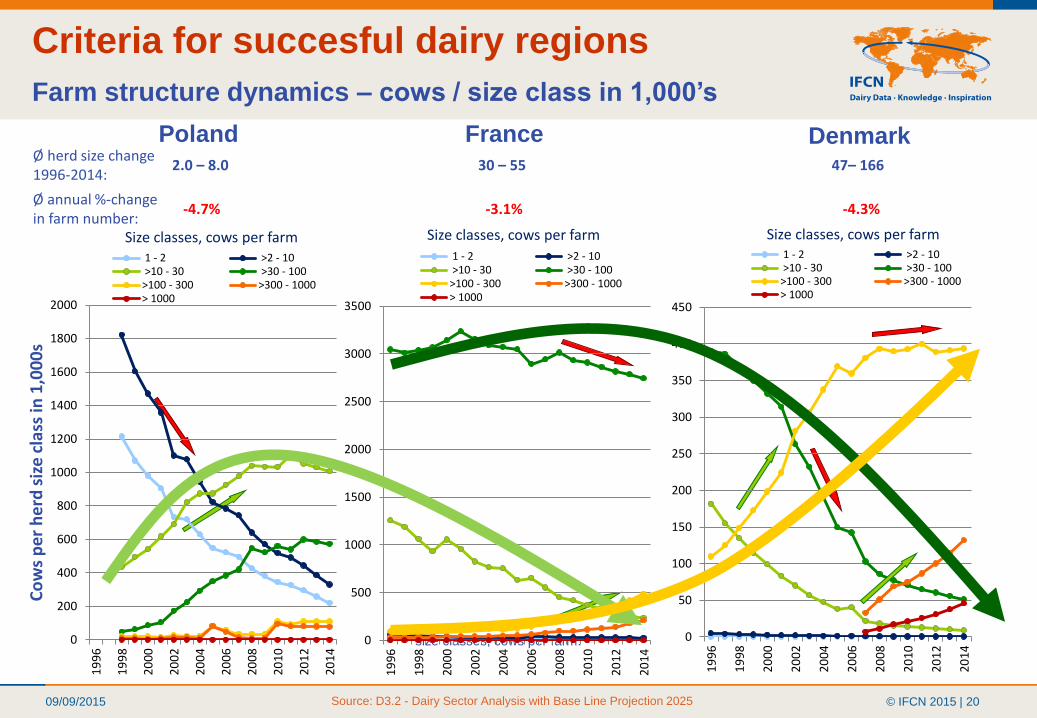
Criteria for succesful dairy regions
Farm structure dynamics – cows / size class in 1,000’s
size classes, cows per farm:
Ø herd size change 1996-2014:
2.0 – 8.0 30 – 55 47– 166
Ø annual %-change in farm number:
-4.7% -3.1% -4.3%
0
200
400
600
800
1000
1200
1400
1600
1800
2000
19
96
19
98
20
00
20
02
20
04
20
06
20
08
20
10
20
12
20
14
Co
ws
pe
r h
erd
siz
e c
lass
in 1
,00
0s
Size classes, cows per farm 1 - 2 >2 - 10 >10 - 30 >30 - 100>100 - 300 >300 - 1000> 1000
1996-2014 CAGR: -10%
1996-2011 CAGR: 6.8%
0
500
1000
1500
2000
2500
3000
3500
19
96
19
98
20
00
20
02
20
04
20
06
20
08
20
10
20
12
20
14
Size classes, cows per farm
1 - 2 >2 - 10 >10 - 30 >30 - 100>100 - 300 >300 - 1000> 1000
2001-2014 CAGR: -1.2%
1996-2014 CAGR: 9.4%
Poland France Denmark
0
50
100
150
200
250
300
350
400
450
19
96
19
98
20
00
20
02
20
04
20
06
20
08
20
10
20
12
20
14
Size classes, cows per farm 1 - 2 >2 - 10 >10 - 30 >30 - 100>100 - 300 >300 - 1000> 1000
1996-2014 CAGR: -10%
2007-2014 CAGR:19%
Source: D3.2 - Dairy Sector Analysis with Base Line Projection 2025
09/09/2015 © IFCN 2015 | 20
Criteria for succesful dairy regions
Farm structure dynamics – cows / size class in 1,000’s
size classes, cows per farm:
Ø herd size change 1996-2014:
2.0 – 8.0 30 – 55 47– 166
Ø annual %-change in farm number:
-4.7% -3.1% -4.3%
0
200
400
600
800
1000
1200
1400
1600
1800
2000
19
96
19
98
20
00
20
02
20
04
20
06
20
08
20
10
20
12
20
14
Co
ws
pe
r h
erd
siz
e c
lass
in 1
,00
0s
Size classes, cows per farm 1 - 2 >2 - 10 >10 - 30 >30 - 100>100 - 300 >300 - 1000> 1000
0
500
1000
1500
2000
2500
3000
3500
19
96
19
98
20
00
20
02
20
04
20
06
20
08
20
10
20
12
20
14
Size classes, cows per farm
1 - 2 >2 - 10 >10 - 30 >30 - 100>100 - 300 >300 - 1000> 1000
Poland France Denmark
0
50
100
150
200
250
300
350
400
450
19
96
19
98
20
00
20
02
20
04
20
06
20
08
20
10
20
12
20
14
Size classes, cows per farm 1 - 2 >2 - 10 >10 - 30 >30 - 100>100 - 300 >300 - 1000> 1000
Source: D3.2 - Dairy Sector Analysis with Base Line Projection 2025
09/09/2015 © IFCN 2015 | 21
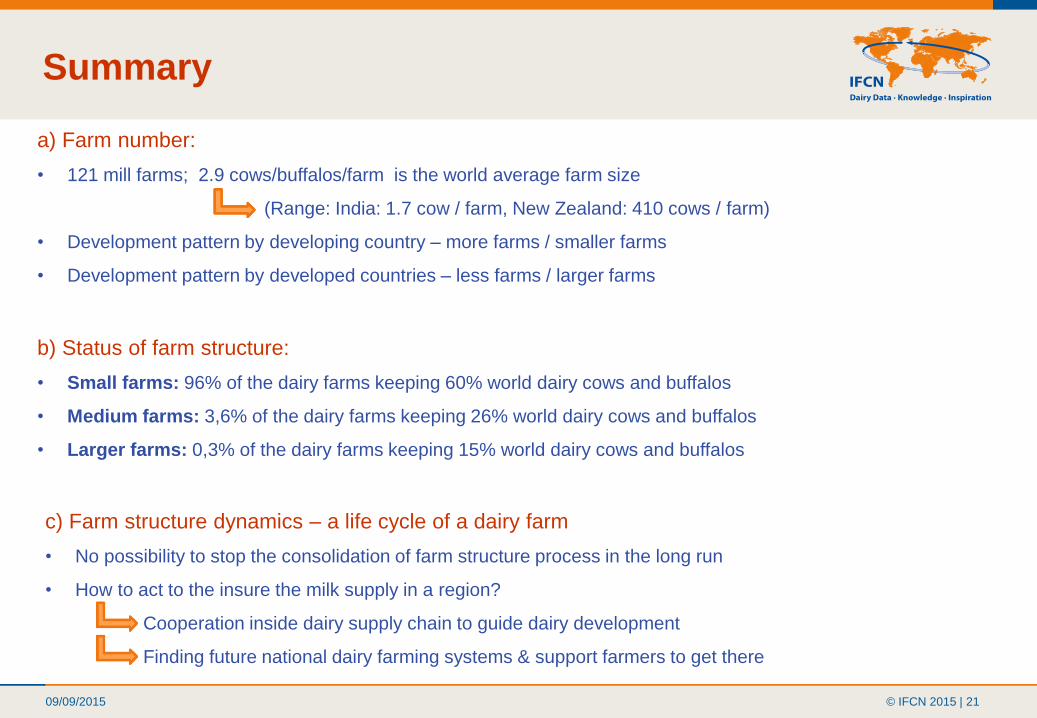
Summary
a) Farm number:
• 121 mill farms; 2.9 cows/buffalos/farm is the world average farm size
(Range: India: 1.7 cow / farm, New Zealand: 410 cows / farm)
• Development pattern by developing country – more farms / smaller farms
• Development pattern by developed countries – less farms / larger farms
b) Status of farm structure:
• Small farms: 96% of the dairy farms keeping 60% world dairy cows and buffalos
• Medium farms: 3,6% of the dairy farms keeping 26% world dairy cows and buffalos
• Larger farms: 0,3% of the dairy farms keeping 15% world dairy cows and buffalos
c) Farm structure dynamics – a life cycle of a dairy farm
• No possibility to stop the consolidation of farm structure process in the long run
• How to act to the insure the milk supply in a region?
Cooperation inside dairy supply chain to guide dairy development
Finding future national dairy farming systems & support farmers to get there

09/09/2015 © IFCN 2015 | 22
Thank you for your attention
Dairy
Research Center
in Kiel
Network
of researchers
Conference 2015 hosted
by GEA
Network
of companies
Conference 2015 hosted
by Cargill and Elanco
This presentation is the result of a large number of people
working together since 2000
Related Documents