Dairy farm greenhouse gas impacts: A parsimonious model for a farmer’s decision support tool Anne C. Asselin-Balençon a, * , Jennie Popp c , Andrew Henderson a , Martin Heller a, d , Greg Thoma b , Olivier Jolliet a a Department of Environmental Health Sciences, School of Public Health, University of Michigan,109 South Observatory, Ann Arbor, MI 48109-2029, USA b Ralph E. Martin Department of Chemical Engineering, University of Arkansas, 3202 Bell Engineering Center, Fayetteville, AR 72701-1201, USA c Department of Agricultural Economics and Agribusiness, University of Arkansas, 217 Agriculture Building, Fayetteville, AR 72701-1201, USA d Center for Sustainable Systems, School of Natural Resources and Environment, University of Michigan, 440 Church Street, Ann Arbor, MI 48109-1041, USA article info Article history: Received 18 November 2011 Received in revised form 15 May 2012 Accepted 18 September 2012 abstract This study presents an analysis of the cradle to farm gate greenhouse gas footprint of milk. Compared with the detailed model, we aim to accurately represent the variations in carbon footprint across farms, while being more parsimonious in terms of data needs. The simplified model strongly reduces the farm- specific data requirement from 162 animal-rations in the detailed survey to 12 feed rations for lactating cows, while explaining 91% of the variability in feed print and 98% of the variability in total footprint across 531 farms. The additional 95% confidence interval on an individual farm footprint is less than 10%. Feed efficiency and manure management are key determinants of the footprint per kg milk. A 15% reduction in the average footprint can be achieved by a 10% reduction for the 50th percentile of the best farms and by a higher and targeted reduction for the less efficient farms. Ó 2012 Elsevier Ltd. All rights reserved. 1. Introduction Consumers and retailers are becoming increasingly aware of their impact on the environment and especially of their impacts on climate change. They are changing their consumption to lead a more environmentally friendly lifestyle, and want to know that what they buy has been produced in an environmentally sustain- able way. To proactively meet the needs of the marketplace, the U.S. dairy industry commissioned a detailed greenhouse gas (GHG) life cycle assessment (LCA), or carbon footprint study, for fluid milk (Thoma et al., 2013b,c) to identify where the industry can innovate to reduce GHG emissions across the supply chain to achieve the greatest gains. This article builds on that detailed study to develop a parsimonious, but still accurate and representative tool for farmers to determine and potentially reduce their cradle to farm gate carbon footprint. In recent years, various tools have been developed to assess the GHG emissions in agriculture. Some tools, like Century (Parton, Schimel, Cole, & Ojima, 2006), DayCent (Parton, Ojima, Cole, & Schimel, 2008), US Department of Agriculture’s Comet VR (USDA NRCS, 2011), US Cropland GHG Calculator (McSwiney, Bohm, Grace, & Robertson, 2010), or US Energy Information Administra- tion’s (EIA’s) “N 2 O from agricultural soils” (EIA, 2010), specifically aim at assessing crop production emissions or footprint per surface unit. Others, like EIA’s “Livestock waste” and “Enteric Fermenta- tion” (EIA, 2010), assess part of the emissions in the milk produc- tion chain, at the farm level, but do not cover the whole milk production process at the farm gate. Tools like the Integrated Farm System Model (IFSM; Rotz et al., 2011), DenitrificationeDecomposition (DNDC; Giltrap, Li, & Saggar, 2010), the “Cool Farm Tool” (Unilever, 2011), aim at assessing a given farm carbon footprint. They cover the different steps of milk production, assessing the overall farm emissions; similarly, The Dairy Greenhouse Gas Abatement Strategies (DGAS) tool (Eckard et al., 2009) enables Australian farmers to compute their footprint, which also enables them to test strategies of miti- gation. But the farm may also carry out activities other than milk production, e.g., cash crop production; the assessment of the overall farm print does not enable fair comparisons per quantity of milk produced. The “Shades of Green” (SOG) dairy farm manage- ment calculator (Benbrook et al., 2010), encompasses the dairy production boundaries but only assesses the methane emissions, missing other compounds. Other simplified tools such as the “Carbon Calculator” (CFG, 2009), compute simplified footprints per head or per farm that * Corresponding author. Tel.: þ1 734 647 0394. E-mail address: [email protected] (A.C. Asselin-Balençon). Contents lists available at SciVerse ScienceDirect International Dairy Journal journal homepage: www.elsevier.com/locate/idairyj 0958-6946/$ e see front matter Ó 2012 Elsevier Ltd. All rights reserved. http://dx.doi.org/10.1016/j.idairyj.2012.09.004 International Dairy Journal 31 (2013) S65eS77

Welcome message from author
This document is posted to help you gain knowledge. Please leave a comment to let me know what you think about it! Share it to your friends and learn new things together.
Transcript

at SciVerse ScienceDirect
International Dairy Journal 31 (2013) S65eS77
Contents lists available
International Dairy Journal
journal homepage: www.elsevier .com/locate/ idairyj
Dairy farm greenhouse gas impacts: A parsimonious model fora farmer’s decision support tool
Anne C. Asselin-Balençon a,*, Jennie Popp c, Andrew Henderson a,Martin Heller a,d, Greg Thoma b, Olivier Jolliet a
aDepartment of Environmental Health Sciences, School of Public Health, University of Michigan, 109 South Observatory, Ann Arbor, MI 48109-2029, USAbRalph E. Martin Department of Chemical Engineering, University of Arkansas, 3202 Bell Engineering Center, Fayetteville, AR 72701-1201, USAcDepartment of Agricultural Economics and Agribusiness, University of Arkansas, 217 Agriculture Building, Fayetteville, AR 72701-1201, USAdCenter for Sustainable Systems, School of Natural Resources and Environment, University of Michigan, 440 Church Street, Ann Arbor, MI 48109-1041, USA
a r t i c l e i n f o
Article history:Received 18 November 2011Received in revised form15 May 2012Accepted 18 September 2012
* Corresponding author. Tel.: þ1 734 647 0394.E-mail address: [email protected] (A.C. Asselin-
0958-6946/$ e see front matter � 2012 Elsevier Ltd.http://dx.doi.org/10.1016/j.idairyj.2012.09.004
a b s t r a c t
This study presents an analysis of the cradle to farm gate greenhouse gas footprint of milk. Comparedwith the detailed model, we aim to accurately represent the variations in carbon footprint across farms,while being more parsimonious in terms of data needs. The simplified model strongly reduces the farm-specific data requirement from 162 animal-rations in the detailed survey to 12 feed rations for lactatingcows, while explaining 91% of the variability in feed print and 98% of the variability in total footprintacross 531 farms. The additional 95% confidence interval on an individual farm footprint is less than 10%.Feed efficiency and manure management are key determinants of the footprint per kg milk. A 15%reduction in the average footprint can be achieved by a 10% reduction for the 50th percentile of the bestfarms and by a higher and targeted reduction for the less efficient farms.
� 2012 Elsevier Ltd. All rights reserved.
1. Introduction
Consumers and retailers are becoming increasingly aware oftheir impact on the environment and especially of their impacts onclimate change. They are changing their consumption to leada more environmentally friendly lifestyle, and want to know thatwhat they buy has been produced in an environmentally sustain-able way. To proactivelymeet the needs of the marketplace, the U.S.dairy industry commissioned a detailed greenhouse gas (GHG) lifecycle assessment (LCA), or carbon footprint study, for fluid milk(Thoma et al., 2013b,c) to identify where the industry can innovateto reduce GHG emissions across the supply chain to achieve thegreatest gains. This article builds on that detailed study to developa parsimonious, but still accurate and representative tool forfarmers to determine and potentially reduce their cradle to farmgate carbon footprint.
In recent years, various tools have been developed to assess theGHG emissions in agriculture. Some tools, like Century (Parton,Schimel, Cole, & Ojima, 2006), DayCent (Parton, Ojima, Cole, &Schimel, 2008), US Department of Agriculture’s Comet VR (USDANRCS, 2011), US Cropland GHG Calculator (McSwiney, Bohm,
Balençon).
All rights reserved.
Grace, & Robertson, 2010), or US Energy Information Administra-tion’s (EIA’s) “N2O from agricultural soils” (EIA, 2010), specificallyaim at assessing crop production emissions or footprint per surfaceunit. Others, like EIA’s “Livestock waste” and “Enteric Fermenta-tion” (EIA, 2010), assess part of the emissions in the milk produc-tion chain, at the farm level, but do not cover the whole milkproduction process at the farm gate.
Tools like the Integrated Farm System Model (IFSM; Rotz et al.,2011), DenitrificationeDecomposition (DNDC; Giltrap, Li, &Saggar, 2010), the “Cool Farm Tool” (Unilever, 2011), aim atassessing a given farm carbon footprint. They cover the differentsteps of milk production, assessing the overall farm emissions;similarly, The Dairy Greenhouse Gas Abatement Strategies (DGAS)tool (Eckard et al., 2009) enables Australian farmers to computetheir footprint, which also enables them to test strategies of miti-gation. But the farm may also carry out activities other than milkproduction, e.g., cash crop production; the assessment of theoverall farm print does not enable fair comparisons per quantity ofmilk produced. The “Shades of Green” (SOG) dairy farm manage-ment calculator (Benbrook et al., 2010), encompasses the dairyproduction boundaries but only assesses the methane emissions,missing other compounds.
Other simplified tools such as the “Carbon Calculator” (CFG,2009), compute simplified footprints per head or per farm that

A.C. Asselin-Balençon et al. / International Dairy Journal 31 (2013) S65eS77S66
do not account for the broad diversity of farm practices and hencefor the subsequent range of emissions.
There are companies that assess the GHG per kg of milk. The E-CO2 project (E-CO2 Project, 2012) in the UK is one of them.
Some decision-making tools for farmers already exist. One of themost notable ones is the Dairy GHG (Rotz & Chianese, 2009). It isa simplified version of IFSM that encompasses the boundaries ofdairy production, and excludes other farm activities; it enables thefarmer to enter the characteristics of the herd, the target milkproduction, as well as the quantities and types of feed, andcomputes a carbon footprint per kg of milk. However, it is notpossible to enter farm-specific information on fuel consumptionand incidences of simplification still need to be systematically andstatistically evaluated on a large number of farms.
The determination of the carbon footprint for a given farm byThoma et al. (2013c) involved an intensive data collection andmodeling effort to include the GHG emissions associated with thewhole supply chain of agricultural inputs (fertilizers, diesel, etc.), feedproduction, direct enteric and combustion emissions at the dairyfarm, as well as emissions occurring during milk processing, trans-portation, retail and eventually consumption. Focusing more specif-ically on the farm operations, the detailed assessment made byThoma et al. (2013c) constitutes a good basis to start from, butrequired intensive inputs for the modeling of more than 160 animal-rationcombinations (27 feedrations for6classesofanimals)per farm.
There is therefore a need to analyze how data needs and thenumber of model parameters can be reduced to produce a “cleverlysimple” model for the emissions up to the farm gate, while main-taining accuracy. This model should represent the variations incarbon footprint across farm practices, while being more trans-parent and parsimonious in terms of data collection needs. Toaddress this, the present article aims to:
a) Identify the key parameters determining the cradle to farmgate carbon footprint on a functional basis, i.e., per kg fateprotein corrected milk. Life cycle boundaries usually extendfar upstream beyond farm boundaries;
b) Develop a parsimonious model that predicts the variation infootprint among farm management practices andcharacteristics;
c) Evaluate and verify that the simplified model results fall withinthe range of the detailed results;
d) Provide farmers with an easy-to-use GHG tool, enabling themto calculate and potentially reduce the GHG impacts associatedwith the specific characteristics of fluid milk production attheir farm;
e) Carry out a scenario analysis to explore how potential reduc-tion scenarios could help reach the reduction goals of 25%reduction in GHG by the year 2020.
2. Methods
2.1. Survey data, and carbon footprint detailed assessment
Thoma et al. (2013b) carried out a detailed carbon footprintstudy in a life cycle perspective encompassing activities performedin support of milk production and including: raw material andenergy extraction, production and distribution, fertilizer and agri-cultural input production, feed production, enteric emissions andmanure management system at a dairy farm. The study alsoincluded the production of packaging material, the impacts ofdistribution and refrigeration, as well as product loss through thesupply chain. The functional unit for this study was one kg of milkconsumed by USA consumers.
Farm-level data were collected through a detailed survey, withresponses from 531 farms grouped into 5 regions as shown in Fig. 1(Popp, Thoma, Mulhern, Jaeger LeFranc, & Kemper, 2013).
Feed rations, including on-farm produced feed, purchased feed,and feed intake during pasture (also accounting for feed losses)were specifically requested for the following 6 animal classes: OpenHeifer e Birth to Breeding; Bred Heifer e Breeding to Springer;Springer e approximately 3 weeks prior to first calving; First-CalfHeifer e post-calving animal, but before second calf; LactatingCow; and Dry Cow e multiparous animal approximately 60 daysprior to calving. Less than 25% of farms had mature cows whoreceived the majority of forage intake from pasture (this excludesharvested hay) in any month. Approximately 160 distinct feedswere identified and then aggregated into 27 feed types for whichcradle tomouth burdens were determined on a farm-by-farm basis.Regional average rations were also calculated from reported datafor each animal class. Each of the feeds has a feed characterizationfactor (CF), which includes the impacts of both synthetic fertilizerand manure application, and an average impact of the trans-portation of feed to the dairy farm. Feed CFs do not differentiatebetween feeds grown on-farm and purchased feeds: both areassumed to be represented by the CF for the farm’s region. Entericmethane emissions were calculated per animal per day based onthe farm specific dry matter intakes (DMIs) for the different animalclasses. Standardized methodologies were used to determineemissions of the manure print as described in the Intergovern-mental Panel on Climate Change (IPCC, 2006) guidelines. Since theemissions of field manure application are accounted for in the feedprint, they are not considered in the manure print to avoid doublecounting. To estimate the annual CH4 emission factor from livestockmanure, the predicted volatile solids (VS) excretion rates peranimal type were used in conjunction with herd demographics toestimate the total VS produced per farm per year, but withoutconsidering the ration-specific conversion between DMIs and VS.
On-farm fossil fuel and electricity use were collected in thesurvey. For each print category, these farm-specific data were thencombined with relevant standard data coming from life cycledatabases for upstream processes (mainly from ecoinvent(Frischknecht et al., 2005) for, e.g., energy extraction, electricityproduction, fertilizer production, etc.) to calculate the GHG foot-print. The IPCC Global Warming Potentials (GWPs) with a timehorizon of 100 years (GWP100) were used to compare and aggre-gate the impacts of CO2 (GWPCO2
¼ 1), CH4 (GWPCH4¼ 25), N2O
(GWPN2O ¼ 298) and other GHGs.The main results obtained by Thoma et al. (2013b) show the
following:
(i) The overall footprint of fluid milk consumed in the USA is2.05 kg CO2e kg�1 milk consumed, with a 90% confidence bandranging from 1.77 to 2.4 kg CO2e kg�1 milk consumed. Thiscradle to grave footprint includes on-farm production, pro-cessing and packaging, transport, distribution andconsumption.
(ii) The overall on-farm footprint is created from the combinationof feed, enteric, manure management and fuel contributions.From the analysis of all farm respondents, the dairy cradle tofarm gate carbon footprint shows a strong variability acrossfarms of more than a factor of 4. Much of the observeddifferences between regions are more properly attributed tothe on-farm practice (e.g., manure management system usedin the region) rather than the geographic location.
(iii) The majority of the GHG emissions from the full cradle tograve life cycle (72% of the total) occur before the milk leavesthe farm. The implications of this with regards to lowering theindustry footprint are clear: on-farm practices provide the

Fig. 1. Map of the five regions of Popp et al. (2013).
A.C. Asselin-Balençon et al. / International Dairy Journal 31 (2013) S65eS77 S67
most significant opportunities. These opportunities are notlimited to any particular region(s) or herd size(s).
Though this detailed and relatively complex analysis involveda large number of animal-ration combinations, several findingsfrom Thoma et al. (2013b) can trace the path toward a moreparsimonious model while maintaining accuracy:
(i) The top four feeds, accounting for approximately 55% of allfeed DMIs, are corn silage, alfalfa hay, alfalfa silage and corngrain.
(ii) Important variations are observed in the carbon footprint ofvarious manure management systems (MMSs), with solidstorage, dry lot, and deep bedding being the three mostfrequently used manure management practices nationwide.Deep bedding (stored longer than one month) and anaerobiclagoons are two of the largest sources of methane frommanuremanagement, andopportunities for important reductionofGHGemissions are associated with modifications to these practices.
(iii) Feed conversion efficiency, also called the DMI ratio andexpressed in kg dry matter (DM) feed per kg fat and protein-corrected milk (FPCM), is the most important individualfactor in explaining differences in the footprint. Not surpris-ingly, more efficient feed conversion results in a lower foot-print. This variable alone explains over 70% of the observedvariability in the farm gate footprint: feed is a major farminput and directly affects both enteric emissions and thequantity of manure excreted.
These results point toward several simplification and improve-ment opportunities to limit the amount of data farmers are asked toprovide, and to raise the following points:
(i) How to focus on the main feeds while still representing themain variability in feed print across farms?
(ii) How could replacement animals and dry cows be modeled ina generic way, limiting data requests to rations for lactatingcows?
(iii) How to model the MMSs, while accounting for the ration-specific variability in VSs?
2.2. Development of the parsimonious simplified model: generalapproach
As this article builds on the detailed study of Thoma et al.(2013c), its main characteristics and its limitations as described inSection 3.3 of the study, which also apply to this study. The systemboundaries encompass the same processes as described by Thomaet al. (2013c) for milk production from cradle to farm gate.
Focusing on the cradle to farm gate climate change impacts, theabove questions were addressed by systematically and successivelyanalyzing each of the main cradle to farm gate print categories(feed print, enteric print and fuel print) using the following steps:
a) Identify the key parameters of influence: based on the detailedsurvey results from Thoma et al. (2013b,c) and their analysis,identify the main parameters of influence for each print thatneed to be taken into account. Determine default values ata regional or national level for parameters of secondary influ-ence, whose impact may be fitted to a simple multi-linearregression.
b) Identify the form of the function to fit: from an analyticalanalysis of the model, determine the shape of the function andcorresponding equation that will then be fitted to determineeach footprint based on the key parameters described above.

A.C. Asselin-Balençon et al. / International Dairy Journal 31 (2013) S65eS77S68
c) Perform a statistical regression to determine the main regres-sion coefficients and to evaluate the quality of the parsimo-nious versus the detailed model (R2 and standard deviation).Combining the additional uncertainty of the parsimoniousmodel with the uncertainty analysis of Thoma et al. (2010) willallow placement of uncertainty ranges on the results of theGHG tool.
d) Analyze the efficiency of potential reduction scenarios.
For the manure management print, an alternative method wasselected to account for the IPCC volatile solid approach for specificanimals and feed. The method was then simplified accounting fora limited number of feed-animal rations and then compared withthe Thoma et al. (2013c) methodology.
The following sections detail the algorithms used in the basemodel. The results section then compares results from the simpli-fied model with those derived from the full survey of Thoma et al.(2013b,c). Table 1 lists the input variables collected from the userfor the GHG tool; those variables are the ones used in the equationsbelow.
2.3. Background calculations
All calculations are made on a FPCM basis in kg y�1, as given bythe International Dairy Federation (IDF, 2010) as follows:
FPCMannual¼Ymilk�½0:1226�Fat%þ0:0776�protein%þ0:2534�(1)
Where:
Ymilk ¼ total farm milk production (kg y�1),Fat% ¼ user defined average milk fat content, andProtein% ¼ user defined average milk protein content.
Table 1Input variables of the greenhouse gas tool (parsimonious model, i.e., the variables supplieduser input data.
Variable Symbol Units
Total annual milk production (pounds) Ymilk lb y�1
Average milk production per head (hd) lb hd�1 d�1
Average milk fat content Fat% %Average milk protein content Protein% %Production herd: number of mature animalsa Pmature hdFraction of total herd dry at a given time %Dry %Number of on-farm replacement calvesb Pcalf on-farm hdNumber of on-farm replacement heifersb Pheifer on-farm hdNumber of off-farm replacement calvesb Pcalf off-farm hdNumber of off-farm replacement heifersb Pheifer off-farm hdPP: lactating cows: weeks per yearc %Time on pastcows wk y�1
PP: dry cows: weeks per year %Time on pastdry wk y�1
PP: young stock: weeks per year %Time on pastrplct wk y�1
Mature animals culled for beef Padult beef hdAverage weight of mature culls wtadult beef lbCalves sold for beef Pcalf beef hdAverage weight of cull calves wtcalf beef lbAverage DMI for lactating animals DMIlactate lb hd�1 d�1
LCR: corn grain fraction 4lactatecorn grain %
LCR: corn silage fraction 4lactatecorn silage %
LCR: wet DGS fraction 4lactatewet DGS %
LCR: dry DGS fraction 4lactatedry DGS %
LCR: soybean (raw or roasted) fraction 4lactatesoy; raw %
LCR: soybean meal fraction 4lactatesoy meal %
a Lactating and dry.b Number of replacement calves (less than 2 months) and of replacement heifers (2 mc Abbreviations are: PP, pasturing period; DMI, dry matter intake; LCR, lactating cowd 1 gallon ¼ 0.003785411 m3; 1 Therm ¼ 105,505,585 J.e Select from 18 MMS options from pull-down menu.
The total population of replacement animals (Preplace) contrib-uting to the milk life cycle is given by
Preplace ¼ Pcalf ;on�farm þ Pheifer;on�farm þ Pcalf ;off�farm þ Pheifer;
off � farm (2)
This accounting is necessary to accommodate both farms raisingtheir own replacement animals and those that contract heiferrearing off-farm. It is important that only replacement animals thatare to become part of the milking herd are included in thisaccounting. The population of dry cows (Pdry) and lactating cows(Plactate) are derived from the population of mature cows (Pmature) asfollows:
Pdry ¼ %dry� Pmature (3)
Plactate ¼ Pmature � Pdry (4)
2.4. Feed print
The following 11 main feed types were identified, covering 82%of the feed footprint: corn grain, corn silage, wet distillers grains(DGS), dry DGS, raw or roasted soybeans, soybean meal, alfalfa hay,alfalfa silage, grass hay, grass silage and pasture. The other feedswere grouped in a twelfth feed category. The carbon footprintassociated with feed production for a given dairy farm in a specificregion is estimated by summing the total DMI of each animal group(lactating, dry, and replacement) for each of the 12 feed types, andmultiplying by a regional characterization factor (CFfeed), as shownin Fig. 1. The 12 feed types are then summed to give the overall feedprint:
GHGfeed ¼P12
i¼1 CFregion jfeed i � DMITOTALfeed i
FPCMannual(5)
by the end user), giving the symbols used in this paper and the expected units of the
Variable Symbol Units
LCR: alfalfa hay fraction 4lactatealfalfa hay %
LCR: grass hay fraction 4lactategrass hay %
LCR: grass silage fraction 4lactategrass silage %
LCR: pasture fraction 4lactatepasture %
LCR: all other feed fraction 4lactateother feed %
Total annual on-farm electricity purchased Eelec kWhFraction of electricity used directly for dairy activities lelec %Total gallons of diesel purchased Ediesel gallond
Fraction of diesel used directly for dairy activities ldiesel %Total gallons of gasoline purchased Egasoline gallonFraction of gasoline used directly for dairy activities lgasoline %Total gallons of propane purchased Epropane gallonFraction of propane used directly for dairy activities lpropane %Total amount of natural gas purchased Enat. gas ThermFraction of fuel oil used directly for dairy activities lnat. gas %Total gallons of fuel oil purchased Efuel oil gallonFraction of fuel oil used directly for dairy activities lfuel oil %Total gallons of biodiesel purchased Ebiodiesel gallonFraction of biodiesel used directly for dairy activities lbiodiesel %MMS in use on farm MMS1 Selecte
Fraction of excreted manure going to this system %MMS1 %MMS in use on farm MMS2 SelectFraction of excreted manure going to this system %MMS2 %MMS in use on farm MMS3 Select
onths to first calf) raised on-farm and off-farm.ration; MMS, manure management system.
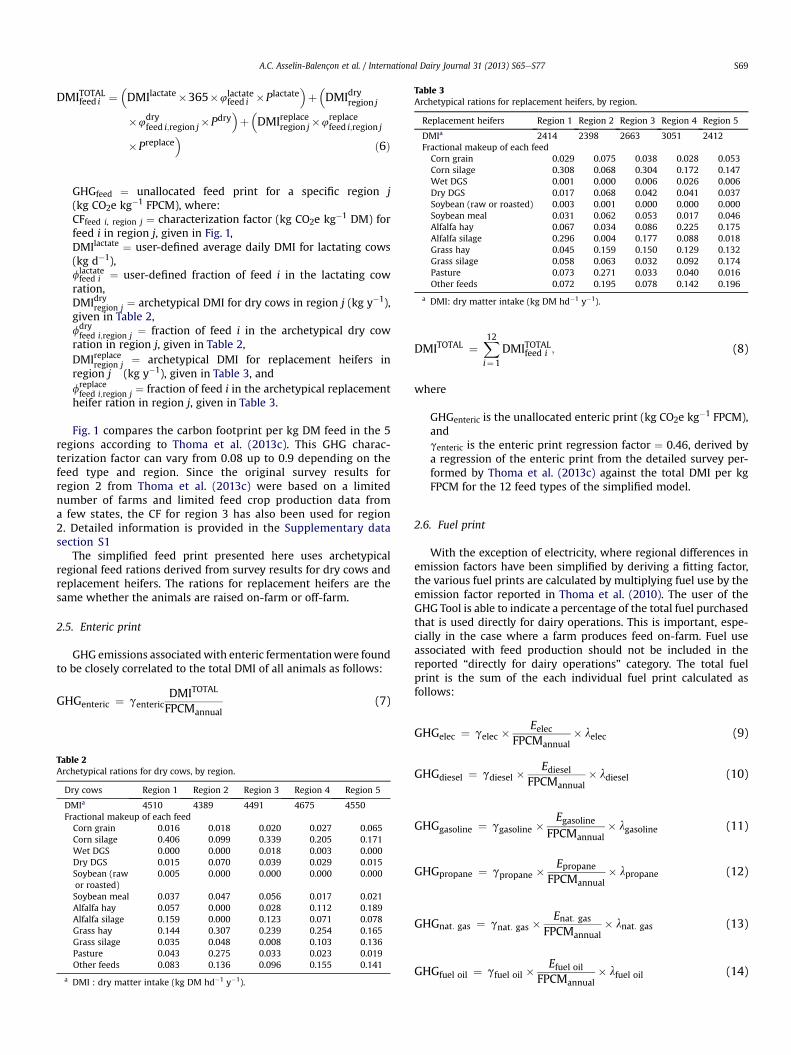
Table 3Archetypical rations for replacement heifers, by region.
Replacement heifers Region 1 Region 2 Region 3 Region 4 Region 5
DMIa 2414 2398 2663 3051 2412Fractional makeup of each feedCorn grain 0.029 0.075 0.038 0.028 0.053Corn silage 0.308 0.068 0.304 0.172 0.147Wet DGS 0.001 0.000 0.006 0.026 0.006Dry DGS 0.017 0.068 0.042 0.041 0.037Soybean (raw or roasted) 0.003 0.001 0.000 0.000 0.000Soybean meal 0.031 0.062 0.053 0.017 0.046Alfalfa hay 0.067 0.034 0.086 0.225 0.175Alfalfa silage 0.296 0.004 0.177 0.088 0.018Grass hay 0.045 0.159 0.150 0.129 0.132Grass silage 0.058 0.063 0.032 0.092 0.174Pasture 0.073 0.271 0.033 0.040 0.016Other feeds 0.072 0.195 0.078 0.142 0.196
a DMI: dry matter intake (kg DM hd�1 y�1).
A.C. Asselin-Balençon et al. / International Dairy Journal 31 (2013) S65eS77 S69
DMITOTALfeed i ¼�DMIlactate�365�4lactate
feed i �Plactate�þ�DMIdryregion j
�4dryfeed i;region j�Pdry
�þ�DMIreplaceregion j�4
replacefeed i;region j
�Preplace�
ð6Þ
GHGfeed ¼ unallocated feed print for a specific region j(kg CO2e kg�1 FPCM), where:CFfeed i, region j ¼ characterization factor (kg CO2e kg�1 DM) forfeed i in region j, given in Fig. 1,DMIlactate ¼ user-defined average daily DMI for lactating cows(kg d�1),flactatefeed i ¼ user-defined fraction of feed i in the lactating cow
ration,DMIdryregion j ¼ archetypical DMI for dry cows in region j (kg y�1),given in Table 2,fdryfeed i;region j ¼ fraction of feed i in the archetypical dry cow
ration in region j, given in Table 2,DMIreplaceregion j ¼ archetypical DMI for replacement heifers inregion j (kg y�1), given in Table 3, andfreplacefeed i;region j ¼ fraction of feed i in the archetypical replacement
heifer ration in region j, given in Table 3.
Fig. 1 compares the carbon footprint per kg DM feed in the 5regions according to Thoma et al. (2013c). This GHG charac-terization factor can vary from 0.08 up to 0.9 depending on thefeed type and region. Since the original survey results forregion 2 from Thoma et al. (2013c) were based on a limitednumber of farms and limited feed crop production data froma few states, the CF for region 3 has also been used for region2. Detailed information is provided in the Supplementary datasection S1
The simplified feed print presented here uses archetypicalregional feed rations derived from survey results for dry cows andreplacement heifers. The rations for replacement heifers are thesame whether the animals are raised on-farm or off-farm.
2.5. Enteric print
GHG emissions associatedwith enteric fermentationwere foundto be closely correlated to the total DMI of all animals as follows:
GHGenteric ¼ gentericDMITOTAL
FPCMannual(7)
Table 2Archetypical rations for dry cows, by region.
Dry cows Region 1 Region 2 Region 3 Region 4 Region 5
DMIa 4510 4389 4491 4675 4550Fractional makeup of each feedCorn grain 0.016 0.018 0.020 0.027 0.065Corn silage 0.406 0.099 0.339 0.205 0.171Wet DGS 0.000 0.000 0.018 0.003 0.000Dry DGS 0.015 0.070 0.039 0.029 0.015Soybean (rawor roasted)
0.005 0.000 0.000 0.000 0.000
Soybean meal 0.037 0.047 0.056 0.017 0.021Alfalfa hay 0.057 0.000 0.028 0.112 0.189Alfalfa silage 0.159 0.000 0.123 0.071 0.078Grass hay 0.144 0.307 0.239 0.254 0.165Grass silage 0.035 0.048 0.008 0.103 0.136Pasture 0.043 0.275 0.033 0.023 0.019Other feeds 0.083 0.136 0.096 0.155 0.141
a DMI : dry matter intake (kg DM hd�1 y�1).
DMITOTAL ¼X12i¼1
DMITOTALfeed i ; (8)
where
GHGenteric is the unallocated enteric print (kg CO2e kg�1 FPCM),andgenteric is the enteric print regression factor ¼ 0.46, derived bya regression of the enteric print from the detailed survey per-formed by Thoma et al. (2013c) against the total DMI per kgFPCM for the 12 feed types of the simplified model.
2.6. Fuel print
With the exception of electricity, where regional differences inemission factors have been simplified by deriving a fitting factor,the various fuel prints are calculated by multiplying fuel use by theemission factor reported in Thoma et al. (2010). The user of theGHG Tool is able to indicate a percentage of the total fuel purchasedthat is used directly for dairy operations. This is important, espe-cially in the case where a farm produces feed on-farm. Fuel useassociated with feed production should not be included in thereported “directly for dairy operations” category. The total fuelprint is the sum of the each individual fuel print calculated asfollows:
GHGelec ¼ gelec �Eelec
FPCMannual� lelec (9)
GHGdiesel ¼ gdiesel �Ediesel
FPCMannual� ldiesel (10)
GHGgasoline ¼ ggasoline �Egasoline
FPCMannual� lgasoline (11)
GHGpropane ¼ gpropane �Epropane
FPCMannual� lpropane (12)
GHGnat: gas ¼ gnat: gas �Enat: gas
FPCMannual� lnat: gas (13)
GHGfuel oil ¼ gfuel oil �Efuel oil
FPCMannual� lfuel oil (14)

A.C. Asselin-Balençon et al. / International Dairy Journal 31 (2013) S65eS77S70
GHGbiodiesel ¼ gbiodiesel �Ebiodiesel
FPCM� lbiodiesel (15)
annual
GHGfuel ¼ GHGelec þ GHGdiesel þ GHGgasoline þ GHGpropane
þ GHGnat: gas þ GHGfuel oil þ GHGbiodiesel
(16)
where
gx ¼ emission factor for each fuel type x (given in Table 4),Ex ¼ user-defined annual energy use for each fuel type, andlx ¼ user-defined fraction of annual energy use used directly fordairy operations.
2.7. Manure print
The detailed model from Thoma et al. (2010) used standard VSemissions per animal. Here, we suggest to refine the approach andto account for the feed-specific VSs per kg DM as proposed by IPCC(2006) while keeping the assessment parsimonious. For consis-tency, we also used the IPCC model for N excretions, and updatedthe detailed model.
VSs and N excretions are broken down between MMSs andmanure spread on pasture according to the average yearly timespent on pasture by each animal group.
Estimates of GHG emissions associated with manure (CH4 andN2O) are calculated based on the Tier 2 methods presented by IPCC(2006), both for MMSs and for manure spread on pasture. Specificcalculations, including the method for estimating diet-based VSexcretions, are detailed in the Supplementary data sections S2eS4.
Methane and nitrous oxide emissions from MMS are combinedwith respective GWP to give a total unallocated MMS Print(kg CO2e kg�1 FPCM):
GHGMMS ¼�GWPCH4
� CH4MMS
FPCMannual
�þ GWPN2O�
N2OTOTALMMS
FPCMannual
!
(17)
where
CH4MMS¼ total methane emissions from all MMS in kg CH4 y�1
given in Supplementary data section S3 as a function of total VSGWPCH4
¼ GWP for methane ¼ 25 kg CO2e kg�1 CH4N2O
TOTALMMS ¼ total N2O emissions from all MMS in kg N2O y�1
given in Supplementary data section S2 as a function of totalvolatile solidsGWPN2O ¼ GWP for N2O ¼ 298 kg CO2e kg N2O�1
FPCMannual ¼ annual FPCM production kg FPCM y�1.
Table 4Fuel emission factors used in GHGa tool.
Fuel Emission factor (g) Unitsb
Electricity 0.842 kg CO2e kWh�1
Diesel 11.89 kg CO2e gallon�1
Gasoline 10.21 kg CO2e gallon�1
Propane 7.66 kg CO2e gallon�1
Natural gas 7.54 kg CO2e Therm�1
Fuel oil 12.37 kg CO2e gallon�1
Biodiesel 7.96 kg CO2e gallon�1
a GHG: greenhouse gas.b kWh: kilowatt hour. 1 kWh ¼ 3,600,000 J; 1 gallon ¼ 0.003785411 m3; 1
Therm¼ 105,505,585 J.
Methane and nitrous oxide emissions from manure excreted onpasture are similarly combined with respective GWPs to give a totalmanure print similar to the MMS print.
GHGpasture¼�GWPCH4
� CH4pasture
FPCMannual
�þ GWPN2O�
N2OTOTALpasture
FPCMannual
!
(18)
where
CH4pasture¼ total methane emissions from all MMS in kg CH4 y�1
given in Supplementary data section S3 as a function of total VSandN2O
TOTALMMS ¼ total N2O emissions from all MMS in kg N2O y�1
given in Supplementary data section S3 as a function of total VS.
2.8. Digester
Anaerobic digesters present a particularly interesting opportu-nity for dairy farms to reduce their GHG emissions. As such, it isdesirable that the GHG Tool be equipped to evaluate the inclusion(either in operation or as a hypothetical scenario) of a digester inthe farm operation. Anaerobic digesters function as a controlledenvironment where the production of methane from manure isencouraged, captured, and often, utilized. This can potentiallyreduce the carbon footprint of the farm in a number of ways: byreducing the methane emitted to the atmosphere; by generatingelectricity with the biogas, and thus displacing the need topurchase electricity; and by utilizing the waste heat from thegenset to heat water, thus displacing the need to purchase otherfuels for water heating or milk cooling.
Refined modeling and feasibility studies using, for example, theAgSTAR FarmWare tool (EPA, 2010) are recommended before theimplementation of a digester. However, the simplified approachpresented in Supplementary data section S5 provides a baselineassessment of the impacts of a digester. Impacts are determined asa function of the VSs available in the manure. However, unlikeearlier evaluations where the location of the animals was irrele-vant, only manure from animals located on the farm is available forthe digester. Thus, it is necessary to differentiate between on-farm-and off-farm-raised replacement heifers.
2.9. Allocation
A total unallocated farm footprint is simply the sum of theindividual prints:
GHGTOTALunallocated ¼GHGfeed þ GHGenteric þ GHGfuel þ GHGMMS
þ GHGpasture ð19ÞUsing the allocation rules details from Thoma, Jolliet, and Wang
(2013a) the portion of the total carbon footprint that can be allo-cated to milk production (AF) is calculated as a function of the beef-milk production ratio (BMR) in kg beef kg�1 FPCM as follows:
AF ¼ 1� ð4:67� BMRÞ (20)
BMR ¼�Padult beef �wtadult beef þ Pcalf beef �wtcalf beef
�=FCPMannual ð21Þ
GHGTOTALallocated;milk ¼ AF*GHGTOTAL
unallocated (22)
0.0
0.1
0.2
0.3
0.4
0.5
0.6
0.7
0.8
0.9
1.0
0.0 0.1 0.2 0.3 0.4 0.5 0.6 0.7 0.8 0.9 1.0
Fee
d pr
int s
umpl
ifie
d (k
g C
O2e
kg-1
FP
CM
)
Feed print survey (kg CO2e kg-1 FPCM)
Fig. 2. Unallocated simplified feed print based on 12 main feed types and generic replacement animals as a function of the unallocated feed print from the detailed survey (531observations, R2 ¼ 0.91, standard error ¼ 0.035 kg CO2e kg�1 FPCM), grouped by milk productivity in kg FPCM head�1 y�1 (,, 1700e4999;6, 5000e6999; �, 7000e8999; , 9000e10,999; B, 11,000e12,999; þ, >13,000).
A.C. Asselin-Balençon et al. / International Dairy Journal 31 (2013) S65eS77 S71
where Padult beef ¼ head of mature animals sold for meat,wtadult beef ¼ average live weight of mature animals sold formeat (kg),Pcalf beef ¼ head of calves sold for meat (or to be raised off-farmfor beef), andwtcalf beef ¼ average live weight of calves sold for meat (kg).
0.0
0.5
1.0
1.5
2.0
2.5
3.0
GH
G e
missio
ns a
t farm
g
ate (kg
C
O2e
k
g-1
FP
CM
)
Emission
Fuel print Enteric print Feed print Manuprin
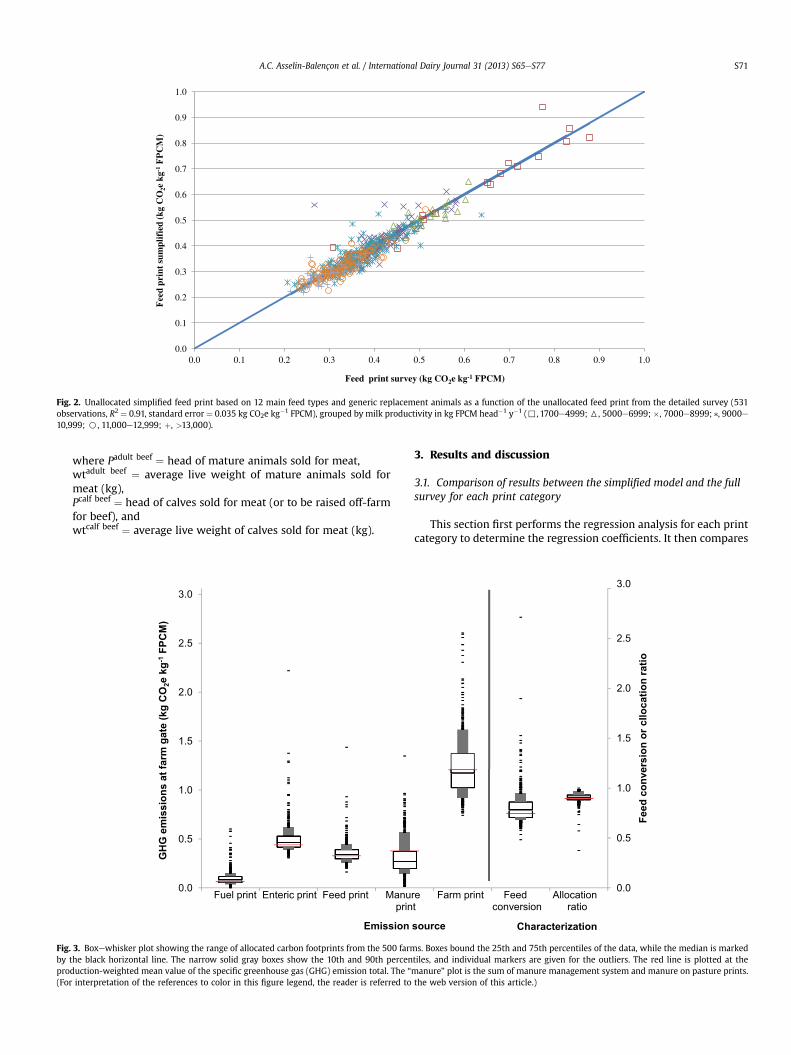
Fig. 3. Boxewhisker plot showing the range of allocated carbon footprints from the 500 farmby the black horizontal line. The narrow solid gray boxes show the 10th and 90th percenproduction-weighted mean value of the specific greenhouse gas (GHG) emission total. The “
(For interpretation of the references to color in this figure legend, the reader is referred to
3. Results and discussion
3.1. Comparison of results between the simplified model and the fullsurvey for each print category
This section first performs the regression analysis for each printcategory to determine the regression coefficients. It then compares
0.0
0.5
1.0
1.5
2.0
2.5
3.0
Feed
co
nversio
n o
r c
llo
ca
tio
n r
atio
source Characterization
re Farm print Feed Allocationt conversion ratio
s. Boxes bound the 25th and 75th percentiles of the data, while the median is markedtiles, and individual markers are given for the outliers. The red line is plotted at themanure” plot is the sum of manure management system and manure on pasture prints.the web version of this article.)

A.C. Asselin-Balençon et al. / International Dairy Journal 31 (2013) S65eS77S72
the results of the simplified GHG with those of the detailed surveyof Thoma et al. (2013c).
3.1.1. Feed printFig. 2 shows that the simplifiedmodel presents an R2 of 91%; this
means that the model is able to explain 91% of the initial variabilityin carbon feed print across the 531 survey farms, while stronglyreducing the farm-specific data requirement to 12 feed rations forlactating cows against the 162 animal-rations of the detailedsurvey. Since the generic rations for the replacement animals areequal to the regional averages, the simplified model provides onaverage results equal to the detailed survey model of Thoma et al.(2013b,c) and the feed regression factor is equal to 1(0.981 � 0.004). The different marker types and colors (in the webversion) in Fig. 2 show that the farms with the highest feed prints(expressed in kg CO2e kg�1 FPCM) are those with low milkproductivity (<5000 kg FPCM head�1). On the contrary, highermilkproductivity usually corresponds with a lower footprint, witha variation that depends on the feed ratio composition. Fig. 3 showsthat the median allocated feed print amounts to0.33 kg CO2e kg�1 FPCM, typically varying between 0.19 (1stpercentile of farms) and 0.68 kg CO2e kg�1 FPCM (99th percentile offarms). In comparison, the 95% confidence interval on the indi-vidual farm print due to model simplification amounts to�0.07 kg CO2e kg�1 FPCM.
3.1.2. Enteric printA value of 0.46 kg CO2e kg�1 DM is obtained for the enteric print
factor, and the simplified model explains 97% of the initial vari-ability in the specific farm enteric print (Fig. 4). Fig. 3 shows that themedian allocated enteric print amounts to 0.45 kg CO2e kg�1 FPCMtypically varying between 0.31 (1st percentile of farms) and1.07 kg CO2e kg�1 FPCM (99th percentile of farms). As for the feedprint, the farms with the highest feed prints (expressed inkg CO2e kg�1 FPCM) are those with low milk productivity(<5000 kg FPCM head�1). In comparison, the 95% confidenceinterval on the individual farm print due to model simplificationamounts to �0.06 kg CO2e kg�1 FPCM.
0.0
0.2
0.4
0.6
0.8
1.0
1.2
1.4
0.0 0.5 1.0
Ent
eric
pri
nt (k
g C
O2e
kg-1
FP
CM
)
DMI ratio (k
Fig. 4. Unallocated enteric print from the detailed survey as a function of the dry matter int[regression line: GHGenteric
detailed ¼ gentericDMITOTAL=FPCM; 531 observations, R2 ¼ 0.97, standa0.464)], grouped by milk productivity in kg FPCM head�1 y�1 (,, 1700e4999; 6, 5000e6
3.1.3. Fuel printFor fuel print, there is no difference between the simplified
and the detailed models as the data requirement is alreadylimited in the detailed survey from Thoma et al. (2013c). Fig. 3shows that for most farms, the median allocated fuel print islimited compared with the other prints and amounts to0.08 kg CO2e kg�1 FPCM, typically varying between 0.008 (1stpercentile of farms e no pasture) and 0.40 kg CO2e kg�1 FPCM(99th percentile of farms).
3.1.4. Manure print3.1.4.1. Manure management system. Fig. 5 compares the typicalmanure GHG print for the considered MMSs. It demonstrates largevariation in manure print depending on the MMS type rangingfrom 300 to 7200 kg CO2 per head per year, with high impacts foruncovered anaerobic lagoon, composting e intensive windrow anddeep bedding with more than a month storage.
Fig. 6 shows that the simplified model is able to explain 99%of the variability in carbon feed print across the 531 surveyfarms. Since the generic rations for the replacement animals areequal to the regional averages, the simplified model provides, onaverage, results equal to the detailed survey and the manureregression factor is equal to 1. The median allocated MMS printamounts to 0.20 kg CO2e kg�1 FPCM, typically varying between0 (1st percentile of farms) and 0.77 kg CO2e kg�1 FPCM (99thpercentile of farms). In comparison the 95% confidence intervalon the prediction of the manure print due to model simplifica-tion amounts to �0.03 kg CO2e kg�1 FPCM for an individualfarm.
3.1.4.2. Manure deposited on pasture. Fig. 7 shows that the simpli-fied model is able to explain 99% of the variability in carbon feedprint across the 531 survey farms. The median print amounts to0.008 kg CO2e kg�1 FPCM, typically varying between 0 (1stpercentile of farmse no pasture) and 0.49 kg CO2e kg�1 FPCM (99thpercentile of farms). In comparison, the 95% confidence interval onthe individual farm print due to model simplification amounts to�0.02 kg CO2e kg�1 FPCM.
1.5 2.0 2.5 3.0
g DM kg-1 FPCM)
ake (DMI) per kg FPCM for the 12 main feed types and for generic replacement animalsrd error ¼ 0.031 kg CO2e kg�1 FPCM, slope ¼ 0.461 kg CO2e kg�1 DM (95% CI 0.459e999; �, 7000e8999; , 9000e10,999; B, 11,000e12,999; þ, >13,000).

Fig. 5. Typical variation in manure carbon print among the Intergovernmental Panel on Climate Change manure management systems considered, for an average diet for lactatingcows.
A.C. Asselin-Balençon et al. / International Dairy Journal 31 (2013) S65eS77 S73
3.1.5. Total simplified printSumming across all print categories, the total footprint model
gives highly comparable results to the detailed survey, and thesimplified model explains 98% of the variability across farms(see Fig. 8). The resulting 95% confidence interval on theprediction of an individual allocated farm footprint amounts to0.12 kg CO2e kg�1 FPCM.
0.0
0.2
0.4
0.6
0.8
1.0
1.2
0.0 0.2 0.4 0
MM
S si
mpl
ifie
d fo
otpr
int (
kg C
O2e
kg-1
FP
CM
)
MMS detailed footpri
Fig. 6. Unallocated simplified manure management system (MMS) print based on 12 main fusing the detailed set of animal rations (531 observations, R2 ¼ 0.99, standard error ¼ 0.0144999; 6, 5000e6999; �, 7000e8999; , 9000e10,999; B, 11,000e12,999; þ, >13,000).
The median overall allocated footprint across all farms amountsto 1.14 kg CO2e kg�1 FPCM, typically varying between 0.74 (1stpercentile of farms) and 2.46 kg CO2e kg�1 FPCM (99th percentile offarms). These figures are very close to the figures obtained by thedetailed model: the median overall allocated footprint across allfarms amounts to 1.14 kg CO2e kg�1 FPCM (note that minormodifications for consistency purposes have been made to Thoma
.6 0.8 1.0 1.2
nt (kg CO2e kg-1 FPCM)
eed types and generic replacement animals as a function of the unallocated MMS printkg CO2e kg�1 FPCM), grouped by milk productivity in kg FPCM head�1 y�1 (,, 1700e

0.0
0.1
0.2
0.3
0.4
0.5
0.6
0.7
0.8
0.9
1.0
0.0 0.1 0.2 0.3 0.4 0.5 0.6 0.7 0.8 0.9 1.0
Man
ure
on p
astu
re s
impl
ifie
d fo
otpr
int (
kg C
O2e
kg-1
FP
CM
)
Manure on pasture detailed footprint (kg CO2e kg-1 FPCM)
Fig. 7. Unallocated simplified manure pasture print based on 12 main feed types and generic replacement animals as a function of the unallocated manure pasture print using thedetailed set of animal rations (531 observations, R2 ¼ 0.99, standard error ¼ 0.010 kg CO2e kg�1 FPCM), grouped by milk productivity in kg FPCM head�1 y�1 (,, 1700e4999; 6,5000e6999; �, 7000e8999; , 9000e10,999; B, 11,000e12,999; þ, >13,000).
A.C. Asselin-Balençon et al. / International Dairy Journal 31 (2013) S65eS77S74
et al. (2013c), that reduces the average from 1.26 to1.14 kg CO2e kg�1 FPCM), typically varying between 0.73 (1stpercentile of farms) and 2.48 kg CO2e kg�1 FPCM (99th percentile offarms).
The farms with the highest footprint are those with thehighest ratios of DMI per kg FPCM (DMI ratio). The DMI per kgFPCM based on the 12 selected feeds is therefore able to explaina large share of the variability on its own (76%: Fig. 9). The 95%confidence interval on prediction based solely on the DMI ratioinstead of the 12 individual feed types increases to0.42 kg CO2e kg�1 FPCM for an individual farm: a factor 3.5 times
Fig. 8. Total simplified print as a function of the total print from the detailed survey (531 obsintake (DMI) ratios in kg DM kg�1 FPCM (,, 0.60e0.89; 6, 0.90e0.99; �, 1.00e1.09; , 1.1
higher than for the simplified model. Indeed, the predictionbased on the DMI ratio is less refined, as it does not account forthe fact that different feeds have different CFs, which is accoun-ted for in the model based on the 12 feed types.
3.2. Scenario analysis and uncertainty
The variability across farms from the different prints can berepresented by a histogram of the total carbon footprint sorted byincreasing farm gate footprint (per kg FPCM; Fig. 10).
ervations, R2 ¼ 0.98, standard error ¼ 0.062 kg CO2e kg�1 FPCM), grouped by dry matter0e1.19; B, 1.20e1.39; þ, >1.40).

0.0
0.5
1.0
1.5
2.0
2.5
3.0
3.5
4.0
0.0 0.5 1.0 1.5 2.0 2.5 3.0 3.5
Tot
al d
etai
led
carb
on f
ootp
rint
[kg
CO
2e k
g-1 F
PC
M)
DMI ratio (kg DM kg-1 FPCM)
Fig. 9. Total unallocated print from the detailed survey as a function of the dry matter intake (DMI) ratio per kg FPCM [regression line: GHGtotaldetailed ¼ gtotal DMI$DMITOTAL; 531
observations, R2 ¼ 0.76, standard error ¼ 0.21 kg CO2e kg�1 FPCM, slope ¼ 1.15 (95% CI 1.14e1.17)], grouped by milk productivity in kg FPCM head�1 y�1 (,, 1700e4999; 6, 5000e6999; �, 7000e8999; , 9000e10,999; B, 11,000e12,999; þ, >13,000).
A.C. Asselin-Balençon et al. / International Dairy Journal 31 (2013) S65eS77 S75
As discussed by Thoma et al. (2013c), there appears to bea generally increasing contribution frommanure management withincreasing overall footprint. However, no other clear correlationsbetween carbon footprint per kgmilk and farmoperations or size areobvious. The exception to this is that farmswith a very high footprint
Fig. 10. Distribution of the unallocated greenhouse gas impact among farm
on the right of Fig. 10 are in the low to middle size range in terms ofmilk production. One implication of these observations is thatopportunities for GHG reductions need to be identified on an indi-vidual farm basis, thus validating the need for a simplified tool thatenables each farmer to identify opportunities for improvement.
s as a function of the percentile milk production of all surveyed farms.

A.C. Asselin-Balençon et al. / International Dairy Journal 31 (2013) S65eS77S76
Based on Fig. 10, we suggest that national-level improvementstrategies should address both the farms with a high carbon foot-print as well as the best farms that are driving best managementpractices. Based on this representation, we tested the followingimprovement scenario:
a) For the footprint per kg below the 50th percentile, the footprintis reduced by 10%;
b) For the footprint above the 50th percentile, the carbon foot-print per kg milk is reduced to the value of farms fora percentile 25% lower (Fig. 10 e improvement scenario).
Overall, this strategy would enable a 15% reduction of theaverage carbon footprint. The highest and targeted reduction forfarms with high footprints therefore enables an important 5%additional reduction on the national average compared to a 10%baseline reduction for all farms.
Regarding the overall uncertainty assessment, the average foot-print calculated by Thoma et al. (2013b) yields an average carbonfootprint of 2.05 kg CO2e kg�1 FPCM consumed, with a 95% confi-dence band ranging from 1.7 to 2.6 kg CO2e kg�1 FPCM consumed.Assuming as a first proxy that the uncertainty due to input modelparameters as analyzed by Thoma et al. (2013b) is lognormallydistributed around the mean with a square of the geometric stan-dard deviation (GSD) of GSD2
GHG input parametersy1:23 (5%percentile¼mean/1.23, 95% percentile¼mean� 1.23) and that theadditional uncertainty due tomodel simplification is also lognormalwith a GSD2
GHG additional simplifiedy1:09, the overall uncertainty onthe final simplified model for individual farms can be characterizedby the following GSD2
GHG (Rosenbaum, Pennington, & Jolliet, 2004):
GSD2GHGoverall ¼ e
ffiffiffiffiffiffiffiffiffiffiffiffiffiffiffiffiffiffiffiffiffiffiffiffiffiffiffiffiffiffiffiffiffiffiffiffiffiffiffiffiffiffiffiffiffiffiffiffiffiffiffiffiffiffiffiffiffiffiffiffiffiffiffiffiffiffiffiffiffiffiffiffiffiffiffiffiffiffiffiffiffiffiffiffiffiffiffiðlnGSD2
GHG input parametersÞ2þðlnGSD2GHG additional simplifiedÞ2
q
¼ effiffiffiffiffiffiffiffiffiffiffiffiffiffiffiffiffiffiffiffiffiffiffiffiffiffiffiffiffiffiffiffiffiðln1:23Þ2þðln1:09Þ2
py1:25
ð23Þ
4. Conclusion
The present analysis has shown the crucial importance of thefeed efficiency and themanuremanagement practice on the carbonfootprint per kg milk. The simplified model is able to explain 98% ofthe variability in the total carbon feed print across 531 farms, whilestrongly reducing the farm-specific data requirement to 12 feedrations for lactating cows against the 162 animal-rations of thedetailed survey of Thoma et al. (2013c). The additional 95% confi-dence interval on the carbon footprint of an individual farmamounts to less than 10%.
The simplified version of the tool represents the variationsacross farms well with an overall square of the geometric standarddeviation of 1.4. This means that the 95% confidence interval isbetween the best estimate for the considered farm divided by 1.4and the best estimate multiplied by 1.4. In practice, this means thatthe simplified tool enables the farmer to have a fair estimate of hisfootprint while strongly reducing the data requirements comparedto the detailed survey of Thoma et al. (2013c).
The uncertainty assessment represents only a first estimate ofuncertainty regarding the lack of accurate data on individualparameter distribution and standard deviations. Improvements areespecially needed in estimating the fertilizer and different auxiliaryinputs per kg crop. In addition, data should be collected in sucha manner as to ensure that rations and different regional parame-ters are determined from a statistically representative sample ofthe farm demographics.
Mitigation scenarios demonstrate the need to address the lessefficient farms, though their impact on the overall USA averagecarbon footprint remains limited. Effects of different management
practices, such as digesters, energy reduction scenarios or cull rates,could be tested using this simplified tool. In addition, futureresearch should target enteric methane emissions, with a focus onmicrobiological research on diets and biological flora to promotelower emissions.
The developed calculator represents a powerful tool forproducers to evaluate their own key parameters of influence, and totest the most efficient best management practices corresponding totheir specific behavior. Finally, it is crucial the GHG is not analyzedunilaterally (i.e., without consideration of potential tradeoffs withother impact categories).
Acknowledgments
This workwas funded by the Innovation Center for US Dairy. TheInnovation Center played an instrumental role in collection of theon-farm data. Without the strong industry commitment to collecthigh quality data, this study would not have been possible. Finally,the Innovation Center has worked with the publisher in theestablishment of this special issue.
Appendix A. Supplementary data
Supplementary data related to this article can be found at http://dx.doi.org/10.1016/j.idairyj.2012.09.004.
References
Benbrook, C., Carman, C., Clark, E. A., Daley, C., Fulwider, W., Hansen, M., et al.(2010). “Shades of green” (SOG) dairy farm management calculator (Version 1.1;computer software). URL. http://www.organic-center.org/sog.html.
Carbon Farming Group. (2009). Calculator other emissions (computer software). URL.http://www.carbonfarming.org.nz/calculators/.
Eckard, R., Hegarty, R., Thomas, G., Kildare, R., Christie, K., & Rawnsley, R. (2009).DGAS calculator (computer software). URL. http://www.dairyingfortomorrow.com/index.php?id¼47.
E-CO2Project. (2012). E-CO2 project (wwwpage) URL. http://www.eco2project.co.uk/.EIA. (2010). Voluntary reporting of greenhouse gases program: Reporting tools (Version
1.0) (Energy Information Administration computer software). URL. http://www.eia.gov/oiaf/1605/reporting_tools.html.
EPA. (2010). FarmWare (US Environmental Protection Agency AgStar computer soft-ware). URL. http://www.epa.gov/agstar/tools/project-dev/farmware.html.
Frischknecht, R., Jungbluth, N., Althaus, H.-J., Doka, G., Dones, R., Heck, T., et al.(2005). The ecoinvent database: overview and methodological framework.International Journal of Life Cycle Assessment, 10, 3e9.
Giltrap, D. L., Li, C., & Saggar, S. (2010). DNDC: a process-based model of greenhousegas fluxes from agricultural soils. Agriculture, Ecosystems and Environment, 136,292e300.
IDF. (2010). A common carbon footprint approach for dairy e the IDF guide tostandard life cycle assessment methodology for the dairy sector. In Bulletin 445of the International Dairy Federation. Brussels, Belgium: International DairyFederation.
IPCC. (2006). In S. Eggleston, L. Buendia, K. Miwa, T. Ngara, & K. Tanabe (Eds.). 2006Intergovernmental Panel on Climate Change guidelines for national greenhouse gasinventories, Vols. 1e5. Hayama, Japan: Institute for Global EnvironmentalStrategies.
McSwiney, C. P., Bohm, S., Grace, P. R., & Robertson, G. P. (2010). US croplandgreenhouse gas calculator (computer software). URL. http://surf.kbs.msu.edu/ghgcalculator/.
Parton, W. J., Ojima, D. S., Cole, C. V., & Schimel, D. S. (2008). DayCent: Daily centurymodel (Version 4.5; computer software). URL. http://www.nrel.colostate.edu/projects/daycent/index.html.
Parton, W. J., Schimel, D. S., Cole, C. V., & Ojima, D. S. (2006). Century (Version 5:computer software). URL. http://www.nrel.colostate.edu/projects/century5/.
Popp, J., Thoma, G. J., Mulhern, J., Jaeger, A., LeFranc, L., & Kemper, N. (2013). Col-lecting complex comprehensive farm-level data through a collaborativeapproach: a framework developed for a life cycle assessment of fluid milkproduction in the US. International Dairy Journal, 31, S15eS20.
Rosenbaum, R., Pennington, D. W., & Jolliet, O. (2004). An implemented approachfor estimating uncertainties for toxicological impact characterisation. In C. Pahl-Wostl, S. Schmidt, A. E. Rizzoli, & A. J. Jakeman (Eds.). Complexity and integratedresources management: Transactions of the 2nd biennial meeting of the interna-tional environmental modelling and software society, Vol. 1 (pp. 307e312).Manno, Switzerland: iEMSs.
Rotz, C. A., & Chianese, D. S. (2009). The dairy greenhouse gas model (Version 1.2;computer software). URL. http://www.ars.usda.gov/Main/docs.htm?docid¼17355.

A.C. Asselin-Balençon et al. / International Dairy Journal 31 (2013) S65eS77 S77
Rotz, C. A., Corson, M. S., Chianese, D. S., Montes, F., Hafner, S. D., Jarvis, R.,et al. (2011). The integrated farm system model (IFSM): Reference manual(Version 3.4). Washington, DC, USA: United States Department ofAgriculture.
Thoma, G., Jolliet, O., & Wang, Y. (2013a). A biophysical approach to allocation of lifecycle environmental burdens for fluid milk supply chain analysis. InternationalDairy Journal, 31, S41eS49.
Thoma, G., Matlock, M. D., Shonnard, D., Cummins, E., Neiderman, Z., Cothren, J.,et al. (2010). National scan-level beyond carbon life cycle study for production ofUS dairy. Unpublished manuscript.
Thoma, G., Popp, J., Nutter, D., Shonnard, D., Ulrich, R., Matlock, M. M., et al. (2013b).Greenhouse gas emissions from milk production and consumption in the
United States of America: a cradle to grave life cycle assessment circa 2008.International Dairy Journal, 31, S3eS14.
Thoma, G., Popp, J., Shonnard, D. R., Nutter, D., Matlock, M., Ulrich, R., et al. (2013c).Regional analysis of greenhouse gas emissions from U.S. dairy farms: a cradle tofarm-gate assessment of the American dairy industry circa 2008. InternationalDairy Journal, 31, S29eS40.
Unilever. (2011). Cool farm tool (v1.1; Unilever, Sustainable Food Laboratory, &University of Aberdeen computer software). URL. http://www.unilever.com/aboutus/supplier/sustainablesourcing/tools/?WT.LHNAV¼Tools.
USDA NRCS. (2011). COMET-VR (Version 1.1; US Department of Agriculture NaturalResource Conservation Service and Colorado State University Natural ResourcesEcology Laboratory computer software). URL. http://www.cometvr.colostate.edu/.
Related Documents


