NEGOTIATIONS BETWEEN DAIMLER AND CHRYSLER Yoichi Miyata

Welcome message from author
This document is posted to help you gain knowledge. Please leave a comment to let me know what you think about it! Share it to your friends and learn new things together.
Transcript
NEGOTIATIONS BETWEEN
DAIMLER AND CHRYSLER
Yoichi Miyata
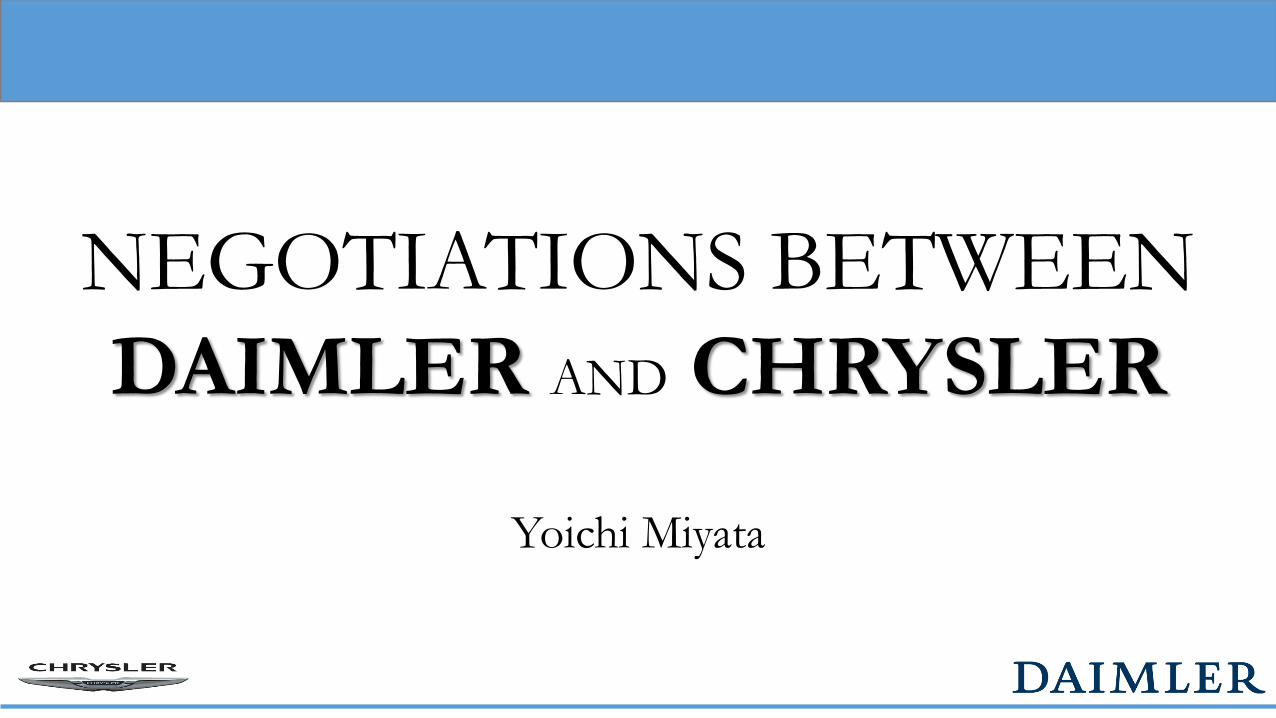
Envy of US Auto-market
1980s late-1990s mid
1-1, History of Chrysler with Automobile Industry Dynamism
1924 Launched
1984 Family Minivan Rise
share47%/Dominant the
segment to 1996
1995 Kirk Kerkorion
Hostile Bid to Chrysler
1983 Invented Minivan
Dodge Caravan
Plymouth Voyager
1989 Platform Teams
well worked to 1991 1991 Functional Group
1=Small 2=Large
3=Minivan 4=Jeep/Truck
1989 Narrowed Supplier
Base 2500 to 1140
1989 SCORE
1993 LH Series
Chrysler/Concorde/Dodge
Intrepid/Eagle Vision
1987 Acquisition
American Motors : Jeep
★Consolidation
1,PwC : Analytics in 1997
Total Mergers or Alliances = 750
Worth of = US$28billion
2,Standard&Poor`s Predictions
The Current International Producers 39
Reduced to about 20 major companies.
★Supply Side Change early 1998
1,Time Pressures = design and introduction of new and innovative model
2, Relentless Cost * Shortened Product Life Cycle with Lowered Price
★Demand Side Change early 1998
1, Internet Lowered Barriers to Information Transfer
2, Product Introduction and Commonality 3, Virtual Customer involving
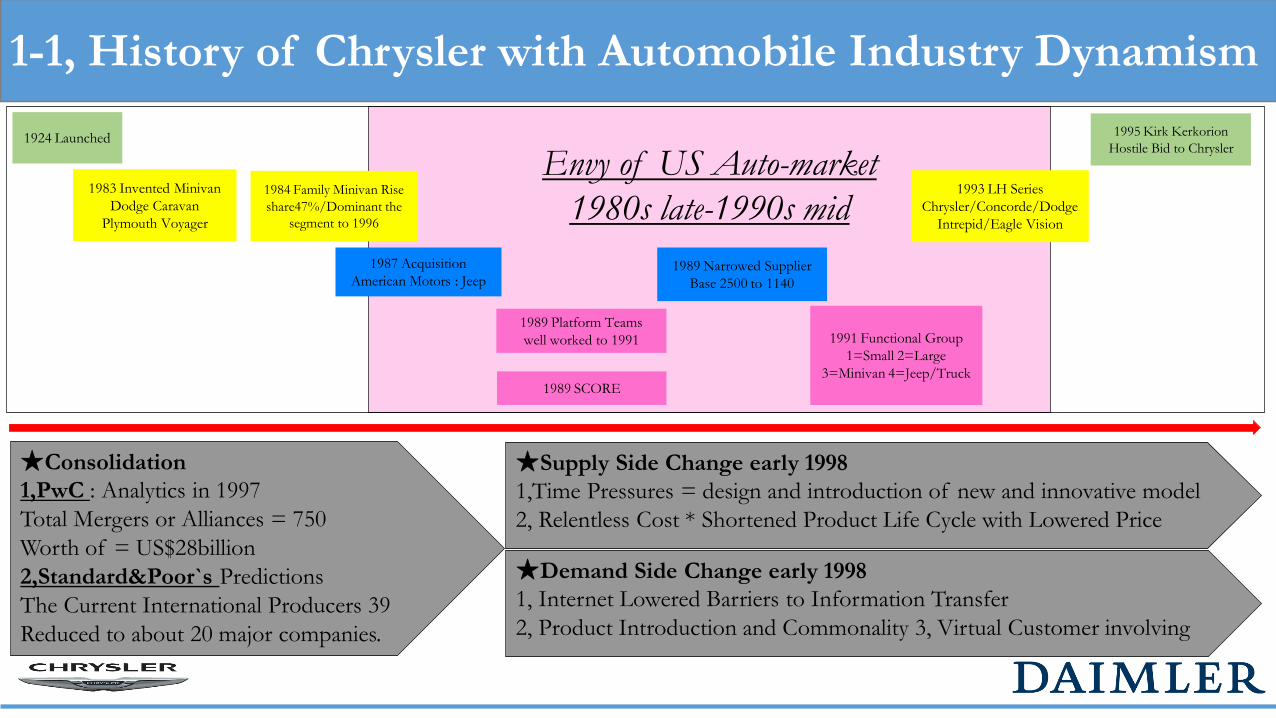
1-2, Competitive Dynamism
First-tier firms
★World Wide Strategy
1,Capability to go global without major acquisitions.
2,Buying smaller producer with recognized name brands.
★The Mantra *Trend of Consolidation
If you wish to succeed, you have to be worldwide.
★Political Pressure *West Europe
1,Protect Domestic Employment
2,Against to Go Abroad just because of Cost Reduction
Taken Equity Stakes
International Operation
Export
Assembled and Engineered
for foreign markets
Sourced from
non-U.S. suppliers
★What`s the Global Companies in Automobile Industry?
Few Successes at building and distributing a Global Car.
★Overcapacity
Rationalizing Assembly Plant.
Western Europe 30% more than market demands.
*Negative Cycle of Overcapacity
Idle Equipment → Wasted Investments
→ Underutilized Workers → Subnormal Returns

2-1, Macro Indicators
FordMotor
GeneralMotors
Chrysler NavistarHondaMotor
NissanMotor
ToyotaMotor
Daimler-Benz
Volvo BMWPeugeot-Citroen
Fiat Audi Renault
1997 Revenues $153,627 $166,445 $61,147 $6,321 $45,111 $49,358 $87,807 $68,951 $23,118 60,137 186,785 89,658 22,410 207,912
1997 Profits/Revenues 4.50% 3.77% 4.59% 2.37% 4.34% 0.77% 3.89% 2.56% 1.73% 2.07% -1.48% 2.70% 1.64% 2.61%
$153,627
$166,445
$61,147
$6,321
$45,111 $49,358
$87,807
$68,951
$23,118
60,137
186,785
89,658
22,410
207,912
4.50%
3.77%
4.59%
2.37%
4.34%
0.77%
3.89%
2.56%
1.73%
2.07%
-1.48%
2.70%
1.64%
2.61%
-2.00%
-1.00%
0.00%
1.00%
2.00%
3.00%
4.00%
5.00%
$-
$50,000
$100,000
$150,000
$200,000
$250,000
Comparative Automobile Firms : Revenue and Profit Margin Ratiomillions US$
★Market Size *Based on $US Revenue
US$=661,885million Market Share : Chrysler=9.2% Daimler=10.4%
★Market Concentration Ratio
CR4 : Market Share GM + Ford + TOYOTA + Daimler-Benz=72%
★Scale and Efficiency
Revenue Chrysler=US$61,147 Daimler=US$68,951
Profit Margin Ratio Chrysler=4.59% Daimler=2.56%
⁂ Chrysler achieved most highest Profit Margin Ratio
General Motors, 25.1%
Ford Motor, 23.2%
Toyota Motor, 13.3%
Daimler-Benz, 10.4%
Chrysler, 9.2%
Nissan Motor, 7.5%
Honda Motor, 6.8%
Volvo, 3.5% Navistar, 1.0%
Market Share in 1997 excluding non-U.S.dollars audited European Firms
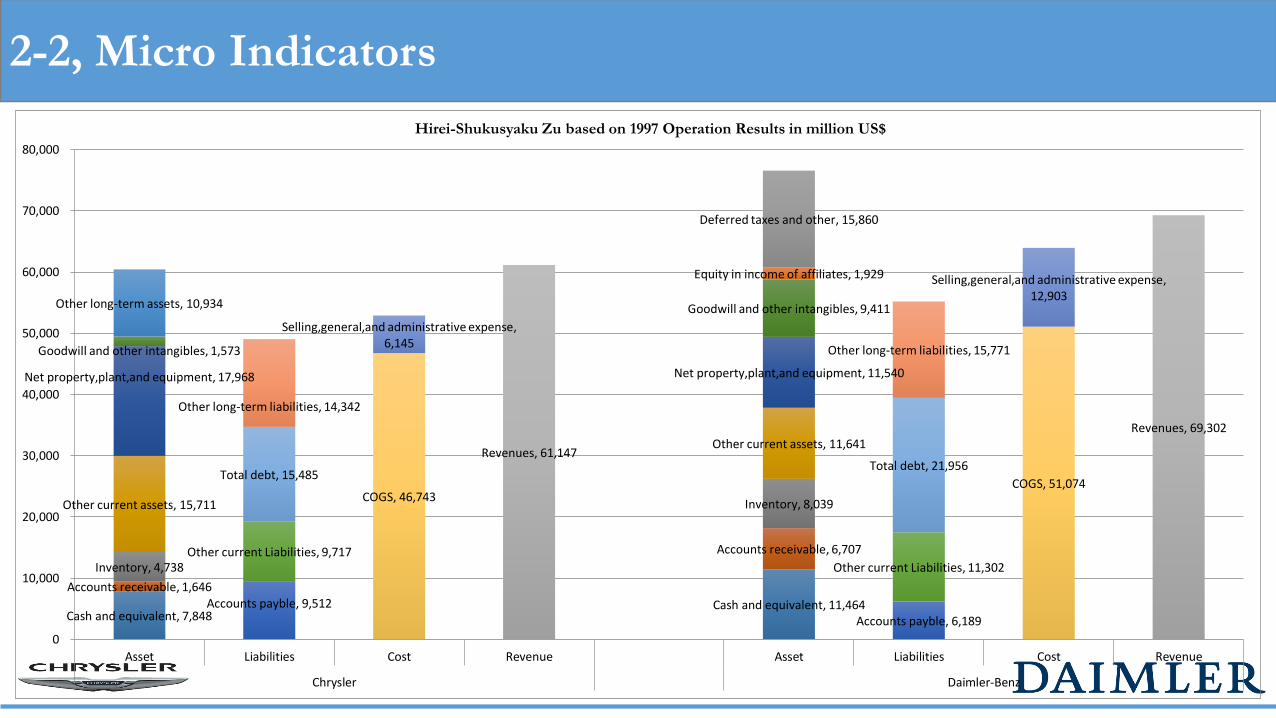
2-2, Micro Indicators
Cash and equivalent, 7,848 Cash and equivalent, 11,464
Accounts receivable, 1,646
Accounts receivable, 6,707
Inventory, 4,738
Inventory, 8,039 Other current assets, 15,711
Other current assets, 11,641
Net property,plant,and equipment, 17,968 Net property,plant,and equipment, 11,540
Goodwill and other intangibles, 1,573
Goodwill and other intangibles, 9,411 Other long-term assets, 10,934
Equity in income of affiliates, 1,929
Deferred taxes and other, 15,860
Accounts payble, 9,512
Accounts payble, 6,189
Other current Liabilities, 9,717 Other current Liabilities, 11,302
Total debt, 15,485 Total debt, 21,956
Other long-term liabilities, 14,342
Other long-term liabilities, 15,771
Revenues, 61,147
Revenues, 69,302
COGS, 46,743 COGS, 51,074
Selling,general,and administrative expense, 6,145
Selling,general,and administrative expense, 12,903
0
10,000
20,000
30,000
40,000
50,000
60,000
70,000
80,000
Asset Liabilities Cost Revenue Asset Liabilities Cost Revenue
Chrysler Daimler-Benz
Hirei-Shukusyaku Zu based on 1997 Operation Results in million US$
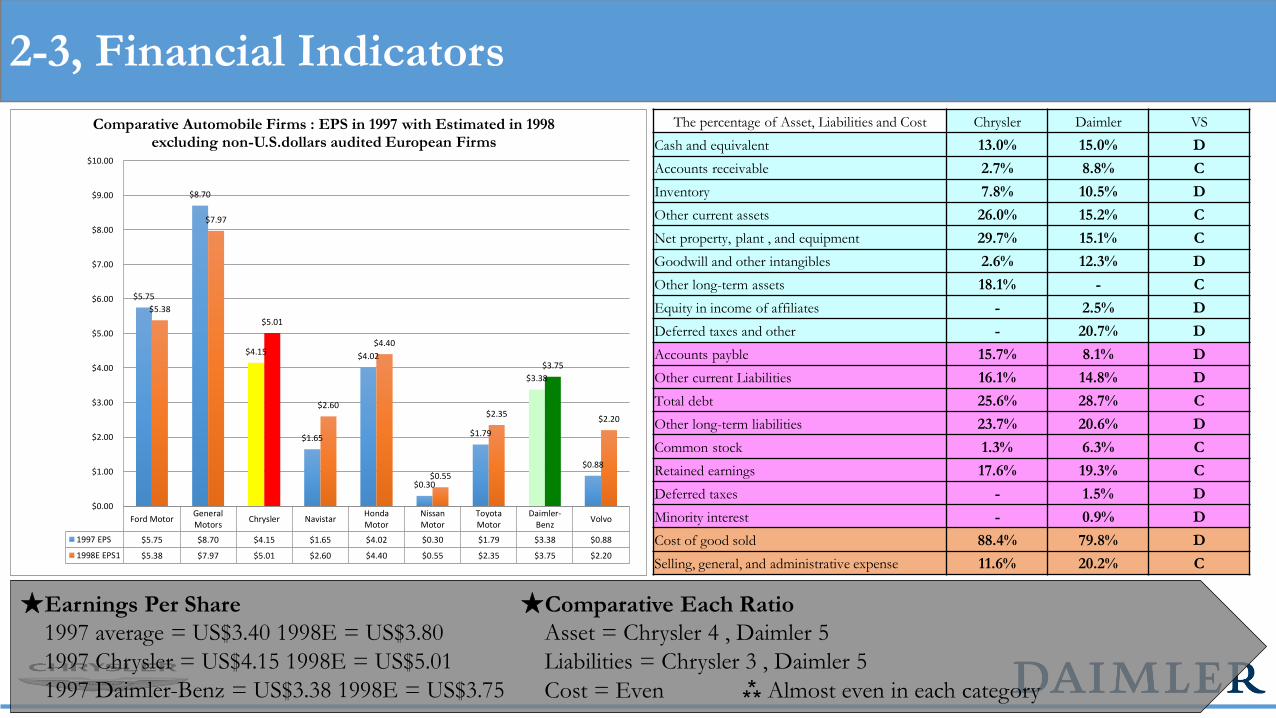
2-3, Financial Indicators
Ford MotorGeneralMotors
Chrysler NavistarHondaMotor
NissanMotor
ToyotaMotor
Daimler-Benz
Volvo
1997 EPS $5.75 $8.70 $4.15 $1.65 $4.02 $0.30 $1.79 $3.38 $0.88
1998E EPS1 $5.38 $7.97 $5.01 $2.60 $4.40 $0.55 $2.35 $3.75 $2.20
$5.75
$8.70
$4.15
$1.65
$4.02
$0.30
$1.79
$3.38
$0.88
$5.38
$7.97
$5.01
$2.60
$4.40
$0.55
$2.35
$3.75
$2.20
$0.00
$1.00
$2.00
$3.00
$4.00
$5.00
$6.00
$7.00
$8.00
$9.00
$10.00
Comparative Automobile Firms : EPS in 1997 with Estimated in 1998excluding non-U.S.dollars audited European Firms
The percentage of Asset, Liabilities and Cost Chrysler Daimler VS
Cash and equivalent 13.0% 15.0% D
Accounts receivable 2.7% 8.8% C
Inventory 7.8% 10.5% D
Other current assets 26.0% 15.2% C
Net property, plant , and equipment 29.7% 15.1% C
Goodwill and other intangibles 2.6% 12.3% D
Other long-term assets 18.1% - C
Equity in income of affiliates - 2.5% D
Deferred taxes and other - 20.7% D
Accounts payble 15.7% 8.1% D
Other current Liabilities 16.1% 14.8% D
Total debt 25.6% 28.7% C
Other long-term liabilities 23.7% 20.6% D
Common stock 1.3% 6.3% C
Retained earnings 17.6% 19.3% C
Deferred taxes - 1.5% D
Minority interest - 0.9% D
Cost of good sold 88.4% 79.8% D
Selling, general, and administrative expense 11.6% 20.2% C
★Earnings Per Share
1997 average = US$3.40 1998E = US$3.80
1997 Chrysler = US$4.15 1998E = US$5.01
1997 Daimler-Benz = US$3.38 1998E = US$3.75
★Comparative Each Ratio
Asset = Chrysler 4 , Daimler 5
Liabilities = Chrysler 3 , Daimler 5
Cost = Even ⁂ Almost even in each category

★Unbalanced Product Portfolio = Sales Heavily Rely on Trucks
★Increased Competition on the Chrysler`s competitive and profitable sales zone by New Products
⁂ Chrysler need to Reinforce it`s car segment competitiveness by themselves or by leverage other`s capability in Strategic Way
3-1, Chrysler`s Product Portfolio
Trucks
Sport-Utility
VehiclesJeep
Wrangler
Jeep Cherokee
Dodge
Durango
Pick-up Trucks Dodge Ram
Minivan
Share 47%
Plymouth
Voyager
Cars
1/3 of Total Sales in 1997
$US61,147million*0.3=18,344
2/3 of Total Sales in 1997
$US61,147million*0.67=40,968
High Profitability
Price
Range
Increased
Competition
Increased
Competition
Chrysler
Dodge
Plymouth
Chrysler`s 3 Brand
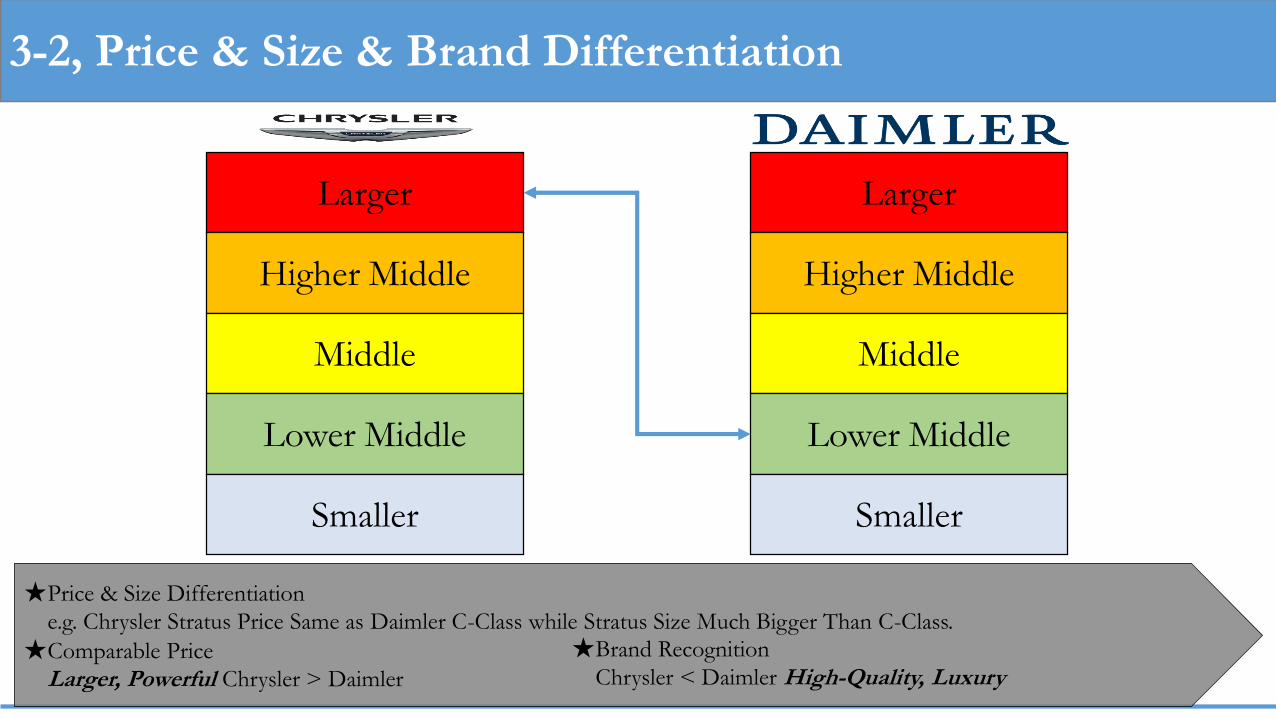
3-2, Price & Size & Brand Differentiation
Larger
Higher Middle
Middle
Lower Middle
Smaller
Larger
Higher Middle
Middle
Lower Middle
Smaller
★Price & Size Differentiation
e.g. Chrysler Stratus Price Same as Daimler C-Class while Stratus Size Much Bigger Than C-Class.
★Comparable Price
Larger, Powerful Chrysler > Daimler
★Brand Recognition
Chrysler < Daimler High-Quality, Luxury

3-3, Chrysler`s International Market Strategy
★Outside North America Vehicle Sales
1990 = 50thousand units
1997 = 237thousand units → 10% of total unit sales of Chrysler.
★Chrysler Need to Broaden or Expand it`s distribution
channel more Internationally.
★The Focused Latin America
1996 → 1997 region sales growth more than 100%
★Venezuela ⁂No.1 oversee Market but ranked No.4
Retail Sales 20thousand units
★Venezuela ratio to Oversee Sales
roughly 8.4%
Cherokee
sport-utility vehicles
Jeep Grand Cherokee
Neon passenger car
Local
Distribution
Export
Carababo
Assembly
PlantLuritiba
New Plant
950thousand
square meters
Jeep Grand Cherokee
Dodge Dakota
Pick up truck
JV US$500million
Engine plantWarehouse
Technical Training Center
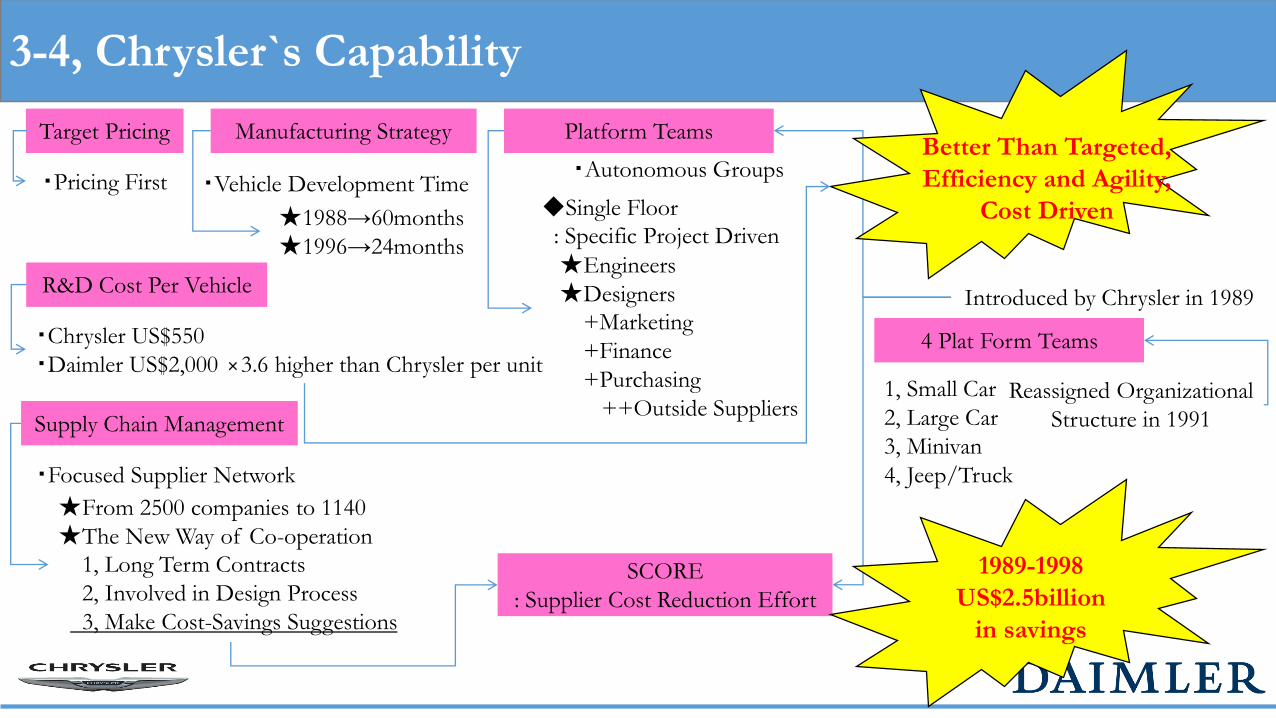
3-4, Chrysler`s Capability
Manufacturing Strategy
・Vehicle Development Time
★1988→60months
★1996→24months
Platform Teams
・Autonomous Groups
◆Single Floor
: Specific Project Driven
★Engineers
★Designers
+Marketing
+Finance
+Purchasing
++Outside Suppliers
Target Pricing
・Pricing First
Introduced by Chrysler in 1989
Supply Chain Management
・Focused Supplier Network
★From 2500 companies to 1140
★The New Way of Co-operation
1, Long Term Contracts
2, Involved in Design Process
3, Make Cost-Savings Suggestions
SCORE
: Supplier Cost Reduction Effort
1989-1998
US$2.5billion
in savings
Better Than Targeted,
Efficiency and Agility,
Cost Driven
R&D Cost Per Vehicle
・Chrysler US$550
・Daimler US$2,000 ×3.6 higher than Chrysler per unit4 Plat Form Teams
1, Small Car
2, Large Car
3, Minivan
4, Jeep/Truck
Reassigned Organizational
Structure in 1991
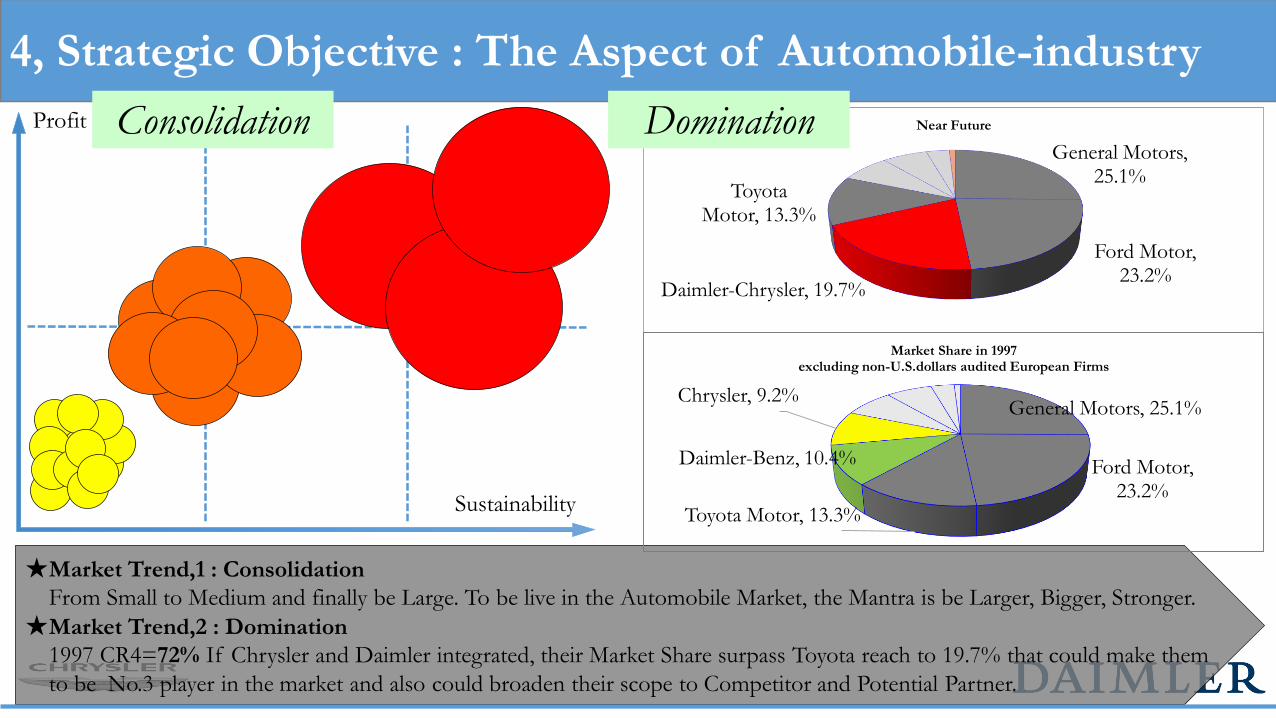
★Market Trend,1 : Consolidation
From Small to Medium and finally be Large. To be live in the Automobile Market, the Mantra is be Larger, Bigger, Stronger.
★Market Trend,2 : Domination
1997 CR4=72% If Chrysler and Daimler integrated, their Market Share surpass Toyota reach to 19.7% that could make them
to be No.3 player in the market and also could broaden their scope to Competitor and Potential Partner.
4, Strategic Objective : The Aspect of Automobile-industry
Profit
Sustainability
Consolidation
General Motors, 25.1%
Ford Motor, 23.2%
Toyota Motor, 13.3%
Daimler-Benz, 10.4%
Chrysler, 9.2%
Market Share in 1997 excluding non-U.S.dollars audited European Firms
General Motors, 25.1%
Ford Motor, 23.2%
Daimler-Chrysler, 19.7%
Toyota Motor, 13.3%
Near FutureDomination

5, Why M&A? Why Daimler – Benz?
3, Repositioning : What
Competing
Integrating
1, Vision : Why
・To Be No.1
Automobile/Car
Maker
・Maximize,
Shareholder,
Customer, Society
and all other
Stakeholder`s Value
2, Advantages : How
M:Cost Driven Management
H:Innovative Team Building
P:Competitive Truck Segment
M:Two Headed Bord
H:Worker`s Involvement
P:Luxuary
Full C
ar Lin
e-up, B
rand
, Distrib
utio
n,
Cap
ital, Co
st Red
uctio
n E
ffect, Barg
ainin
g
4, Goal
★Sales
★Profitability
★Innovation
★Quality
★Brand
★Benefit
★Stakeholders
★Lead Industry
★Why, How, What?
In order to meet all stakeholder`s value and maximize it, Chrysler and Daimler should be the No. 1 maker. Follow to market
shift, to catch on it or to lead it, the integration of Chrysler and Daimler with leverage each other`s advantage is much more
efficient and speedy way to achieve it. To achieve it, integrated two companies could aggressively compete with Top-tier maker
and at the same time aggressively offer integration to small producers. The cycle could make them be dominant player.

6, Interim Report
Transaction Execution
Validation ExecutionIntegration
Target
Screening
Internal
Valuation
ObjectivesCriteria
Development
Position
Assessment
Strategy
Development
Implementation
Planning
Target
Identification
Long-list
Long-list
Evaluation
Short-list
Merger Benefit
Potential
Market
Context
Desirability Achievability
Related Documents