80 DAFTAR PUSTAKA Anoraga, Panji, 2001, Psikologi Kepemimpinan, Rineka Cipta, Jakarta. Ardana, I Komang, Mujiati, Ni Wayan dan I Wayan Mudiartha, 2012, Manajemen Sumber Daya Manusia, Graha Ilmu, Yogyakarta. Arikunto, Suharsimi, 2005, Manajemen Penelitian, Rineka Cipta, Jakarta. As’ad, Moh.,2003, Psikologi Industri, Ghalia Indonesia, Yogyakarta. Creswell, Jhon W., 2003, Desain Penelitian: Pendekatan Kualitatif dan Kuantitatif, KIK Press, Jakarta. Ghozali, Imam, 2005, Analisis Multivariate dengan program SPSS, Badan Penerbit Universitas Diponegoro, Semarang. Gondokusumo, A A, 1995, Komunikasi Penugasan, Gunung Agung, Jakarta. Hamalik, Oemar, 1993, Psikologi Manajemen, Trigenda Karya, Bandung. Handoko, T. Hani, 2000, Manajemen Personalia dan Sumber Daya Manusia, BPFE, Yogyakarta. Hasibuan, Malayu S.P., 2011, Manajemen Sumber Daya Manusisa, Bumi Aksara, Jakarta. Kaswan, 2012, Manajemen Sumber Daya Manusia untuk Keunggulan Bersaing Organisasi, Graha Ilmu, Yogyakarta. Lateiner, Alfred R, 1985, Teknik Memimpin Pegawai dan Pekerja, Aksara Baru, Jakarta.

Welcome message from author
This document is posted to help you gain knowledge. Please leave a comment to let me know what you think about it! Share it to your friends and learn new things together.
Transcript

80
DAFTAR PUSTAKA
Anoraga, Panji, 2001, Psikologi Kepemimpinan, Rineka Cipta, Jakarta.
Ardana, I Komang, Mujiati, Ni Wayan dan I Wayan Mudiartha, 2012,
Manajemen Sumber Daya Manusia, Graha Ilmu, Yogyakarta.
Arikunto, Suharsimi, 2005, Manajemen Penelitian, Rineka Cipta, Jakarta.
As’ad, Moh.,2003, Psikologi Industri, Ghalia Indonesia, Yogyakarta.
Creswell, Jhon W., 2003, Desain Penelitian: Pendekatan Kualitatif dan
Kuantitatif, KIK Press, Jakarta.
Ghozali, Imam, 2005, Analisis Multivariate dengan program SPSS, Badan
Penerbit Universitas Diponegoro, Semarang.
Gondokusumo, A A, 1995, Komunikasi Penugasan, Gunung Agung, Jakarta.
Hamalik, Oemar, 1993, Psikologi Manajemen, Trigenda Karya, Bandung.
Handoko, T. Hani, 2000, Manajemen Personalia dan Sumber Daya Manusia,
BPFE, Yogyakarta.
Hasibuan, Malayu S.P., 2011, Manajemen Sumber Daya Manusisa, Bumi
Aksara, Jakarta.
Kaswan, 2012, Manajemen Sumber Daya Manusia untuk Keunggulan Bersaing
Organisasi, Graha Ilmu, Yogyakarta.
Lateiner, Alfred R, 1985, Teknik Memimpin Pegawai dan Pekerja, Aksara Baru,
Jakarta.

81
Mathis, L. Robert and John H. Jackson, 2006, Human Resources Management,
Salemba Empat, Jakarta.
Moekijat, 1999, Manajemen Sumber Daya Manusia (Manajemen
Kepegawaian), Mandar Maju, Bandung.
Nasution, Siska Malisa, 2010, Pengaruh Kesejahteraan Karyawan Terhadap
Semangat Kerja Karyawan Pada PT Pangansari Utama Medan,
Universitas Sumatera Utara,
http://repository.usu.ac.id/bitstream/123456789/11248/1/10E00317.pdf.
(diakses 10 April 2014)
Nitisemito, Alex S., 2002, Manajemen Personalia (Manajemen Sumber Daya
Manusia), Ghalia Indonesia, Jakarta.
Panggabean, Mutiara S., 2002, Manajemen Sumber Daya Manusia, Ghalia
Indonesia, Jakarta.
Ramadhany, Marina, Taher Al Habsji, dan Mochammad Djudi Mukzam , 2013,
Pengaruh Program Kesejahteraan Karyawan Terhadap Semangat Kerja
Karyawan dan Prestasi Kerja Karyawan (Study pada Karyawan Tetap
Kompartemen SDM PT Petrokimia Gresik), Universitas Brawijaya,
http://administrasibisnis.studentjournal.ub.ac.id/index.php/jab/article/down
load/105/173. ( diakses 7 Maret 2014)
Santoso, Singgih, 2001, Buku Latihan SPSS Statistik Parametik, PT Elex Media
Komputindo Gramedia, Jakarta.
Sarahwati, Pengaruh Pelaksanaan Program Kesejahteraan Terhadap
Produktivitas Kerja Direktorat Metrologi Bandung,
http://elib.unikom.ac.id/files/disk1/371/jbptunikompp-gdl-sarahwatiy-
18511-4-lanjutan-.docx . ( diakses 18 Maret 2014)
Siagian, Sondang P., 2009, Manajemen Sumber Daya Manusia, Bumi Aksara,
Jakarta.
82
Sofyandi, Herman, 2008, Manajemen Sumber Daya Manusia, Graha Ilmu,
Yogyakarta.
Straus, George and Leonard R. Sayles, 2003, Personel, The Human Problems of
Management, Prentice Hall of India Private Ltd, New Delhi.
Sugiyono, 2010, Metode Penelitian Bisnis, Alfabeta, Bandung.
Yusuf, Muhammad AM. Naufal, 2003, Konsep dan Aplikasi Regresi Linier
Ganda, http://naufalmti.files.wordpress.com/2010/07/modul-linear-
ganda.pdf. (diakses 10 Juni 2014)
_________ Perjanjian Kerja Bersama Antara Manajemen PT PJB dengan
Serikat Pekerja Pembangkitan Jawa Bali Periode 2011—2013, PT
Pembangkitan Jawa-Bali, Surabaya.
_________Undang-undang No.13 Tahun 2013 Tentang Ketenagakerjaan, (
diakses 23 Mei 2013)
_________Undang-undang No. 40 Tahun 2004 Tentang Sistem Jaminan Sosial
Nasional,
http://disnakertrans.bantulkab.go.id/documents/20100622115456-uu-no-
40-th-2004.pdf . (diakses 22 April 2014)

83
KUESIONER
Dengan Hormat,
Mohon kesediaan Bapak/Ibu/Saudara/i untuk mengisi kuesioner penelitian yang berjudul
“Pengaruh Program Kesejahteraan Karyawaan Terhadap Semangat Kerja
Karyawan PT PJB Unit Pembangkitan Gresik”. Penelitian ini dilakukan dalam rangka
memenuhi tugas akhir S-1 Manajemen Fakultas Ekonomi di Universitas Muhammadiyah
Gresik. Atas kesediaan dan kerjasama Bapak/Ibu/Saudara/i, saya ucapkan terima kasih.
Petunjuk Umum
1. Bacalah baik-baik setiap pertanyaan atau pernyataan dan seluruh alternatif jawaban.
2. Tidak ada jawaban benar atau salah, semuanya tergantung pada anda dan jawaban anda
tidak akan berpengaruh terhadap pekerjaan dan karir anda. Kami hanya
menginginkan jawaban yang jujur sesuai dengan keadaan dan kondisi anda.
Identitas Responden
Nama :
Jenis Kelamin : Laki-laki / Perempuan *coret yang tidak perlu
Usia :
Jabatan :
Masa Bekerja :
Mohon berikan tanda check (√) pada salah satu kolom jawaban yang sesuai dengan
pendapat Bapak/Ibu/Saudara/i.
Pernyataan di bawah ini dengan kode:
SS = Sangat Setuju
S = Setuju
CS = Cukup Setuju
TS = Tidak Setuju
STS = Sangat Tidak Setuju
NO: _____ P

84
Kuesioner Program Kesejahteraan Bersifat Ekonomis
No. Pernyataan SS S CS TS STS
1.
Perusahaan akan mengganti biaya
pengobatan apabila saya berobat
ke rumah sakit manapun
2.
Program pensiun yang ada di
perusahaan cukup baik dan sesuai
dengan tingkat jabatan
3.
Perusahaan memberikan uang
makan dan transport sesuai
dengan kebutuhan saya
Kuesioner Program Kesejahteraan Bersifat Fasilitatif
No. Pernyataan SS S CS TS STS
1.
Sarana SBO (Spiritual, Budaya
dan Olahraga) sangat representatif
untuk saya dalam melaksanakan
ibadah, mengembangkan seni dan
olahraga
2.
Saya mendapatkan manfaat
seperti pendidikan dan pelatihan
dari adanya Akademi Komunitas
Perusahaan
3.
Program cuti yang diberikan
kepada saya sesuai dengan
ketentuan perusahaan
Kuesioner Program Kesejahteraan Bersifat Pelayanan
No. Pernyataan SS S CS TS STS
1.
Adanya evaluasi rutin melalui
OFI (Opportunity for
Improvement) membantu saya
dalam pencapaian kontrak kinerja
2.
Adanya program Employe
Gathering dan Family Gathering
membuat saya terhindar dari
kebosanan kerja
3.
Asuransi kesehatan, kematian dan
kecelakaan membuat saya sangat
merasa aman dan nyaman dalam
bekerja

85
Kuesioner Semangat Kerja
No. Pernyataan SS S CS TS STS
1.
Saya selalu mengikuti prosedur /
tata tertib yang telah ditentukan
oleh perusahaan
2.
Saya selalu berpartisipatif dan
berkontribusitif dalam setiap
pekerjaan yang saya lakukan
3.
Saya sangat puas dengan
pekerjaan, situasi kerja dan
kerjasama pimpinan dengan
sesama karyawan selama ini
Terima kasih untuk kesediaan anda mengisi kuesioner ini.
86
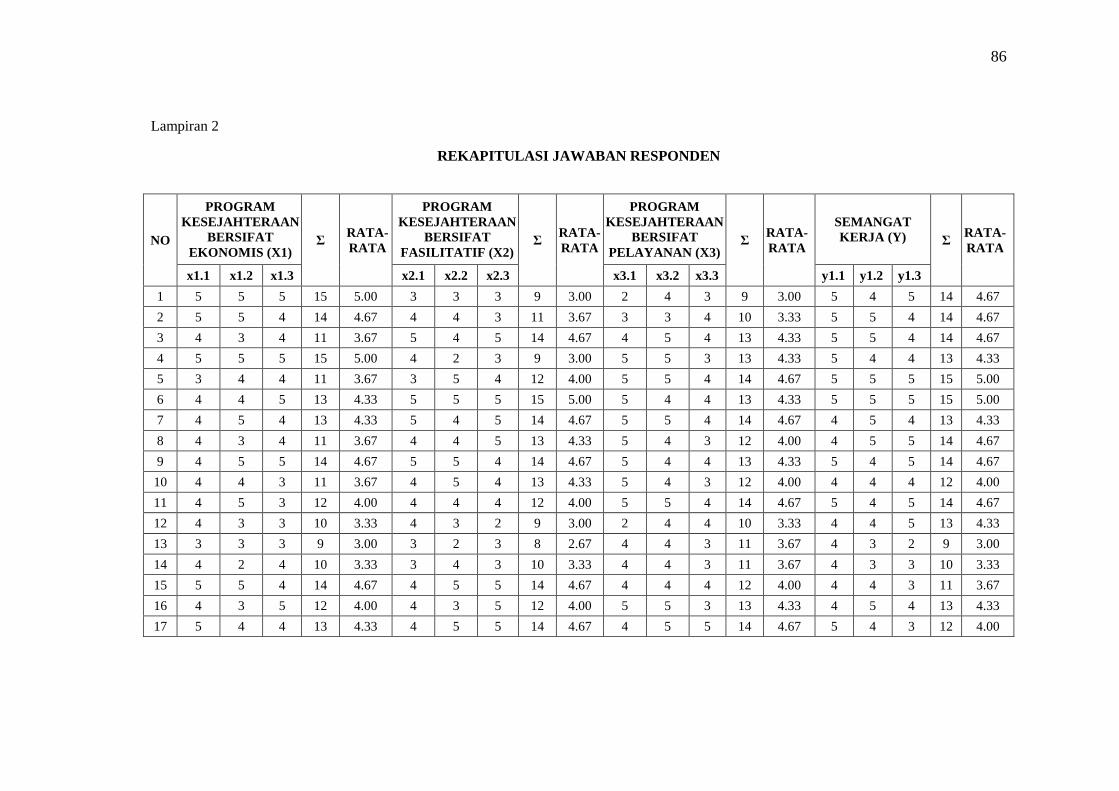
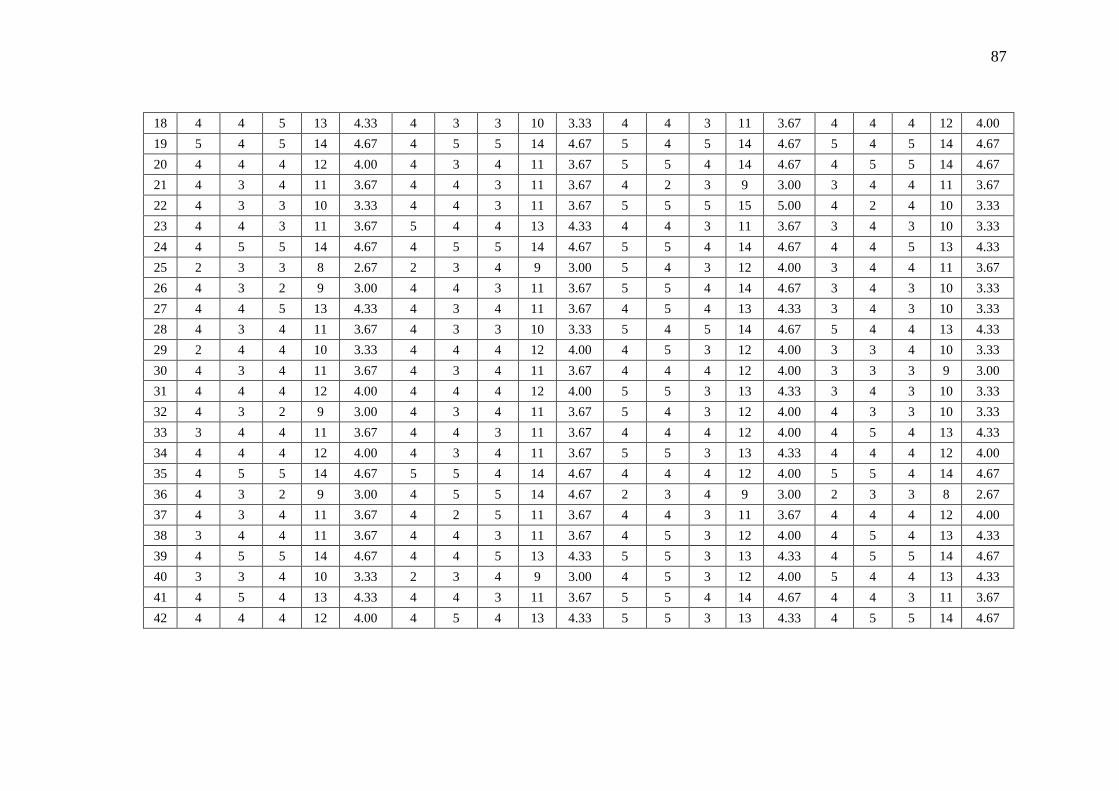
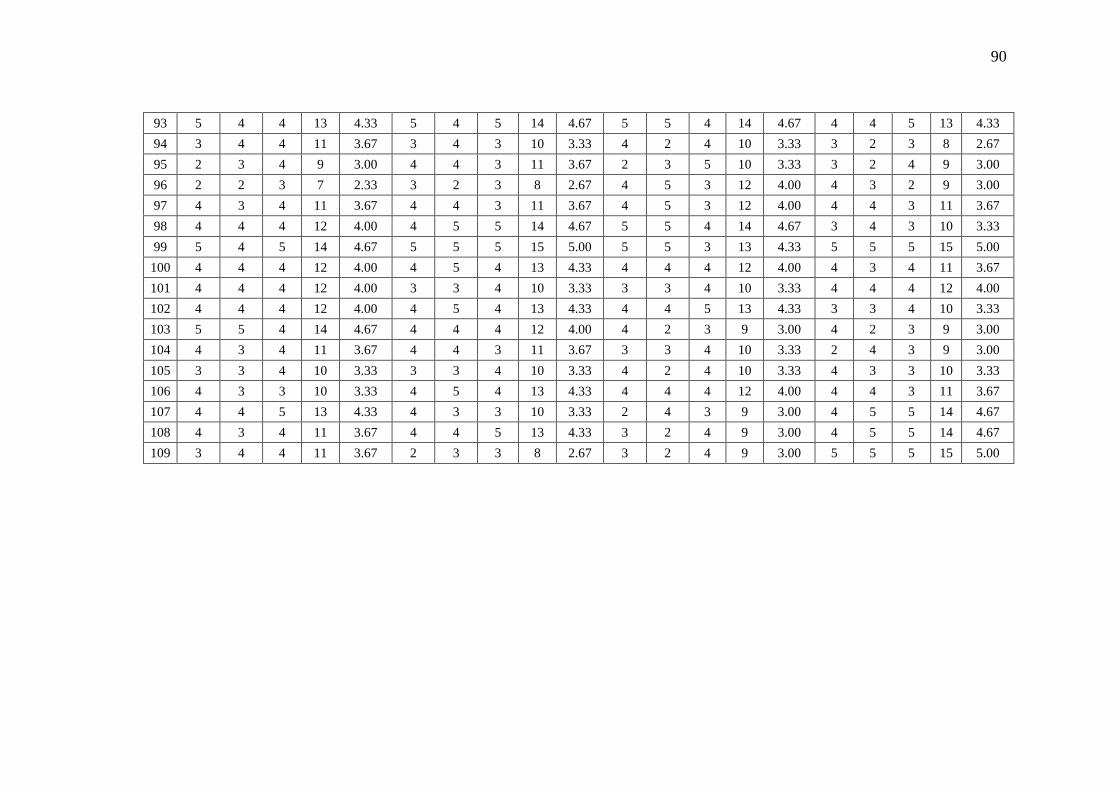
Lampiran 2
REKAPITULASI JAWABAN RESPONDEN
NO
PROGRAM
KESEJAHTERAAN
BERSIFAT
EKONOMIS (X1) Σ
RATA-
RATA
PROGRAM
KESEJAHTERAAN
BERSIFAT
FASILITATIF (X2) Σ
RATA-
RATA
PROGRAM
KESEJAHTERAAN
BERSIFAT
PELAYANAN (X3) Σ
RATA-
RATA
SEMANGAT
KERJA (Y) Σ RATA-
RATA
x1.1 x1.2 x1.3 x2.1 x2.2 x2.3 x3.1 x3.2 x3.3 y1.1 y1.2 y1.3
1 5 5 5 15 5.00 3 3 3 9 3.00 2 4 3 9 3.00 5 4 5 14 4.67
2 5 5 4 14 4.67 4 4 3 11 3.67 3 3 4 10 3.33 5 5 4 14 4.67
3 4 3 4 11 3.67 5 4 5 14 4.67 4 5 4 13 4.33 5 5 4 14 4.67
4 5 5 5 15 5.00 4 2 3 9 3.00 5 5 3 13 4.33 5 4 4 13 4.33
5 3 4 4 11 3.67 3 5 4 12 4.00 5 5 4 14 4.67 5 5 5 15 5.00
6 4 4 5 13 4.33 5 5 5 15 5.00 5 4 4 13 4.33 5 5 5 15 5.00
7 4 5 4 13 4.33 5 4 5 14 4.67 5 5 4 14 4.67 4 5 4 13 4.33
8 4 3 4 11 3.67 4 4 5 13 4.33 5 4 3 12 4.00 4 5 5 14 4.67
9 4 5 5 14 4.67 5 5 4 14 4.67 5 4 4 13 4.33 5 4 5 14 4.67
10 4 4 3 11 3.67 4 5 4 13 4.33 5 4 3 12 4.00 4 4 4 12 4.00
11 4 5 3 12 4.00 4 4 4 12 4.00 5 5 4 14 4.67 5 4 5 14 4.67
12 4 3 3 10 3.33 4 3 2 9 3.00 2 4 4 10 3.33 4 4 5 13 4.33
13 3 3 3 9 3.00 3 2 3 8 2.67 4 4 3 11 3.67 4 3 2 9 3.00
14 4 2 4 10 3.33 3 4 3 10 3.33 4 4 3 11 3.67 4 3 3 10 3.33
15 5 5 4 14 4.67 4 5 5 14 4.67 4 4 4 12 4.00 4 4 3 11 3.67
16 4 3 5 12 4.00 4 3 5 12 4.00 5 5 3 13 4.33 4 5 4 13 4.33
17 5 4 4 13 4.33 4 5 5 14 4.67 4 5 5 14 4.67 5 4 3 12 4.00
87
18 4 4 5 13 4.33 4 3 3 10 3.33 4 4 3 11 3.67 4 4 4 12 4.00
19 5 4 5 14 4.67 4 5 5 14 4.67 5 4 5 14 4.67 5 4 5 14 4.67
20 4 4 4 12 4.00 4 3 4 11 3.67 5 5 4 14 4.67 4 5 5 14 4.67
21 4 3 4 11 3.67 4 4 3 11 3.67 4 2 3 9 3.00 3 4 4 11 3.67
22 4 3 3 10 3.33 4 4 3 11 3.67 5 5 5 15 5.00 4 2 4 10 3.33
23 4 4 3 11 3.67 5 4 4 13 4.33 4 4 3 11 3.67 3 4 3 10 3.33
24 4 5 5 14 4.67 4 5 5 14 4.67 5 5 4 14 4.67 4 4 5 13 4.33
25 2 3 3 8 2.67 2 3 4 9 3.00 5 4 3 12 4.00 3 4 4 11 3.67
26 4 3 2 9 3.00 4 4 3 11 3.67 5 5 4 14 4.67 3 4 3 10 3.33
27 4 4 5 13 4.33 4 3 4 11 3.67 4 5 4 13 4.33 3 4 3 10 3.33
28 4 3 4 11 3.67 4 3 3 10 3.33 5 4 5 14 4.67 5 4 4 13 4.33
29 2 4 4 10 3.33 4 4 4 12 4.00 4 5 3 12 4.00 3 3 4 10 3.33
30 4 3 4 11 3.67 4 3 4 11 3.67 4 4 4 12 4.00 3 3 3 9 3.00
31 4 4 4 12 4.00 4 4 4 12 4.00 5 5 3 13 4.33 3 4 3 10 3.33
32 4 3 2 9 3.00 4 3 4 11 3.67 5 4 3 12 4.00 4 3 3 10 3.33
33 3 4 4 11 3.67 4 4 3 11 3.67 4 4 4 12 4.00 4 5 4 13 4.33
34 4 4 4 12 4.00 4 3 4 11 3.67 5 5 3 13 4.33 4 4 4 12 4.00
35 4 5 5 14 4.67 5 5 4 14 4.67 4 4 4 12 4.00 5 5 4 14 4.67
36 4 3 2 9 3.00 4 5 5 14 4.67 2 3 4 9 3.00 2 3 3 8 2.67
37 4 3 4 11 3.67 4 2 5 11 3.67 4 4 3 11 3.67 4 4 4 12 4.00
38 3 4 4 11 3.67 4 4 3 11 3.67 4 5 3 12 4.00 4 5 4 13 4.33
39 4 5 5 14 4.67 4 4 5 13 4.33 5 5 3 13 4.33 4 5 5 14 4.67
40 3 3 4 10 3.33 2 3 4 9 3.00 4 5 3 12 4.00 5 4 4 13 4.33
41 4 5 4 13 4.33 4 4 3 11 3.67 5 5 4 14 4.67 4 4 3 11 3.67
42 4 4 4 12 4.00 4 5 4 13 4.33 5 5 3 13 4.33 4 5 5 14 4.67

88
43 2 3 5 10 3.33 4 3 3 10 3.33 4 5 3 12 4.00 2 4 4 10 3.33
44 5 4 5 14 4.67 5 5 5 15 5.00 5 4 4 13 4.33 5 5 5 15 5.00
45 4 3 3 10 3.33 4 3 4 11 3.67 3 4 4 11 3.67 4 4 4 12 4.00
46 4 5 4 13 4.33 4 4 2 10 3.33 5 5 5 15 5.00 4 4 4 12 4.00
47 4 4 4 12 4.00 4 3 4 11 3.67 2 3 5 10 3.33 3 4 5 12 4.00
48 2 4 3 9 3.00 3 4 5 12 4.00 4 2 4 10 3.33 4 2 3 9 3.00
49 4 3 4 11 3.67 2 3 3 8 2.67 3 3 3 9 3.00 3 4 3 10 3.33
50 3 2 3 8 2.67 3 3 2 8 2.67 2 3 4 9 3.00 3 2 2 7 2.33
51 4 3 5 12 4.00 5 4 4 13 4.33 5 5 4 14 4.67 4 4 4 12 4.00
52 4 5 4 13 4.33 4 4 4 12 4.00 5 4 4 13 4.33 4 4 4 12 4.00
53 4 4 4 12 4.00 4 4 4 12 4.00 5 5 3 13 4.33 3 4 3 10 3.33
54 2 3 3 8 2.67 4 3 4 11 3.67 4 4 3 11 3.67 4 4 3 11 3.67
55 4 5 5 14 4.67 3 4 4 11 3.67 4 2 4 10 3.33 4 4 5 13 4.33
56 4 4 4 12 4.00 4 3 3 10 3.33 4 2 5 11 3.67 4 5 5 14 4.67
57 4 3 4 11 3.67 4 3 3 10 3.33 3 4 2 9 3.00 4 4 4 12 4.00
58 3 3 3 9 3.00 4 3 3 10 3.33 4 3 5 12 4.00 4 3 4 11 3.67
59 3 4 4 11 3.67 4 4 4 12 4.00 3 3 4 10 3.33 2 4 4 10 3.33
60 4 4 5 13 4.33 5 4 4 13 4.33 3 3 3 9 3.00 4 3 5 12 4.00
61 5 4 4 13 4.33 4 4 4 12 4.00 3 3 3 9 3.00 4 4 3 11 3.67
62 4 3 4 11 3.67 3 4 5 12 4.00 3 3 4 10 3.33 3 4 5 12 4.00
63 4 5 4 13 4.33 5 4 4 13 4.33 3 3 3 9 3.00 4 4 3 11 3.67
64 3 3 4 10 3.33 4 4 3 11 3.67 3 3 3 9 3.00 4 3 3 10 3.33
65 4 3 5 12 4.00 3 4 3 10 3.33 3 3 4 10 3.33 5 4 5 14 4.67
66 4 4 3 11 3.67 4 3 3 10 3.33 3 3 3 9 3.00 4 4 5 13 4.33
67 2 3 4 9 3.00 2 4 4 10 3.33 3 3 4 10 3.33 4 4 2 10 3.33

89
68 2 4 3 9 3.00 2 3 4 9 3.00 3 3 5 11 3.67 4 3 2 9 3.00
69 4 2 3 9 3.00 4 4 2 10 3.33 3 3 4 10 3.33 4 4 2 10 3.33
70 4 5 5 14 4.67 5 5 4 14 4.67 4 5 3 12 4.00 4 5 5 14 4.67
71 4 5 4 13 4.33 4 4 3 11 3.67 5 5 4 14 4.67 4 4 5 13 4.33
72 4 3 4 11 3.67 3 3 4 10 3.33 2 2 3 7 2.33 4 3 3 10 3.33
73 4 4 3 11 3.67 3 5 4 12 4.00 2 2 3 7 2.33 3 2 4 9 3.00
74 3 4 2 9 3.00 4 4 2 10 3.33 5 4 3 12 4.00 4 4 4 12 4.00
75 4 5 5 14 4.67 4 4 4 12 4.00 3 3 4 10 3.33 5 4 3 12 4.00
76 4 4 3 11 3.67 2 4 3 9 3.00 4 4 4 12 4.00 4 2 4 10 3.33
77 2 2 3 7 2.33 2 4 3 9 3.00 5 5 4 14 4.67 5 4 4 13 4.33
78 3 3 4 10 3.33 3 4 3 10 3.33 4 4 4 12 4.00 3 3 4 10 3.33
79 4 2 4 10 3.33 4 4 4 12 4.00 5 4 5 14 4.67 4 3 4 11 3.67
80 3 3 5 11 3.67 4 4 3 11 3.67 2 3 3 8 2.67 3 2 5 10 3.33
81 4 3 4 11 3.67 3 4 3 10 3.33 5 4 3 12 4.00 4 2 3 9 3.00
82 5 5 4 14 4.67 4 5 5 14 4.67 5 5 4 14 4.67 4 5 5 14 4.67
83 4 3 4 11 3.67 4 4 5 13 4.33 5 4 4 13 4.33 4 4 2 10 3.33
84 4 4 4 12 4.00 4 3 4 11 3.67 4 5 4 13 4.33 2 4 5 11 3.67
85 4 5 5 14 4.67 4 5 4 13 4.33 3 3 3 9 3.00 4 4 4 12 4.00
86 4 3 3 10 3.33 2 3 2 7 2.33 5 5 3 13 4.33 3 4 4 11 3.67
87 4 3 3 10 3.33 3 3 4 10 3.33 5 4 3 12 4.00 4 4 3 11 3.67
88 4 2 4 10 3.33 3 4 4 11 3.67 4 4 3 11 3.67 3 2 4 9 3.00
89 3 2 4 9 3.00 3 4 3 10 3.33 4 4 3 11 3.67 3 4 4 11 3.67
90 4 3 2 9 3.00 4 4 2 10 3.33 4 4 3 11 3.67 4 3 3 10 3.33
91 4 3 3 10 3.33 4 3 3 10 3.33 4 4 4 12 4.00 3 4 4 11 3.67
92 4 3 4 11 3.67 4 3 3 10 3.33 4 5 3 12 4.00 3 4 4 11 3.67
90
93 5 4 4 13 4.33 5 4 5 14 4.67 5 5 4 14 4.67 4 4 5 13 4.33
94 3 4 4 11 3.67 3 4 3 10 3.33 4 2 4 10 3.33 3 2 3 8 2.67
95 2 3 4 9 3.00 4 4 3 11 3.67 2 3 5 10 3.33 3 2 4 9 3.00
96 2 2 3 7 2.33 3 2 3 8 2.67 4 5 3 12 4.00 4 3 2 9 3.00
97 4 3 4 11 3.67 4 4 3 11 3.67 4 5 3 12 4.00 4 4 3 11 3.67
98 4 4 4 12 4.00 4 5 5 14 4.67 5 5 4 14 4.67 3 4 3 10 3.33
99 5 4 5 14 4.67 5 5 5 15 5.00 5 5 3 13 4.33 5 5 5 15 5.00
100 4 4 4 12 4.00 4 5 4 13 4.33 4 4 4 12 4.00 4 3 4 11 3.67
101 4 4 4 12 4.00 3 3 4 10 3.33 3 3 4 10 3.33 4 4 4 12 4.00
102 4 4 4 12 4.00 4 5 4 13 4.33 4 4 5 13 4.33 3 3 4 10 3.33
103 5 5 4 14 4.67 4 4 4 12 4.00 4 2 3 9 3.00 4 2 3 9 3.00
104 4 3 4 11 3.67 4 4 3 11 3.67 3 3 4 10 3.33 2 4 3 9 3.00
105 3 3 4 10 3.33 3 3 4 10 3.33 4 2 4 10 3.33 4 3 3 10 3.33
106 4 3 3 10 3.33 4 5 4 13 4.33 4 4 4 12 4.00 4 4 3 11 3.67
107 4 4 5 13 4.33 4 3 3 10 3.33 2 4 3 9 3.00 4 5 5 14 4.67
108 4 3 4 11 3.67 4 4 5 13 4.33 3 2 4 9 3.00 4 5 5 14 4.67
109 3 4 4 11 3.67 2 3 3 8 2.67 3 2 4 9 3.00 5 5 5 15 5.00

91
Lampiran 3
TABEL R PRODUCT MOMENT
N r N r N r N r N r N r
1 0.997 41 0.301 81 0.216 121 0.177 161 0.154 201 0.138
2 0.95 42 0.297 82 0.215 122 0.176 162 0.153 202 0.137
3 0.878 43 0.294 83 0.213 123 0.176 163 0.153 203 0.137
4 0.811 44 0.291 84 0.212 124 0.175 164 0.152 204 0.137
5 0.754 45 0.288 85 0.211 125 0.174 165 0.152 205 0.136
6 0.707 46 0.285 86 0.21 126 0.174 166 0.151 206 0.136
7 0.666 47 0.282 87 0.208 127 0.173 167 0.151 207 0.136
8 0.632 48 0.279 88 0.207 128 0.172 168 0.151 208 0.135
9 0.602 49 0.276 89 0.206 129 0.172 169 0.15 209 0.135
10 0.576 50 0.273 90 0.205 130 0.171 170 0.15 210 0.135
11 0.553 51 0.271 91 0.204 131 0.17 171 0.149 211 0.134
12 0.532 52 0.268 92 0.203 132 0.17 172 0.149 212 0.134
13 0.514 53 0.266 93 0.202 133 0.169 173 0.148 213 0.134
14 0.497 54 0.263 94 0.201 134 0.168 174 0.148 214 0.134
15 0.482 55 0.261 95 0.2 135 0.168 175 0.148 215 0.133
16 0.468 56 0.259 96 0.199 136 0.167 176 0.147 216 0.133
17 0.456 57 0.256 97 0.198 137 0.167 177 0.147 217 0.133
18 0.444 58 0.254 98 0.197 138 0.166 178 0.146 218 0.132
19 0.433 59 0.252 99 0.196 139 0.165 179 0.146 219 0.132
20 0.423 60 0.25 100 0.195 140 0.165 180 0.146 220 0.132
21 0.413 61 0.248 101 0.194 141 0.164 181 0.145 221 0.131
22 0.404 62 0.246 102 0.193 142 0.164 182 0.145 222 0.131
23 0.396 63 0.244 103 0.192 143 0.163 183 0.144 223 0.131
24 0.388 64 0.242 104 0.191 144 0.163 184 0.144 224 0.131
25 0.381 65 0.24 105 0.19 145 0.162 185 0.144 225 0.13
26 0.374 66 0.239 106 0.189 146 0.161 186 0.143 226 0.13
27 0.367 67 0.237 107 0.188 147 0.161 187 0.143 227 0.13
28 0.361 68 0.235 108 0.187 148 0.16 188 0.142 228 0.129
29 0.355 69 0.234 109 0.187 149 0.16 189 0.142 229 0.129
30 0.349 70 0.232 110 0.186 150 0.159 190 0.142 230 0.129
31 0.344 71 0.23 111 0.185 151 0.159 191 0.141 231 0.129
32 0.339 72 0.229 112 0.184 152 0.158 192 0.141 232 0.128
33 0.334 73 0.227 113 0.183 153 0.158 193 0.141 233 0.128
34 0.329 74 0.226 114 0.182 154 0.157 194 0.14 234 0.128
35 0.325 75 0.224 115 0.182 155 0.157 195 0.14 235 0.127
36 0.32 76 0.223 116 0.181 156 0.156 196 0.139 236 0.127
37 0.316 77 0.221 117 0.18 157 0.156 197 0.139 237 0.127
38 0.312 78 0.22 118 0.179 158 0.155 198 0.139 238 0.127
39 0.308 79 0.219 119 0.179 159 0.155 199 0.138 239 0.126
40 0.304 80 0.217 120 0.178 160 0.154 200 0.138 240 0.126

92
Lampiran 4
TABEL DURBIN WATSON
N k=1 k=2 k=3 k=4 k=5
dl Du dl du Dl du dl du dl du
15 1.08 1.63 0.95 1.54 0.82 1.75 0.69 1.97 0.56 2.21
16 1.10 1.37 0.98 1.54 0.86 1.73 0.74 1.93 0.62 2.15
17 1.13 1.38 1.02 1.54 0.90 1.71 0.78 1.90 0.67 2.10
18 1.16 1.39 1.05 1.53 0.93 1.69 0.82 1.87 0.71 2.02
19 1.18 1.40 1.08 1.53 0.97 1.68 0.86 1.85 0.75 2.02
20 1.20 1.41 1.10 1.54 1.00 1.68 0.90 1.83 0.79 1.99
21 1.22 1.42 1.13 1.54 1.03 1.67 0.93 1.81 0.83 1.96
22 1.24 1.43 1.15 1.54 1.05 1.66 0.96 1.80 0.86 1.94
23 1.26 1.44 1.17 1.54 1.08 1.66 0.99 1.79 0.90 1.92
24 1.27 1.45 1.19 1.55 1.10 1.66 1.01 1.78 0.93 1.90
25 1.29 1.45 1.21 1.55 1.12 1.66 1.04 1.77 0.95 1.89
26 1.30 1.46 1.22 1.55 1.14 1.66 1.06 1.76 0.98 1.88
27 1.32 1.47 1.24 1.56 1.16 1.65 1.08 1.76 1.01 1.86
28 1.33 1.48 1.26 1.56 1.18 1.65 1.10 1.75 1.03 1.85
29 1.34 1.48 1.27 1.56 1.20 1.65 1.12 1.74 1.05 1.84
30 1.35 1.49 1.28 1.57 1.21 1.65 1.14 1.74 1.07 1.83
31 1.36 1.50 1.30 1.57 1.23 1.65 1.16 1.74 1.09 1.83
32 1.37 1.50 1.31 1.57 1.24 1.65 1.18 1.73 1.11 1.82
33 1.38 1.51 1.32 1.58 1.26 1.65 1.19 1.73 1.13 1.81
34 1.39 1.51 1.33 1.58 1.27 1.65 1.21 1.73 1.15 1.81
35 1.40 1.52 1.34 1.58 1.28 1.65 1.22 1.73 1.16 1.80
36 1.41 1.52 1.35 1.59 1.29 1.65 1.24 1.73 1.18 1.80
37 1.42 1.53 1.36 1.59 1.31 1.66 1.25 1.72 1.19 1.80
38 1.43 1.54 1.37 1.59 1.32 1.66 1.26 1.72 1.21 1.79
39 1.43 1.54 1.38 1.60 1.33 1.66 1.27 1.72 1.22 1.79
40 1.44 1.54 1.39 1.60 1.34 1.66 1.29 1.72 1.23 1.79
45 1.48 1.57 1.43 1.62 1.38 1.67 1.34 1.72 1.29 1.79
50 1.50 1.59 1.46 1.63 1.42 1.67 1.38 1.72 1.34 1.77
55 1.53 1.60 1.49 1.64 1.45 1.68 1.41 1.72 1.38 1.77
60 1.55 1.62 1.51 1.65 1.48 1.69 1.44 1.73 1.41 1.77
65 1.57 1.63 1.54 1.66 1.50 1.70 1.47 1.73 1.44 1.77
70 1.58 1.64 1.55 1.67 1.52 1.70 1.49 1.74 1.46 1.77
75 1.60 1.65 1.57 1.68 1.54 1.71 1.51 1.74 1.49 1.77
80 1.61 1.66 1.59 1.69 1.56 1.72 1.53 1.74 1.51 1.77
85 1.62 1.67 1.60 1.70 1.57 1.72 1.55 1.75 1.52 1.77
90 1.63 1.68 1.61 1.70 1.59 1.73 1.57 1.75 1.54 1.78
95 1.64 1.69 1.62 1.71 1.60 1.73 1.58 1.75 1.56 1.78
100 1.65 1.69 1.63 1.71 1.61 1.73 1.59 1.75 1.57 1.78
101 1.65 1.69 1.63 1.71 1.61 1.73 1.59 1.75 1.57 1.78
102 1.65 1.69 1.63 1.71 1.61 1.73 1.59 1.75 1.57 1.78
103 1.65 1.69 1.63 1.71 1.61 1.73 1.59 1.76 1.57 1.78
104 1.66 1.69 1.64 1.71 1.62 1.74 1.60 1.76 1.58 1.78

93
105 1.66 1.70 1.64 1.72 1.62 1.74 1.60 1.76 1.58 1.78
106 1.66 1.70 1.64 1.72 1.62 1.74 1.60 1.76 1.58 1.78
107 1.66 1.70 1.64 1.72 1.62 1.74 1.60 1.76 1.58 1.78
108 1.66 1.70 1.64 1.72 1.62 1.74 1.61 1.76 1.59 1.78
109 1.66 1.70 1.65 1.72 1.63 1.74 1.61 1.76 1.59 1.78
110 1.67 1.71 1.65 1.72 1.63 1.75 1.61 1.77 1.60 1.79
94
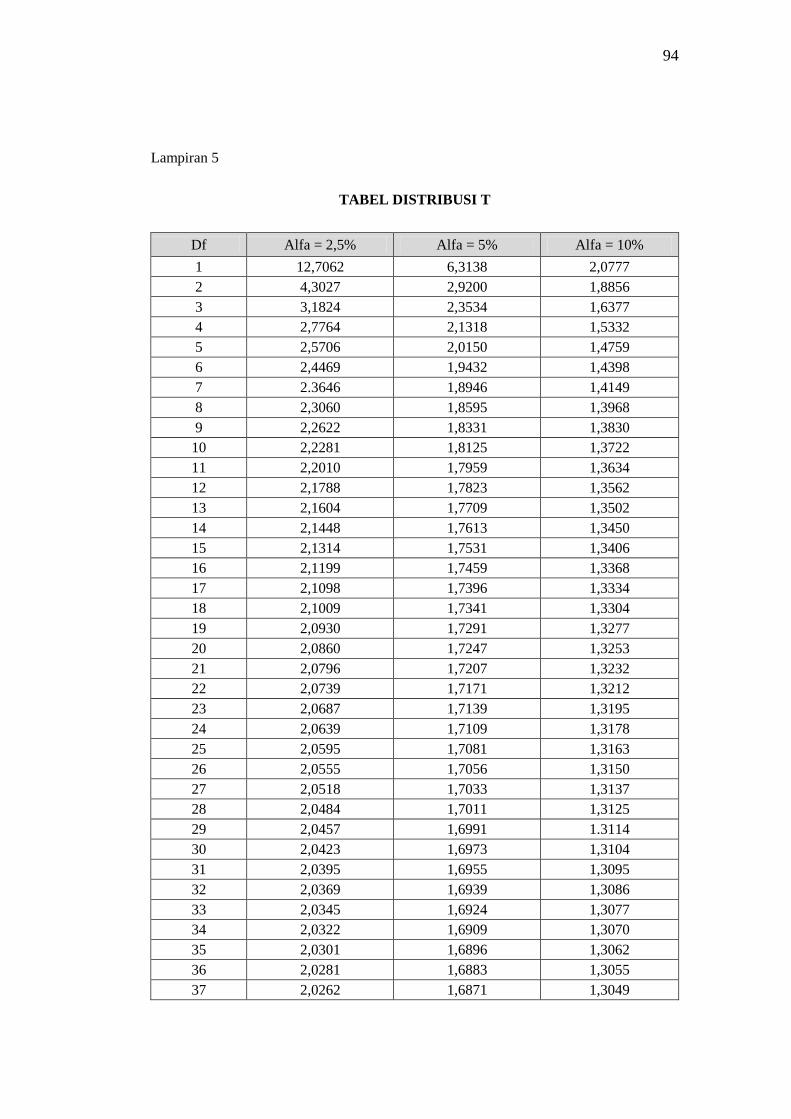
Lampiran 5
TABEL DISTRIBUSI T
Df Alfa = 2,5% Alfa = 5% Alfa = 10%
1 12,7062 6,3138 2,0777
2 4,3027 2,9200 1,8856
3 3,1824 2,3534 1,6377
4 2,7764 2,1318 1,5332
5 2,5706 2,0150 1,4759
6 2,4469 1,9432 1,4398
7 2.3646 1,8946 1,4149
8 2,3060 1,8595 1,3968
9 2,2622 1,8331 1,3830
10 2,2281 1,8125 1,3722
11 2,2010 1,7959 1,3634
12 2,1788 1,7823 1,3562
13 2,1604 1,7709 1,3502
14 2,1448 1,7613 1,3450
15 2,1314 1,7531 1,3406
16 2,1199 1,7459 1,3368
17 2,1098 1,7396 1,3334
18 2,1009 1,7341 1,3304
19 2,0930 1,7291 1,3277
20 2,0860 1,7247 1,3253
21 2,0796 1,7207 1,3232
22 2,0739 1,7171 1,3212
23 2,0687 1,7139 1,3195
24 2,0639 1,7109 1,3178
25 2,0595 1,7081 1,3163
26 2,0555 1,7056 1,3150
27 2,0518 1,7033 1,3137
28 2,0484 1,7011 1,3125
29 2,0457 1,6991 1.3114
30 2,0423 1,6973 1,3104
31 2,0395 1,6955 1,3095
32 2,0369 1,6939 1,3086
33 2,0345 1,6924 1,3077
34 2,0322 1,6909 1,3070
35 2,0301 1,6896 1,3062
36 2,0281 1,6883 1,3055
37 2,0262 1,6871 1,3049

95
38 2,0244 1,6860 1,3042
39 2,0227 1,6849 1,3036
40 2,0211 1,6839 1,3031
41 2,0195 1,6829 1,3025
42 2,0181 1,6820 1,3020
43 2,0167 1,6811 1,3016
44 2,0154 1,6802 1,3011
45 2,0141 1,6794 1,3006
46 2,0129 1,6787 1,3002
47 2,0117 1,6779 1,2998
48 2,0106 1,6772 1,2994
49 2,0096 1,6766 1,2991
50 2,0086 1,6759 1,2987
51 2,0076 1,6753 1,2984
52 2,0066 1,6747 1,2980
53 2,0057 1,6741 1,2977
54 2,0049 1,6736 1,2974
55 2,0040 1,6730 1,2971
56 2,0032 1,6725 1,2969
57 2,0025 1,6720 1,2966
58 2,0017 1,6716 1,2963
59 2,0010 1,6711 1,2961
60 2,0003 1,6706 1,2958
61 1,9996 1,6702 1,2956
62 1,9990 1,6698 1,2954
63 1,9983 1,6694 1,2951
64 1,9977 1,6690 1,2949
65 1,9971 1,6686 1,2947
66 1,9966 1,6683 1,2945
67 1,9960 1,6679 1,2943
68 1,9955 1,6676 1,2941
69 1,9949 1.6672 1,2939
70 1,9944 1,6669 1,2938
71 1,9939 1,6666 1,2936
72 1,9935 1,6663 1,2934
73 1,9930 1.6660 1,2933
74 1,9925 1,6657 1,2931
75 1,9921 1,6654 1,2929
76 1,9917 1,6652 1,2928
77 1,9913 1,6649 1,2926
78 1,9908 1,6646 1,2925
79 1,9905 1,6644 1,2924
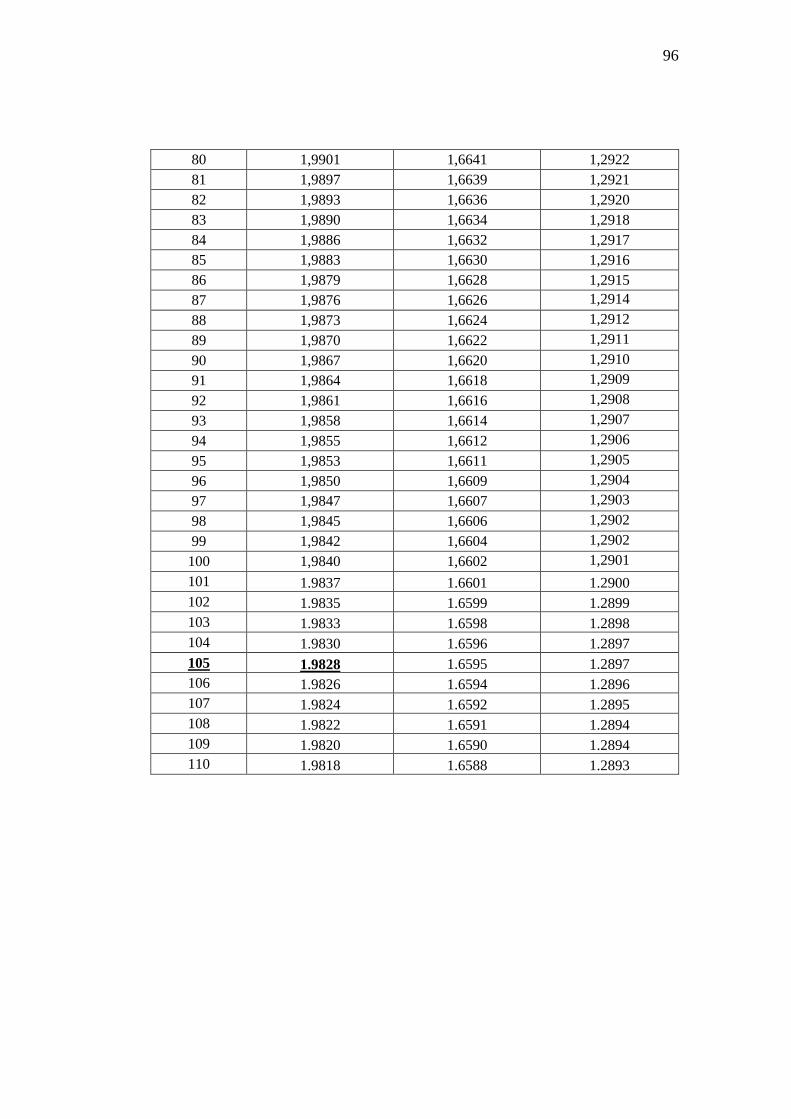
96
80 1,9901 1,6641 1,2922
81 1,9897 1,6639 1,2921
82 1,9893 1,6636 1,2920
83 1,9890 1,6634 1,2918
84 1,9886 1,6632 1,2917
85 1,9883 1,6630 1,2916
86 1,9879 1,6628 1,2915
87 1,9876 1,6626 1,2914
88 1,9873 1,6624 1,2912
89 1,9870 1,6622 1,2911
90 1,9867 1,6620 1,2910
91 1,9864 1,6618 1,2909
92 1,9861 1,6616 1,2908
93 1,9858 1,6614 1,2907
94 1,9855 1,6612 1,2906
95 1,9853 1,6611 1,2905
96 1,9850 1,6609 1,2904
97 1,9847 1,6607 1,2903
98 1,9845 1,6606 1,2902
99 1,9842 1,6604 1,2902
100 1,9840 1,6602 1,2901
101 1.9837 1.6601 1.2900
102 1.9835 1.6599 1.2899
103 1.9833 1.6598 1.2898
104 1.9830 1.6596 1.2897
105 1.9828 1.6595 1.2897
106 1.9826 1.6594 1.2896
107 1.9824 1.6592 1.2895
108 1.9822 1.6591 1.2894
109 1.9820 1.6590 1.2894
110 1.9818 1.6588 1.2893

97
Lampiran 6
TABEL PENGUJIAN NILAI F
No Df Df
1 2 3 4 5
1 161.448 199.5 215.707 224.583 230.162
2 18.513 19 19.164 19.247 19.296
3 10.128 9.552 9.277 9.117 9.013
4 7.709 6.944 6.591 6.388 6.256
5 6.608 5.786 5.409 5.192 5.05
6 5.987 5.143 4.757 4.534 4.387
7 5.591 4.737 4.347 4.12 3.972
8 5.318 4.459 4.066 3.838 3.687
9 5.117 4.256 3.863 3.633 3.482
10 4.965 4.103 3.708 3.478 3.326
11 4.844 3.982 3.587 3.357 3.204
12 4.747 3.885 3.49 3.259 3.106
13 4.667 3.806 3.411 3.179 3.025
14 4.6 3.739 3.344 3.112 2.958
15 4.543 3.682 3.287 3.056 2.901
16 4.494 3.634 3.239 3.007 2.852
17 4.451 3.592 3.197 2.965 2.81
18 4.414 3.555 3.16 2.928 2.773
19 4.381 3.522 3.127 2.895 2.74
20 4.351 3.493 3.098 2.866 2.711
21 4.325 3.467 3.072 2.84 2.685
22 4.301 3.443 3.049 2.817 2.661
23 4.279 3.422 3.028 2.796 2.64
24 4.26 3.403 3.009 2.776 2.621
25 4.242 3.385 2.991 2.759 2.603
26 4.225 3.369 2.975 2.743 2.587
27 4.21 3.354 2.96 2.728 2.572
28 4.196 3.34 2.947 2.714 2.558
29 4.183 3.328 2.934 2.701 2.545
30 4.171 3.316 2.922 2.69 2.534
40 4.085 3.232 2.839 2.606 2.449
50 4.034 3.183 2.79 2.557 2.4
60 4.001 3.15 2.758 2.525 2.368
70 3.978 3.128 2.736 2.503 2.346
80 3.96 3.111 2.716 2.486 2.329
81 3.959 3.109 2.717 2.484 2.327
82 3.957 3.108 2.716 2.483 2.326
83 3.956 3.107 2.715 2.482 2.324
84 3.955 3.105 2.713 2.48 2.323
85 3.953 3.104 2.712 2.479 2.322

98
86 3.952 3.103 2.711 2.478 2.321
87 3.951 3.101 2.709 2.476 2.319
88 3.949 3.1 2.708 2.475 2.318
89 3.948 3.099 2.707 2.474 2.317
90 3.947 3.098 2.706 2.473 2.316
91 3.946 3.097 2.705 2.472 2.315
92 3.945 3.095 2.704 2.471 2.313
93 3.943 3.094 2.703 2.47 2.312
94 3.942 3.093 2.701 2.469 2.311
95 3.941 3.092 2.7 2.467 2.31
96 3.94 3.091 2.699 2.466 2.309
97 3.939 3.09 2.698 2.465 2.308
98 3.938 3.089 2.697 2.465 2.307
99 3.937 3.088 2.626 2.464 2.306
100 3.936 3.087 2.696 2.463 2.305
101 3.94 3.09 2.69 2.46 2.30
102 3.93 3.09 2.69 2.46 2.30
103 3.93 3.08 2.69 2.46 2.30
104 3.93 3.08 2.69 2.46 2.30
105 3.93 3.08 2.69 2.46 2.30
106 3.93 3.08 2.69 2.46 2.30
107 3.93 3.08 2.69 2.46 2.30
108 3.93 3.08 2.69 2.46 2.30
109 3.93 3.08 2.69 2.45 2.30
110 3.93 3.08 2.69 2.45 2.30
99
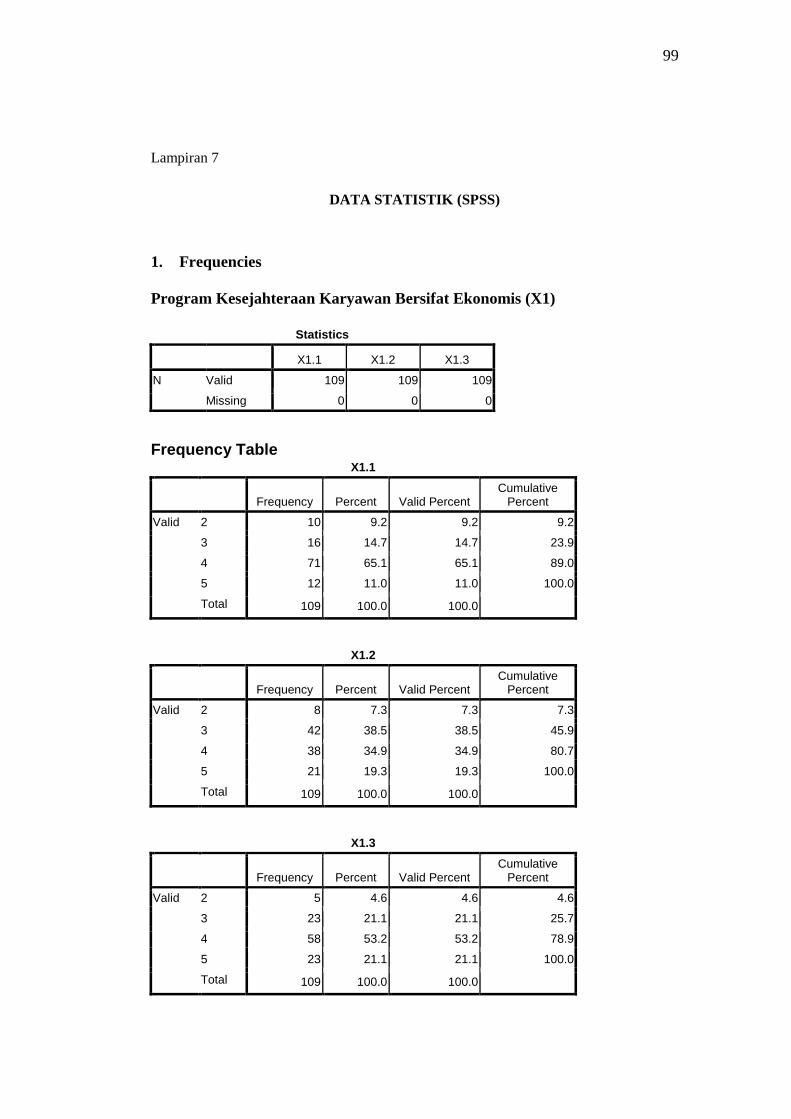
Lampiran 7
DATA STATISTIK (SPSS)
1. Frequencies
Program Kesejahteraan Karyawan Bersifat Ekonomis (X1)
Statistics
X1.1 X1.2 X1.3
N Valid 109 109 109
Missing 0 0 0
Frequency Table X1.1
Frequency Percent Valid Percent
Cumulative Percent
Valid 2 10 9.2 9.2 9.2
3 16 14.7 14.7 23.9
4 71 65.1 65.1 89.0
5 12 11.0 11.0 100.0
Total 109 100.0 100.0
X1.2
Frequency Percent Valid Percent
Cumulative Percent
Valid 2 8 7.3 7.3 7.3
3 42 38.5 38.5 45.9
4 38 34.9 34.9 80.7
5 21 19.3 19.3 100.0
Total 109 100.0 100.0
X1.3
Frequency Percent Valid Percent
Cumulative Percent
Valid 2 5 4.6 4.6 4.6
3 23 21.1 21.1 25.7
4 58 53.2 53.2 78.9
5 23 21.1 21.1 100.0
Total 109 100.0 100.0
100
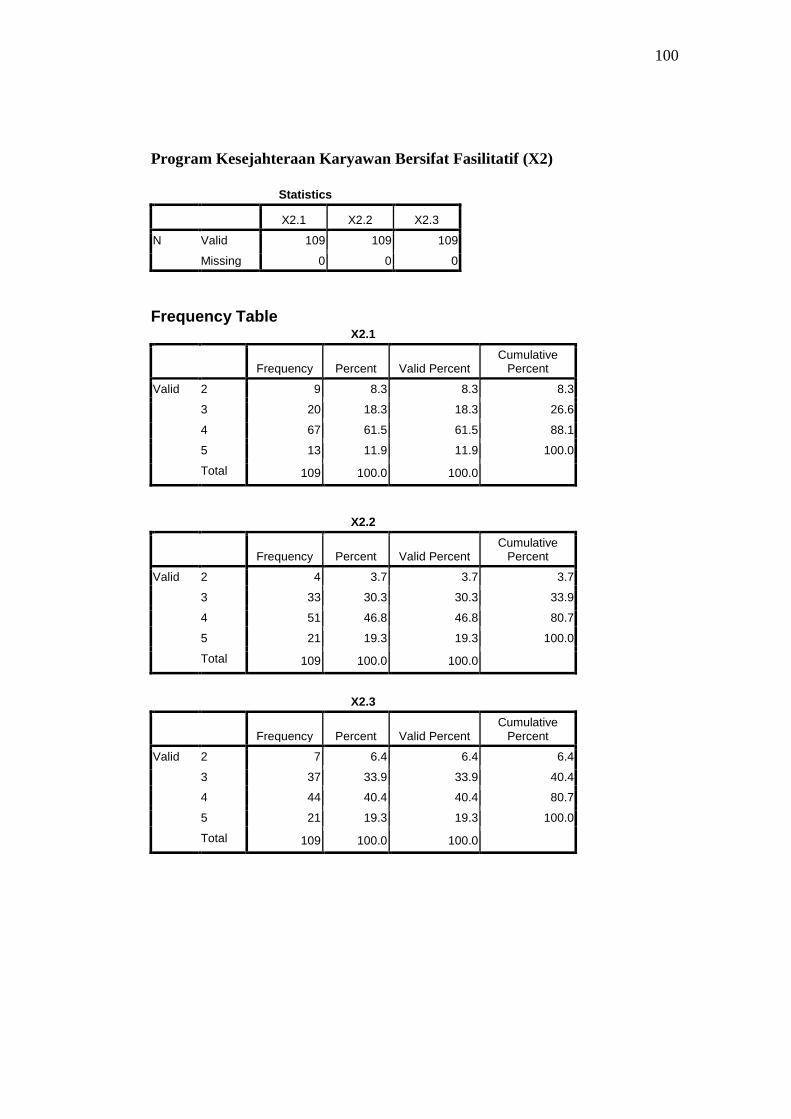
Program Kesejahteraan Karyawan Bersifat Fasilitatif (X2)
Statistics
X2.1 X2.2 X2.3
N Valid 109 109 109
Missing 0 0 0
Frequency Table X2.1
Frequency Percent Valid Percent
Cumulative Percent
Valid 2 9 8.3 8.3 8.3
3 20 18.3 18.3 26.6
4 67 61.5 61.5 88.1
5 13 11.9 11.9 100.0
Total 109 100.0 100.0
X2.2
Frequency Percent Valid Percent
Cumulative Percent
Valid 2 4 3.7 3.7 3.7
3 33 30.3 30.3 33.9
4 51 46.8 46.8 80.7
5 21 19.3 19.3 100.0
Total 109 100.0 100.0
X2.3
Frequency Percent Valid Percent
Cumulative Percent
Valid 2 7 6.4 6.4 6.4
3 37 33.9 33.9 40.4
4 44 40.4 40.4 80.7
5 21 19.3 19.3 100.0
Total 109 100.0 100.0

101
Program Kesejahteraan Karyawan Bersifat Pelayanan (X3)
Statistics
X3.1 X3.2 X3.3
N Valid 109 109 109
Missing 0 0 0
Frequency Table X3.1
Frequency Percent Valid Percent
Cumulative Percent
Valid 2 10 9.2 9.2 9.2
3 21 19.3 19.3 28.4
4 39 35.8 35.8 64.2
5 39 35.8 35.8 100.0
Total 109 100.0 100.0
X3.2
Frequency Percent Valid Percent
Cumulative Percent
Valid 2 11 10.1 10.1 10.1
3 23 21.1 21.1 31.2
4 39 35.8 35.8 67.0
5 36 33.0 33.0 100.0
Total 109 100.0 100.0
X3.3
Frequency Percent Valid Percent
Cumulative Percent
Valid 2 1 .9 .9 .9
3 47 43.1 43.1 44.0
4 49 45.0 45.0 89.0
5 12 11.0 11.0 100.0
Total 109 100.0 100.0
102
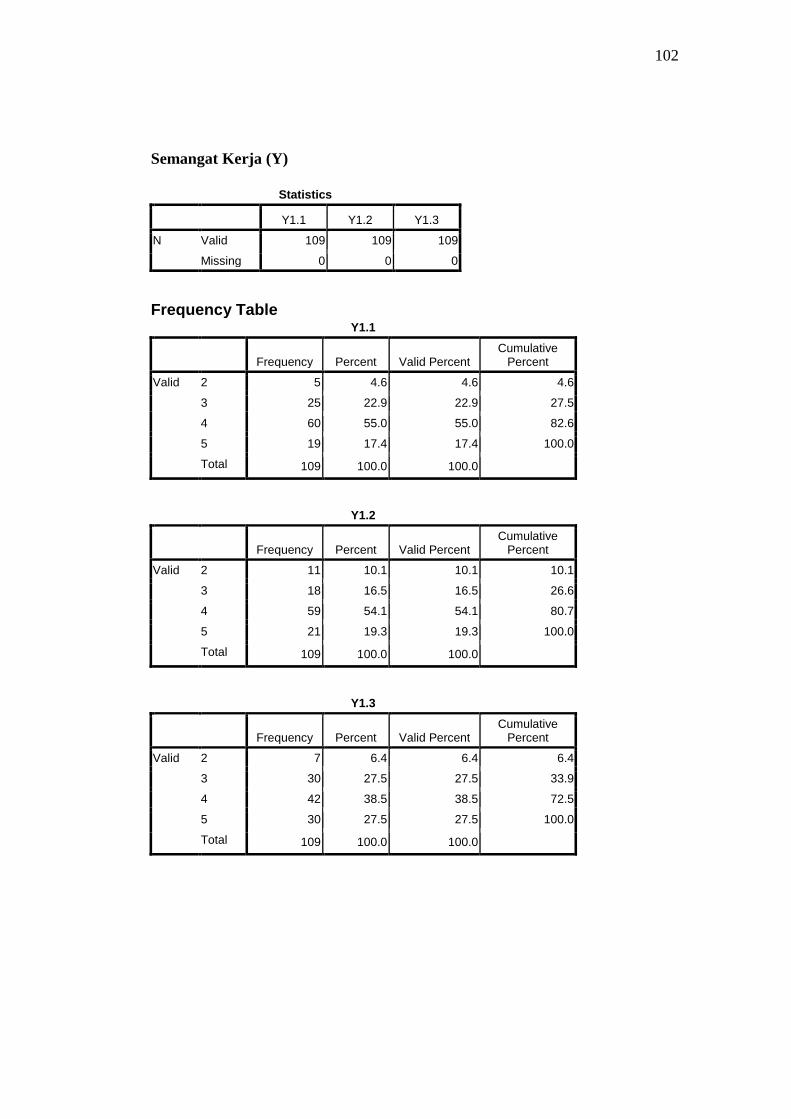
Semangat Kerja (Y)
Statistics
Y1.1 Y1.2 Y1.3
N Valid 109 109 109
Missing 0 0 0
Frequency Table Y1.1
Frequency Percent Valid Percent
Cumulative Percent
Valid 2 5 4.6 4.6 4.6
3 25 22.9 22.9 27.5
4 60 55.0 55.0 82.6
5 19 17.4 17.4 100.0
Total 109 100.0 100.0
Y1.2
Frequency Percent Valid Percent
Cumulative Percent
Valid 2 11 10.1 10.1 10.1
3 18 16.5 16.5 26.6
4 59 54.1 54.1 80.7
5 21 19.3 19.3 100.0
Total 109 100.0 100.0
Y1.3
Frequency Percent Valid Percent
Cumulative Percent
Valid 2 7 6.4 6.4 6.4
3 30 27.5 27.5 33.9
4 42 38.5 38.5 72.5
5 30 27.5 27.5 100.0
Total 109 100.0 100.0

103
2. Uji Validitas
Program Kesejahteraan Karyawan Bersifat Ekonomis (X1)
Correlations
X1.1 X1.2 X1.3 TOTALX1
X1.1 Pearson Correlation 1 .373** .263
** .715
**
Sig. (2-tailed) .000 .006 .000
N 109 109 109 109
X1.2 Pearson Correlation .373** 1 .377
** .803
**
Sig. (2-tailed) .000 .000 .000
N 109 109 109 109
X1.3 Pearson Correlation .263** .377
** 1 .723
**
Sig. (2-tailed) .006 .000 .000
N 109 109 109 109
TOTALX1 Pearson Correlation .715** .803
** .723
** 1
Sig. (2-tailed) .000 .000 .000
N 109 109 109 109
**. Correlation is significant at the 0.01 level (2-tailed).
Program Kesejahteraan Karyawan Bersifat Fasilitatif (X2)
Correlations
X2.1 X2.2 X2.3 TOTALX2
X2.1 Pearson Correlation 1 .331** .287
** .711
**
Sig. (2-tailed) .000 .002 .000
N 109 109 109 109
X2.2 Pearson Correlation .331** 1 .369
** .757
**
Sig. (2-tailed) .000 .000 .000
N 109 109 109 109
X2.3 Pearson Correlation .287** .369
** 1 .761
**
Sig. (2-tailed) .002 .000 .000
N 109 109 109 109
TOTALX2 Pearson Correlation .711** .757
** .761
** 1
Sig. (2-tailed) .000 .000 .000
N 109 109 109 109
**. Correlation is significant at the 0.01 level (2-tailed).
104
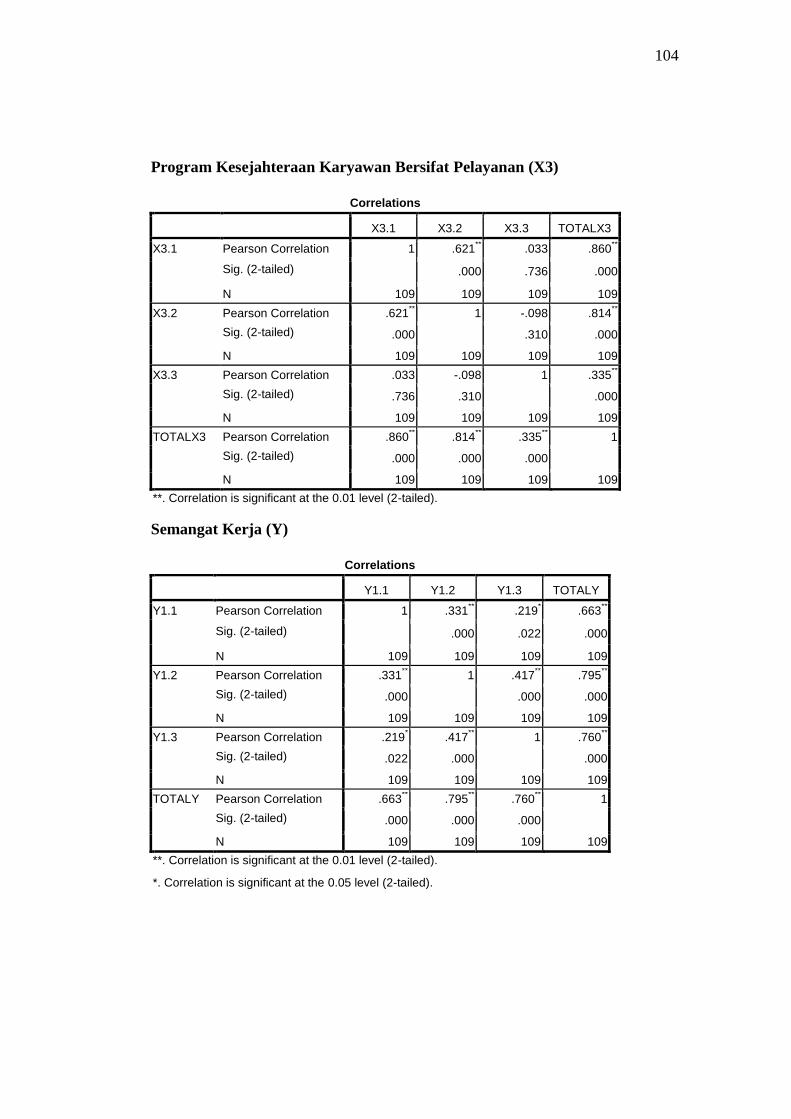
Program Kesejahteraan Karyawan Bersifat Pelayanan (X3)
Correlations
X3.1 X3.2 X3.3 TOTALX3
X3.1 Pearson Correlation 1 .621** .033 .860
**
Sig. (2-tailed) .000 .736 .000
N 109 109 109 109
X3.2 Pearson Correlation .621** 1 -.098 .814
**
Sig. (2-tailed) .000 .310 .000
N 109 109 109 109
X3.3 Pearson Correlation .033 -.098 1 .335**
Sig. (2-tailed) .736 .310 .000
N 109 109 109 109
TOTALX3 Pearson Correlation .860** .814
** .335
** 1
Sig. (2-tailed) .000 .000 .000
N 109 109 109 109
**. Correlation is significant at the 0.01 level (2-tailed).
Semangat Kerja (Y)
Correlations
Y1.1 Y1.2 Y1.3 TOTALY
Y1.1 Pearson Correlation 1 .331** .219
* .663
**
Sig. (2-tailed) .000 .022 .000
N 109 109 109 109
Y1.2 Pearson Correlation .331** 1 .417
** .795
**
Sig. (2-tailed) .000 .000 .000
N 109 109 109 109
Y1.3 Pearson Correlation .219* .417
** 1 .760
**
Sig. (2-tailed) .022 .000 .000
N 109 109 109 109
TOTALY Pearson Correlation .663** .795
** .760
** 1
Sig. (2-tailed) .000 .000 .000
N 109 109 109 109
**. Correlation is significant at the 0.01 level (2-tailed).
*. Correlation is significant at the 0.05 level (2-tailed).

105
3. Uji Reliabilitas
Scale: Program Kesejahteraan Bersifat Ekonomis (X1)
Case Processing Summary
N %
Cases Valid 109 100.0
Excludeda 0 .0
Total 109 100.0
a. Listwise deletion based on all variables in the procedure.
Reliability Statistics
Cronbach's Alpha N of Items
.606 3
Item Statistics
Mean Std. Deviation N
X1.1 3.7798 .76204 109
X1.2 3.6606 .87369 109
X1.3 3.9083 .77628 109
Item-Total Statistics
Scale Mean if Item Deleted
Scale Variance if Item Deleted
Corrected Item-Total Correlation
Cronbach's Alpha if Item
Deleted
X1.1 7.5688 1.877 .387 .545
X1.2 7.6881 1.494 .472 .416
X1.3 7.4404 1.841 .390 .540
Scale Statistics
Mean Variance Std. Deviation N of Items
11.3486 3.266 1.80727 3

106
Scale: Program Kesejahteraan Bersifat Fasilitatif (X2)
Case Processing Summary
N %
Cases Valid 109 100.0
Excludeda 0 .0
Total 109 100.0
a. Listwise deletion based on all variables in the procedure.
Reliability Statistics
Cronbach's Alpha N of Items
.594 3
Item Statistics
Mean Std. Deviation N
X2.1 3.7706 .76537 109
X2.2 3.8165 .78369 109
X2.3 3.7248 .84844 109
Item-Total Statistics
Scale Mean if Item Deleted
Scale Variance if Item Deleted
Corrected Item-Total Correlation
Cronbach's Alpha if Item
Deleted
X2.1 7.5413 1.825 .372 .538
X2.2 7.4954 1.678 .437 .444
X2.3 7.5872 1.597 .403 .497
Scale Statistics
Mean Variance Std. Deviation N of Items
11.3119 3.180 1.78314 3

107
Scale: Program Kesejahteraan Bersifat Pelayanan (X3)
Case Processing Summary
N %
Cases Valid 109 100.0
Excludeda 0 .0
Total 109 100.0
a. Listwise deletion based on all variables in the procedure.
Reliability Statistics
Cronbach's Alpha N of Items
.473 3
Item Statistics
Mean Std. Deviation N
X3.1 3.9817 .96207 109
X3.2 3.9174 .97305 109
X3.3 3.6606 .68340 109
Item-Total Statistics
Scale Mean if Item Deleted
Scale Variance if Item Deleted
Corrected Item-Total Correlation
Cronbach's Alpha if Item
Deleted
X3.1 7.5780 1.283 .554 -.204a
X3.2 7.6422 1.436 .443 .060
X3.3 7.8991 3.036 -.037 .767
a. The value is negative due to a negative average covariance among items. This violates reliability model assumptions. You may want to check item codings.
Scale Statistics
Mean Variance Std. Deviation N of Items
11.5596 3.415 1.84808 3

108
Scale: Semangat Kerja (Y)
Case Processing Summary
N %
Cases Valid 109 100.0
Excludeda 0 .0
Total 109 100.0
a. Listwise deletion based on all variables in the procedure.
Reliability Statistics
Cronbach's Alpha N of Items
.590 3
Item Statistics
Mean Std. Deviation N
Y1.1 3.8532 .75554 109
Y1.2 3.8257 .85898 109
Y1.3 3.8716 .89340 109
Item-Total Statistics
Scale Mean if Item Deleted
Scale Variance if Item Deleted
Corrected Item-Total Correlation
Cronbach's Alpha if Item
Deleted
Y1.1 7.6972 2.176 .325 .588
Y1.2 7.7248 1.664 .483 .355
Y1.3 7.6789 1.739 .397 .494
Scale Statistics
Mean Variance Std. Deviation N of Items
11.5505 3.472 1.86332 3
109
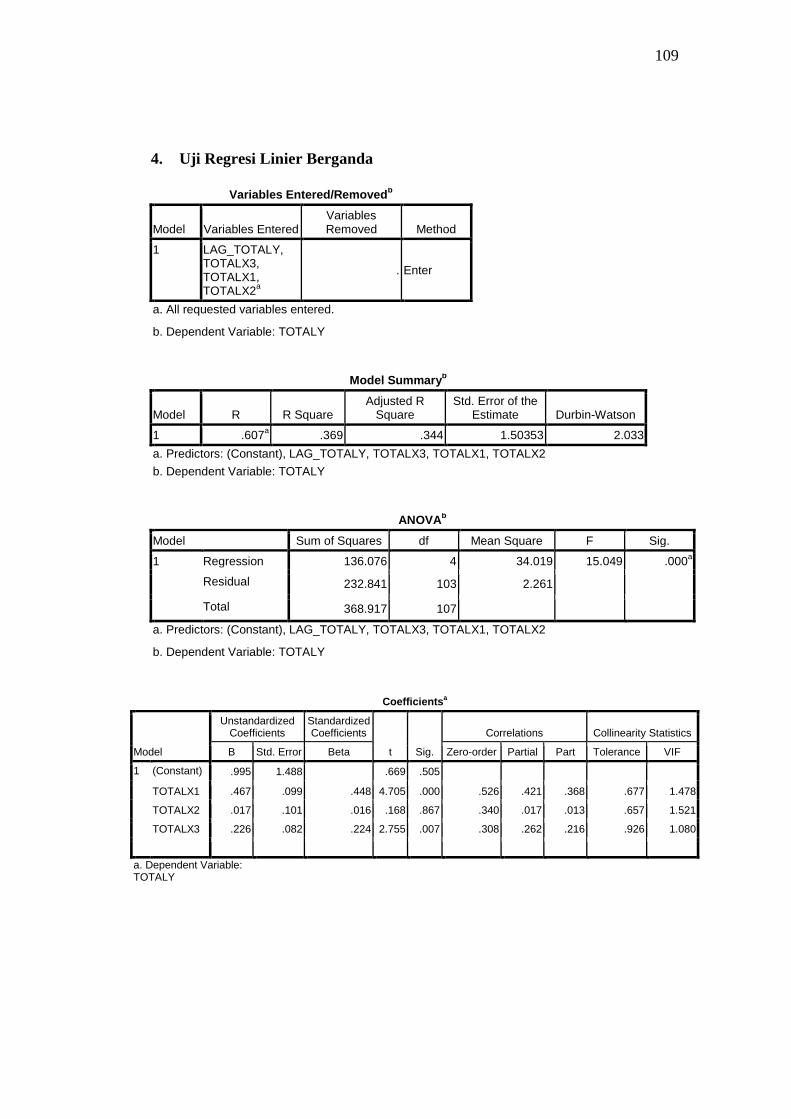
4. Uji Regresi Linier Berganda
Variables Entered/Removedb
Model Variables Entered Variables Removed Method
1 LAG_TOTALY, TOTALX3, TOTALX1, TOTALX2
a
. Enter
a. All requested variables entered.
b. Dependent Variable: TOTALY
Model Summary
b
Model R R Square Adjusted R
Square Std. Error of the
Estimate Durbin-Watson
1 .607a .369 .344 1.50353 2.033
a. Predictors: (Constant), LAG_TOTALY, TOTALX3, TOTALX1, TOTALX2
b. Dependent Variable: TOTALY
ANOVA
b
Model Sum of Squares df Mean Square F Sig.
1 Regression 136.076 4 34.019 15.049 .000a
Residual 232.841 103 2.261
Total 368.917 107
a. Predictors: (Constant), LAG_TOTALY, TOTALX3, TOTALX1, TOTALX2
b. Dependent Variable: TOTALY
Coefficientsa
Model
Unstandardized Coefficients
Standardized Coefficients
t Sig.
Correlations Collinearity Statistics
B Std. Error Beta Zero-order Partial Part Tolerance VIF
1 (Constant) .995 1.488 .669 .505
TOTALX1 .467 .099 .448 4.705 .000 .526 .421 .368 .677 1.478
TOTALX2 .017 .101 .016 .168 .867 .340 .017 .013 .657 1.521
TOTALX3 .226 .082 .224 2.755 .007 .308 .262 .216 .926 1.080
a. Dependent Variable: TOTALY

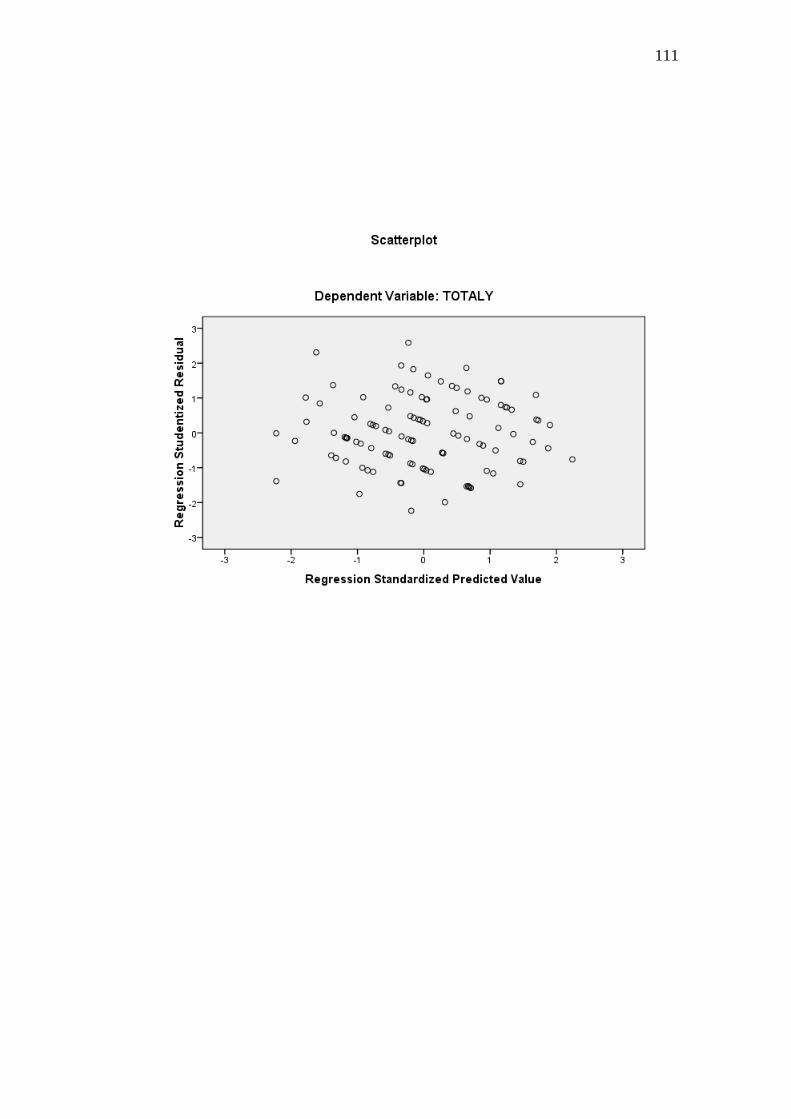
110
Charts
111
Related Documents