474 IEEE TRANSACTIONS ON CONTROL SYSTEMS TECHNOLOGY, VOL. 15, NO. 3, MAY 2007 Control of Integrated Powertrain With Electronic Throttle and Automatic Transmission Daekyun Kim, Huei Peng, Shushan Bai, and Joel M. Maguire Abstract—A process to design the control strategy for a vehicle with electronic throttle control (ETC) and automatic transmission is proposed in this paper. The driver’s accelerator pedal position is interpreted as a power request, which is to be satisfied by co- ordinating the transmission gear shift and the throttle opening in an optimal fashion. The dynamic programming (DP) technique is used to obtain the optimal gear shift and throttle opening which maximizes fuel economy while satisfying the power demand. The optimal results at different power levels are then combined to form a gear map and a throttle map which governs the operation of the integrated powertrain. A control architecture concept is presented where the relationship between the accelerator pedal position and the power demand level can be adjusted according to the prefer- ence of the vehicle performance target. Simulation, vehicle test, and dynamometer test results show that the proposed integrated powertrain control scheme produces power consistently and im- proves fuel efficiency compared with conventional powertrain con- trol schemes. Index Terms—Automatic transmission, dynamic programming (DP), electronic throttle control, gear shift map, integrated power- train control. I. INTRODUCTION I N conventional vehicles powered by gasoline engines, the accelerator pedal actuated by the driver is mechanically linked to the engine throttle which regulates the airflow to the intake manifold. When the driver holds the accelerator pedal constant, the power and torque generated by the engine will change with engine speed, and thus, the driver needs to vary the pedal position to obtain constant torque (acceleration) or power from the engine. Since each powertrain has its own torque/power characteristics, drivers bear the responsibility to adapt to the powertrain, instead of the other way around. The mechanical linkage between accelerator pedal to the throttle is replaced by an electronic connection, commonly known as electronic throttle control (ETC) [1], [2] in modern vehicles. ETC provides flexibility between the pedal to throttle mapping and, thus, a new design degree-of-freedom. For example, it Manuscript received October 30, 2006; revised January 8, 2007. Manuscript received in final form January 25, 2007. Recommended by Associate Editor K. Butts. This work was supported by General Motors Powertrain. D. Kim was with the Department of Mechanical Engineering, University of Michigan, Ann Arbor, MI 48109-2121 USA. He is now with Research and De- velopment and Strategic Planning, General Motors, Warren, MI 48090-9055 USA (e-mail: [email protected]). H. Peng is with the Department of Mechanical Engineering, University of Michigan, Ann Arbor, MI 48109-2121 USA (e-mail: [email protected]). S. Bai is with the General Motors Powertrain, Ypsilanti, MI 48197-0935 USA (e-mail: [email protected]). J. M. Maguire is with the General Motors Powertrain, Pontiac, MI 48340- 2920 USA (e-mail: [email protected]). Digital Object Identifier 10.1109/TCST.2007.894641 can be used to realize and integrate features such as idle speed control, cruise control, adaptive cruise control, traction control, etc. In this paper, we investigate an integrated powertrain con- trol feature, which coordinates the control of transmission (gear shifting) and engine (throttle). The design goal is to satisfy the driver’s power demand while optimizing fuel economy. For modern powertrain systems equipped with ETC, many studies explored the possible advantage of controlling the throttle opening angle during a gear shift. In [3], Ge et al. present a control algorithm to minimize the reduction in ve- hicle performance and deterioration of shift quality due to the sudden change of the gear ratio. Using a closed-loop control scheme, the throttle opening is adjusted during the shift to reduce the speed difference between the synchronized gears in the gearbox and the speed difference between the driving and the driven plates of the clutch. Minowa et al. [4] interpreted the accelerator pedal position as a drive shaft torque demand. The throttle opening can then be controlled to compensate for the torque reduction caused by the selection of the gear shift timing for minimum fuel consumption. The method was found to be promising in improving fuel economy and acceleration feel. Yasuoka et al. [5] presented an integrated control algorithm for a powertrain system with ETC and continuously variable transmission (CVT). Target engine torque and target CVT ratio to achieve the demanded drive torque with optimum fuel economy is determined based on the gear ratio map and drive torque demand. Moreover, to improve the torque response during a transient, the engine torque is used to compensate for the lag in inertia torque and the gear ratio change response. Sakaguchi et al. [6] asserts that to improve fuel efficiency the entire powertrain, including engine and transmission, need to be considered rather than just focusing on the engine. For a vehicle equipped with CVT, an algorithm to calculate the en- gine torque and CVT ratio combinations achieving the highest overall efficiency for the powertrain is developed. When an advanced powertrain is equipped with electronic throttle, the accelerator pedal is no longer linked with the engine throttle plate. Therefore, the detected pedal motion needs to be interpreted as a driver demand, typically either as a torque de- mand or a power demand. In this paper, the accelerator pedal po- sition is interpreted as a request for power for two reasons. First, the definition of an “ideal powertrain” is a power source that pro- duces power in a reliable way. The other is that according to a study by Vahabzadeh et al. [7], engine power was found to be the best physical measurable parameter representing the driver’s demand. In this paper, we will develop throttle/gear maps that satisfy driver’s power demand, and in the meantime, achieve optimal fuel economy. First, a vehicle model that is accurate enough 1063-6536/$25.00 © 2007 IEEE

Welcome message from author
This document is posted to help you gain knowledge. Please leave a comment to let me know what you think about it! Share it to your friends and learn new things together.
Transcript
474 IEEE TRANSACTIONS ON CONTROL SYSTEMS TECHNOLOGY, VOL. 15, NO. 3, MAY 2007
Control of Integrated Powertrain With ElectronicThrottle and Automatic Transmission
Daekyun Kim, Huei Peng, Shushan Bai, and Joel M. Maguire
Abstract—A process to design the control strategy for a vehiclewith electronic throttle control (ETC) and automatic transmissionis proposed in this paper. The driver’s accelerator pedal positionis interpreted as a power request, which is to be satisfied by co-ordinating the transmission gear shift and the throttle opening inan optimal fashion. The dynamic programming (DP) technique isused to obtain the optimal gear shift and throttle opening whichmaximizes fuel economy while satisfying the power demand. Theoptimal results at different power levels are then combined to forma gear map and a throttle map which governs the operation of theintegrated powertrain. A control architecture concept is presentedwhere the relationship between the accelerator pedal position andthe power demand level can be adjusted according to the prefer-ence of the vehicle performance target. Simulation, vehicle test,and dynamometer test results show that the proposed integratedpowertrain control scheme produces power consistently and im-proves fuel efficiency compared with conventional powertrain con-trol schemes.
Index Terms—Automatic transmission, dynamic programming(DP), electronic throttle control, gear shift map, integrated power-train control.
I. INTRODUCTION
I N conventional vehicles powered by gasoline engines, theaccelerator pedal actuated by the driver is mechanically
linked to the engine throttle which regulates the airflow to theintake manifold. When the driver holds the accelerator pedalconstant, the power and torque generated by the engine willchange with engine speed, and thus, the driver needs to varythe pedal position to obtain constant torque (acceleration) orpower from the engine. Since each powertrain has its owntorque/power characteristics, drivers bear the responsibility toadapt to the powertrain, instead of the other way around. Themechanical linkage between accelerator pedal to the throttleis replaced by an electronic connection, commonly known aselectronic throttle control (ETC) [1], [2] in modern vehicles.ETC provides flexibility between the pedal to throttle mappingand, thus, a new design degree-of-freedom. For example, it
Manuscript received October 30, 2006; revised January 8, 2007. Manuscriptreceived in final form January 25, 2007. Recommended by Associate Editor K.Butts. This work was supported by General Motors Powertrain.
D. Kim was with the Department of Mechanical Engineering, University ofMichigan, Ann Arbor, MI 48109-2121 USA. He is now with Research and De-velopment and Strategic Planning, General Motors, Warren, MI 48090-9055USA (e-mail: [email protected]).
H. Peng is with the Department of Mechanical Engineering, University ofMichigan, Ann Arbor, MI 48109-2121 USA (e-mail: [email protected]).
S. Bai is with the General Motors Powertrain, Ypsilanti, MI 48197-0935 USA(e-mail: [email protected]).
J. M. Maguire is with the General Motors Powertrain, Pontiac, MI 48340-2920 USA (e-mail: [email protected]).
Digital Object Identifier 10.1109/TCST.2007.894641
can be used to realize and integrate features such as idle speedcontrol, cruise control, adaptive cruise control, traction control,etc. In this paper, we investigate an integrated powertrain con-trol feature, which coordinates the control of transmission (gearshifting) and engine (throttle). The design goal is to satisfy thedriver’s power demand while optimizing fuel economy.
For modern powertrain systems equipped with ETC, manystudies explored the possible advantage of controlling thethrottle opening angle during a gear shift. In [3], Ge et al.present a control algorithm to minimize the reduction in ve-hicle performance and deterioration of shift quality due to thesudden change of the gear ratio. Using a closed-loop controlscheme, the throttle opening is adjusted during the shift toreduce the speed difference between the synchronized gears inthe gearbox and the speed difference between the driving andthe driven plates of the clutch. Minowa et al. [4] interpreted theaccelerator pedal position as a drive shaft torque demand. Thethrottle opening can then be controlled to compensate for thetorque reduction caused by the selection of the gear shift timingfor minimum fuel consumption. The method was found to bepromising in improving fuel economy and acceleration feel.Yasuoka et al. [5] presented an integrated control algorithmfor a powertrain system with ETC and continuously variabletransmission (CVT). Target engine torque and target CVTratio to achieve the demanded drive torque with optimum fueleconomy is determined based on the gear ratio map and drivetorque demand. Moreover, to improve the torque responseduring a transient, the engine torque is used to compensate forthe lag in inertia torque and the gear ratio change response.Sakaguchi et al. [6] asserts that to improve fuel efficiency theentire powertrain, including engine and transmission, need tobe considered rather than just focusing on the engine. For avehicle equipped with CVT, an algorithm to calculate the en-gine torque and CVT ratio combinations achieving the highestoverall efficiency for the powertrain is developed.
When an advanced powertrain is equipped with electronicthrottle, the accelerator pedal is no longer linked with the enginethrottle plate. Therefore, the detected pedal motion needs to beinterpreted as a driver demand, typically either as a torque de-mand or a power demand. In this paper, the accelerator pedal po-sition is interpreted as a request for power for two reasons. First,the definition of an “ideal powertrain” is a power source that pro-duces power in a reliable way. The other is that according to astudy by Vahabzadeh et al. [7], engine power was found to bethe best physical measurable parameter representing the driver’sdemand.
In this paper, we will develop throttle/gear maps that satisfydriver’s power demand, and in the meantime, achieve optimalfuel economy. First, a vehicle model that is accurate enough
1063-6536/$25.00 © 2007 IEEE
KIM et al.: CONTROL OF INTEGRATED POWERTRAIN WITH ELECTRONIC THROTTLE AND AUTOMATIC TRANSMISSION 475
to emulate a target vehicle is created. The model includessubmodels for an engine, a torque converter, a transmissiongear box, and the tire/vehicle dynamics. The model is vali-dated against a wide open throttle field test data in additionto the EPA fuel economy cycle tests. The simulation modelis then simplified to obtain a control design model for thedynamic programming (DP) process, with all the state andinput variables discretized into manageable numbers of gridpoints. Vehicle launch at selected constant pedal positions (i.e.,constant power request) are used as the maneuvers for our opti-mization process. A DP problem with fuel economy and powerproduction error as the cost function was then solved for eachof these maneuvers. The optimal inputs (throttle opening andgear shift) are obtained for each maneuver at constant powerrequest. Results from all the power levels are then combinedto form a throttle map and a gear map. The obtained throttlemap and gear map are implemented in the vehicle simulationmodel and are tested for fuel economy by running the EPA fueleconomy cycle. Finally, the maps are implemented in the testvehicle and are evaluated for fuel economy, performance, andcomfort.
II. VEHICLE SIMULATION MODEL
In this section, the simulation model of the target vehiclesystem is described. This model will be used to test fueleconomy and drivability of the powertrain control strategies. Itwill also serve as the basis for the model of the DP optimization.The model needs to be accurate enough to emulate the behaviorof the target vehicle yet possess minimal complexity. Themodel is composed of two main components: the powertrainand the tire/vehicle body. The powertrain is further dividedinto three subcomponents: the engine, the torque converter, andthe transmission gearbox. The powertrain is subdivided in thismanner to anticipate future modifications of these subcompo-nents into various different component systems such as engineswith variable cylinder activation technology, diesel engines,six-speed ATs, CVTs, etc. The math-based optimization pro-cedure established in this study is not confined to powertrainsystems with conventional subcomponents but is meant as thebackbone for control design of general powertrains. For thetire/vehicle body, only the longitudinal dynamics is consideredsince, in general, fuel economy and drivability of a vehicleare measured only in regards to the longitudinal motion of thevehicle.
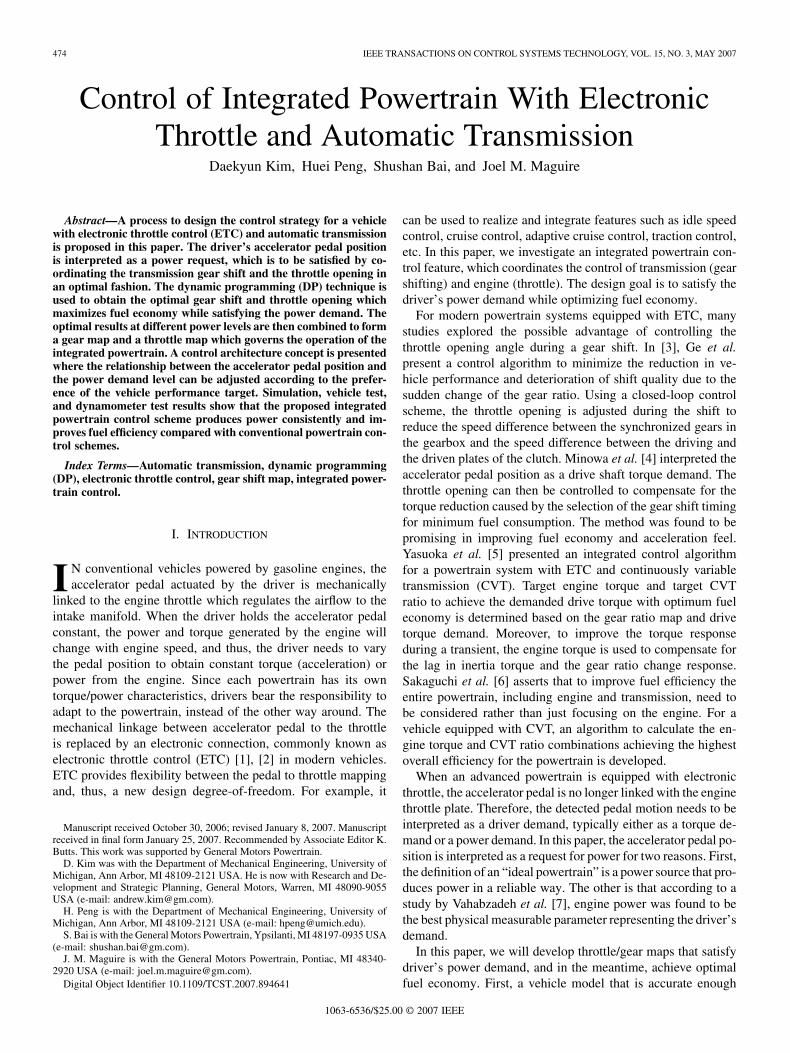
The vehicle model is structured in the Matlab/SIMULINKenvironment, as shown in Fig. 1. The target vehicle for this studyis a two-wheel drive production pickup truck with a 5.3-L V8engine equipped with ETC and a four-speed AT. Parameters ofthe truck are shown in Table I.
A. Engine
The engine angular speed is calculated from the enginerotational dynamics
(1)
where and are the rotational inertia of the engine and thetorque converter pump, and are the engine torque and the
Fig. 1. Vehicle simulation model in SIMULINK blocks.
TABLE IVEHICLE PARAMETERS
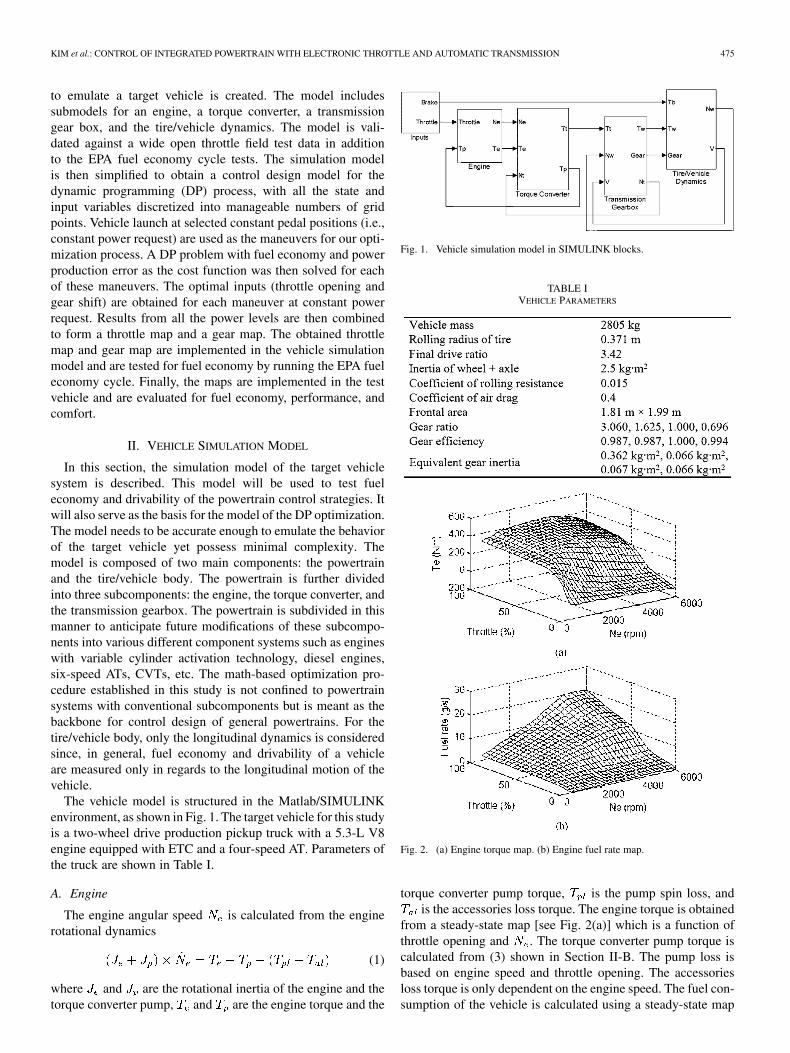
Fig. 2. (a) Engine torque map. (b) Engine fuel rate map.
torque converter pump torque, is the pump spin loss, andis the accessories loss torque. The engine torque is obtained
from a steady-state map [see Fig. 2(a)] which is a function ofthrottle opening and . The torque converter pump torque iscalculated from (3) shown in Section II-B. The pump loss isbased on engine speed and throttle opening. The accessoriesloss torque is only dependent on the engine speed. The fuel con-sumption of the vehicle is calculated using a steady-state map
476 IEEE TRANSACTIONS ON CONTROL SYSTEMS TECHNOLOGY, VOL. 15, NO. 3, MAY 2007
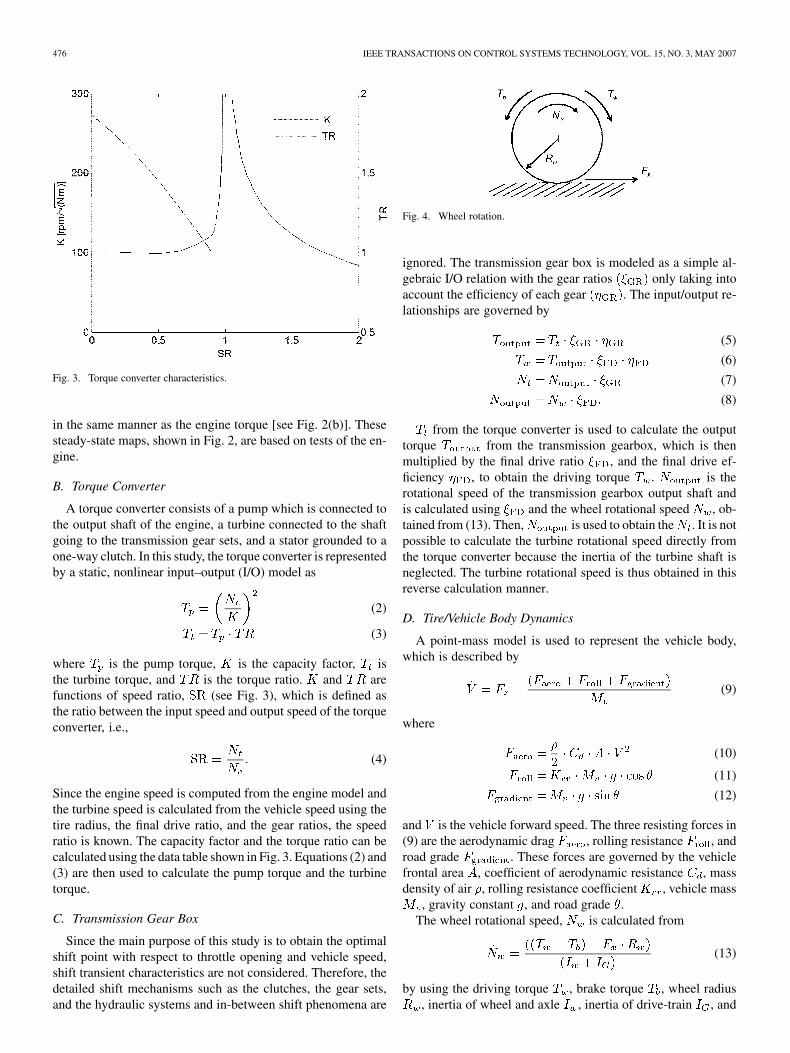
Fig. 3. Torque converter characteristics.
in the same manner as the engine torque [see Fig. 2(b)]. Thesesteady-state maps, shown in Fig. 2, are based on tests of the en-gine.
B. Torque Converter
A torque converter consists of a pump which is connected tothe output shaft of the engine, a turbine connected to the shaftgoing to the transmission gear sets, and a stator grounded to aone-way clutch. In this study, the torque converter is representedby a static, nonlinear input–output (I/O) model as
(2)
(3)
where is the pump torque, is the capacity factor, isthe turbine torque, and is the torque ratio. and arefunctions of speed ratio, (see Fig. 3), which is defined asthe ratio between the input speed and output speed of the torqueconverter, i.e.,
(4)
Since the engine speed is computed from the engine model andthe turbine speed is calculated from the vehicle speed using thetire radius, the final drive ratio, and the gear ratios, the speedratio is known. The capacity factor and the torque ratio can becalculated using the data table shown in Fig. 3. Equations (2) and(3) are then used to calculate the pump torque and the turbinetorque.
C. Transmission Gear Box
Since the main purpose of this study is to obtain the optimalshift point with respect to throttle opening and vehicle speed,shift transient characteristics are not considered. Therefore, thedetailed shift mechanisms such as the clutches, the gear sets,and the hydraulic systems and in-between shift phenomena are
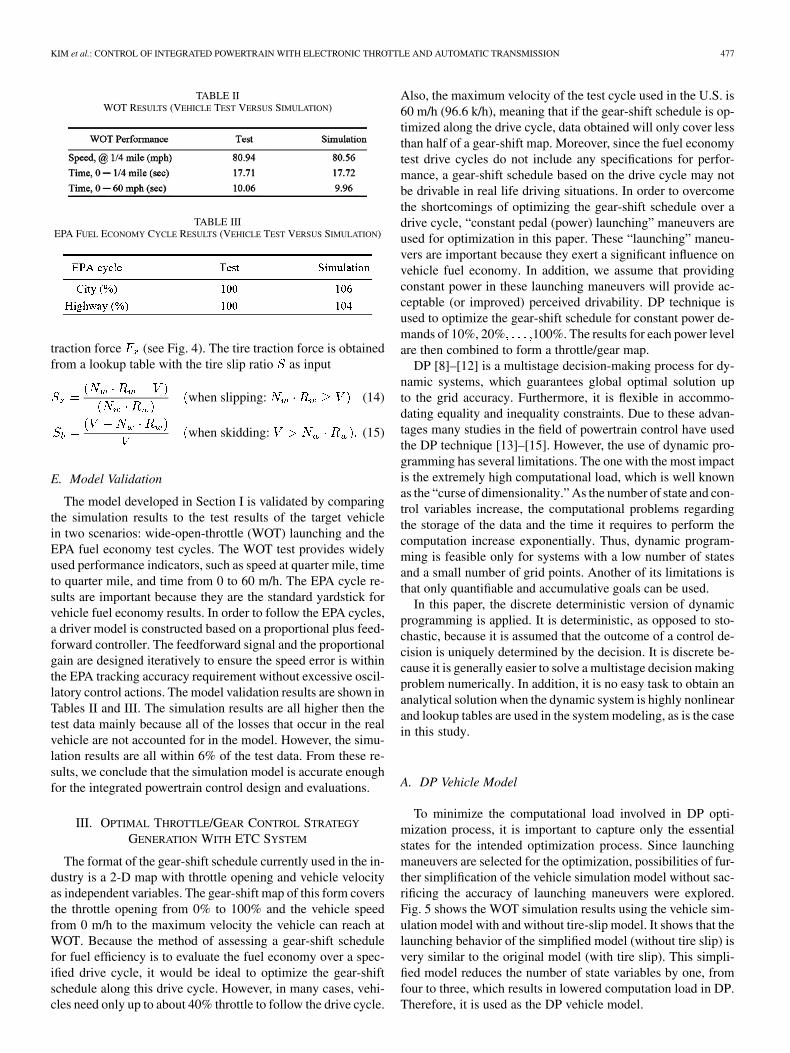
Fig. 4. Wheel rotation.
ignored. The transmission gear box is modeled as a simple al-gebraic I/O relation with the gear ratios only taking intoaccount the efficiency of each gear . The input/output re-lationships are governed by
(5)
(6)
(7)
(8)
from the torque converter is used to calculate the outputtorque from the transmission gearbox, which is thenmultiplied by the final drive ratio , and the final drive ef-ficiency , to obtain the driving torque . is therotational speed of the transmission gearbox output shaft andis calculated using and the wheel rotational speed , ob-tained from (13). Then, is used to obtain the . It is notpossible to calculate the turbine rotational speed directly fromthe torque converter because the inertia of the turbine shaft isneglected. The turbine rotational speed is thus obtained in thisreverse calculation manner.
D. Tire/Vehicle Body Dynamics
A point-mass model is used to represent the vehicle body,which is described by
(9)
where
(10)
(11)
(12)
and is the vehicle forward speed. The three resisting forces in(9) are the aerodynamic drag , rolling resistance , androad grade . These forces are governed by the vehiclefrontal area , coefficient of aerodynamic resistance , massdensity of air , rolling resistance coefficient , vehicle mass
, gravity constant , and road grade .The wheel rotational speed, is calculated from
(13)
by using the driving torque , brake torque , wheel radius, inertia of wheel and axle , inertia of drive-train , and
KIM et al.: CONTROL OF INTEGRATED POWERTRAIN WITH ELECTRONIC THROTTLE AND AUTOMATIC TRANSMISSION 477
TABLE IIWOT RESULTS (VEHICLE TEST VERSUS SIMULATION)
TABLE IIIEPA FUEL ECONOMY CYCLE RESULTS (VEHICLE TEST VERSUS SIMULATION)
traction force (see Fig. 4). The tire traction force is obtainedfrom a lookup table with the tire slip ratio as input
when slipping: (14)
when skidding: (15)
E. Model Validation
The model developed in Section I is validated by comparingthe simulation results to the test results of the target vehiclein two scenarios: wide-open-throttle (WOT) launching and theEPA fuel economy test cycles. The WOT test provides widelyused performance indicators, such as speed at quarter mile, timeto quarter mile, and time from 0 to 60 m/h. The EPA cycle re-sults are important because they are the standard yardstick forvehicle fuel economy results. In order to follow the EPA cycles,a driver model is constructed based on a proportional plus feed-forward controller. The feedforward signal and the proportionalgain are designed iteratively to ensure the speed error is withinthe EPA tracking accuracy requirement without excessive oscil-latory control actions. The model validation results are shown inTables II and III. The simulation results are all higher then thetest data mainly because all of the losses that occur in the realvehicle are not accounted for in the model. However, the simu-lation results are all within 6% of the test data. From these re-sults, we conclude that the simulation model is accurate enoughfor the integrated powertrain control design and evaluations.
III. OPTIMAL THROTTLE/GEAR CONTROL STRATEGY
GENERATION WITH ETC SYSTEM
The format of the gear-shift schedule currently used in the in-dustry is a 2-D map with throttle opening and vehicle velocityas independent variables. The gear-shift map of this form coversthe throttle opening from 0% to 100% and the vehicle speedfrom 0 m/h to the maximum velocity the vehicle can reach atWOT. Because the method of assessing a gear-shift schedulefor fuel efficiency is to evaluate the fuel economy over a spec-ified drive cycle, it would be ideal to optimize the gear-shiftschedule along this drive cycle. However, in many cases, vehi-cles need only up to about 40% throttle to follow the drive cycle.
Also, the maximum velocity of the test cycle used in the U.S. is60 m/h (96.6 k/h), meaning that if the gear-shift schedule is op-timized along the drive cycle, data obtained will only cover lessthan half of a gear-shift map. Moreover, since the fuel economytest drive cycles do not include any specifications for perfor-mance, a gear-shift schedule based on the drive cycle may notbe drivable in real life driving situations. In order to overcomethe shortcomings of optimizing the gear-shift schedule over adrive cycle, “constant pedal (power) launching” maneuvers areused for optimization in this paper. These “launching” maneu-vers are important because they exert a significant influence onvehicle fuel economy. In addition, we assume that providingconstant power in these launching maneuvers will provide ac-ceptable (or improved) perceived drivability. DP technique isused to optimize the gear-shift schedule for constant power de-mands of 10%, 20% 100%. The results for each power levelare then combined to form a throttle/gear map.
DP [8]–[12] is a multistage decision-making process for dy-namic systems, which guarantees global optimal solution upto the grid accuracy. Furthermore, it is flexible in accommo-dating equality and inequality constraints. Due to these advan-tages many studies in the field of powertrain control have usedthe DP technique [13]–[15]. However, the use of dynamic pro-gramming has several limitations. The one with the most impactis the extremely high computational load, which is well knownas the “curse of dimensionality.” As the number of state and con-trol variables increase, the computational problems regardingthe storage of the data and the time it requires to perform thecomputation increase exponentially. Thus, dynamic program-ming is feasible only for systems with a low number of statesand a small number of grid points. Another of its limitations isthat only quantifiable and accumulative goals can be used.
In this paper, the discrete deterministic version of dynamicprogramming is applied. It is deterministic, as opposed to sto-chastic, because it is assumed that the outcome of a control de-cision is uniquely determined by the decision. It is discrete be-cause it is generally easier to solve a multistage decision makingproblem numerically. In addition, it is no easy task to obtain ananalytical solution when the dynamic system is highly nonlinearand lookup tables are used in the system modeling, as is the casein this study.
A. DP Vehicle Model
To minimize the computational load involved in DP opti-mization process, it is important to capture only the essentialstates for the intended optimization process. Since launchingmaneuvers are selected for the optimization, possibilities of fur-ther simplification of the vehicle simulation model without sac-rificing the accuracy of launching maneuvers were explored.Fig. 5 shows the WOT simulation results using the vehicle sim-ulation model with and without tire-slip model. It shows that thelaunching behavior of the simplified model (without tire slip) isvery similar to the original model (with tire slip). This simpli-fied model reduces the number of state variables by one, fromfour to three, which results in lowered computation load in DP.Therefore, it is used as the DP vehicle model.
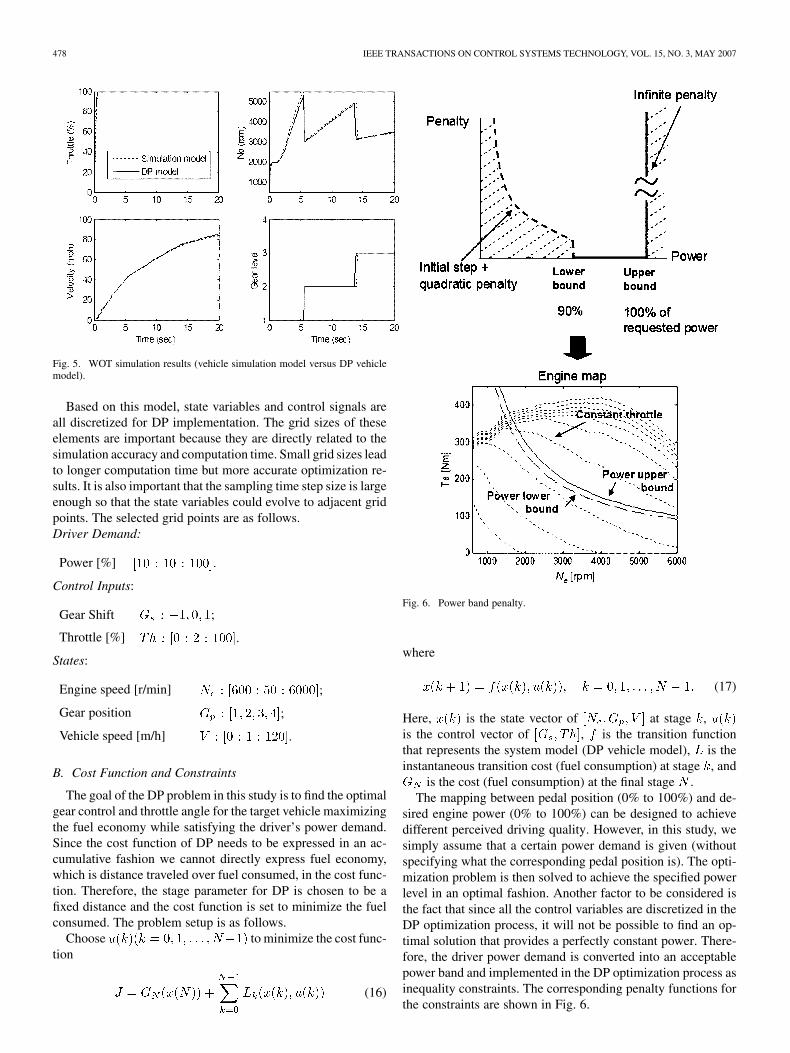
478 IEEE TRANSACTIONS ON CONTROL SYSTEMS TECHNOLOGY, VOL. 15, NO. 3, MAY 2007
Fig. 5. WOT simulation results (vehicle simulation model versus DP vehiclemodel).
Based on this model, state variables and control signals areall discretized for DP implementation. The grid sizes of theseelements are important because they are directly related to thesimulation accuracy and computation time. Small grid sizes leadto longer computation time but more accurate optimization re-sults. It is also important that the sampling time step size is largeenough so that the state variables could evolve to adjacent gridpoints. The selected grid points are as follows.Driver Demand:
Power [%]
Control Inputs:
Gear Shift ;
Throttle [%] .
States:
Engine speed [r/min] ;
Gear position ;
Vehicle speed [m/h] .
B. Cost Function and Constraints
The goal of the DP problem in this study is to find the optimalgear control and throttle angle for the target vehicle maximizingthe fuel economy while satisfying the driver’s power demand.Since the cost function of DP needs to be expressed in an ac-cumulative fashion we cannot directly express fuel economy,which is distance traveled over fuel consumed, in the cost func-tion. Therefore, the stage parameter for DP is chosen to be afixed distance and the cost function is set to minimize the fuelconsumed. The problem setup is as follows.
Choose to minimize the cost func-tion
(16)
Fig. 6. Power band penalty.
where
(17)
Here, is the state vector of at stage ,is the control vector of , is the transition functionthat represents the system model (DP vehicle model), is theinstantaneous transition cost (fuel consumption) at stage , and
is the cost (fuel consumption) at the final stage .The mapping between pedal position (0% to 100%) and de-
sired engine power (0% to 100%) can be designed to achievedifferent perceived driving quality. However, in this study, wesimply assume that a certain power demand is given (withoutspecifying what the corresponding pedal position is). The opti-mization problem is then solved to achieve the specified powerlevel in an optimal fashion. Another factor to be considered isthe fact that since all the control variables are discretized in theDP optimization process, it will not be possible to find an op-timal solution that provides a perfectly constant power. There-fore, the driver power demand is converted into an acceptablepower band and implemented in the DP optimization process asinequality constraints. The corresponding penalty functions forthe constraints are shown in Fig. 6.
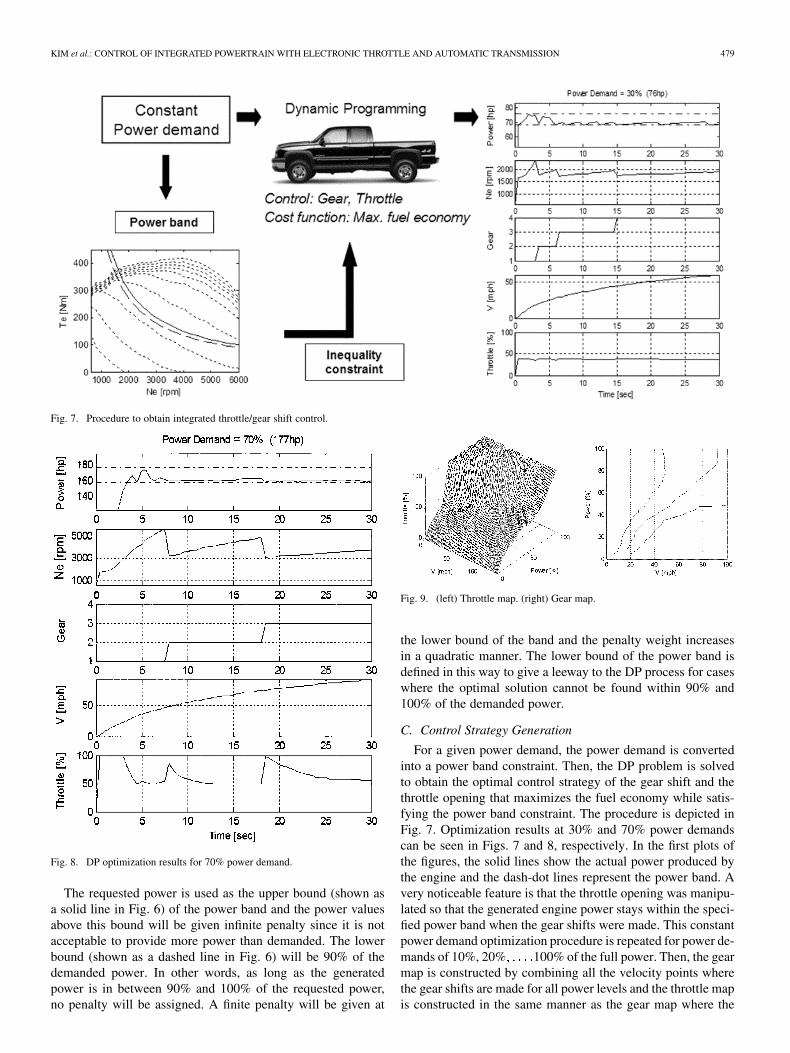
KIM et al.: CONTROL OF INTEGRATED POWERTRAIN WITH ELECTRONIC THROTTLE AND AUTOMATIC TRANSMISSION 479
Fig. 7. Procedure to obtain integrated throttle/gear shift control.
Fig. 8. DP optimization results for 70% power demand.
The requested power is used as the upper bound (shown asa solid line in Fig. 6) of the power band and the power valuesabove this bound will be given infinite penalty since it is notacceptable to provide more power than demanded. The lowerbound (shown as a dashed line in Fig. 6) will be 90% of thedemanded power. In other words, as long as the generatedpower is in between 90% and 100% of the requested power,no penalty will be assigned. A finite penalty will be given at
Fig. 9. (left) Throttle map. (right) Gear map.
the lower bound of the band and the penalty weight increasesin a quadratic manner. The lower bound of the power band isdefined in this way to give a leeway to the DP process for caseswhere the optimal solution cannot be found within 90% and100% of the demanded power.
C. Control Strategy Generation
For a given power demand, the power demand is convertedinto a power band constraint. Then, the DP problem is solvedto obtain the optimal control strategy of the gear shift and thethrottle opening that maximizes the fuel economy while satis-fying the power band constraint. The procedure is depicted inFig. 7. Optimization results at 30% and 70% power demandscan be seen in Figs. 7 and 8, respectively. In the first plots ofthe figures, the solid lines show the actual power produced bythe engine and the dash-dot lines represent the power band. Avery noticeable feature is that the throttle opening was manipu-lated so that the generated engine power stays within the speci-fied power band when the gear shifts were made. This constantpower demand optimization procedure is repeated for power de-mands of 10%, 20% 100% of the full power. Then, the gearmap is constructed by combining all the velocity points wherethe gear shifts are made for all power levels and the throttle mapis constructed in the same manner as the gear map where the
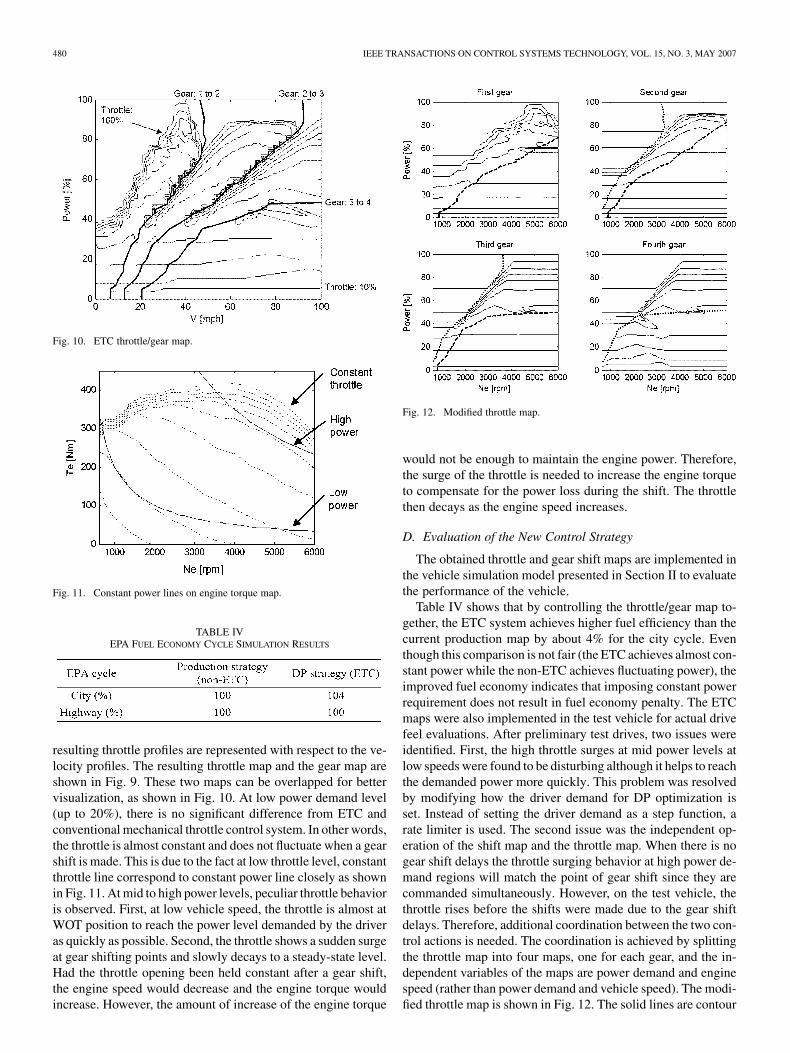
480 IEEE TRANSACTIONS ON CONTROL SYSTEMS TECHNOLOGY, VOL. 15, NO. 3, MAY 2007
Fig. 10. ETC throttle/gear map.
Fig. 11. Constant power lines on engine torque map.
TABLE IVEPA FUEL ECONOMY CYCLE SIMULATION RESULTS
resulting throttle profiles are represented with respect to the ve-locity profiles. The resulting throttle map and the gear map areshown in Fig. 9. These two maps can be overlapped for bettervisualization, as shown in Fig. 10. At low power demand level(up to 20%), there is no significant difference from ETC andconventional mechanical throttle control system. In other words,the throttle is almost constant and does not fluctuate when a gearshift is made. This is due to the fact at low throttle level, constantthrottle line correspond to constant power line closely as shownin Fig. 11. At mid to high power levels, peculiar throttle behavioris observed. First, at low vehicle speed, the throttle is almost atWOT position to reach the power level demanded by the driveras quickly as possible. Second, the throttle shows a sudden surgeat gear shifting points and slowly decays to a steady-state level.Had the throttle opening been held constant after a gear shift,the engine speed would decrease and the engine torque wouldincrease. However, the amount of increase of the engine torque
Fig. 12. Modified throttle map.
would not be enough to maintain the engine power. Therefore,the surge of the throttle is needed to increase the engine torqueto compensate for the power loss during the shift. The throttlethen decays as the engine speed increases.
D. Evaluation of the New Control Strategy
The obtained throttle and gear shift maps are implemented inthe vehicle simulation model presented in Section II to evaluatethe performance of the vehicle.
Table IV shows that by controlling the throttle/gear map to-gether, the ETC system achieves higher fuel efficiency than thecurrent production map by about 4% for the city cycle. Eventhough this comparison is not fair (the ETC achieves almost con-stant power while the non-ETC achieves fluctuating power), theimproved fuel economy indicates that imposing constant powerrequirement does not result in fuel economy penalty. The ETCmaps were also implemented in the test vehicle for actual drivefeel evaluations. After preliminary test drives, two issues wereidentified. First, the high throttle surges at mid power levels atlow speeds were found to be disturbing although it helps to reachthe demanded power more quickly. This problem was resolvedby modifying how the driver demand for DP optimization isset. Instead of setting the driver demand as a step function, arate limiter is used. The second issue was the independent op-eration of the shift map and the throttle map. When there is nogear shift delays the throttle surging behavior at high power de-mand regions will match the point of gear shift since they arecommanded simultaneously. However, on the test vehicle, thethrottle rises before the shifts were made due to the gear shiftdelays. Therefore, additional coordination between the two con-trol actions is needed. The coordination is achieved by splittingthe throttle map into four maps, one for each gear, and the in-dependent variables of the maps are power demand and enginespeed (rather than power demand and vehicle speed). The modi-fied throttle map is shown in Fig. 12. The solid lines are contour
KIM et al.: CONTROL OF INTEGRATED POWERTRAIN WITH ELECTRONIC THROTTLE AND AUTOMATIC TRANSMISSION 481
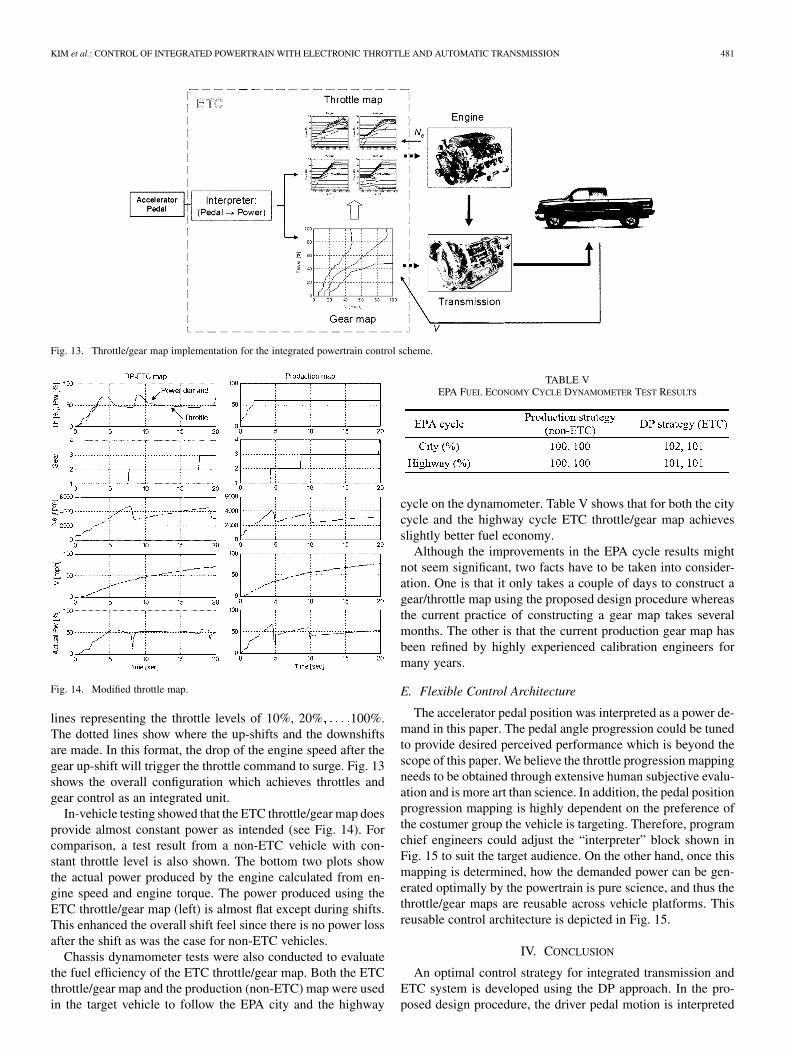
Fig. 13. Throttle/gear map implementation for the integrated powertrain control scheme.
Fig. 14. Modified throttle map.
lines representing the throttle levels of 10%, 20% 100%.The dotted lines show where the up-shifts and the downshiftsare made. In this format, the drop of the engine speed after thegear up-shift will trigger the throttle command to surge. Fig. 13shows the overall configuration which achieves throttles andgear control as an integrated unit.
In-vehicle testing showed that the ETC throttle/gear map doesprovide almost constant power as intended (see Fig. 14). Forcomparison, a test result from a non-ETC vehicle with con-stant throttle level is also shown. The bottom two plots showthe actual power produced by the engine calculated from en-gine speed and engine torque. The power produced using theETC throttle/gear map (left) is almost flat except during shifts.This enhanced the overall shift feel since there is no power lossafter the shift as was the case for non-ETC vehicles.
Chassis dynamometer tests were also conducted to evaluatethe fuel efficiency of the ETC throttle/gear map. Both the ETCthrottle/gear map and the production (non-ETC) map were usedin the target vehicle to follow the EPA city and the highway
TABLE VEPA FUEL ECONOMY CYCLE DYNAMOMETER TEST RESULTS
cycle on the dynamometer. Table V shows that for both the citycycle and the highway cycle ETC throttle/gear map achievesslightly better fuel economy.
Although the improvements in the EPA cycle results mightnot seem significant, two facts have to be taken into consider-ation. One is that it only takes a couple of days to construct agear/throttle map using the proposed design procedure whereasthe current practice of constructing a gear map takes severalmonths. The other is that the current production gear map hasbeen refined by highly experienced calibration engineers formany years.
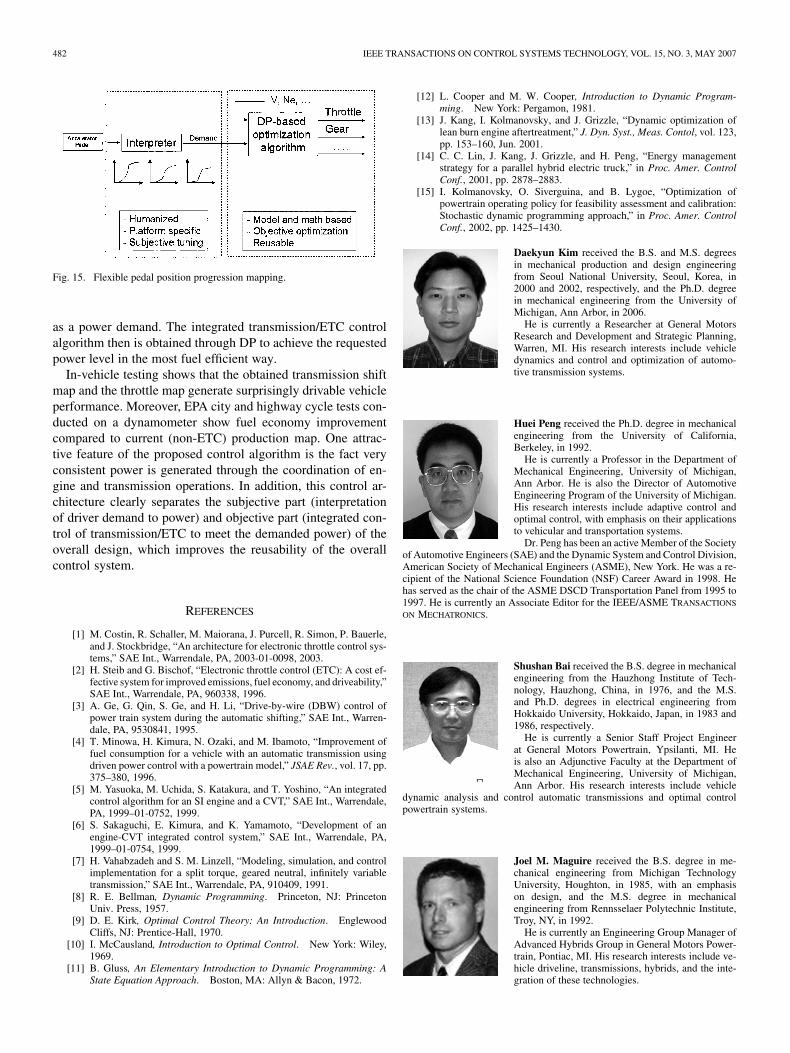
E. Flexible Control Architecture
The accelerator pedal position was interpreted as a power de-mand in this paper. The pedal angle progression could be tunedto provide desired perceived performance which is beyond thescope of this paper. We believe the throttle progression mappingneeds to be obtained through extensive human subjective evalu-ation and is more art than science. In addition, the pedal positionprogression mapping is highly dependent on the preference ofthe costumer group the vehicle is targeting. Therefore, programchief engineers could adjust the “interpreter” block shown inFig. 15 to suit the target audience. On the other hand, once thismapping is determined, how the demanded power can be gen-erated optimally by the powertrain is pure science, and thus thethrottle/gear maps are reusable across vehicle platforms. Thisreusable control architecture is depicted in Fig. 15.
IV. CONCLUSION
An optimal control strategy for integrated transmission andETC system is developed using the DP approach. In the pro-posed design procedure, the driver pedal motion is interpreted
482 IEEE TRANSACTIONS ON CONTROL SYSTEMS TECHNOLOGY, VOL. 15, NO. 3, MAY 2007
Fig. 15. Flexible pedal position progression mapping.
as a power demand. The integrated transmission/ETC controlalgorithm then is obtained through DP to achieve the requestedpower level in the most fuel efficient way.
In-vehicle testing shows that the obtained transmission shiftmap and the throttle map generate surprisingly drivable vehicleperformance. Moreover, EPA city and highway cycle tests con-ducted on a dynamometer show fuel economy improvementcompared to current (non-ETC) production map. One attrac-tive feature of the proposed control algorithm is the fact veryconsistent power is generated through the coordination of en-gine and transmission operations. In addition, this control ar-chitecture clearly separates the subjective part (interpretationof driver demand to power) and objective part (integrated con-trol of transmission/ETC to meet the demanded power) of theoverall design, which improves the reusability of the overallcontrol system.
REFERENCES
[1] M. Costin, R. Schaller, M. Maiorana, J. Purcell, R. Simon, P. Bauerle,and J. Stockbridge, “An architecture for electronic throttle control sys-tems,” SAE Int., Warrendale, PA, 2003-01-0098, 2003.
[2] H. Steib and G. Bischof, “Electronic throttle control (ETC): A cost ef-fective system for improved emissions, fuel economy, and driveability,”SAE Int., Warrendale, PA, 960338, 1996.
[3] A. Ge, G. Qin, S. Ge, and H. Li, “Drive-by-wire (DBW) control ofpower train system during the automatic shifting,” SAE Int., Warren-dale, PA, 9530841, 1995.
[4] T. Minowa, H. Kimura, N. Ozaki, and M. Ibamoto, “Improvement offuel consumption for a vehicle with an automatic transmission usingdriven power control with a powertrain model,” JSAE Rev., vol. 17, pp.375–380, 1996.
[5] M. Yasuoka, M. Uchida, S. Katakura, and T. Yoshino, “An integratedcontrol algorithm for an SI engine and a CVT,” SAE Int., Warrendale,PA, 1999–01-0752, 1999.
[6] S. Sakaguchi, E. Kimura, and K. Yamamoto, “Development of anengine-CVT integrated control system,” SAE Int., Warrendale, PA,1999–01-0754, 1999.
[7] H. Vahabzadeh and S. M. Linzell, “Modeling, simulation, and controlimplementation for a split torque, geared neutral, infinitely variabletransmission,” SAE Int., Warrendale, PA, 910409, 1991.
[8] R. E. Bellman, Dynamic Programming. Princeton, NJ: PrincetonUniv. Press, 1957.
[9] D. E. Kirk, Optimal Control Theory: An Introduction. EnglewoodCliffs, NJ: Prentice-Hall, 1970.
[10] I. McCausland, Introduction to Optimal Control. New York: Wiley,1969.
[11] B. Gluss, An Elementary Introduction to Dynamic Programming: AState Equation Approach. Boston, MA: Allyn & Bacon, 1972.
[12] L. Cooper and M. W. Cooper, Introduction to Dynamic Program-ming. New York: Pergamon, 1981.
[13] J. Kang, I. Kolmanovsky, and J. Grizzle, “Dynamic optimization oflean burn engine aftertreatment,” J. Dyn. Syst., Meas. Contol, vol. 123,pp. 153–160, Jun. 2001.
[14] C. C. Lin, J. Kang, J. Grizzle, and H. Peng, “Energy managementstrategy for a parallel hybrid electric truck,” in Proc. Amer. ControlConf., 2001, pp. 2878–2883.
[15] I. Kolmanovsky, O. Siverguina, and B. Lygoe, “Optimization ofpowertrain operating policy for feasibility assessment and calibration:Stochastic dynamic programming approach,” in Proc. Amer. ControlConf., 2002, pp. 1425–1430.
Daekyun Kim received the B.S. and M.S. degreesin mechanical production and design engineeringfrom Seoul National University, Seoul, Korea, in2000 and 2002, respectively, and the Ph.D. degreein mechanical engineering from the University ofMichigan, Ann Arbor, in 2006.
He is currently a Researcher at General MotorsResearch and Development and Strategic Planning,Warren, MI. His research interests include vehicledynamics and control and optimization of automo-tive transmission systems.
Huei Peng received the Ph.D. degree in mechanicalengineering from the University of California,Berkeley, in 1992.
He is currently a Professor in the Department ofMechanical Engineering, University of Michigan,Ann Arbor. He is also the Director of AutomotiveEngineering Program of the University of Michigan.His research interests include adaptive control andoptimal control, with emphasis on their applicationsto vehicular and transportation systems.
Dr. Peng has been an active Member of the Societyof Automotive Engineers (SAE) and the Dynamic System and Control Division,American Society of Mechanical Engineers (ASME), New York. He was a re-cipient of the National Science Foundation (NSF) Career Award in 1998. Hehas served as the chair of the ASME DSCD Transportation Panel from 1995 to1997. He is currently an Associate Editor for the IEEE/ASME TRANSACTIONS
ON MECHATRONICS.
Shushan Bai received the B.S. degree in mechanicalengineering from the Hauzhong Institute of Tech-nology, Hauzhong, China, in 1976, and the M.S.and Ph.D. degrees in electrical engineering fromHokkaido University, Hokkaido, Japan, in 1983 and1986, respectively.
He is currently a Senior Staff Project Engineerat General Motors Powertrain, Ypsilanti, MI. Heis also an Adjunctive Faculty at the Department ofMechanical Engineering, University of Michigan,Ann Arbor. His research interests include vehicle
dynamic analysis and control automatic transmissions and optimal controlpowertrain systems.
Joel M. Maguire received the B.S. degree in me-chanical engineering from Michigan TechnologyUniversity, Houghton, in 1985, with an emphasison design, and the M.S. degree in mechanicalengineering from Rennsselaer Polytechnic Institute,Troy, NY, in 1992.
He is currently an Engineering Group Manager ofAdvanced Hybrids Group in General Motors Power-train, Pontiac, MI. His research interests include ve-hicle driveline, transmissions, hybrids, and the inte-gration of these technologies.
Related Documents