Dabur India Limited Dabur India Limited Investor Communication Quarter and Year ended March 31, 2013 April 30, 2013

Welcome message from author
This document is posted to help you gain knowledge. Please leave a comment to let me know what you think about it! Share it to your friends and learn new things together.
Transcript

Dabur India LimitedDabur India LimitedInvestor Communication
Quarter and Year ended March 31, 2013
April 30, 2013
Consolidated Net Sales crossed the Rs 6 000 crore mark in FY13 growing by 16 3%
Performance Overview : Q4 and FY2012-13
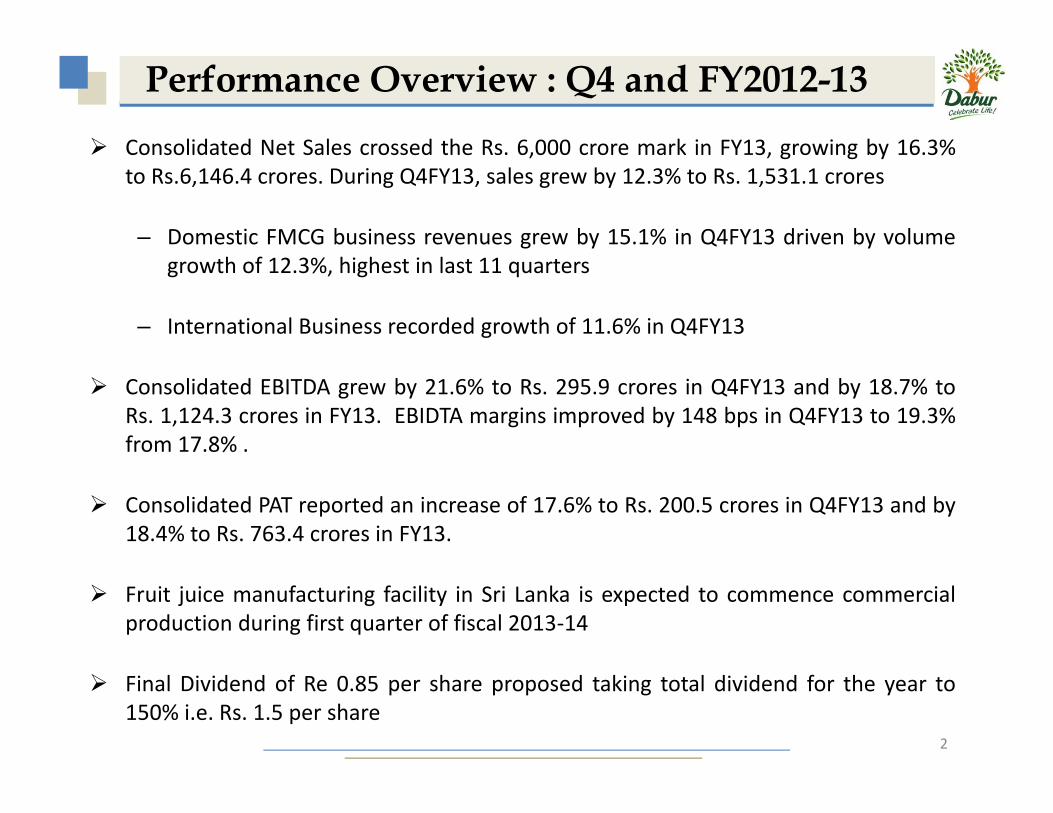
Consolidated Net Sales crossed the Rs. 6,000 crore mark in FY13, growing by 16.3%to Rs.6,146.4 crores. During Q4FY13, sales grew by 12.3% to Rs. 1,531.1 crores
– Domestic FMCG business revenues grew by 15.1% in Q4FY13 driven by volumegrowth of 12.3%, highest in last 11 quarters
– International Business recorded growth of 11.6% in Q4FY13
Consolidated EBITDA grew by 21.6% to Rs. 295.9 crores in Q4FY13 and by 18.7% toRs. 1,124.3 crores in FY13. EBIDTA margins improved by 148 bps in Q4FY13 to 19.3%from 17.8% .
Consolidated PAT reported an increase of 17.6% to Rs. 200.5 crores in Q4FY13 and by18.4% to Rs. 763.4 crores in FY13.
Fruit juice manufacturing facility in Sri Lanka is expected to commence commercialproduction during first quarter of fiscal 2013‐14
Final Dividend of Re 0.85 per share proposed taking total dividend for the year to150% i.e. Rs. 1.5 per share
2

1 363 61,531.1
Financial Performance: Q4 FY13Consol. Sales grew by 12.3% during Q4FY13
1,363.6,
500.0
1000.0
1500.0 Domestic FMCG growth continued at a steadypace reporting 15.1% growth
International business reported growth of11.6%. Organic International grew by 19.7%
Revenue (in Rs. Cr.)
0.0
Q4 FY12 Q4 FY13
295.9
11.6%. Organic International grew by 19.7%while Namaste revenues remained under somepressure
EBITDA increased by 21.6% and EBITDA margin243.3
50100150200250300
EBITDA (in Rs. Cr.)
expanded to 19.3% in Q4FY13 v/s 17.8% inQ4FY12
Material costs were lower at 48.3% of sales inQ4FY13 v/s 50.2% in Q4FY12
200 5250
050
Q4 FY12 Q4 FY13
Q / Q
Adpro as % of sales was at 12.5% v/s 13.4% inQ4FY12
Above factors translated into consolidated PAT170.5
200.5
50
100
150
200
50
PAT*(in Rs. Cr.)
Above factors translated into consolidated PATgrowth of 17.6% during the quarter
PAT Margins improved to 13.1% in Q4FY13from 12.5% in Q4FY12
0
50
Q4 FY12 Q4 FY13
3*After minority interest
5 283 26,146.4
60007000
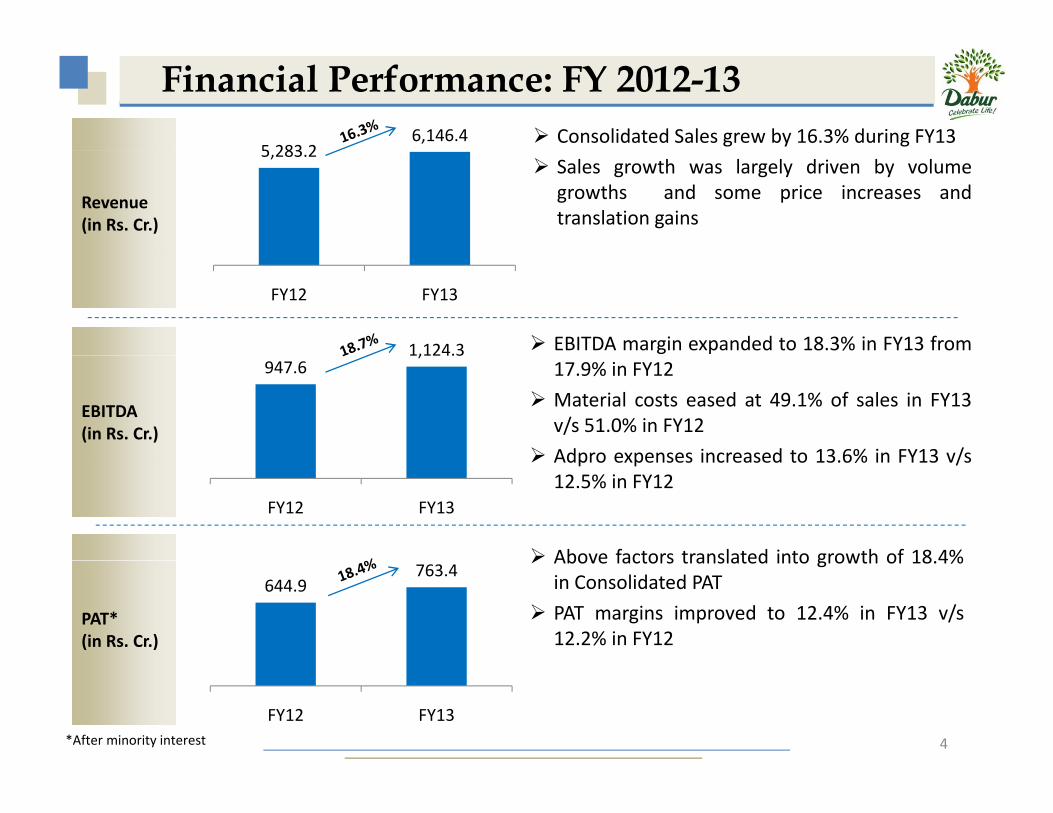
Financial Performance: FY 2012-13Consolidated Sales grew by 16.3% during FY13
5,283.2
100020003000400050006000
Sales growth was largely driven by volumegrowths and some price increases andtranslation gains
Revenue (in Rs. Cr.)
0
FY12 FY13
1,124.31200EBITDA margin expanded to 18.3% in FY13 from
947.61,124.3
200
400
600
800
1000
1200
EBITDA (in Rs. Cr.)
17.9% in FY12
Material costs eased at 49.1% of sales in FY13v/s 51.0% in FY12
Adpro expenses increased to 13 6% in FY13 v/s
1000
0
200
FY12 FY13
Adpro expenses increased to 13.6% in FY13 v/s12.5% in FY12
Above factors translated into growth of 18 4%644.9
763.4
200
400
600
800
000
PAT* (in Rs. Cr.)
Above factors translated into growth of 18.4%in Consolidated PAT
PAT margins improved to 12.4% in FY13 v/s12.2% in FY12
0
200
FY12 FY13
4*After minority interest
Business Overview – Q4 FY13Sales Contribution (Q4 FY13)* Domestic and International Sales Growth Rates( )
30% 15.1%11 6%15.0%
20.0%
Q4FY13
70%
11.6%
0.0%
5.0%
10.0%
15.0%
Note: International includes Namaste and HobiDomestic InternationalDomestic FMCG International
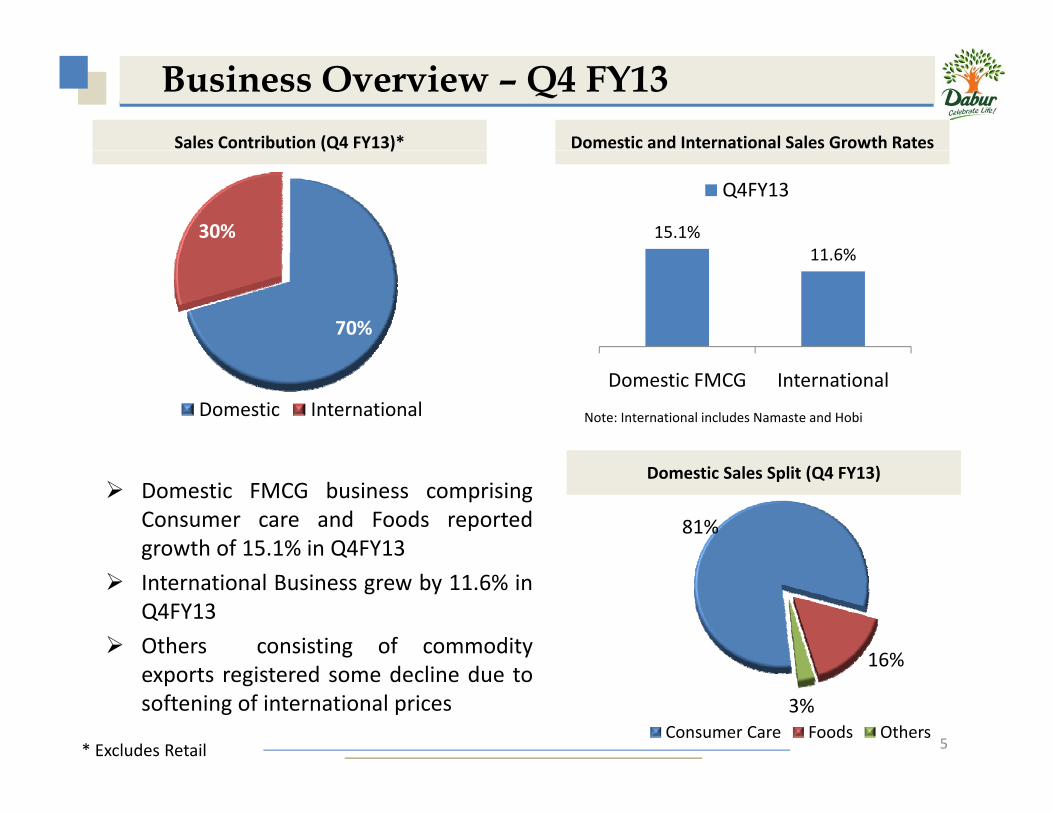
Domestic FMCG business comprisingConsumer care and Foods reportedgrowth of 15.1% in Q4FY13
81%
Domestic Sales Split (Q4 FY13)
International Business grew by 11.6% inQ4FY13
Others consisting of commodity16%
exports registered some decline due tosoftening of international prices
5
16%
3%Consumer Care Foods Others
* Excludes Retail

Business Overview – FY 2012-13Sales Contribution (FY13)* Domestic and International Sales Growth Rates( )
31% 15.0%17.1%
15.0%
20.0%
FY13
69%0.0%
5.0%
10.0%
15.0%
Note: International includes Namaste and HobiDomestic InternationalDomestic FMCG International
Domestic FMCG business grew by15.0% in FY13
79%
Domestic Sales Split (FY13)
International Business grew by 17.1%in FY13
16%
6
5%Consumer Care Foods Others* Excludes Retail

Domestic FMCG Growth Trend
Domestic FMCG Sales Value and Volume Growth Rate (YoY) ‐ %
20 0%
Value Gr. (%) Volume Gr. %
15.6% 15.3% 14.3% 15.1%
11.6%
9% 9 5%
12.3%12.0%
14.0%
16.0%
18.0%
20.0%
9% 9.5%
2.0%
4.0%
6.0%
8.0%
10.0%
0.0%
Q1FY13 Q2FY13 Q3FY13 Q4FY13
Domestic FMCG business continues on a steady growth trajectory driven by acombination of volumes and price increases
Strong volume growth of 12.3% registered during Q4 FY13 ‐ highest in the lastStrong volume growth of 12.3% registered during Q4 FY13 highest in the last11 quarters (Q2FY11 onwards)
7
Consumer Care BusinessConsumer Care Category Growth Rates (%)g y ( )
33.3%
25.3%25 0%30.0%35.0%
Q4FY13 FY13
22.6%
1.3%
13.7%9.6%
12.3% 11.1%
16.2%
3.9%
16.1%
11.7% 10.3%15.4%
0 0%5.0%
10.0%15.0%20.0%25.0%
C t C t ib ti (FY13)
0.0%
Health Supplements
Digestives OTC & Ethicals Hair Care Home Care Oral Care Skin Care
Hi hli htCategory Contribution (FY13)
Health Supplements
21%Oral Care17%
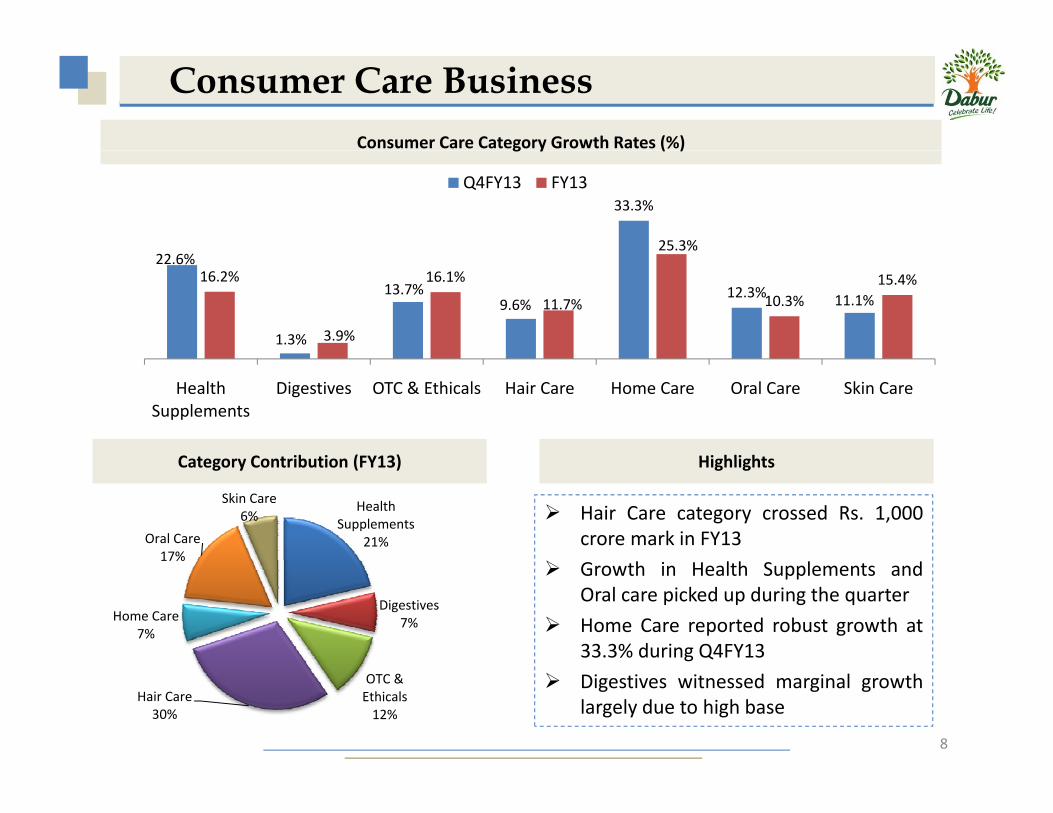
Skin Care6% Hair Care category crossed Rs. 1,000
crore mark in FY13
Highlights
Digestives7%Home Care
7%
17%Growth in Health Supplements andOral care picked up during the quarter
Home Care reported robust growth at33.3% during Q4FY13
8
OTC & Ethicals12%
Hair Care30%
Digestives witnessed marginal growthlargely due to high base
Health Supplements
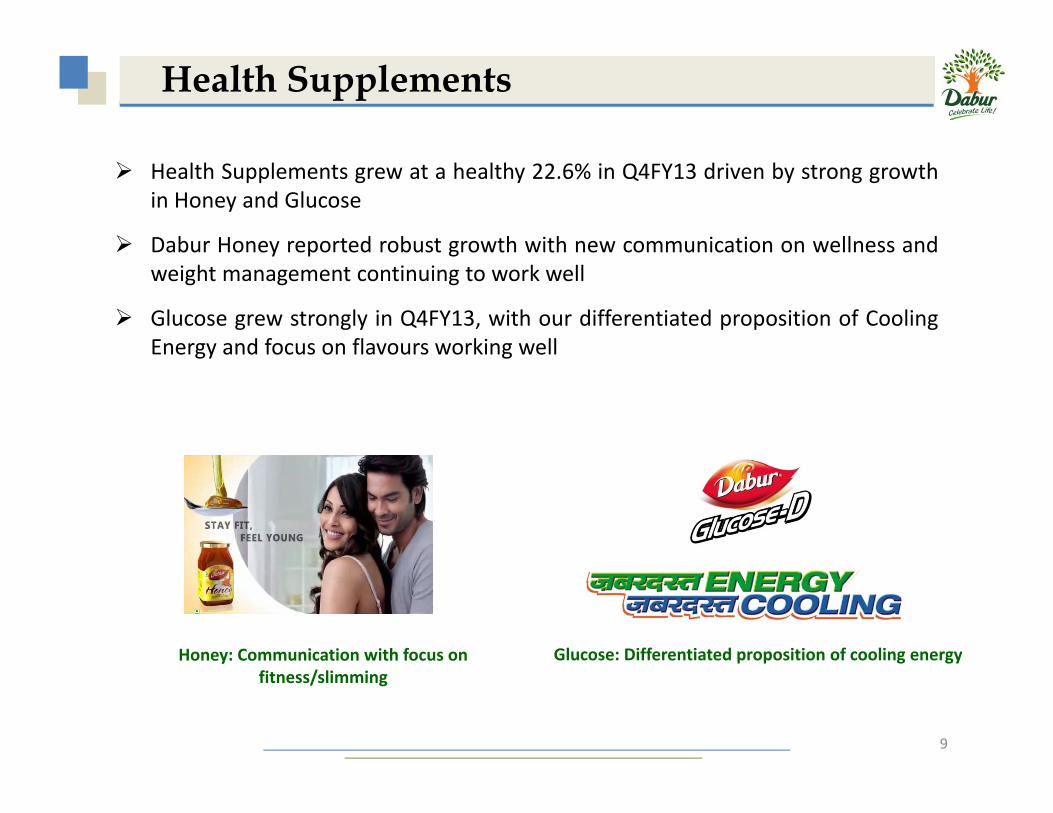
Health Supplements grew at a healthy 22.6% in Q4FY13 driven by strong growthin Honey and Glucose
Dabur Honey reported robust growth with new communication on wellness andy p gweight management continuing to work well
Glucose grew strongly in Q4FY13, with our differentiated proposition of CoolingEnergy and focus on flavours working wellgy g
Honey: Communication with focus on Glucose: Differentiated proposition of cooling energy
9
yfitness/slimming
p p g gy
Di ti b 1 3% i Q4FY13 l l d t b ff t Di ti i th
Digestives
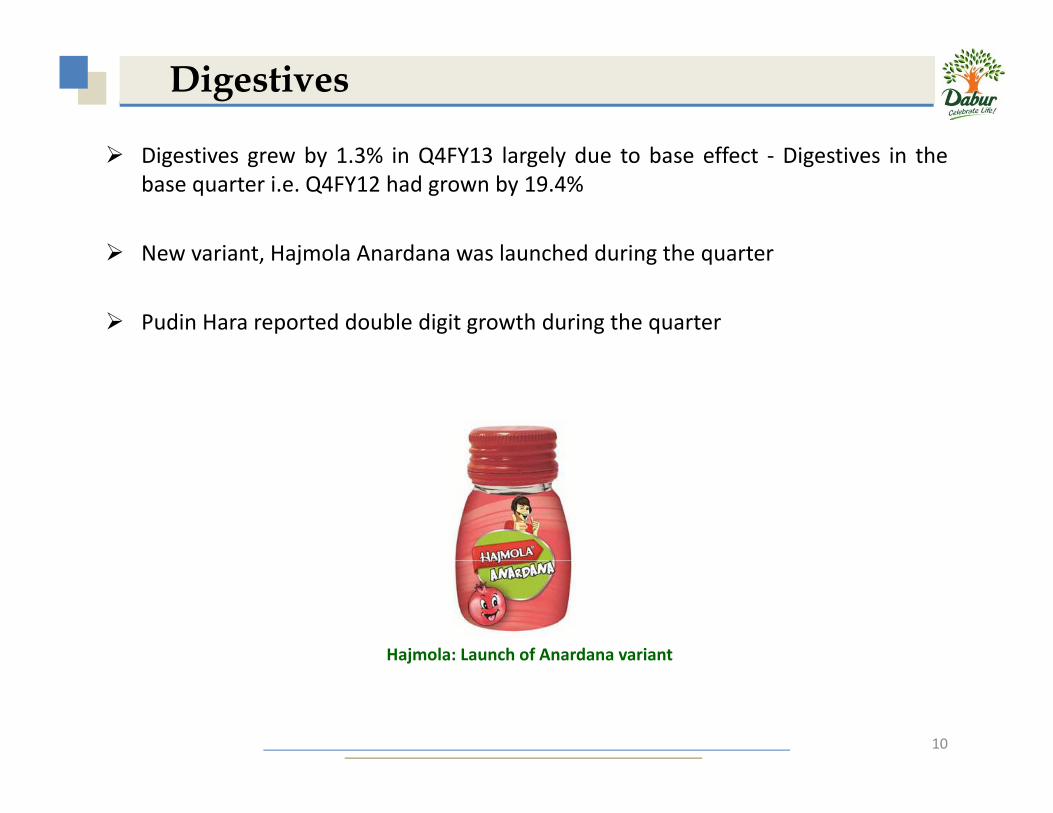
Digestives grew by 1.3% in Q4FY13 largely due to base effect ‐ Digestives in thebase quarter i.e. Q4FY12 had grown by 19.4%
New variant Hajmola Anardana was launched during the quarterNew variant, Hajmola Anardana was launched during the quarter
Pudin Hara reported double digit growth during the quarter
Hajmola: Launch of Anardana variant
10
j
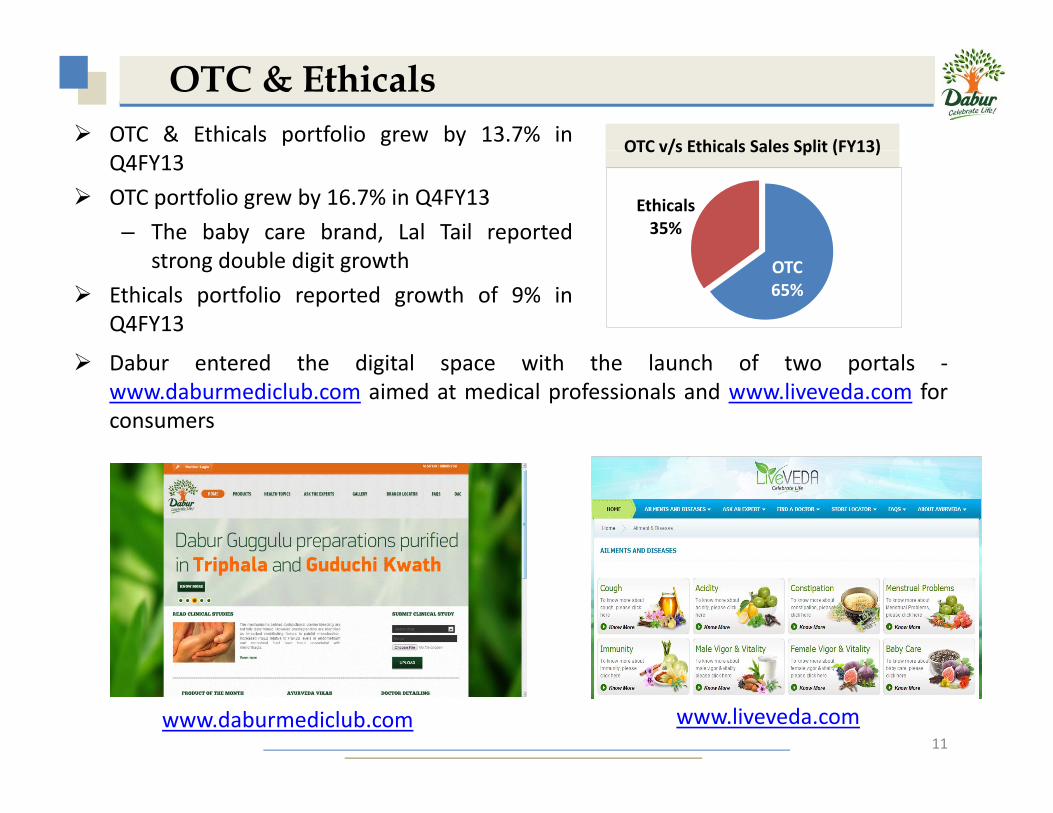
OTC & Ethicals portfolio grew by 13.7% in
OTC & EthicalsOTC v/s Ethicals Sales Split (FY13)
Q4FY13
OTC portfolio grew by 16.7% in Q4FY13
– The baby care brand, Lal Tail reportedd bl di i h
OTC v/s Ethicals Sales Split (FY13)
Ethicals35%
strong double digit growth
Ethicals portfolio reported growth of 9% inQ4FY13
OTC65%
D b d h di i l i h h l h f lDabur entered the digital space with the launch of two portals ‐www.daburmediclub.com aimed at medical professionals and www.liveveda.com forconsumers
11www.daburmediclub.com www.liveveda.com

Hair Care category crossed the Rs. 1,000 crore mark in FY13. During the quarter, it grewb 9 6%
Hair Care
by 9.6%
Hair Oils grew by 7% in Q4FY13 and maintained market shares
Perfumed Hair Oils performed well growing by 13% driven by double digit volumep g g y y ggrowth and good performance in Dabur Amla Hair Oil.
Coconut based oils were under pressure on account of high price differential betweenour offerings and competing products consequent to decline in coconut prices
Shampoos grew at a robust 29.4% in Q4FY13 post re‐stage of the brand as VatikaPremium Naturals range.
12
Amla: New celeb – Kajal Agarwal for South India Vatika Shampoos: Premium Naturals range

H C b 33 3% i Q4FY13
Home Care
Home Care grew by 33.3% in Q4FY13
Odonil, the biggest brand in Home Care grew strongly in Q4FY13. Odonil Gel, which wasinitially launched in South in Q3FY13 has now been rolled out nationally
Odomos grew at a robust pace and witnessed gains in market share
Sanifresh has now become the second biggest brand in the Toilet Cleaners category onthe back of strong growth and gains in market sharesg g g
Odonil Room Freshening Gels: Rolled out nationally
13

Skin Care
Skin Care grew by 11.1% in Q4FY13 and 15.4% in FY13
Fem portfolio grew by 11.6% in Q4FY13
– Fem Bleaches brand crossed the Rs. 1 billion mark in FY13.
– Fem Liquid Handwash re‐launched on natural skin care platform
Gulabari reported good growth in Q4FY13 driven by new variants and focusedactivations and promotions.p
14
Fem: Liquid soap packaging change Fem: Launch of Turmeric Herbal bleach in Q4
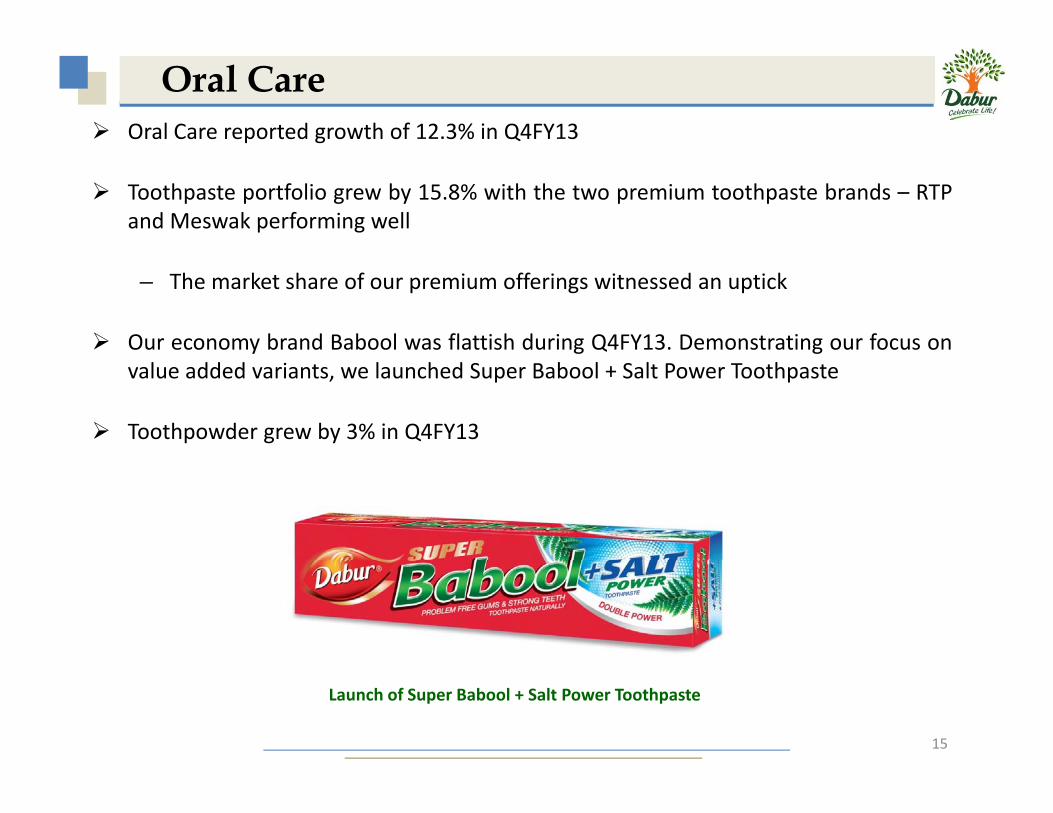
Oral Care reported growth of 12.3% in Q4FY13
Oral Care
Toothpaste portfolio grew by 15.8% with the two premium toothpaste brands – RTPand Meswak performing well
– The market share of our premium offerings witnessed an uptick
Our economy brand Babool was flattish during Q4FY13. Demonstrating our focus onvalue added variants, we launched Super Babool + Salt Power Toothpaste
Toothpowder grew by 3% in Q4FY13
15
Launch of Super Babool + Salt Power Toothpaste

Foods grew by 22.6% in Q4FY13 driven by strong volume growth
Foodsg y y g g
– Both Real and Real Activ reported strong growth
– Ethnic flavour – Kokam launched under Real Burrst in select states
– Culinary portfolio was steady in Q4FY13y p y
– New variants and good demand driving strong growth in the category
Launch of Ethnic Flavour – Kokamunder Real Burrst
Real Activ: Launch of Banana Strawberry and Green Apple Punch variants
16
Project Double – Rural Coverage Enhancement
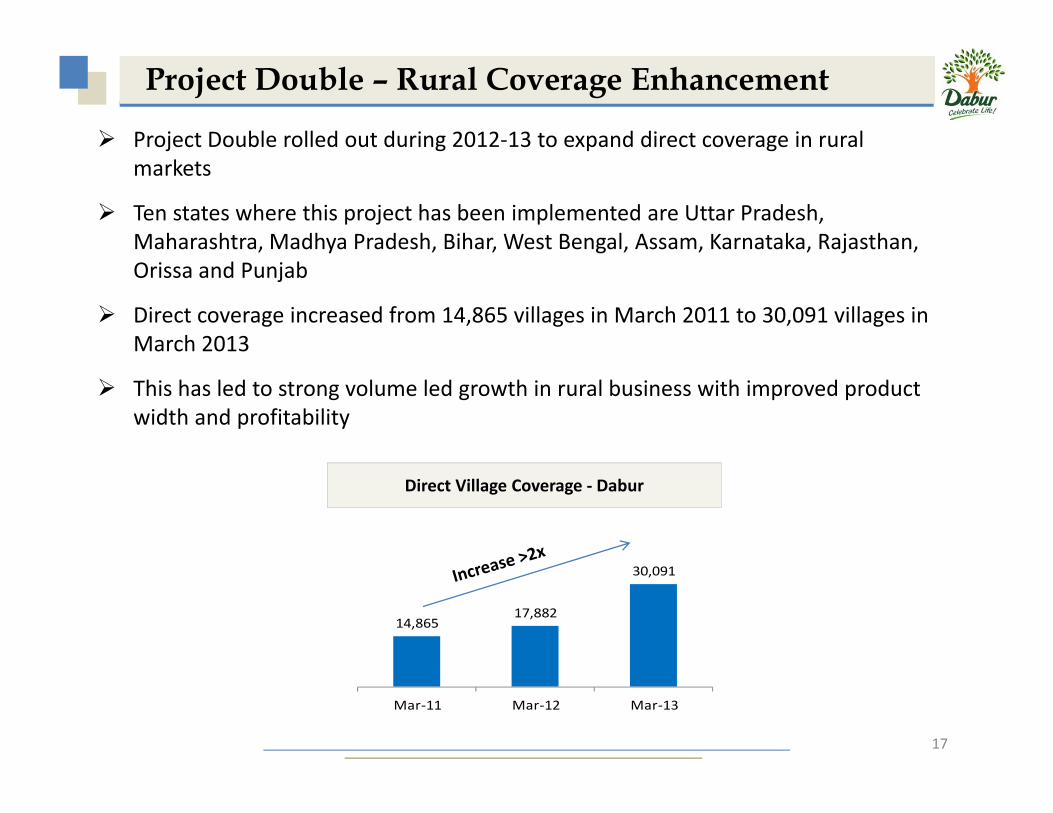
Project Double rolled out during 2012‐13 to expand direct coverage in rural j g p gmarkets
Ten states where this project has been implemented are Uttar Pradesh, Maharashtra, Madhya Pradesh, Bihar, West Bengal, Assam, Karnataka, Rajasthan, y g jOrissa and Punjab
Direct coverage increased from 14,865 villages in March 2011 to 30,091 villages in March 2013
This has led to strong volume led growth in rural business with improved product width and profitability
Direct Village Coverage ‐ Dabur
14,86517,882
30,091
1 0 , 0 0 0
1 5 , 0 0 0
2 0 , 0 0 0
2 5 , 0 0 0
3 0 , 0 0 0
3 5 , 0 0 0
17
0
5 , 0 0 0
Mar‐11 Mar‐12 Mar‐13
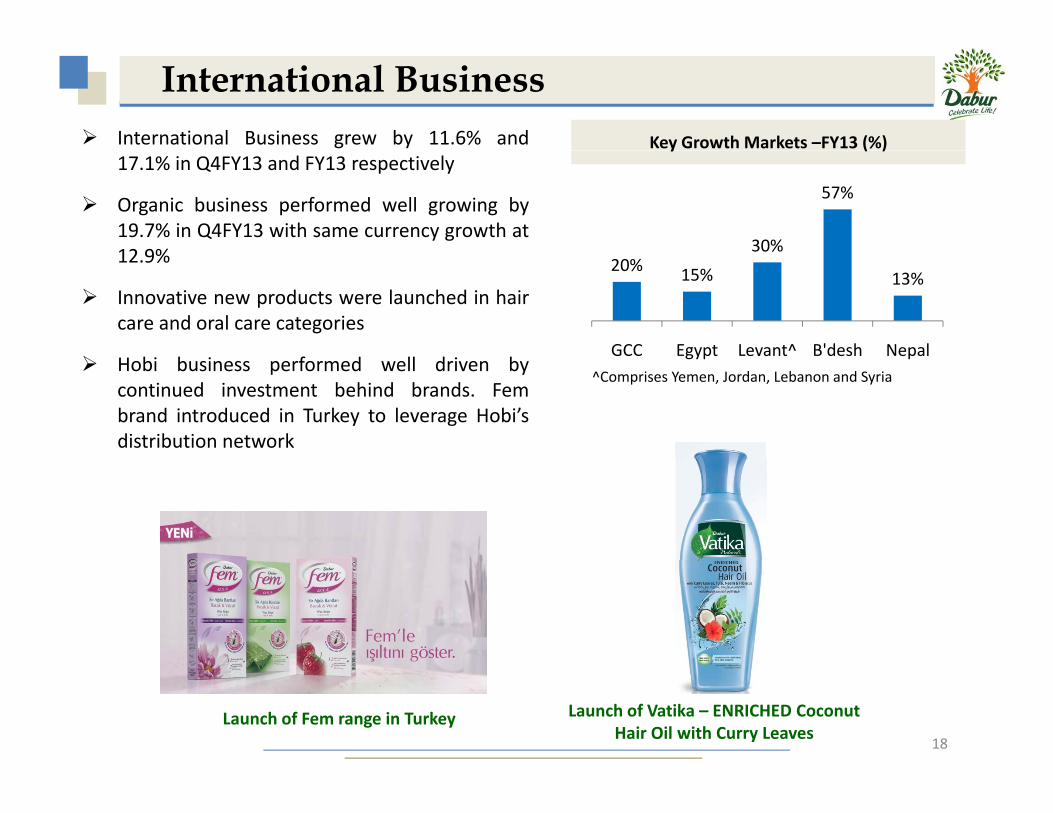
International Business grew by 11.6% and
International BusinessKey Growth Markets –FY13 (%)
30%
57%
40%50%60%70%
17.1% in Q4FY13 and FY13 respectively
Organic business performed well growing by19.7% in Q4FY13 with same currency growth at12 9%
y ( )
20% 15% 13%
0%10%20%30%
GCC Egypt Levant^ B'desh Nepal
12.9%
Innovative new products were launched in haircare and oral care categories
GCC Egypt Levant B desh NepalHobi business performed well driven bycontinued investment behind brands. Fembrand introduced in Turkey to leverage Hobi’sdistribution network
^Comprises Yemen, Jordan, Lebanon and Syria
18
Launch of Vatika – ENRICHED Coconut Hair Oil with Curry Leaves
Launch of Fem range in Turkey
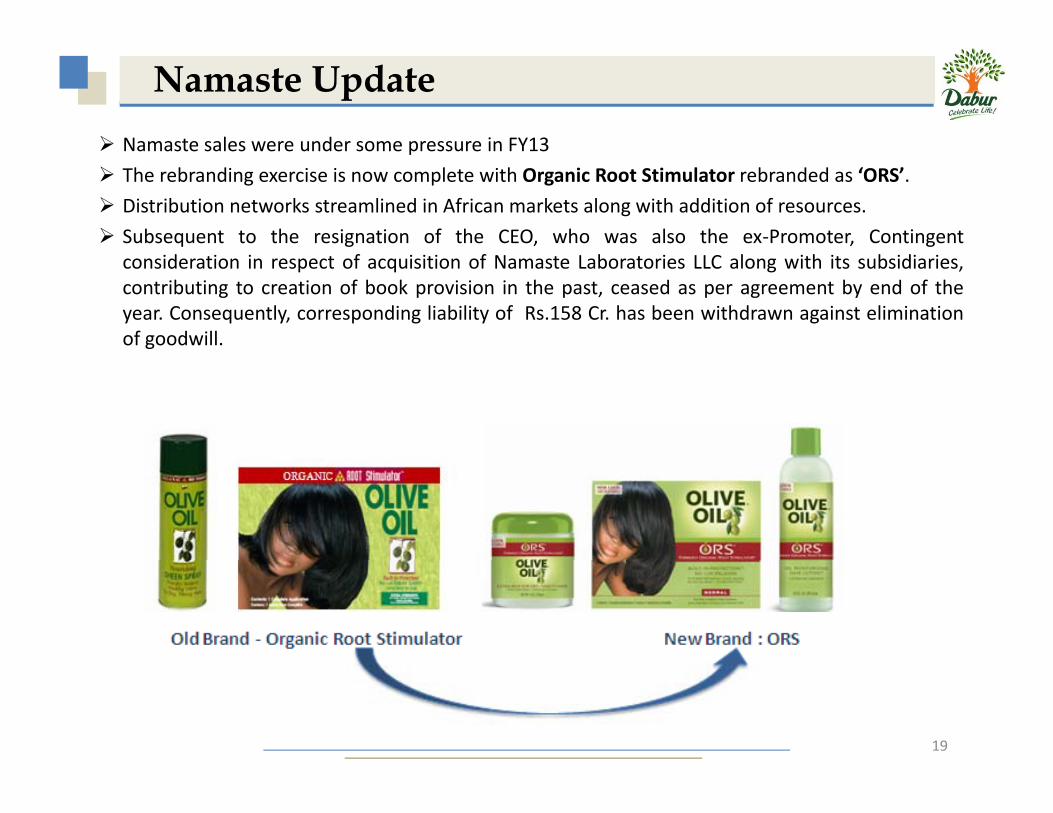
Namaste UpdateNamaste sales were under some pressure in FY13Namaste sales were under some pressure in FY13
The rebranding exercise is now complete with Organic Root Stimulator rebranded as ‘ORS’.
Distribution networks streamlined in African markets along with addition of resources.
Subsequent to the resignation of the CEO, who was also the ex‐Promoter, Contingentconsideration in respect of acquisition of Namaste Laboratories LLC along with its subsidiaries,contributing to creation of book provision in the past, ceased as per agreement by end of theyear. Consequently, corresponding liability of Rs.158 Cr. has been withdrawn against eliminationof goodwill.
19
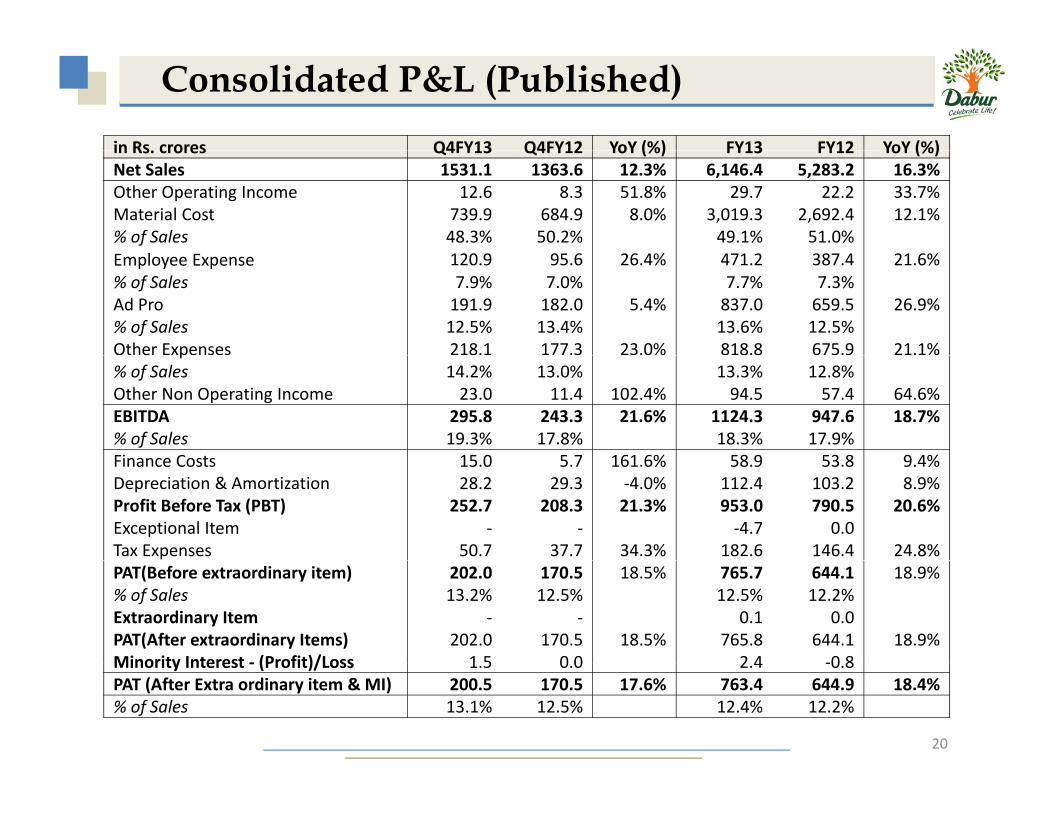
Consolidated P&L (Published)in Rs crores Q4FY13 Q4FY12 YoY (%) FY13 FY12 YoY (%)in Rs. crores Q4FY13 Q4FY12 YoY (%) FY13 FY12 YoY (%)Net Sales 1531.1 1363.6 12.3% 6,146.4 5,283.2 16.3%Other Operating Income 12.6 8.3 51.8% 29.7 22.2 33.7%Material Cost 739.9 684.9 8.0% 3,019.3 2,692.4 12.1%% of Sales 48.3% 50.2% 49.1% 51.0%
lEmployee Expense 120.9 95.6 26.4% 471.2 387.4 21.6%% of Sales 7.9% 7.0% 7.7% 7.3%Ad Pro 191.9 182.0 5.4% 837.0 659.5 26.9%% of Sales 12.5% 13.4% 13.6% 12.5%Other Expenses 218.1 177.3 23.0% 818.8 675.9 21.1%p% of Sales 14.2% 13.0% 13.3% 12.8%Other Non Operating Income 23.0 11.4 102.4% 94.5 57.4 64.6%EBITDA 295.8 243.3 21.6% 1124.3 947.6 18.7%% of Sales 19.3% 17.8% 18.3% 17.9%Finance Costs 15 0 5 7 161 6% 58 9 53 8 9 4%Finance Costs 15.0 5.7 161.6% 58.9 53.8 9.4%Depreciation & Amortization 28.2 29.3 ‐4.0% 112.4 103.2 8.9%Profit Before Tax (PBT) 252.7 208.3 21.3% 953.0 790.5 20.6%Exceptional Item ‐ ‐ ‐4.7 0.0Tax Expenses 50.7 37.7 34.3% 182.6 146.4 24.8%PAT(Before extraordinary item) 202.0 170.5 18.5% 765.7 644.1 18.9%% of Sales 13.2% 12.5% 12.5% 12.2%Extraordinary Item ‐ ‐ 0.1 0.0PAT(After extraordinary Items) 202.0 170.5 18.5% 765.8 644.1 18.9%Minority Interest ‐ (Profit)/Loss 1 5 0 0 2 4 ‐0 8
20
Minority Interest ‐ (Profit)/Loss 1.5 0.0 2.4 ‐0.8PAT (After Extra ordinary item & MI) 200.5 170.5 17.6% 763.4 644.9 18.4%% of Sales 13.1% 12.5% 12.4% 12.2%
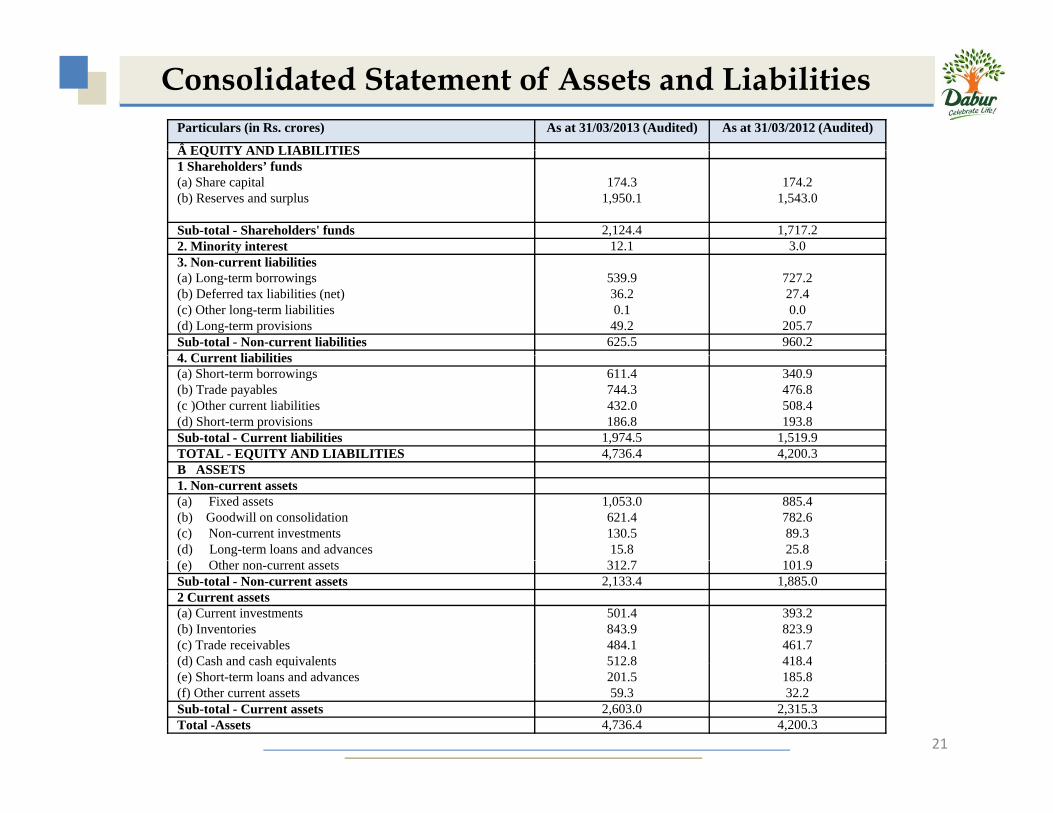
Consolidated Statement of Assets and LiabilitiesParticulars (in Rs. crores) As at 31/03/2013 (Audited) As at 31/03/2012 (Audited)
 EQUITY AND LIABILITIES EQUITY AND LIABILITIES1 Shareholders’ funds(a) Share capital 174.3 174.2(b) Reserves and surplus 1,950.1 1,543.0
Sub-total - Shareholders' funds 2,124.4 1,717.22. Minority interest 12.1 3.0y3. Non-current liabilities(a) Long-term borrowings 539.9 727.2(b) Deferred tax liabilities (net) 36.2 27.4(c) Other long-term liabilities 0.1 0.0(d) Long-term provisions 49.2 205.7Sub-total - Non-current liabilities 625.5 960.24 C t li biliti4. Current liabilities(a) Short-term borrowings 611.4 340.9(b) Trade payables 744.3 476.8(c )Other current liabilities 432.0 508.4(d) Short-term provisions 186.8 193.8Sub-total - Current liabilities 1,974.5 1,519.9TOTAL - EQUITY AND LIABILITIES 4,736.4 4,200.3O QU N S , ,B ASSETS1. Non-current assets(a) Fixed assets 1,053.0 885.4(b) Goodwill on consolidation 621.4 782.6(c) Non-current investments 130.5 89.3(d) Long-term loans and advances 15.8 25.8( ) O h 312 101 9(e) Other non-current assets 312.7 101.9Sub-total - Non-current assets 2,133.4 1,885.02 Current assets(a) Current investments 501.4 393.2(b) Inventories 843.9 823.9(c) Trade receivables 484.1 461.7(d) Cash and cash equivalents 512 8 418 4
21
(d) Cash and cash equivalents 512.8 418.4(e) Short-term loans and advances 201.5 185.8(f) Other current assets 59.3 32.2Sub-total - Current assets 2,603.0 2,315.3Total -Assets 4,736.4 4,200.3
Disclaimer
Some of the statements made in this presentation contain forward looking information thatSome of the statements made in this presentation contain forward looking information thatinvolve a number of risks and uncertainties. Such statements are based on a number ofassumptions, estimates, projections or plans that are inherently subject to significant risks, aswell as uncertainties and contingencies that are subject to change. Actual results can differmaterially from those anticipated in the Company´s forward‐looking statements as a result of a
i t f f t i l di th t f th f ti t ti i th C ´ l dvariety of factors, including those set forth from time to time in the Company´s press releases andreports and those set forth from time to time in the Company´s analyst calls and discussions. Wedo not assume any obligation to update the forward‐looking statements contained in thispresentation.
No part of this presentation shall form the basis of or may be relied upon in connection with anycontract or commitment. This presentation is being presented solely for your information and issubject to change without notice.
22
Thank You
23
Related Documents