Dabur India Limited Investor Communication Quarter and Half Year ended 30 th September 2018 1

Welcome message from author
This document is posted to help you gain knowledge. Please leave a comment to let me know what you think about it! Share it to your friends and learn new things together.
Transcript

Dabur India Limited
Investor Communication
Quarter and Half Year ended 30th September 2018
1

2
Contents
1. Q2 FY19 – Overview
2. Category Highlights
3. Business Initiatives
4. Product Launches
5. International Business – Q2 FY19 Performance
6. Interim Dividend
7. Profit & Loss Statements and Balance Sheets
3
Q2 FY19 – Overview
1 Consolidated revenue grew by 8.5% to INR 2,125 crore
2 Growth in Domestic FMCG was 8.6% backed by volume growth of 8.1%
3 International Business reported growth of 8.9%
4
5
PAT increased by 8.4% in Standalone and 4.1% in Consolidated
Interim Dividend of Rs.1.25 per share approved by Board
4
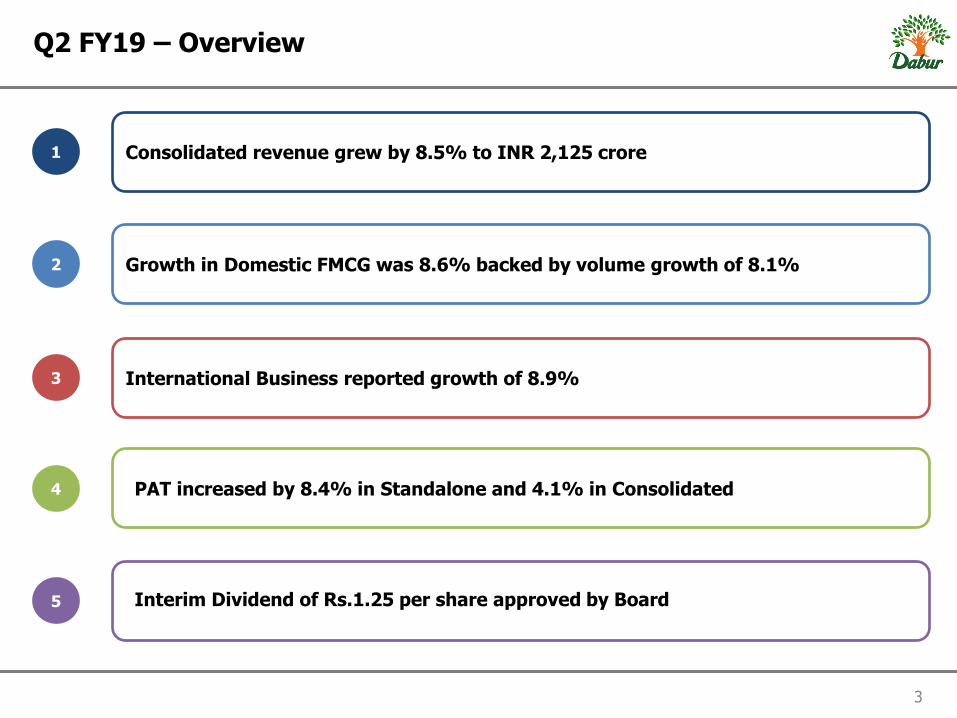
Q2 FY19 – Consolidated Financials
• Material cost increased from 49.9% in Q2 FY18 to 50.6% in
Q2 FY19
• Media expenses were slightly lower due to shifting of festive
season
• Consolidated Operating Margin at 21.2% as compared to
21.4% in Q2FY18
420
451
Q2 FY18 Q2 FY19
• Consolidated revenue grew by 8.5%
• Domestic business revenue grew by 8.6% led by volume
growth of 8.1%
• International Business reported growth of 8.9% with
constand currency growth of 7%
1,959
2,125
Q2 FY18 Q2 FY19
Revenue
Operating Profit
PAT
7.4%
4.1% • Consolidated Profit After Tax (PAT) grew by 4.1%
• Standalone PAT increased by 8.4%
• Profitability in International Business impacted by adverse
currency movements and higher BTL expenditure
362
377
Q2 FY18 Q2 FY19
8.5%

0.5%
2.4%
(6.6%)
0.7%
(5.0%)
9.8%
17.7%
9.7%
23.7%
8.6%
4.1% 4.5%
(5.2%)
2.4%
(4.4%)
7.2%
13.0%
7.7%
21.0%
8.1%
Q1 FY17 Q2 FY17 Q3 FY17 Q4 FY17 Q1 FY18 Q2 FY18 Q3 FY18 Q4 FY18 Q1 FY19 Q2 FY19
Dabur Value Growth Dabur Volume Growth
5 * Q2FY18 to Q1 FY19 value growth is on GST adjusted basis
Value and Volume Growth Trend for Dabur Domestic FMCG
Domestic FMCG business recorded 8.6% value growth backed by 8.1% volume growth

6
Q2 FY19 – Business Overview
Q2 FY18 Q2 FY19
69.1%
28.7%
2.2%
68.9%
28.5%
2.6%
Domestic International Others
• Contribution of Domestic FMCG increased to 69.1% from 68.9% last year
• International Business contributed 28.7% as compared to 28.5% last year
7 Note: Values in INR crore
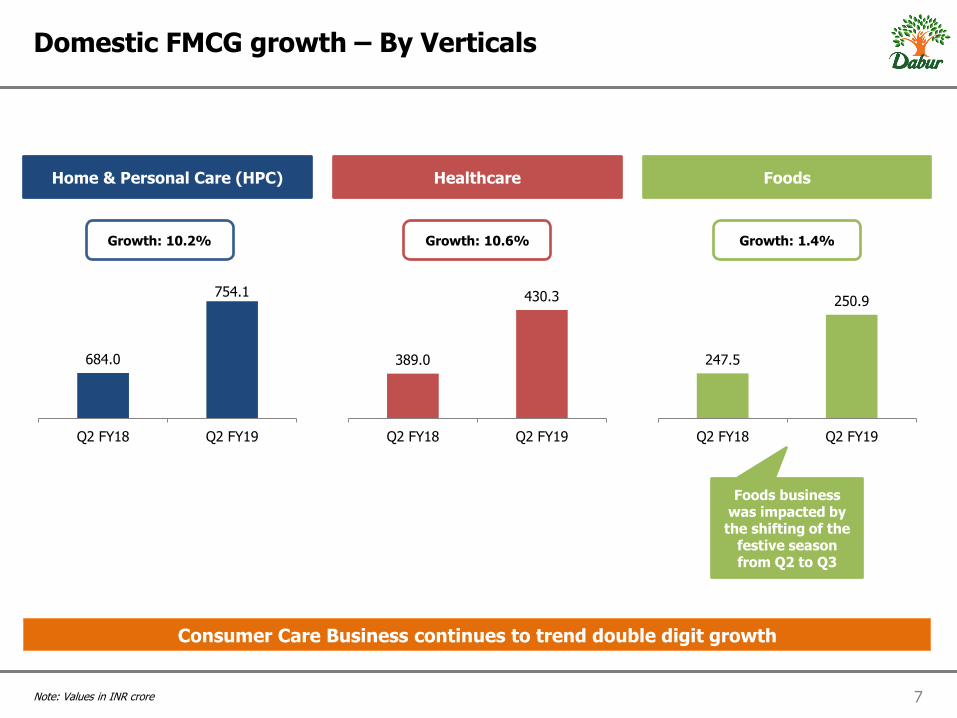
Domestic FMCG growth – By Verticals
Home & Personal Care (HPC) Healthcare Foods
684.0
754.1
Q2 FY18 Q2 FY19
389.0
430.3
Q2 FY18 Q2 FY19
247.5
250.9
Q2 FY18 Q2 FY19
Growth: 10.2% Growth: 10.6% Growth: 1.4%
Foods business was impacted by the shifting of the
festive season from Q2 to Q3
Consumer Care Business continues to trend double digit growth

21.6%
17.7%
5.0% 8.2%
15.5%
5.6%
8.9%
17.5% 20.3%
18.5%
4.9% 8.1%
15.0%
5.5%
8.9%
18.8%
8
Domestic FMCG – Category-wise Sales
Q2 FY18 Q2 FY19
• Share of Hair Care category increased from 20.3% to 21.6%
• Oral Care category decreased share from 18.5% to 17.7%
• Health Supplements’ share increased by ~50 bps
• Food decreased from 18.8% in Q2 FY18 to 17.5% in Q2 FY19
Hair Care Oral Care Skin Care Home Care Health Supplements Digestives Foods OTC & Ethicals

9
Contents
1. Q2 FY19 – Overview
2. Category Highlights
3. Business Initiatives
4. Product Launches
5. International Business – Q2 FY19 Performance
6. Interim Dividend
7. Profit & Loss Statements and Balance Sheets
10
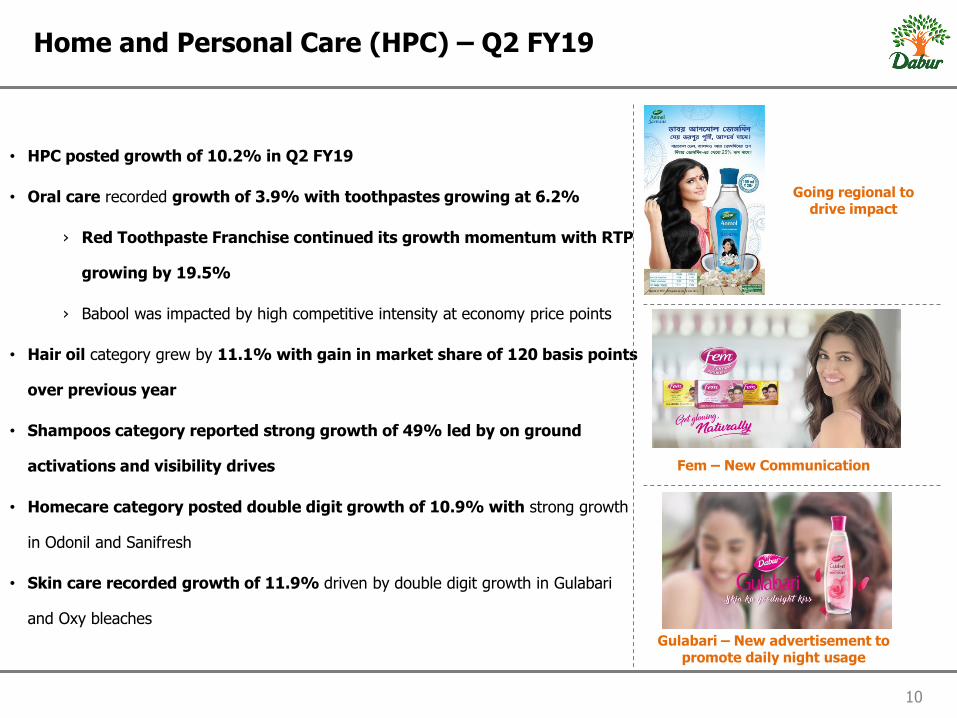
Home and Personal Care (HPC) – Q2 FY19
• HPC posted growth of 10.2% in Q2 FY19
• Oral care recorded growth of 3.9% with toothpastes growing at 6.2%
› Red Toothpaste Franchise continued its growth momentum with RTP
growing by 19.5%
› Babool was impacted by high competitive intensity at economy price points
• Hair oil category grew by 11.1% with gain in market share of 120 basis points
over previous year
• Shampoos category reported strong growth of 49% led by on ground
activations and visibility drives
• Homecare category posted double digit growth of 10.9% with strong growth
in Odonil and Sanifresh
• Skin care recorded growth of 11.9% driven by double digit growth in Gulabari
and Oxy bleaches
Going regional to drive impact
Gulabari – New advertisement to promote daily night usage
Fem – New Communication

11
Healthcare (HC) – Q2 FY19
• Healthcare grew by 10.6% in Q2 FY19
• Health Supplements reported growth of 12.3% as
Chyawanprash and Honey performed well
• Chyawanprash grew by 11.8%
• Dabur Honey grew by 12.8%
• Digestives posted growth of 10.8% on the back of
strong performance of Hajmola tablets and Pudin Hara
• OTC category grew by 10% on the back of good
growth in Lal Tail, Honitus and Shilajit
• Ethicals portfolio reported growth of 6.1% led by
Branded Ethicals and Roaks
Innovative visibility
campaigns to drive sales
Jacqueline Fernandez endorsing Dabur Honey
12
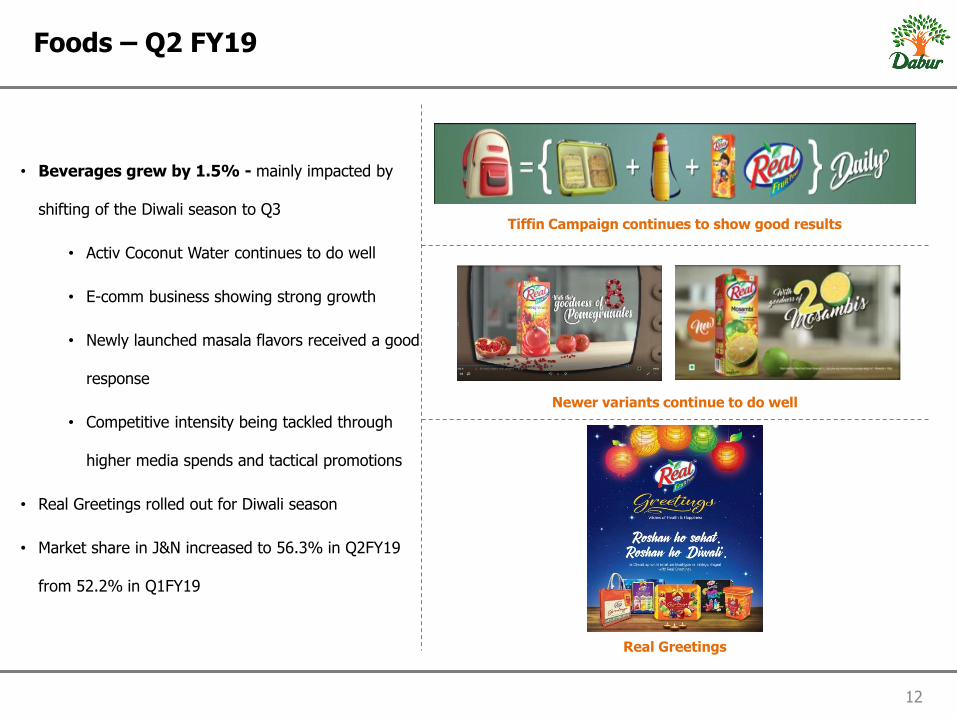
Foods – Q2 FY19
• Beverages grew by 1.5% - mainly impacted by
shifting of the Diwali season to Q3
• Activ Coconut Water continues to do well
• E-comm business showing strong growth
• Newly launched masala flavors received a good
response
• Competitive intensity being tackled through
higher media spends and tactical promotions
• Real Greetings rolled out for Diwali season
• Market share in J&N increased to 56.3% in Q2FY19
from 52.2% in Q1FY19
Tiffin Campaign continues to show good results
Newer variants continue to do well
Real Greetings

13
Direct reach continues to expand
Project Buniyaad achieved its direct reach target of 1 mn outlets and continues to expand distribution
916,869 910,095 912,332
1,022,974
1,085,309
Mar-15 Mar-16 Mar-17 Mar-18 Sep-18
Direct Reach – No. of Outlets
14
Contents
1. Q2 FY19 – Overview
2. Category Highlights
3. Business Initiatives
4. Product Launches
5. International Business – Q2 FY19 Performance
6. Interim Dividend
7. Profit & Loss Statements and Balance Sheets
15
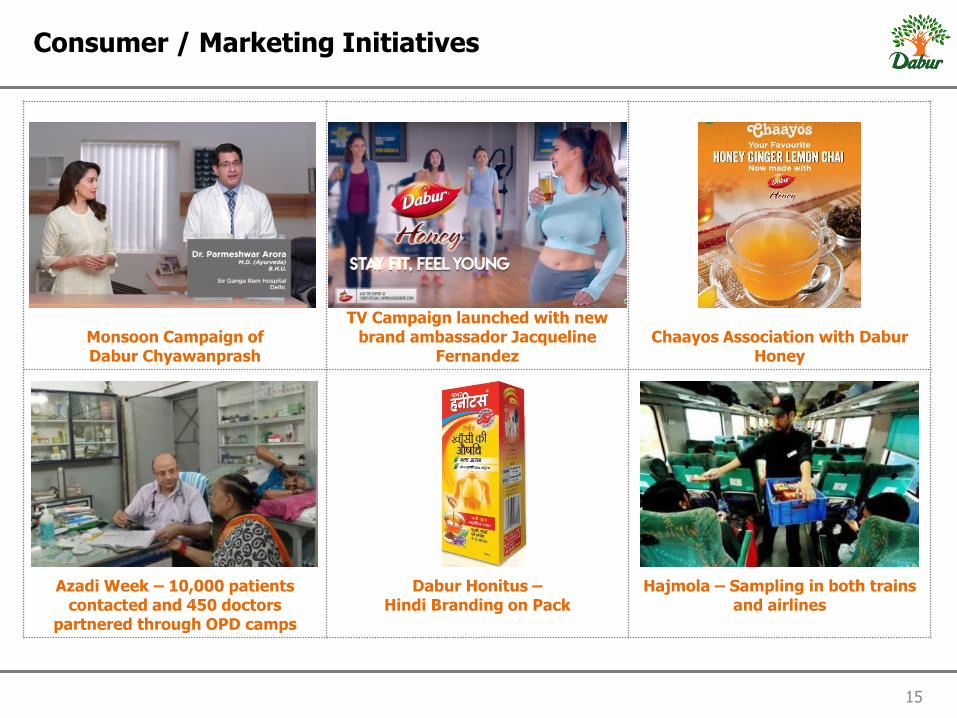
Consumer / Marketing Initiatives
Monsoon Campaign of Dabur Chyawanprash
Dabur Honey – TV Campaign launched with new
brand ambassador Jacqueline Fernandez
Chaayos Association with Dabur Honey
Azadi Week – 10,000 patients contacted and 450 doctors
partnered through OPD camps
Dabur Honitus – Hindi Branding on Pack
Hajmola – Sampling in both trains and airlines
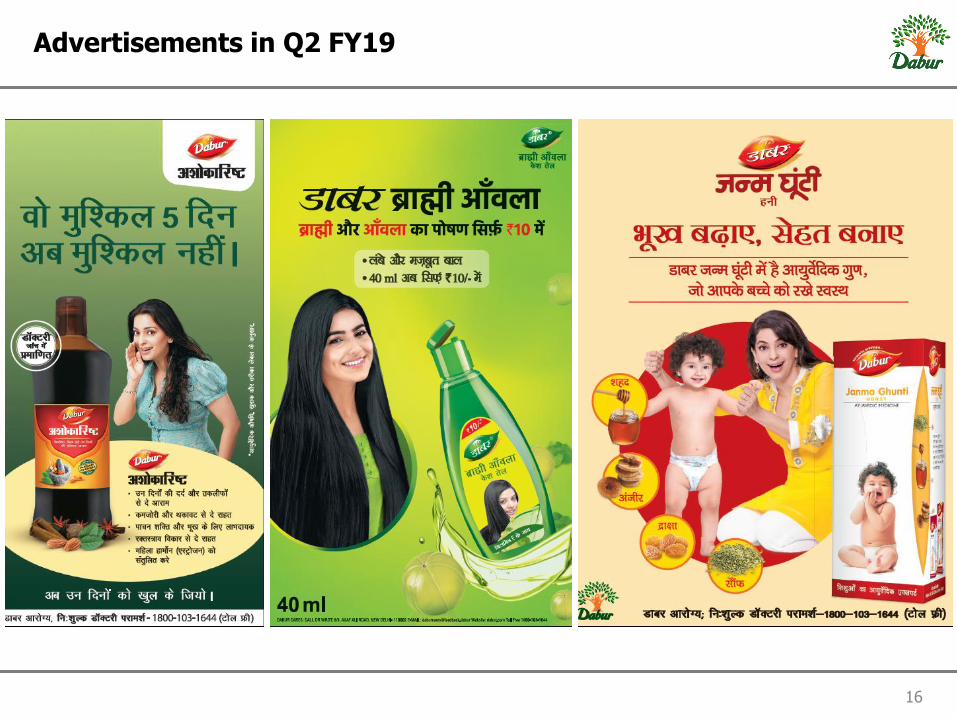
16
Advertisements in Q2 FY19
17
Contents
1. Q2 FY19 – Overview
2. Category Highlights
3. Business Initiatives
4. Product Launches
5. International Business – Q2 FY19 Performance
6. Interim Dividend
7. Profit & Loss Statements and Balance Sheets

18
New Product Launches
Odonil Zipper – New Fragrances Alluring Daffodil and Scintillating Rose
Honey Squeezy – New SKU 225 gm

19
Contents
1. Q2 FY19 – Overview
2. Category Highlights
3. Business Initiatives
4. Product Launches
5. International Business – Q2 FY19 Performance
6. Interim Dividend
7. Profit & Loss Statements and Balance Sheets
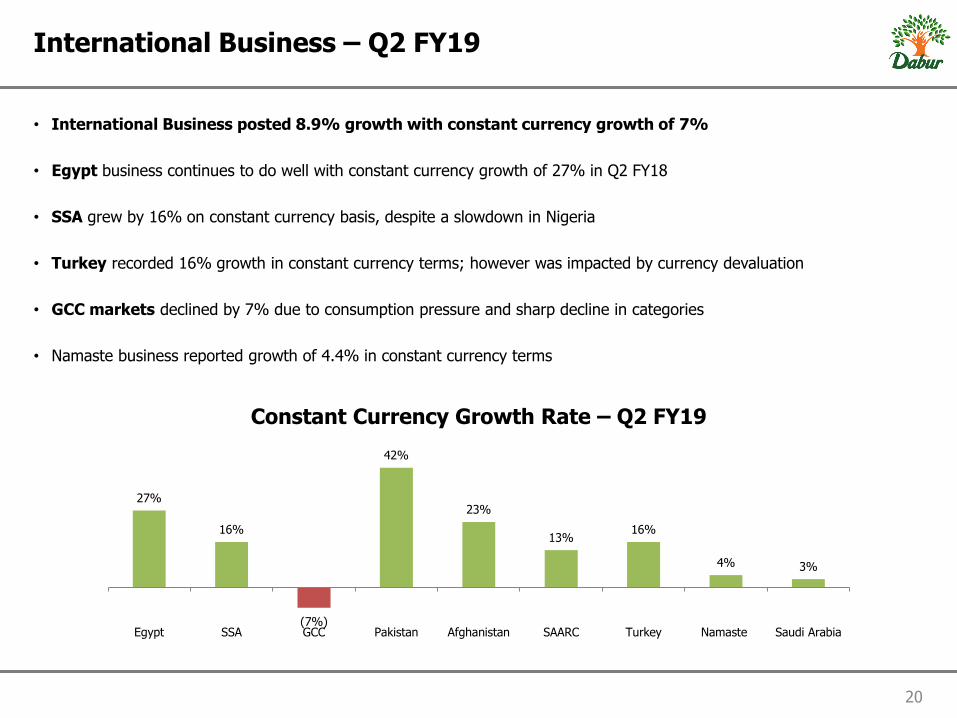
• International Business posted 8.9% growth with constant currency growth of 7%
• Egypt business continues to do well with constant currency growth of 27% in Q2 FY18
• SSA grew by 16% on constant currency basis, despite a slowdown in Nigeria
• Turkey recorded 16% growth in constant currency terms; however was impacted by currency devaluation
• GCC markets declined by 7% due to consumption pressure and sharp decline in categories
• Namaste business reported growth of 4.4% in constant currency terms
27%
16%
(7%)
42%
23%
13% 16%
4% 3%
Egypt SSA GCC Pakistan Afghanistan SAARC Turkey Namaste Saudi Arabia
Constant Currency Growth Rate – Q2 FY19
20
International Business – Q2 FY19

21
Contents
1. Q2 FY19 – Overview
2. Category Highlights
3. Business Initiatives
4. Product Launches
5. International Business – Q2 FY19 Performance
6. Interim Dividend
7. Profit & Loss Statements and Balance Sheets
22
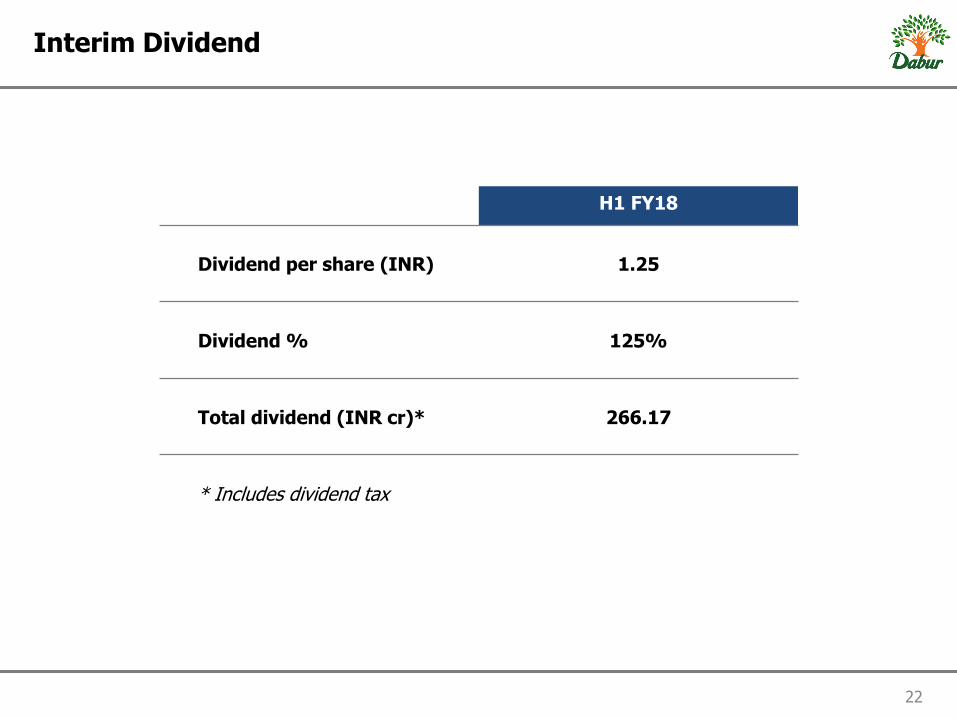
Interim Dividend
H1 FY18
Dividend per share (INR) 1.25
Dividend % 125%
Total dividend (INR cr)* 266.17
* Includes dividend tax

23
Contents
1. Q2 FY19 – Overview
2. Category Highlights
3. Business Initiatives
4. Product Launches
5. International Business – Q2 FY19 Performance
6. Interim Dividend
7. Profit & Loss Statements and Balance Sheets
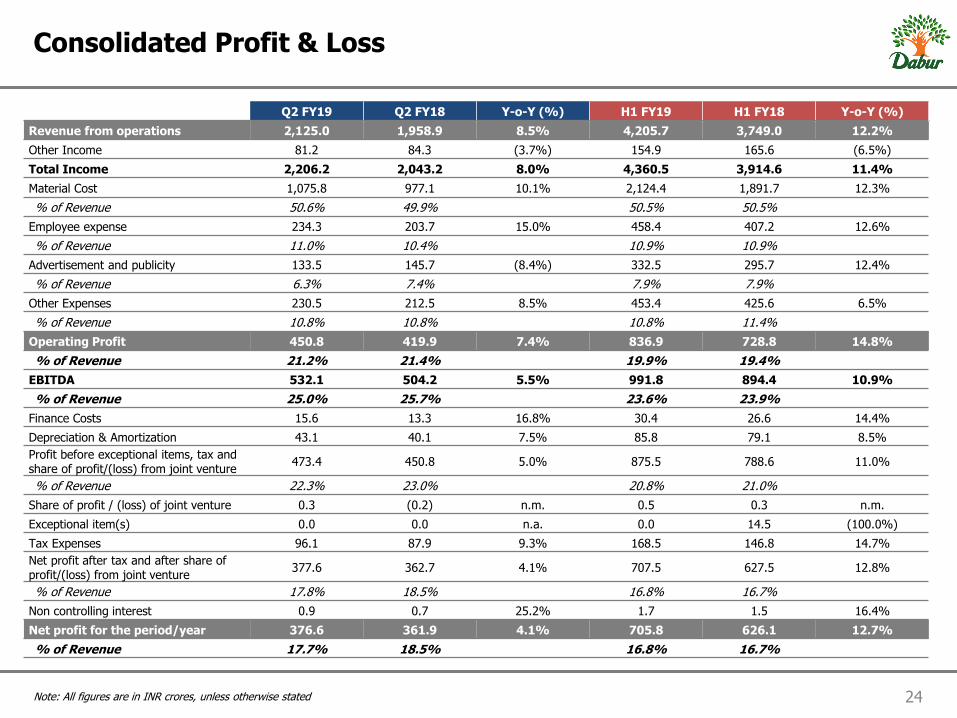
24 Note: All figures are in INR crores, unless otherwise stated
Consolidated Profit & Loss
Q2 FY19 Q2 FY18 Y-o-Y (%) H1 FY19 H1 FY18 Y-o-Y (%)
Revenue from operations 2,125.0 1,958.9 8.5% 4,205.7 3,749.0 12.2%
Other Income 81.2 84.3 (3.7%) 154.9 165.6 (6.5%)
Total Income 2,206.2 2,043.2 8.0% 4,360.5 3,914.6 11.4%
Material Cost 1,075.8 977.1 10.1% 2,124.4 1,891.7 12.3%
% of Revenue 50.6% 49.9% 50.5% 50.5%
Employee expense 234.3 203.7 15.0% 458.4 407.2 12.6%
% of Revenue 11.0% 10.4% 10.9% 10.9%
Advertisement and publicity 133.5 145.7 (8.4%) 332.5 295.7 12.4%
% of Revenue 6.3% 7.4% 7.9% 7.9%
Other Expenses 230.5 212.5 8.5% 453.4 425.6 6.5%
% of Revenue 10.8% 10.8% 10.8% 11.4%
Operating Profit 450.8 419.9 7.4% 836.9 728.8 14.8%
% of Revenue 21.2% 21.4% 19.9% 19.4%
EBITDA 532.1 504.2 5.5% 991.8 894.4 10.9%
% of Revenue 25.0% 25.7% 23.6% 23.9%
Finance Costs 15.6 13.3 16.8% 30.4 26.6 14.4%
Depreciation & Amortization 43.1 40.1 7.5% 85.8 79.1 8.5%
Profit before exceptional items, tax and share of profit/(loss) from joint venture
473.4 450.8 5.0% 875.5 788.6 11.0%
% of Revenue 22.3% 23.0% 20.8% 21.0%
Share of profit / (loss) of joint venture 0.3 (0.2) n.m. 0.5 0.3 n.m.
Exceptional item(s) 0.0 0.0 n.a. 0.0 14.5 (100.0%)
Tax Expenses 96.1 87.9 9.3% 168.5 146.8 14.7%
Net profit after tax and after share of profit/(loss) from joint venture
377.6 362.7 4.1% 707.5 627.5 12.8%
% of Revenue 17.8% 18.5% 16.8% 16.7%
Non controlling interest 0.9 0.7 25.2% 1.7 1.5 16.4%
Net profit for the period/year 376.6 361.9 4.1% 705.8 626.1 12.7%
% of Revenue 17.7% 18.5% 16.8% 16.7%

25 Note: All figures are in INR crores, unless otherwise stated
Standalone Profit & Loss
Q2 FY19 Q2 FY18 Y-o-Y (%) H1 FY19 H1 FY18 Y-o-Y (%)
Revenue from operations 1,537.2 1,416.4 8.5% 3,010.3 2,650.1 13.6%
Other Income 75.7 76.2 (0.7%) 144.3 151.8 (4.9%)
Total Income 1,612.9 1,492.6 8.1% 3,154.6 2,801.9 12.6%
Material Cost 790.7 737.8 7.2% 1,573.1 1,411.3 11.5%
% of Revenue 51.4% 52.1% 52.3% 53.3%
Employee expense 143.3 117.3 22.2% 281.3 236.5 18.9%
% of Revenue 9.3% 8.3% 9.3% 8.9%
Advertisement and publicity 111.2 114.7 (3.0%) 266.9 233.4 14.3%
% of Revenue 7.2% 8.1% 8.9% 8.8%
Other Expenses 140.5 127.8 10.0% 281.1 260.5 7.9%
% of Revenue 9.1% 9.0% 9.3% 9.8%
Operating Profit 351.5 318.8 10.3% 608.0 508.4 19.6%
% of Revenue 22.9% 22.5% 20.2% 19.2%
EBITDA 427.2 395.0 8.1% 752.3 660.2 13.9%
% of Revenue 27.8% 27.9% 25.0% 24.9%
Finance Costs 8.1 5.0 62.3% 13.9 10.8 29.6%
Depreciation & Amortization 26.2 25.5 2.6% 52.2 50.0 4.4%
Profit before exceptional items, tax and share of profit/(loss) from joint venture
392.9 364.5 7.8% 686.1 599.4 14.5%
% of Revenue 25.6% 25.7% 22.8% 22.6%
Exceptional item(s) 0.0 0.0 n.a. 0.0 14.5 (100.0%)
Tax Expenses 85.7 81.1 5.6% 148.3 131.9 12.4%
Net profit for the period/year 307.3 283.4 8.4% 537.8 453.0 18.7%
% of Revenue 20.0% 20.0% 17.9% 17.1%
26 Note: All figures are in INR crores, unless otherwise stated
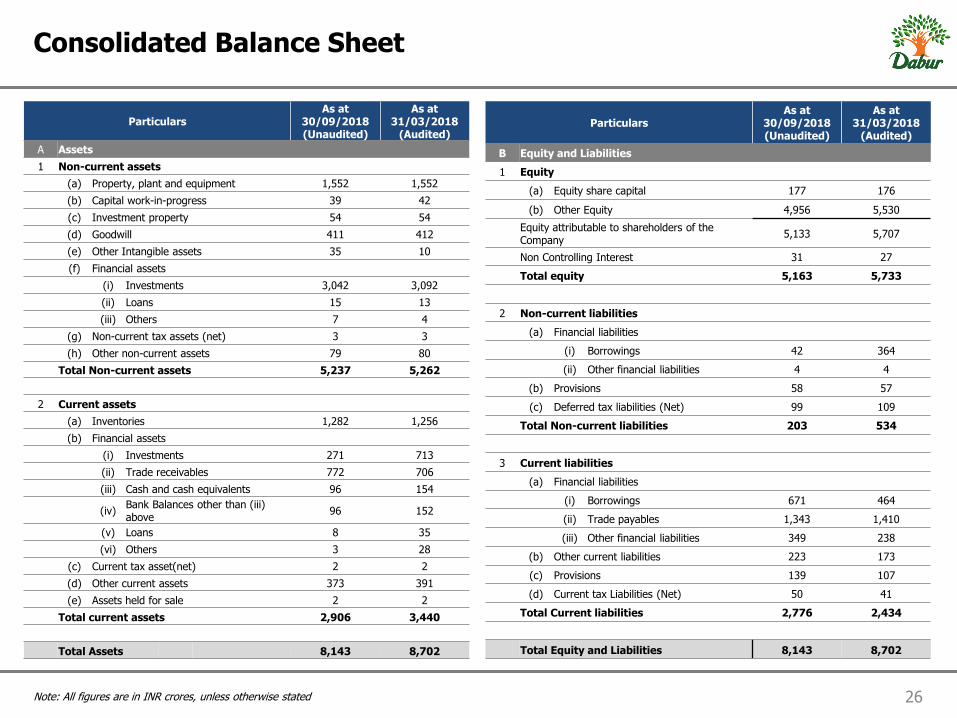
Consolidated Balance Sheet
Particulars
As at 30/09/2018 (Unaudited)
As at 31/03/2018
(Audited)
A Assets
1 Non-current assets
(a) Property, plant and equipment 1,552 1,552
(b) Capital work-in-progress 39 42
(c) Investment property 54 54
(d) Goodwill 411 412
(e) Other Intangible assets 35 10
(f) Financial assets
(i) Investments 3,042 3,092
(ii) Loans 15 13
(iii) Others 7 4
(g) Non-current tax assets (net) 3 3
(h) Other non-current assets 79 80
Total Non-current assets 5,237 5,262
2 Current assets
(a) Inventories 1,282 1,256
(b) Financial assets
(i) Investments 271 713
(ii) Trade receivables 772 706
(iii) Cash and cash equivalents 96 154
(iv) Bank Balances other than (iii) above
96 152
(v) Loans 8 35
(vi) Others 3 28
(c) Current tax asset(net) 2 2
(d) Other current assets 373 391
(e) Assets held for sale 2 2
Total current assets 2,906 3,440
Total Assets 8,143 8,702
Particulars As at
30/09/2018 (Unaudited)
As at 31/03/2018
(Audited)
B Equity and Liabilities
1 Equity
(a) Equity share capital 177 176
(b) Other Equity 4,956 5,530
Equity attributable to shareholders of the Company
5,133 5,707
Non Controlling Interest 31 27
Total equity 5,163 5,733
2 Non-current liabilities
(a) Financial liabilities
(i) Borrowings 42 364
(ii) Other financial liabilities 4 4
(b) Provisions 58 57
(c) Deferred tax liabilities (Net) 99 109
Total Non-current liabilities 203 534
3 Current liabilities
(a) Financial liabilities
(i) Borrowings 671 464
(ii) Trade payables 1,343 1,410
(iii) Other financial liabilities 349 238
(b) Other current liabilities 223 173
(c) Provisions 139 107
(d) Current tax Liabilities (Net) 50 41
Total Current liabilities 2,776 2,434
Total Equity and Liabilities 8,143 8,702

27 Note: All figures are in INR crores, unless otherwise stated
Standalone Balance Sheet
Particulars
As at 30/09/2018 (Unaudited)
As at 31/03/2018
(Audited)
A Assets
1 Non-current assets
(a) Property, plant and equipment 951 971
(b) Capital work-in-progress 31 27
(c) Investment property 50 50
(d) Other Intangible assets 16 9
(e) Financial assets
(i) Investments 2,620 2,720
(ii) Loans 10 10
(iii) Others 7 4
(f) Non-current tax assets (net) 3 3
(g) Other non-current assets 59 60
Total Non-current assets 3,747 3,854
2 Current assets
(a) Inventories 739 705
(b) Financial assets
(i) Investments 269 713
(ii) Trade receivables 313 321
(iii) Cash and cash equivalents 13 78
(iv) Bank Balances other than (iii) above
10 9
(v) Loans 1 1
(vi) Others 8 4
(c) Other current assets 111 127
Total current assets 1,465 1,959
Total Assets 5,212 5,813
Particulars As at
30/09/2018 (Unaudited)
As at 31/03/2018
(Audited)
B Equity and Liabilities
1 Equity
(a) Equity share capital 177 176
(b) Other Equity 3,262 4,051
Total equity 3,438 4,227
2 Non-current liabilities
(a) Financial liabilities
(i) Borrowings 26 201
(ii) Other financial liabilities 4 4
(b) Provisions 52 50
(c) Deferred tax liabilities (Net) 84 96
Total Non-current liabilities 167 351
3 Current liabilities
(a) Financial liabilities
(i) Borrowings 251 85
(ii) Trade payables 955 961
(iii) Other financial liabilities 242 82
(b) Other current liabilities 58 38
(c) Provisions 89 64
(d) Current tax Liabilities (Net) 11 4
Total Current liabilities 1,607 1,234
Total Equity and Liabilities 5,212 5,813
For more information & updates, visit :
http://www.dabur.com/in/en-us/investor
Related Documents