GASVESSEL – 723030 Compressed Natural Gas Transport System _______________________________________________________________________________________ WP7 D7.2 Page | 1 D7.2: Comparative analysis of CNG-GASEVESSEL versus LNG and Pipeline Project: GASVESSEL Project No.: 723030 Deliverable No.: D7.2 Deliverable Name: Comparative analysis WP n. 7 Document Version: 0.1 Document Preparation Date: 2021-10-01 Responsibility: SINTEF Type of Deliverable R Document, Report [X] DEM Demonstrator, pilot, prototype DEC Websites, patent fillings, videos, etc. OTHER ETHICS Ethics requirements ORDP Open Research Data Pilot Dissemination Level PU Public [X] CO Confidential, only for Members of the Consortium (including the EU Commission Services) X Version Management Software used MS Word Company Internal Doc. n. Author(s) SINTEF Reviewed by SINTEF Approved by Navalprogetti Authorized by Coordinator Revision No. Date Modification description RV 1 2021-12-30 Uploaded to EU portal RV 2 RV 3

Welcome message from author
This document is posted to help you gain knowledge. Please leave a comment to let me know what you think about it! Share it to your friends and learn new things together.
Transcript
GASVESSEL – 723030 Compressed Natural Gas Transport System
_______________________________________________________________________________________
WP7 D7.2 Page | 1
D7.2: Comparative analysis of CNG-GASEVESSEL versus LNG and Pipeline
Project: GASVESSEL
Project No.: 723030
Deliverable No.: D7.2
Deliverable Name: Comparative analysis
WP n. 7
Document Version: 0.1
Document Preparation Date: 2021-10-01
Responsibility: SINTEF
Type of Deliverable
R Document, Report [X]
DEM Demonstrator, pilot, prototype
DEC Websites, patent fillings, videos, etc.
OTHER
ETHICS Ethics requirements
ORDP Open Research Data Pilot
Dissemination Level
PU Public [X]
CO Confidential, only for Members of the Consortium (including the EU Commission Services)
X
Version Management
Software used MS Word
Company Internal Doc. n.
Author(s) SINTEF
Reviewed by SINTEF
Approved by Navalprogetti
Authorized by Coordinator
Revision No. Date Modification description
RV 1 2021-12-30 Uploaded to EU portal
RV 2
RV 3
GASVESSEL – 723030 Compressed Natural Gas Transport System
_______________________________________________________________________________________
WP7 D7.2 Page | 2
EC Grant Agreement No.723030
Project Acronym GASVESSEL
Project Title Compressed Natural Gas Transport System
Instrument HORIZON 2020
Programme Smart, green and integrated Transport
Start Date of Project 2017-06-01
Duration 58 months
Organisation Name of Lead Contractor for this Deliverable
SINTEF
Financial/Administrative Coordinator
Project Coordinator Name Mr. Loris COK
Project Coordinator Organization Name NAVALPROGETTI Srl
Address Via dei Papaveri, 21 34151 TRIESTE (Italy)
Phone Numbers 0039 040 212918,
Email [email protected]; [email protected];
Project web-sites & other Access Points www.gassvessel.eu
The GASVESSEL Project has received funding from the European Union’s Horizon 2020 Research and Innovation
Programme under Grant Agreement no. 723030
GASVESSEL – 723030 Compressed Natural Gas Transport System
_______________________________________________________________________________________
WP7 D7.2 Page | 3
Contents
1 Executive Summary ................................................................................................................................... 7
1.1.1 Alternative options (GASVESSEL scenarios) .............................................................................. 7
1.1.2 GASVESSEL costs ........................................................................................................................ 7
1.1.3 Alternative options (GASVESSEL scenarios) .............................................................................. 8
1.1.4 Generalisation ........................................................................................................................... 9
1.1.5 Cyprus-Greece ......................................................................................................................... 12
2 Introduction ............................................................................................................................................. 13
2.1 Purpose ............................................................................................................................................ 13
2.2 WP7 and T7.2................................................................................................................................... 13
2.3 Approach ......................................................................................................................................... 14
3 GASVESSEL Cost Calculation .................................................................................................................... 16
3.1 Introduction ..................................................................................................................................... 16
3.1.1 Cost structure .......................................................................................................................... 16
3.2 Data input and main assumptions ................................................................................................... 16
3.2.1 Vessel capacity ......................................................................................................................... 16
3.2.2 Ship characteristics .................................................................................................................. 17
3.2.3 Operational profile .................................................................................................................. 18
3.2.4 OPEX ........................................................................................................................................ 19
3.2.5 Scenarios .................................................................................................................................. 21
3.2.6 Loading/unloading ................................................................................................................... 21
3.2.7 Storage ..................................................................................................................................... 22
3.3 GASVESSEL fleet and transport system ........................................................................................... 23
3.3.1 Basis calculation....................................................................................................................... 23
3.3.2 Storage vs continuous delivery ................................................................................................ 24
3.3.3 VOYEX ...................................................................................................................................... 25
3.3.4 Unit cost ................................................................................................................................... 25
3.4 GASVESSEL cost results .................................................................................................................... 26
3.4.1 GASVESSEL costs: Scenarios .................................................................................................... 26
3.4.2 GASVESSEL costs: Generalisation ............................................................................................ 33
4 Comparative Analysis .............................................................................................................................. 40
4.1 Method ............................................................................................................................................ 40
4.2 LNG and pipeline alternatives ......................................................................................................... 42
4.2.1 LNG .......................................................................................................................................... 42
4.2.2 Pipeline .................................................................................................................................... 45
4.3 Results (Comparative analysis) ........................................................................................................ 46
GASVESSEL – 723030 Compressed Natural Gas Transport System
_______________________________________________________________________________________
WP7 D7.2 Page | 4
4.3.1 GASVESSEL vs LNG vs pipeline: All scenarios ........................................................................... 46
4.3.2 GASVESSEL vs pipeline vs LNG: Generalisation ....................................................................... 48
4.4 Specific scenario: Cyprus – Greece .................................................................................................. 57
4.4.1 GASVESSEL CASE ...................................................................................................................... 57
4.4.2 Alternative options description ............................................................................................... 59
4.4.3 GASVESSEL vs Alternative options: results .............................................................................. 61
5 Conclusions .............................................................................................................................................. 63
6 Appendices .............................................................................................................................................. 64
6.1 GASVESSEL scenarios: full dataset ................................................................................................... 64
6.2 Pipeline Costs (CHC) ........................................................................................................................ 65
6.2.1 Loading at offshore field .......................................................................................................... 65
6.2.2 Loading nearshore / onshore .................................................................................................. 67
6.3 LNG .................................................................................................................................................. 69
6.3.1 FLNG, loading offshore ............................................................................................................ 69
6.3.2 LNG/FLNG, nearshore, onshore ............................................................................................... 71
List of Figures
Figure 1: WP7 data process ............................................................................................................................. 15
Figure 2: GASVESSEL cost components, structure, main sources and principles applied. .............................. 16
Figure 3: Schema of GASVESSEL carrying capacity .......................................................................................... 17
Figure 4: GASVESSEL ship main characteristics, engine system (extract from D5.3) and average load
assumption (Source: GasVessel: WP5-D5.3-RV1-833-8-001-B01) .................................................................. 18
Figure 5: Schema of GASVESSEL operational profile ....................................................................................... 19
Figure 6: GASVESSEL unit cost (€/Nm3) per scenario – strategy "storage", compressors onboard ................ 26
Figure 7: GASVESSEL unit cost (€/Nm3) per scenario – strategy "storage", compressors at (un)loading point
......................................................................................................................................................................... 27
Figure 8: GASVESSEL unit cost (€/Nm3) per scenario – strategy "continuous delivery", compressors onboard
......................................................................................................................................................................... 27
Figure 9: GASVESSEL unit cost (€/Nm3) per scenario – strategy "continuous delivery", compressors at
(un)loading point ............................................................................................................................................. 28
Figure 10 (a,b): Operating years 20, 15, 25 (a: with storage, b: continuous delivery) .................................... 29
Figure 11 (a,b): operating days 350, 300, 325 (a: with storage, b: continuous delivery) ................................ 30
Figure 12 (a,b): .speed 16, 14, 18 (a: with storage, b: continuous delivery) ................................................... 31
Figure 13 (a,b): fuel price 50%, 25%, 100% (a: with storage, b: continuous delivery) .................................... 32
Figure 14: GASVESSEL unit cost per distance (100-5000km) and annual volume (0.5-15 bcm) , based on
onshore-onshore case, Ship B (12M Nm3), compressor at (un)loading point, continuous delivery ............... 34
Figure 15: GASVESSEL unit cost per distance (100-5000km) and annual volume (0.5-15 bcm) , based on
onshore-onshore case, Ship A (15M Nm3), compressor at (un)loading point, continuous delivery ............... 34
Figure 16: Onshore Ship B (12M Nm3), storage, compressor onboard ........................................................... 35
Figure 17: Onshore Ship A (15M Nm3), storage, compressor onboard ........................................................... 35
Figure 18: Loading onshore Ship B (12M Nm3), storage, compressor at (un)loading point ............................ 36
Figure 19: Loading onshore Ship A (15M Nm3), storage, compressor at (un)loading point ........................... 36
Figure 20: Onshore Ship B (12M Nm3), storage, compressor onboard, gas fuel cost 100% of MGO price .... 37
GASVESSEL – 723030 Compressed Natural Gas Transport System
_______________________________________________________________________________________
WP7 D7.2 Page | 5
Figure 21: Onshore Ship A (15M Nm3), storage, compressor onboard, gas fuel cost 100% of MGO price .... 37
Figure 22: Onshore Ship B (12M Nm3), storage, compressor onshore at (un)loading point, gas fuel cost 100%
of MGO price ................................................................................................................................................... 38
Figure 23: Onshore Ship A (15M Nm3), storage, compressor onshore at (un)loading point, gas fuel cost 100%
of MGO price ................................................................................................................................................... 38
Figure 24: Onshore Ship B (12M Nm3), continuous delivery, compressor onshore at (un)loading point, gas
fuel cost 100% of MGO price ........................................................................................................................... 39
Figure 25: Onshore Ship A (15M Nm3), Continuous delivery, compressor onshore at (un)loading point, gas
fuel cost 100% of MGO price ........................................................................................................................... 39
Figure 26: Schema of the scope of comparison GASVESSEL – Pipeline - LNG. ................................................ 41
Figure 27: GASVESSEL scenarios included in the comparison study. .............................................................. 42
Figure 28: Ship type and capacity, speed, fuel cost and renting cost for 5 LNG carriers (Source: Bittante et al.
Table 2 (2018:82) ............................................................................................................................................. 44
Figure 29: LNG shipping costs for distince vessel capacity (compiled with data from Bittante et al. (2018)) 44
Figure 30: Comparision GASVESSEL (continuous and storage options), LNG and pipeline for the selected
scenarios. ......................................................................................................................................................... 47
Figure 31 (a and b) Pipeline costs as funciton of distance (km) for distinct volume scenarios (bcm/year),
based on (a) onshore scenarios, and (b) offshore scenarios ........................................................................... 48
Figure 32 (a and b): LNG and FLNG costs as funciton of distance (km) for distinct volume scenarios
(bcm/year), based on (a) onshore scenarios, and (b) offshore scenarios (ref ship LNG carrier 120 000m3) .. 49
Figure 33: Contour plot unit cost for GASVESSEL ( Ship B 12M Nm3), pipeline and LNG. ............................... 50
Figure 34 Contour plot unit cost for GASVESSEL (Ship A 15M Nm3), pipeline and LNG. ................................. 50
Figure 35: Unit cost comparison GASVESSEL (Ship A)/LNG/pipeline for volume range 0.5 – 5 bcm/year ..... 51
Figure 36: Comparison GASVESSEL – LNG – Pipeline onshore-onshore, continuous delivery, for Ship A and
Ship B, distance range 100-5000km, volume range 0.5-15 bcm/year. Variation of input parameters operting
days, operation years, speed, gas fuel cost, and tested for 2 distinct LNG vessel sizes (distinct shipping costs)
......................................................................................................................................................................... 56
Figure 37: GASVESSEL scenario ....................................................................................................................... 57
Figure 38: Gasvessel and alternative options for case Cyprus-Greece ........................................................... 59
Figure 39: Gasvessel vs. LNG and pipeline options, unit cost comparison on leg B-C onshore-onshore ....... 62
Figure 40: Gasvessel vs. LNG and pipeline options, unit cost comparison on leg A-C offshore-onshore ....... 62
List of Tables
Table 1: Summary table gas carrying capacity breakdown – average figures ................................................ 17
Table 2: GASVESSEL scenarios (compiled from WP2, WP7) ............................................................................ 21
Table 3: CAPEX option comparative table from D6.4 rev 04 (WP4) ................................................................ 22
Table 4: Gasvessel and alternative options for case Cyprus-Greece .............................................................. 59
Table 5: GASVESSEL fleet and transport system costs .................................................................................... 59
Table 6: Onshore Cyprus to mainland Greece via Nearshore LNG (option 1), CAPEX & OPEX ....................... 60
Table 7: Pipeline Onshore Cyprus to mainland Greece (option 2), CAPEX & OPEX ........................................ 60
Table 8: FLNG Offshore field to mainland Greece (option 3), CAPEX & OPEX ................................................ 61
Table 7: Pipeline Offshore field to mainland Greece (option 4), CAPEX & OPEX ............................................ 61
GASVESSEL – 723030 Compressed Natural Gas Transport System
_______________________________________________________________________________________
WP7 D7.2 Page | 6
Glossary, abbreviations and acronyms
bcm billion cubic meters
bbl barrel of crude oil
CAPEX capital expenditures
CBA cost-benefit analysis
FLNG floating liquefied natural gas facility
FRSU floating storage regasification unit
km kilometre
knots/kn nautical mile per hour
kWh kilowatt hour
LNG liquefied natural gas
MGO marine gas oil
mmbtu million British thermal unit
mmscmd million standard cubic meter a day
mmscfd million standard cubic feet a day
nm nautical mile
Nm3 normal cubic metre
NPV net present value
OPEX operating Expenses
Que$tor software tool for capital and operating cost-estimation.
sm3 standard cubic metre
VOLTA optimization and cost calculation software developed by Esteco (WP2)
VOYEX voyage expenses
GASVESSEL – 723030 Compressed Natural Gas Transport System
_______________________________________________________________________________________
WP7 D7.2 Page | 7
1 Executive Summary D7.2 presents the results of the comparative analysis carried out in T7.2. The GASVESSEL transport system
is compared with alternatives pipeline and LNG to uncover the potential niche market for GASVESSEL and
the volume/distance range for which GASVESSEL is cost competitive against pipeline and LNG options.
The work has consisted in:
• First, identifying GASVESSEL unit costs for each of the geo-logistic scenarios depicted in the project
and input cost data from other WPs.
• Second, GASVESSEL cost curves for distance and volume ranges of 100-5000 km and 0,5-15 bcm/year
were established, based on a GASVESSEL cost model. Variation in input parameters for GASVESSEL
enables to highlight the cost sensitivity of the GASVESSEL to parameters like operating days, speed,
fuel cost etc.
• Third, fixed and variable costs related to alternatives LNG and pipeline were calculated.
• Fourth, a comparison GASVESSEL-LNG-pipeline for each scenario was established.
• Fifth, cost curves for wider volume and distance ranges were established for pipeline and LNG based
on the scenario specific figures.
This enables the setup of contour plots highlighting the volume/distance area for which GASVESSEL is cost
competitive. Finally, a particular case for GASVESSEL was studied.
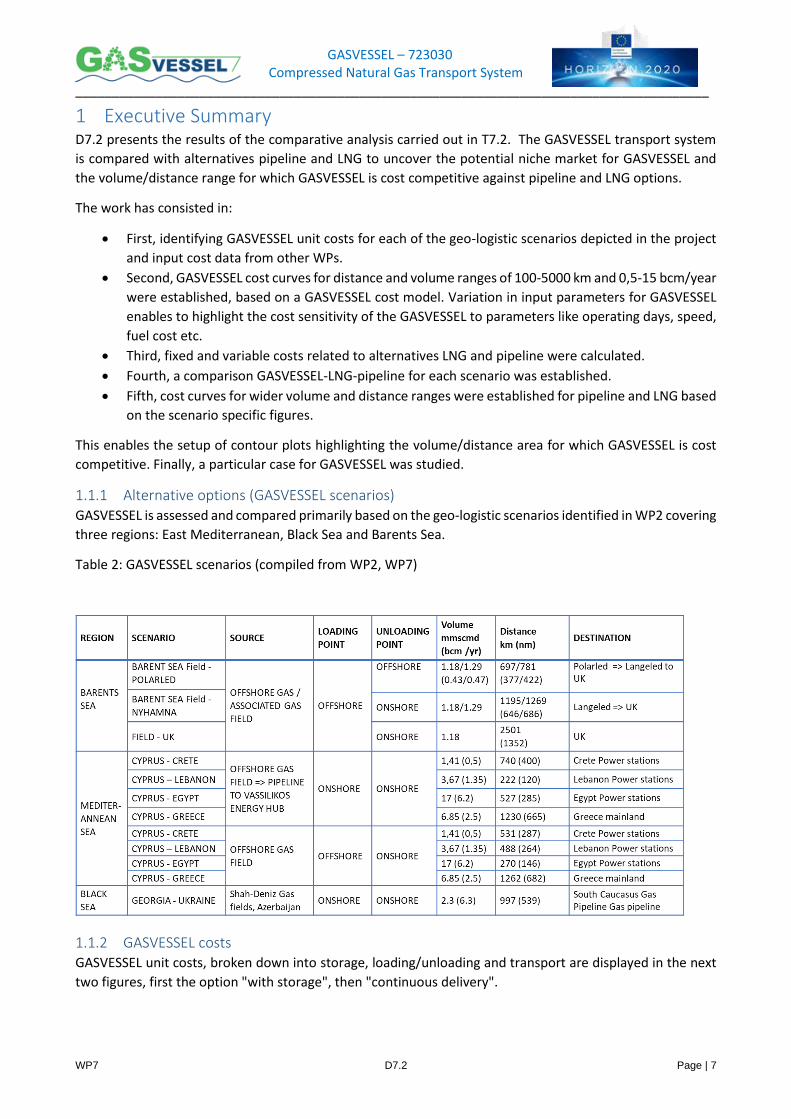
1.1.1 Alternative options (GASVESSEL scenarios) GASVESSEL is assessed and compared primarily based on the geo-logistic scenarios identified in WP2 covering
three regions: East Mediterranean, Black Sea and Barents Sea.
Table 2: GASVESSEL scenarios (compiled from WP2, WP7)
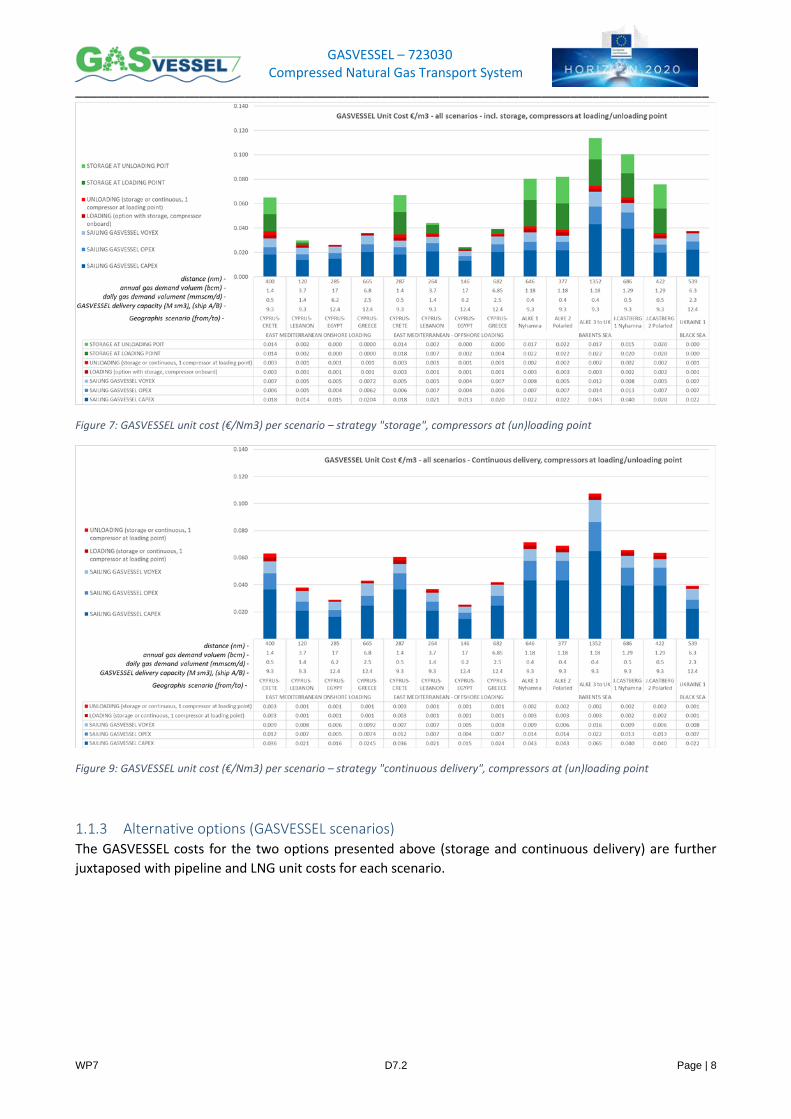
1.1.2 GASVESSEL costs GASVESSEL unit costs, broken down into storage, loading/unloading and transport are displayed in the next
two figures, first the option "with storage", then "continuous delivery".
GASVESSEL – 723030 Compressed Natural Gas Transport System
_______________________________________________________________________________________
WP7 D7.2 Page | 8
Figure 7: GASVESSEL unit cost (€/Nm3) per scenario – strategy "storage", compressors at (un)loading point
Figure 9: GASVESSEL unit cost (€/Nm3) per scenario – strategy "continuous delivery", compressors at (un)loading point
1.1.3 Alternative options (GASVESSEL scenarios) The GASVESSEL costs for the two options presented above (storage and continuous delivery) are further
juxtaposed with pipeline and LNG unit costs for each scenario.
GASVESSEL – 723030 Compressed Natural Gas Transport System
_______________________________________________________________________________________
WP7 D7.2 Page | 9
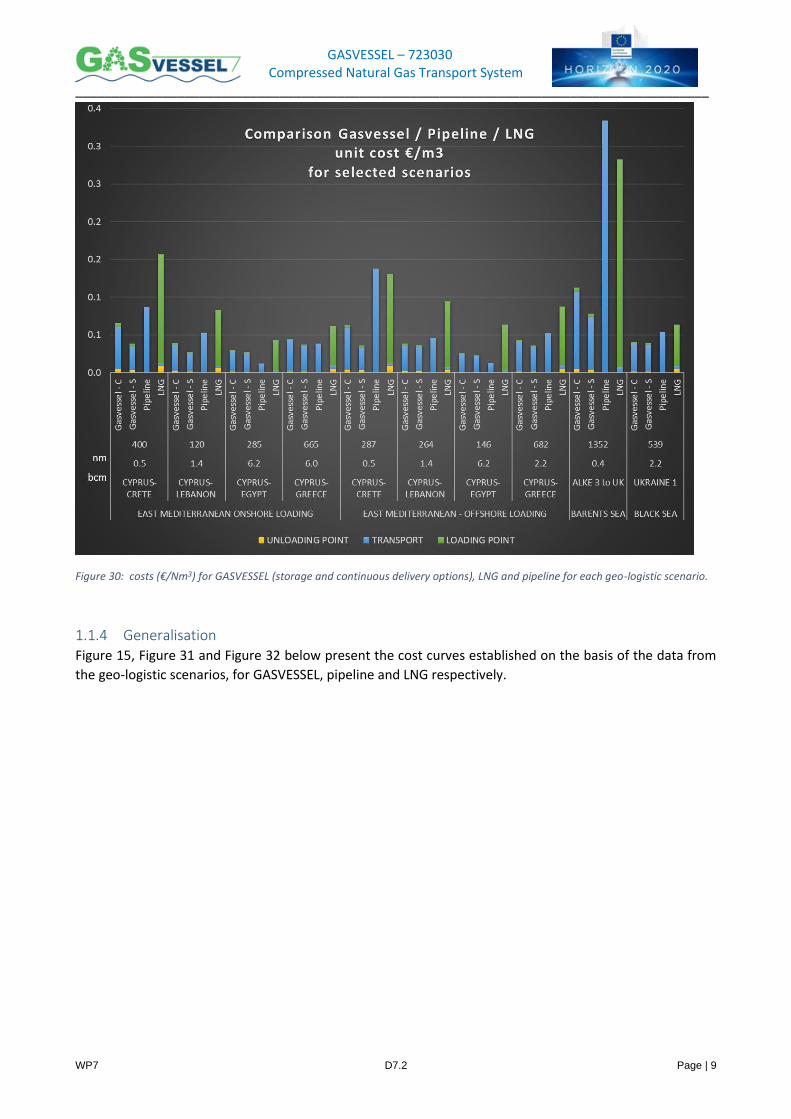
Figure 30: costs (€/Nm3) for GASVESSEL (storage and continuous delivery options), LNG and pipeline for each geo-logistic scenario.
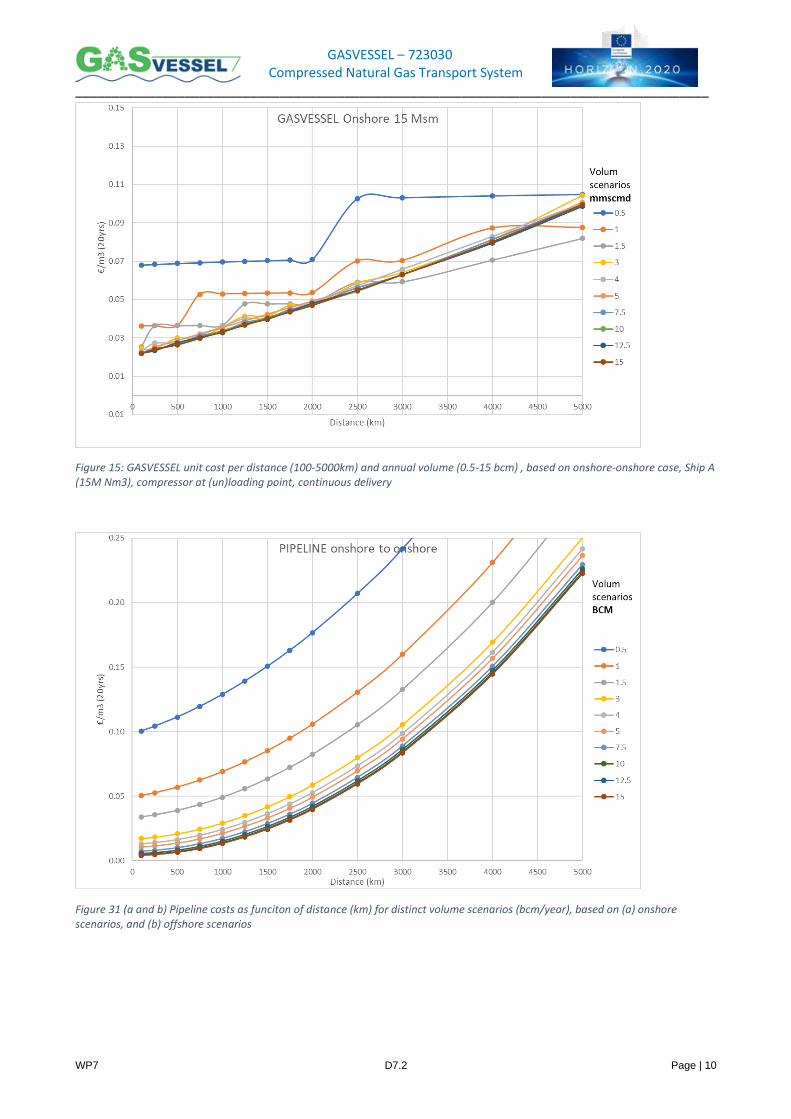
1.1.4 Generalisation Figure 15, Figure 31 and Figure 32 below present the cost curves established on the basis of the data from
the geo-logistic scenarios, for GASVESSEL, pipeline and LNG respectively.
GASVESSEL – 723030 Compressed Natural Gas Transport System
_______________________________________________________________________________________
WP7 D7.2 Page | 10
Figure 15: GASVESSEL unit cost per distance (100-5000km) and annual volume (0.5-15 bcm) , based on onshore-onshore case, Ship A (15M Nm3), compressor at (un)loading point, continuous delivery
Figure 31 (a and b) Pipeline costs as funciton of distance (km) for distinct volume scenarios (bcm/year), based on (a) onshore scenarios, and (b) offshore scenarios
GASVESSEL – 723030 Compressed Natural Gas Transport System
_______________________________________________________________________________________
WP7 D7.2 Page | 11
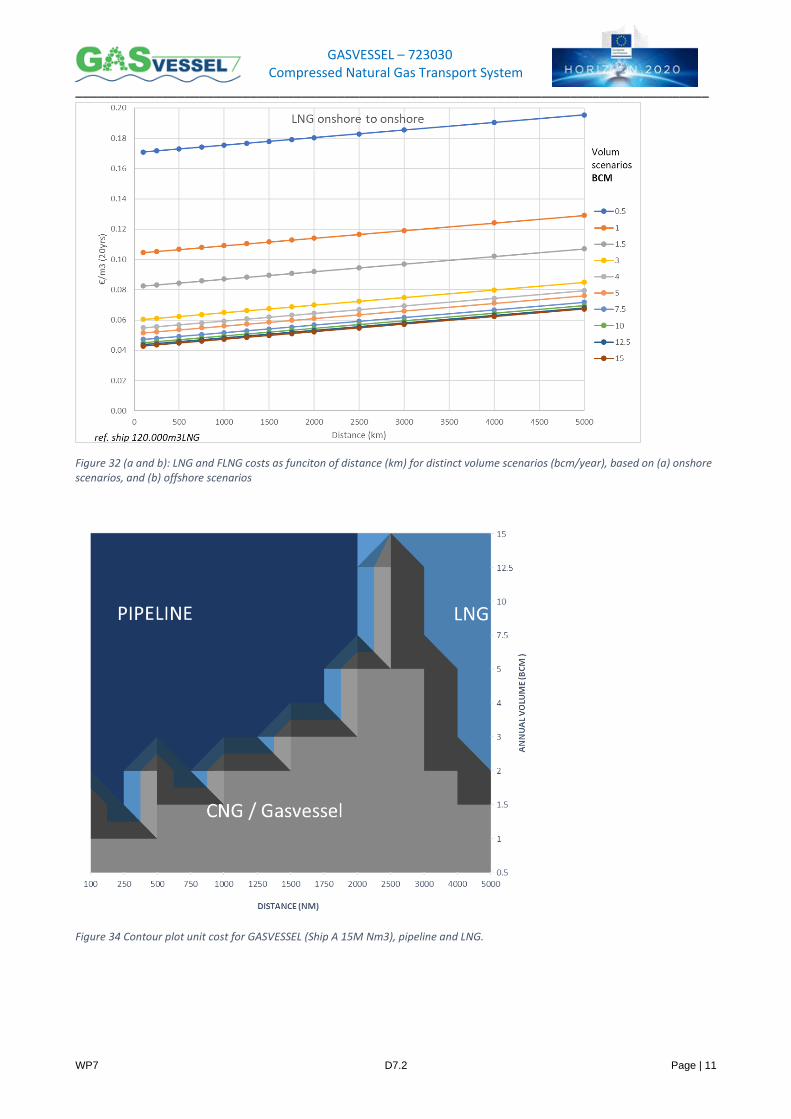
Figure 32 (a and b): LNG and FLNG costs as funciton of distance (km) for distinct volume scenarios (bcm/year), based on (a) onshore scenarios, and (b) offshore scenarios
Figure 34 Contour plot unit cost for GASVESSEL (Ship A 15M Nm3), pipeline and LNG.
GASVESSEL – 723030 Compressed Natural Gas Transport System
_______________________________________________________________________________________
WP7 D7.2 Page | 12
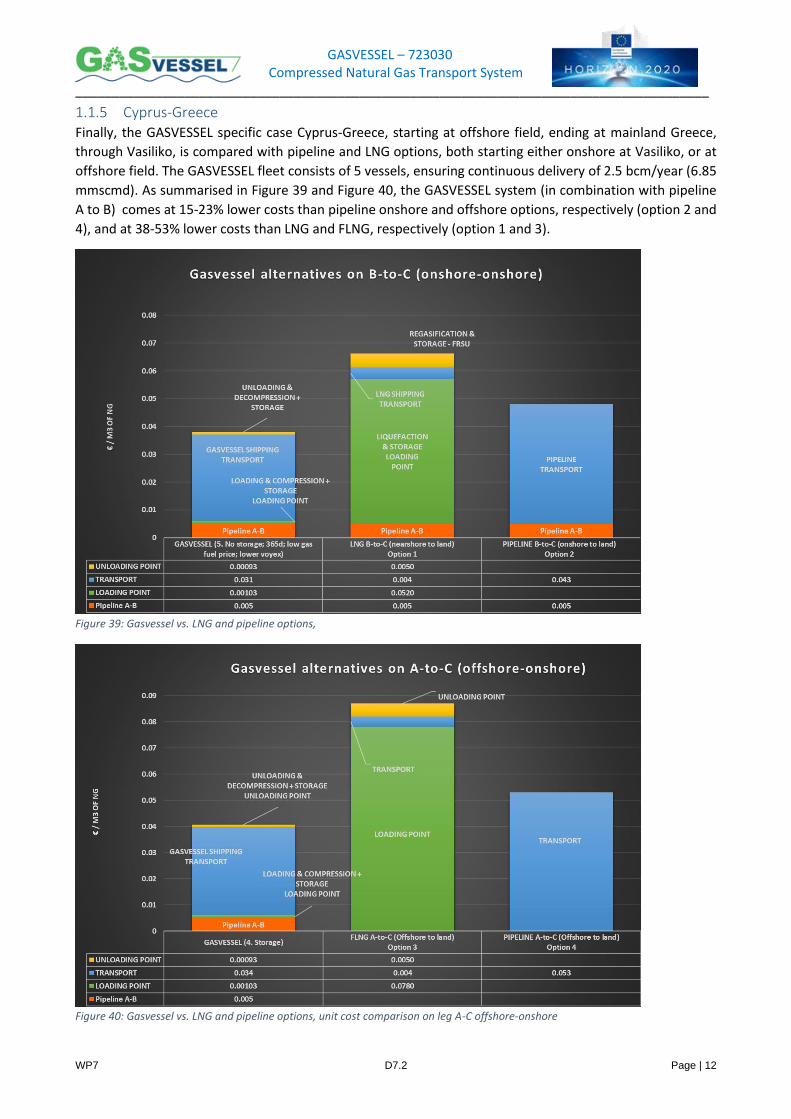
1.1.5 Cyprus-Greece Finally, the GASVESSEL specific case Cyprus-Greece, starting at offshore field, ending at mainland Greece,
through Vasiliko, is compared with pipeline and LNG options, both starting either onshore at Vasiliko, or at
offshore field. The GASVESSEL fleet consists of 5 vessels, ensuring continuous delivery of 2.5 bcm/year (6.85
mmscmd). As summarised in Figure 39 and Figure 40, the GASVESSEL system (in combination with pipeline
A to B) comes at 15-23% lower costs than pipeline onshore and offshore options, respectively (option 2 and
4), and at 38-53% lower costs than LNG and FLNG, respectively (option 1 and 3).
Figure 39: Gasvessel vs. LNG and pipeline options,
Figure 40: Gasvessel vs. LNG and pipeline options, unit cost comparison on leg A-C offshore-onshore
GASVESSEL – 723030 Compressed Natural Gas Transport System
_______________________________________________________________________________________
WP7 D7.2 Page | 13
2 Introduction
2.1 Purpose The general objective of GASVESSEL is to prove the techno-economic feasibility of a new CNG transport
concept enabled by novel patented Pressure Vessel manufacturing technology and a new conceptual ship
design including safe on- and offloading solutions at 300 bar. The GASVESSEL project delivers a competitive
cost-efficient CNG ship design and according safety standard verifications regarding ship, Pressure Vessel,
loading and unloading facilities.
WP7 is part of the proof-of-concept phase of GASVESSEL and includes a full cost-benefit analysis and a
quantitative and qualitative comparison to current systems.
This proof-of-concept is based on selected geo-logistic gas exploitation scenarios (WP2) and starts with
benchmarking of the new CNG concept GASVESSEL with alternative gas transportation modes pipelines and
FLNG (Current deliverable D7.2, T7.2), and further with profitability assessment in the form of financial plan
and socio-economic impact analysis (T7.3, D7.3).
In the EU and the near-market offshore, gas transport today consists of two solutions: pipeline or LNG ships.
For different areas and for different reason these traditional solutions are not always financially and/or
politically viable. The construction of pipelines is expensive and often due to technical, environmental or
political reason not possible. The alternative LNG transport requires considerable investments in liquefaction
and regasification facilities. Europe’s gas supply from third countries is suffering under a latent danger of
disruption due to political disagreements. A more efficient waterborne transport concept that opens up
unused gas supplies and that can respond fast and in a flexible manner to external circumstances is therefore
necessary to ensure a sustainable and robust energy mix in Europe.
GASVESSEL represents a real opportunity to exploit stranded and associated gas volumes in Europe, which is
now reliant on pipelines or the expensive LNG supply chain investments. GASVESSEL can contribute to
realizing a new manufacturing industry and jobs in Europe while reinforcing the shipbuilding industry and
improving security of energy supply.
Thanks to its flexibility in deployment and limited infrastructure requirement, GASVESSEL can serve as gas
shuttle concept between isolated gas supply points (offshore fields) and isolated consumers (islands, poor
access to gas network) providing a stable and flexible gas transport system. Liquefying plants and re-
gasification are not required for the CNG solution because of the different process of compressing gas done
by compressors installed on the ship. By compressing natural gas at the pressure of 300 bar the natural gas
density increases hence increasing the quantity of gas to be transported compared to conventional solutions.
2.2 WP7 and T7.2 The main objective of WP7 (Cost-Benefit Analysis) is to provide cost benefit analysis of the GASVESSEL
concept and determine for which circumstances the GASVESSEL concept is a competitive or preferred
alternative to conventional technologies delivering gas to market.
This is done through two main analysis:
• Comparative analysis: comparing GASVESSEL transport solution with LNG/FLNG and pipeline
alternatives (Task T7.2)
• Profitability analysis of GASVESSEL (financial, socio-economic, environmental cost and benefit) (Task
T 7.3)
GASVESSEL – 723030 Compressed Natural Gas Transport System
_______________________________________________________________________________________
WP7 D7.2 Page | 14
The comparative analysis consists of comparison of costs and emissions of each option (GASVESSEL, pipeline,
LNG). The purpose of the task is to demonstrate effectiveness of GASVESSEL, and for which distance and
volume range the GASVESSEL is cost competitive against alternative option, and in doing so identifying the
niche market for CNG and GASVESSEL in particular.
To prepare and support this work, a database of all data, information, main parameters, cost, and technical
specification, as well as analysis tools necessary for cost-benefit analysis has been gathered through Task
T7.1.
T7.2 builds on previous work from the GASVESSEL project:
1. ship cost and technical information from WP5;
2. loading/unloading system technical information and costs from WP6;
3. geologistics scenarios from WP2, identified for each geographic regions East-Med, Black Sea and
Barents Sea, and fine-tuned using optimisation tool VOLTA from Esteco;
4. identification of cost elements for alternative options (T7.2).
These input data are used in WP7 GASVESSEL fleet & transport system cost model from SINTEF, and
compared to cost estimates for pipeline and LNG provided by CHC, for the entire set of transport scenarios.
These scenario-specific estimations are further generalised into simplified volume-distance cost estimation
curves for a distance range of 100-5000km and volume range of 0.5-15 mmscmd (million standard cubic
meter a day).
The main deliverable of T7.2 is a contour plot indicating the combination volume/distance for which either
CNG-GASVESSEL, LNG or pipeline is most cost competitive.
To be able to offer relevant comparisons CNG-LNG-pipeline, a distinction has been made between concepts
involving offshore loading activity (loading near field) and onshore loading activity (scenarios assuming gas is
loaded near an onshore terminal, as well as a distinction between maritime logistics enabling storage vs.
strategies of continuous delivery.
2.3 Approach T7.2 is building on data and data model developed in T7.1.
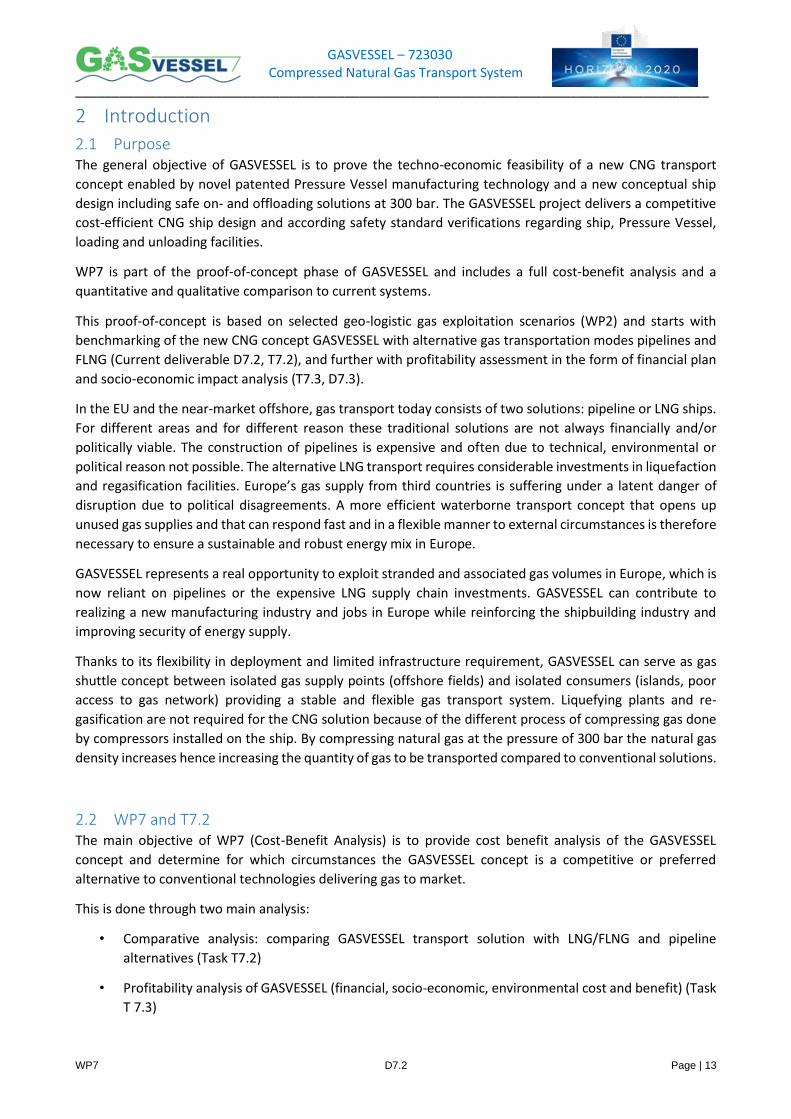
D7.1 CBA Database consists of the following elements (data flow illustrated in Figure 1):
1. GASVESSEL market scenarios (volume, distance, location) identified in WP2 as potential deployment
scenarios for GASVESSEL. These will serve as:
2. Reference scenarios for the comparative analysis (T7.2), from which a set of distance/volume cases
will be extrapolated to compare transport unit cost (€/Nm3) between CNG, LNG and pipeline. The
reference scenarios are based on market scenarios identified in WP2, and further completed through
logistics optimization with the Esteco VOLTA tool (identifies the associated number of vessels,
voyages, deliveries, storage etc).
3. Technical characteristics, CAPEX and OPEX of
a. Pressure vessels (WP3 and WP4): used as input to logistics optimization and costs calculation
(T7.2) and financial assessment (T7.3.1) and socio-economic analysis (T7.3.2).
b. Ship 15M and 12M (WP1, WP5): used as input to logistics optimization and midstream costs
calculation (T7.2).
c. Loading/unloading system and infrastructure (WP6) used as input to logistics optimization
and costs calculation (T7.2) and financial assessment (T7.3.1) and socio-economic analysis
(T7.3.2).
GASVESSEL – 723030 Compressed Natural Gas Transport System
_______________________________________________________________________________________
WP7 D7.2 Page | 15
d. CNG storage units' capacity and cost.
4. Alternative gas distribution options (pipeline, LNG) identified in T7.2 used in comparative analysis
for distinct volume/distance scenarios.
Figure 1: WP7 data process
The approach applied in T7.2 is reflected in the structure of the present Deliverable D7.2:
1. Established the cost structure and identified all cost parameters and data input to be used in
GASVESSEL cost calculation, the scenarios used as foundation for the cost assessment, and the main
assumptions and description of GASVESSEL fleet and transport system calculation - Chap 3.
2. Present the results of GASVESSEL cost calculation per scenario (unit cost for each scenario), as well
as sensitivity to certain input variables - Chap 3.4.1.
3. Extend GASVESSEL scenarios into generic cases by setting up a GASVESSEL reference scenarios and a
model for generalised GASVESSEL costs for volume range 0.5-15 bcm/year and distance range 100-
5000km - Chap 3.4.2. The purpose is to establish a sufficient number of observations for comparison
with LNG and pipeline.
4. Define the scope of the comparative analysis, based on methodology defined by SINTEF, ABS and
CHC - Chap 4.1.
5. Identify alternatives for each scenario – LNG & Pipeline, and their associated cost - Chap 4.2
6. Present a GASVESSEL -LNG-pipeline comparison for each GASVESSEL scenario. Deduct a generic cost
calculation from these scenarios. And identify cost estimated LNG / pipeline for further
volume/distance cases, summarised in comparison plots highlighting most competitive options, for
distinct volume and distance, in term of unit costs €/Nm3 - Chap 4.3. (Tariff is not considered, to
avoid discrepancy in calculation, across regions or across technological options.)
7. A specific GASVESSEL case is further explored, where a GASVESSEL based maritime CNG logistics
chain is set up and compare with distinct pipeline and LNG options - Chap 5.
GASVESSEL – 723030 Compressed Natural Gas Transport System
_______________________________________________________________________________________
WP7 D7.2 Page | 16
3 GASVESSEL Cost Calculation
3.1 Introduction This chapter describes the cost structure of the GASVESSEL, i.e., the cost of the GASVESSEL fleet and transport
system per unit of gas delivered, including data sources, main assumptions, and calculations.
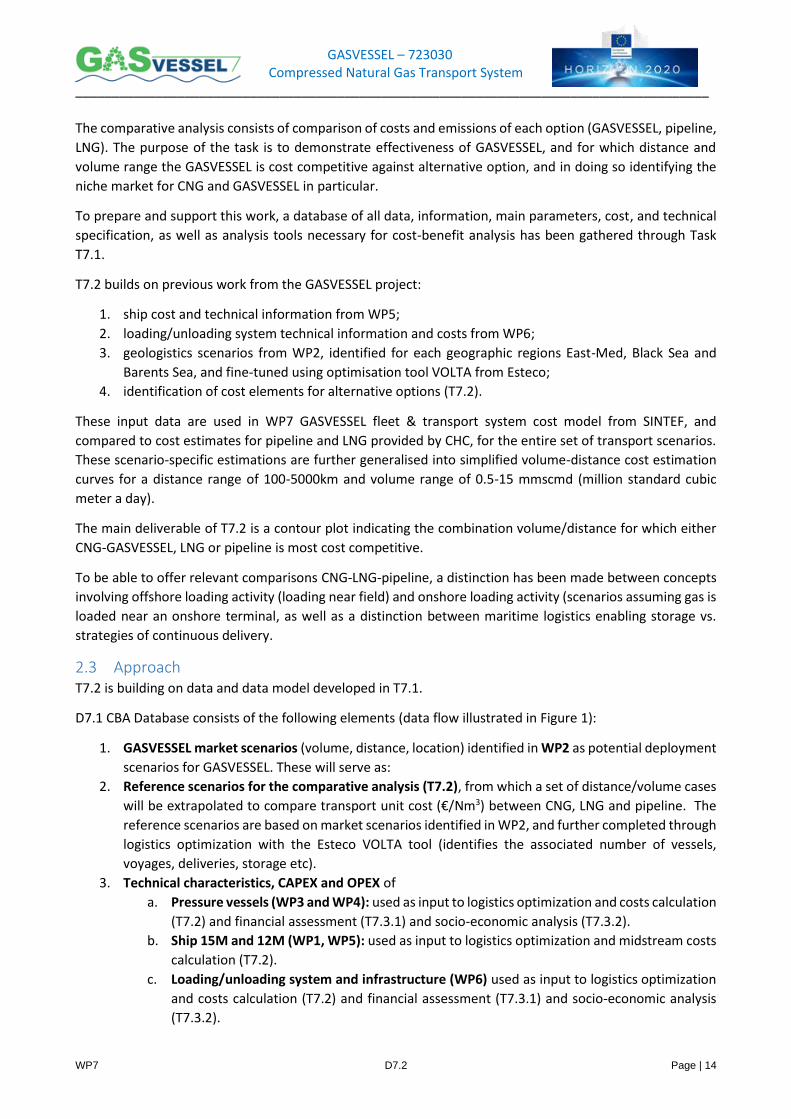
The scope of the cost calculation is marked in yellow in the below figure:
3.1.1 Cost structure The cost of GASVESSEL fleet and transport system consists of:
• The GASVESSEL cost, including ship, pressure vessels and compressor (CAPEX per ship).
• The compressor cost is handled separately in the calculation to enable consideration of moving the
compressor at loading/unloading point rather than onboard. This to avoid the duplication of
compressors onboard unnecessarily in the case of, for instance, large fleet.
• The GASVESSEL ship operating costs (OPEX per ship).
• The GASVESSEL transport system variable costs / voyage costs (VOYEX, per roundtrip per ship).
• The loading/unloading infrastructure acquisition cost and operating costs (CAPEX+OPEX per
GASVESSEL transport system/scenario).
• The gas storage system acquisition cost and operating cost (CAPEX+OPEX per GASVESSEL transport
system/scenario).
Figure 2: GASVESSEL cost components, structure, main sources and principles applied.
CAPEX is estimated for vessels, storage options and loading/unloading facilities. For simplicatation purposes
and to enable the generalisation of the calculation, a yearly CAPEX is calculated based on the estimated 20
years of operation for the GASVESSEL concept.
3.2 Data input and main assumptions
3.2.1 Vessel capacity The two distinct vessels proposed in GASVESSEL and designed in WP5 differ only in term of carrying capacity.
Ship A and ship B have a total gas cylinder capacity of 15M and 12M cubic meter of gas (Nm3), respectively.
From this, the available capacity which can be discharged at each voyage is 12,4M Nm3 and 9,3M Nm3
respectively for gas carriers Ship A and Ship B. This figure is applied as a fixed figure in the calculation of the
fleet and transport system. The remaining cargo is used for:
GASVESSEL – 723030 Compressed Natural Gas Transport System
_______________________________________________________________________________________
WP7 D7.2 Page | 17
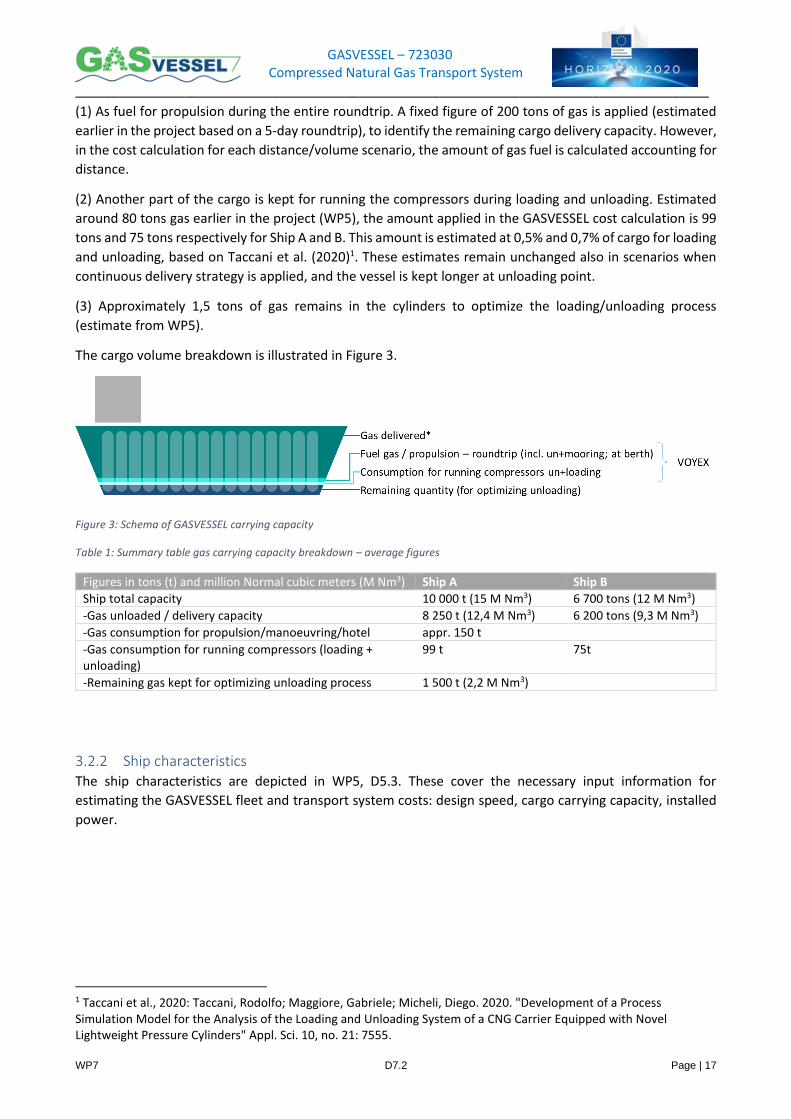
(1) As fuel for propulsion during the entire roundtrip. A fixed figure of 200 tons of gas is applied (estimated
earlier in the project based on a 5-day roundtrip), to identify the remaining cargo delivery capacity. However,
in the cost calculation for each distance/volume scenario, the amount of gas fuel is calculated accounting for
distance.
(2) Another part of the cargo is kept for running the compressors during loading and unloading. Estimated
around 80 tons gas earlier in the project (WP5), the amount applied in the GASVESSEL cost calculation is 99
tons and 75 tons respectively for Ship A and B. This amount is estimated at 0,5% and 0,7% of cargo for loading
and unloading, based on Taccani et al. (2020)1. These estimates remain unchanged also in scenarios when
continuous delivery strategy is applied, and the vessel is kept longer at unloading point.
(3) Approximately 1,5 tons of gas remains in the cylinders to optimize the loading/unloading process
(estimate from WP5).
The cargo volume breakdown is illustrated in Figure 3.
Figure 3: Schema of GASVESSEL carrying capacity
Table 1: Summary table gas carrying capacity breakdown – average figures
Figures in tons (t) and million Normal cubic meters (M Nm3) Ship A Ship B
Ship total capacity 10 000 t (15 M Nm3) 6 700 tons (12 M Nm3)
-Gas unloaded / delivery capacity 8 250 t (12,4 M Nm3) 6 200 tons (9,3 M Nm3)
-Gas consumption for propulsion/manoeuvring/hotel appr. 150 t
-Gas consumption for running compressors (loading + unloading)
99 t 75t
-Remaining gas kept for optimizing unloading process 1 500 t (2,2 M Nm3)
3.2.2 Ship characteristics The ship characteristics are depicted in WP5, D5.3. These cover the necessary input information for
estimating the GASVESSEL fleet and transport system costs: design speed, cargo carrying capacity, installed
power.
1 Taccani et al., 2020: Taccani, Rodolfo; Maggiore, Gabriele; Micheli, Diego. 2020. "Development of a Process Simulation Model for the Analysis of the Loading and Unloading System of a CNG Carrier Equipped with Novel Lightweight Pressure Cylinders" Appl. Sci. 10, no. 21: 7555.
GASVESSEL – 723030 Compressed Natural Gas Transport System
_______________________________________________________________________________________
WP7 D7.2 Page | 18
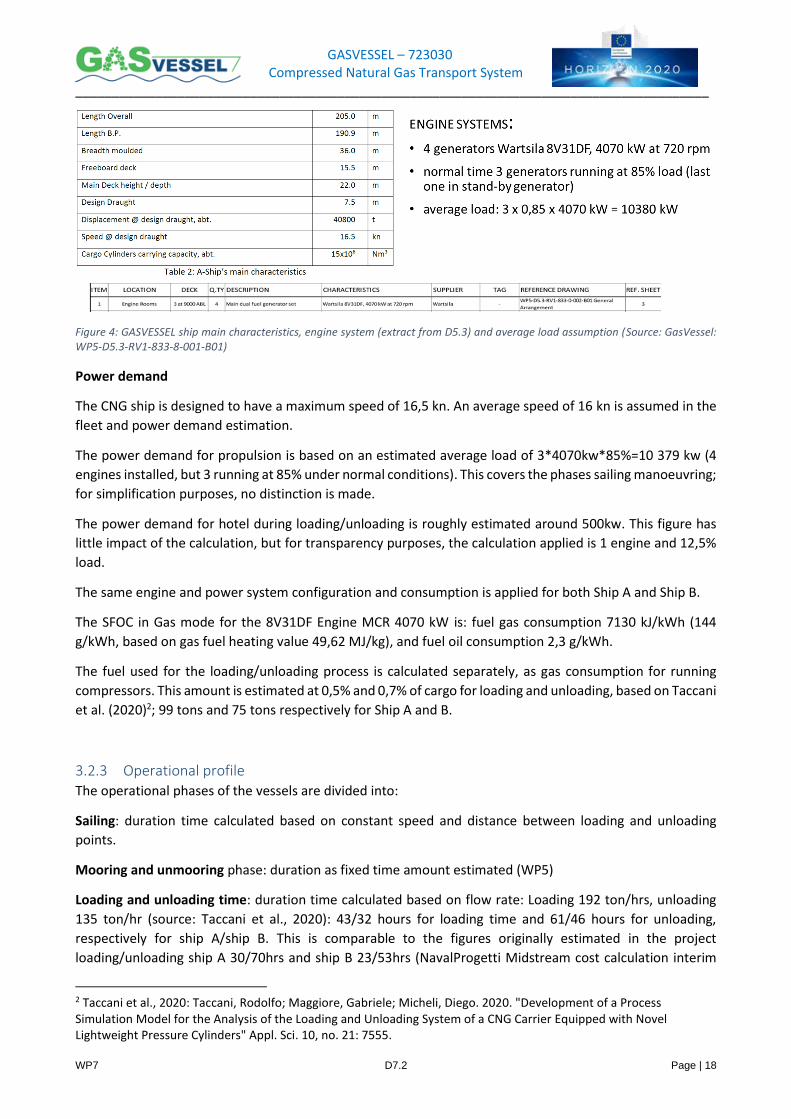
Figure 4: GASVESSEL ship main characteristics, engine system (extract from D5.3) and average load assumption (Source: GasVessel: WP5-D5.3-RV1-833-8-001-B01)
Power demand
The CNG ship is designed to have a maximum speed of 16,5 kn. An average speed of 16 kn is assumed in the
fleet and power demand estimation.
The power demand for propulsion is based on an estimated average load of 3*4070kw*85%=10 379 kw (4
engines installed, but 3 running at 85% under normal conditions). This covers the phases sailing manoeuvring;
for simplification purposes, no distinction is made.
The power demand for hotel during loading/unloading is roughly estimated around 500kw. This figure has
little impact of the calculation, but for transparency purposes, the calculation applied is 1 engine and 12,5%
load.
The same engine and power system configuration and consumption is applied for both Ship A and Ship B.
The SFOC in Gas mode for the 8V31DF Engine MCR 4070 kW is: fuel gas consumption 7130 kJ/kWh (144
g/kWh, based on gas fuel heating value 49,62 MJ/kg), and fuel oil consumption 2,3 g/kWh.
The fuel used for the loading/unloading process is calculated separately, as gas consumption for running
compressors. This amount is estimated at 0,5% and 0,7% of cargo for loading and unloading, based on Taccani
et al. (2020)2; 99 tons and 75 tons respectively for Ship A and B.
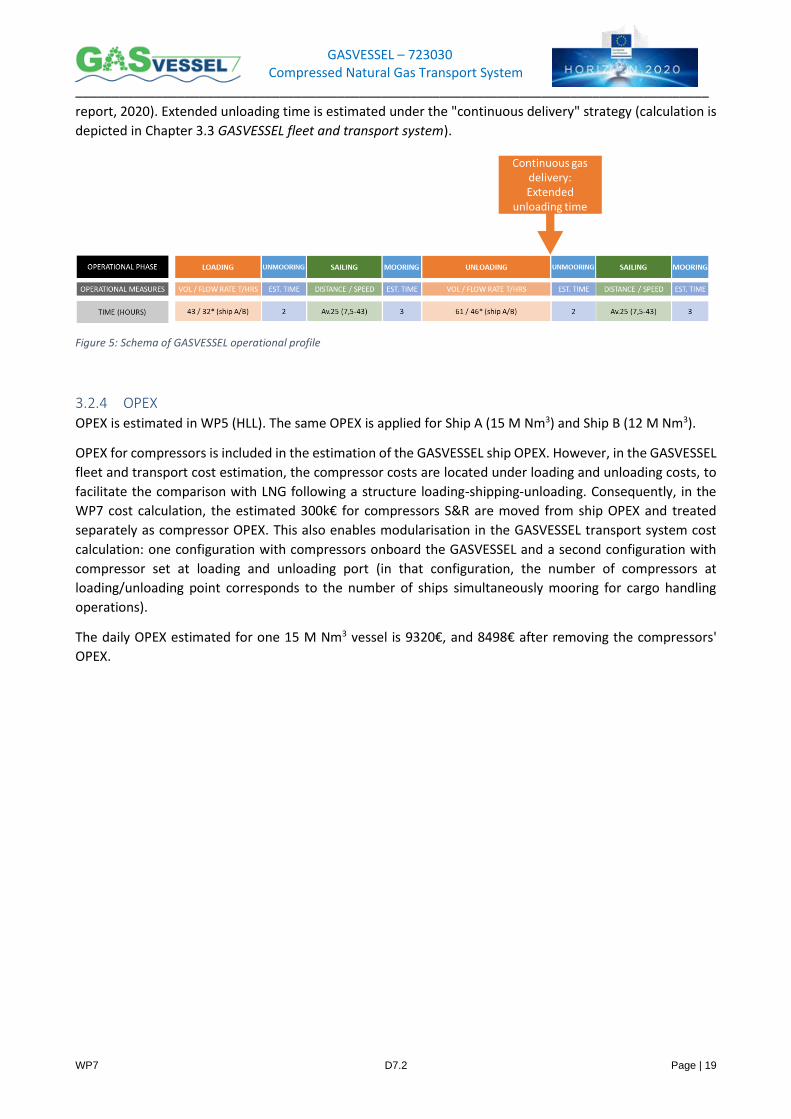
3.2.3 Operational profile The operational phases of the vessels are divided into:
Sailing: duration time calculated based on constant speed and distance between loading and unloading
points.
Mooring and unmooring phase: duration as fixed time amount estimated (WP5)
Loading and unloading time: duration time calculated based on flow rate: Loading 192 ton/hrs, unloading
135 ton/hr (source: Taccani et al., 2020): 43/32 hours for loading time and 61/46 hours for unloading,
respectively for ship A/ship B. This is comparable to the figures originally estimated in the project
loading/unloading ship A 30/70hrs and ship B 23/53hrs (NavalProgetti Midstream cost calculation interim
2 Taccani et al., 2020: Taccani, Rodolfo; Maggiore, Gabriele; Micheli, Diego. 2020. "Development of a Process Simulation Model for the Analysis of the Loading and Unloading System of a CNG Carrier Equipped with Novel Lightweight Pressure Cylinders" Appl. Sci. 10, no. 21: 7555.
GASVESSEL – 723030 Compressed Natural Gas Transport System
_______________________________________________________________________________________
WP7 D7.2 Page | 19
report, 2020). Extended unloading time is estimated under the "continuous delivery" strategy (calculation is
depicted in Chapter 3.3 GASVESSEL fleet and transport system).
Figure 5: Schema of GASVESSEL operational profile
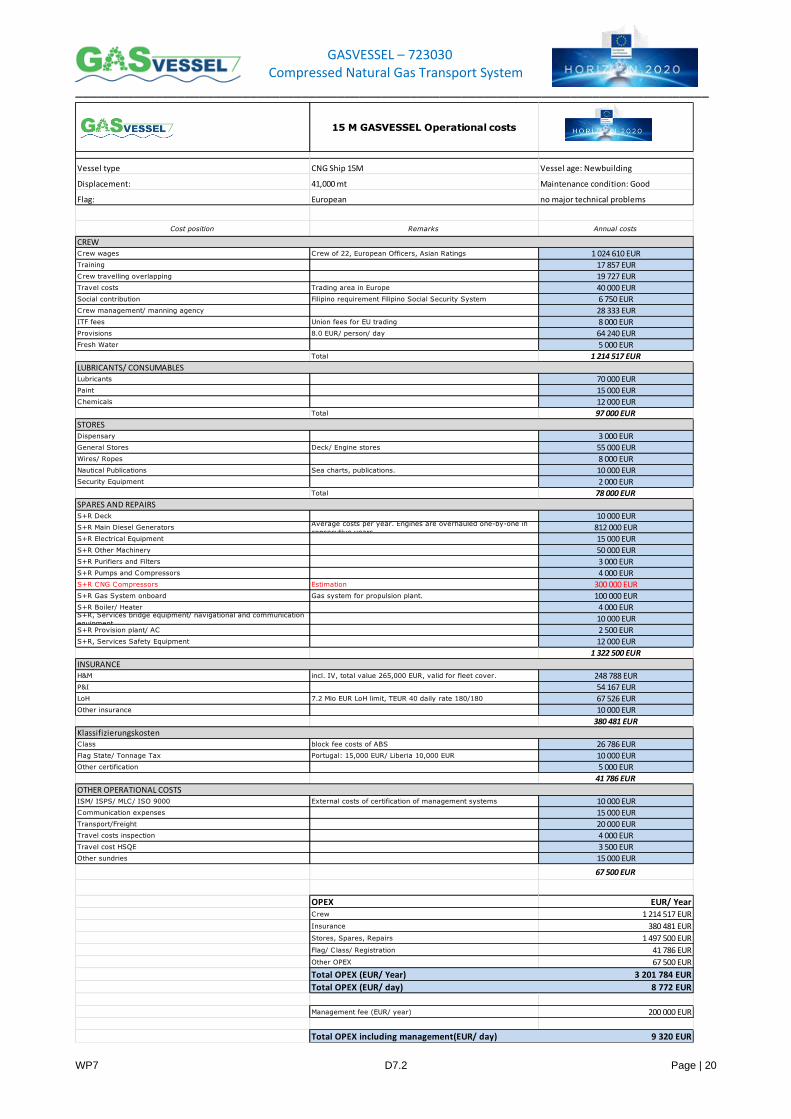
3.2.4 OPEX OPEX is estimated in WP5 (HLL). The same OPEX is applied for Ship A (15 M Nm3) and Ship B (12 M Nm3).
OPEX for compressors is included in the estimation of the GASVESSEL ship OPEX. However, in the GASVESSEL
fleet and transport cost estimation, the compressor costs are located under loading and unloading costs, to
facilitate the comparison with LNG following a structure loading-shipping-unloading. Consequently, in the
WP7 cost calculation, the estimated 300k€ for compressors S&R are moved from ship OPEX and treated
separately as compressor OPEX. This also enables modularisation in the GASVESSEL transport system cost
calculation: one configuration with compressors onboard the GASVESSEL and a second configuration with
compressor set at loading and unloading port (in that configuration, the number of compressors at
loading/unloading point corresponds to the number of ships simultaneously mooring for cargo handling
operations).
The daily OPEX estimated for one 15 M Nm3 vessel is 9320€, and 8498€ after removing the compressors'
OPEX.
GASVESSEL – 723030 Compressed Natural Gas Transport System
_______________________________________________________________________________________
WP7 D7.2 Page | 20
15 M GASVESSEL Operational costs
Vessel type CNG Ship 15M Vessel age: Newbuilding
Displacement: 41,000 mt Maintenance condition: Good
Flag: European no major technical problems
Cost position Remarks Annual costs
CREWCrew wages Crew of 22, European Officers, Asian Ratings 1 024 610 EURTraining 17 857 EURCrew travelling overlapping 19 727 EURTravel costs Trading area in Europe 40 000 EURSocial contribution Filipino requirement Filipino Social Security System 6 750 EURCrew management/ manning agency 28 333 EURITF fees Union fees for EU trading 8 000 EURProvisions 8.0 EUR/ person/ day 64 240 EURFresh Water 5 000 EUR
Total 1 214 517 EUR
LUBRICANTS/ CONSUMABLESLubricants 70 000 EURPaint 15 000 EURChemicals 12 000 EUR
Total 97 000 EUR
STORESDispensary 3 000 EURGeneral Stores Deck/ Engine stores 55 000 EURWires/ Ropes 8 000 EURNautical Publications Sea charts, publications. 10 000 EURSecurity Equipment 2 000 EUR
Total 78 000 EUR
SPARES AND REPAIRSS+R Deck 10 000 EURS+R Main Diesel Generators
Average costs per year. Engines are overhauled one-by-one in
consecutive years812 000 EUR
S+R Electrical Equipment 15 000 EURS+R Other Machinery 50 000 EURS+R Purifiers and Filters 3 000 EURS+R Pumps and Compressors 4 000 EURS+R CNG Compressors Estimation 300 000 EURS+R Gas System onboard Gas system for propulsion plant. 100 000 EURS+R Boiler/ Heater 4 000 EURS+R, Services bridge equipment/ navigational and communication
equipment10 000 EUR
S+R Provision plant/ AC 2 500 EURS+R, Services Safety Equipment 12 000 EUR
1 322 500 EUR
INSURANCEH&M incl. IV, total value 265,000 EUR, valid for fleet cover. 248 788 EURP&I 54 167 EURLoH 7.2 Mio EUR LoH limit, TEUR 40 daily rate 180/180 67 526 EUROther insurance 10 000 EUR
380 481 EUR
KlassifizierungskostenClass block fee costs of ABS 26 786 EURFlag State/ Tonnage Tax Portugal: 15,000 EUR/ Liberia 10,000 EUR 10 000 EUROther certification 5 000 EUR
41 786 EUR
OTHER OPERATIONAL COSTSISM/ ISPS/ MLC/ ISO 9000 External costs of certification of management systems 10 000 EURCommunication expenses 15 000 EURTransport/Freight 20 000 EURTravel costs inspection 4 000 EURTravel cost HSQE 3 500 EUROther sundries 15 000 EUR
67 500 EUR
OPEX EUR/ YearCrew 1 214 517 EUR
Insurance 380 481 EUR
Stores, Spares, Repairs 1 497 500 EUR
Flag/ Class/ Registration 41 786 EUR
Other OPEX 67 500 EUR
Total OPEX (EUR/ Year) 3 201 784 EUR
Total OPEX (EUR/ day) 8 772 EUR
Management fee (EUR/ year) 200 000 EUR
Total OPEX including management(EUR/ day) 9 320 EUR
GASVESSEL – 723030 Compressed Natural Gas Transport System
_______________________________________________________________________________________
WP7 D7.2 Page | 21
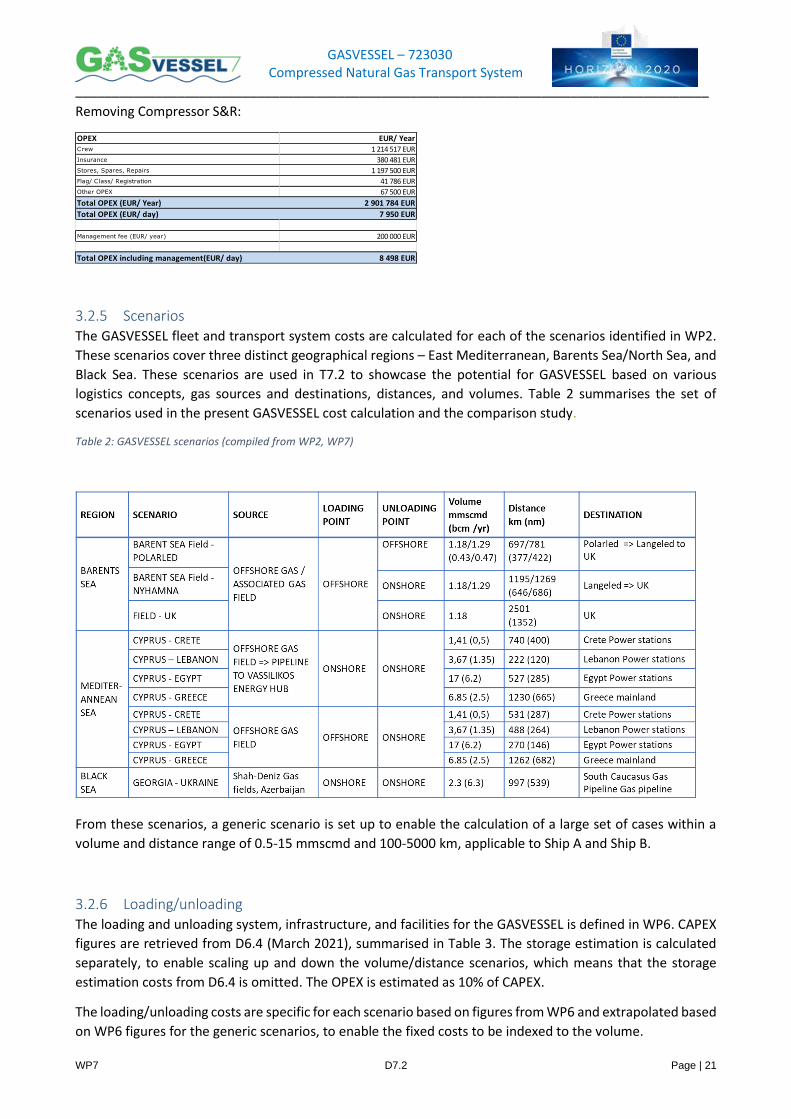
Removing Compressor S&R:
3.2.5 Scenarios The GASVESSEL fleet and transport system costs are calculated for each of the scenarios identified in WP2.
These scenarios cover three distinct geographical regions – East Mediterranean, Barents Sea/North Sea, and
Black Sea. These scenarios are used in T7.2 to showcase the potential for GASVESSEL based on various
logistics concepts, gas sources and destinations, distances, and volumes. Table 2 summarises the set of
scenarios used in the present GASVESSEL cost calculation and the comparison study.
Table 2: GASVESSEL scenarios (compiled from WP2, WP7)
From these scenarios, a generic scenario is set up to enable the calculation of a large set of cases within a
volume and distance range of 0.5-15 mmscmd and 100-5000 km, applicable to Ship A and Ship B.
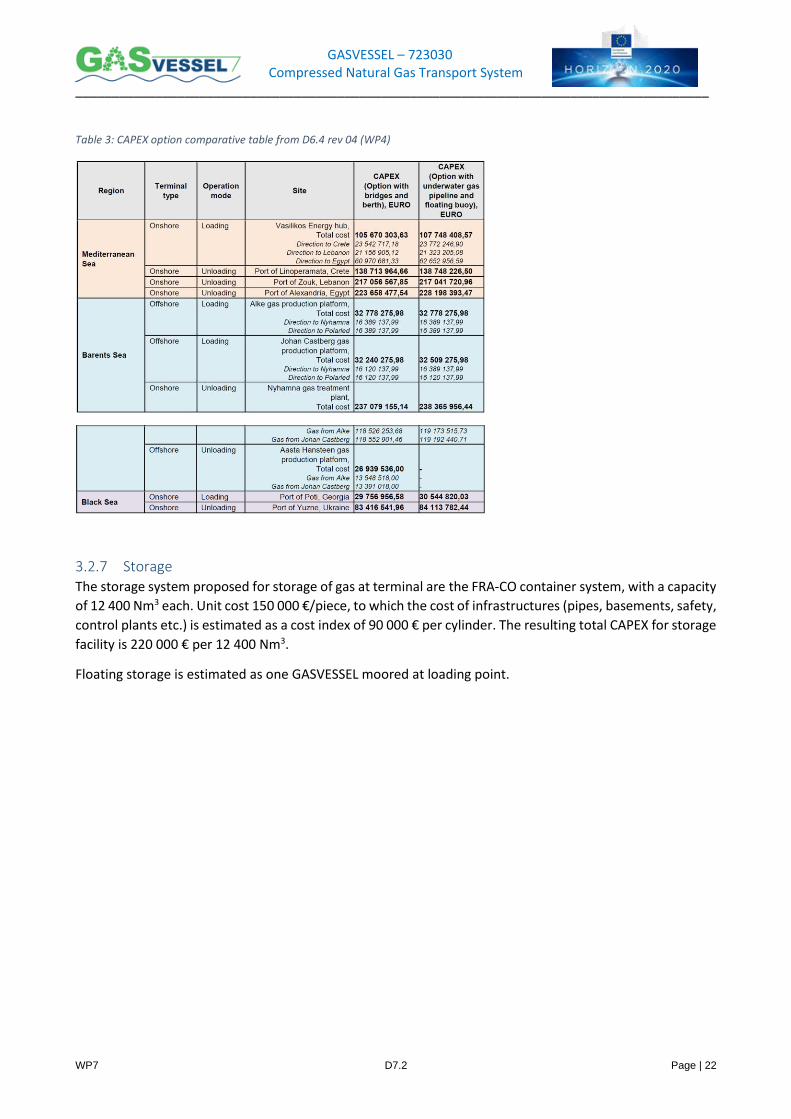
3.2.6 Loading/unloading The loading and unloading system, infrastructure, and facilities for the GASVESSEL is defined in WP6. CAPEX
figures are retrieved from D6.4 (March 2021), summarised in Table 3. The storage estimation is calculated
separately, to enable scaling up and down the volume/distance scenarios, which means that the storage
estimation costs from D6.4 is omitted. The OPEX is estimated as 10% of CAPEX.
The loading/unloading costs are specific for each scenario based on figures from WP6 and extrapolated based
on WP6 figures for the generic scenarios, to enable the fixed costs to be indexed to the volume.
OPEX EUR/ YearCrew 1 214 517 EUR
Insurance 380 481 EUR
Stores, Spares, Repairs 1 197 500 EUR
Flag/ Class/ Registration 41 786 EUR
Other OPEX 67 500 EUR
Total OPEX (EUR/ Year) 2 901 784 EUR
Total OPEX (EUR/ day) 7 950 EUR
Management fee (EUR/ year) 200 000 EUR
Total OPEX including management(EUR/ day) 8 498 EUR
GASVESSEL – 723030 Compressed Natural Gas Transport System
_______________________________________________________________________________________
WP7 D7.2 Page | 22
Table 3: CAPEX option comparative table from D6.4 rev 04 (WP4)
3.2.7 Storage The storage system proposed for storage of gas at terminal are the FRA-CO container system, with a capacity
of 12 400 Nm3 each. Unit cost 150 000 €/piece, to which the cost of infrastructures (pipes, basements, safety,
control plants etc.) is estimated as a cost index of 90 000 € per cylinder. The resulting total CAPEX for storage
facility is 220 000 € per 12 400 Nm3.
Floating storage is estimated as one GASVESSEL moored at loading point.
GASVESSEL – 723030 Compressed Natural Gas Transport System
_______________________________________________________________________________________
WP7 D7.2 Page | 23
3.3 GASVESSEL fleet and transport system The estimation of number of vessels and their associated fixed and variable costs is central to the cost model
of the GASVESSEL transport system. The present chapter depicts the basic calculation to estimate the
GASVESSEL fleet, the estimation of infrastructure costs for storage system, the GASVESSEL transport system
cost in a strategy of continuous delivery, and the estimation VOYEX, i.e., variable costs associated with sailing
a voyage.
3.3.1 Basis calculation To estimate the number of vessels needed in the GASVESSEL fleet, the following input is used:
• Daily gas market demand (𝐷)
• Delivery capacity of the vessels (𝐶𝑉)
• Total sailing distance: From production site to market and return (𝑑)
• Sailing speed, considered constant (𝑠)
• Operational yearly time for the vessels, set to 350 days out of yearly 365 (𝑂𝑉)
• Mooring time at both production and market sites (𝑡𝑀)
• Unmooring time at both production and market sites (𝑡𝑈𝑀)
• Loading time (𝑡𝐿)
• Unloading time (𝑡𝑈𝐿)
Based on the input, the roundtrip time for a vessel (𝑟𝑉) is calculated as the sum of sailing time,
mooring/unmooring time, and loading/unloading time, as follows:
𝑟𝑉 =𝑑
𝑠+ 𝑡𝑀 + 𝑡𝑈𝑀 + 𝑡𝐿 + 𝑡𝑈𝐿
The total number of roundtrips per year a vessel can sail (𝑅𝑉) then becomes the operational yearly time for
the vessels, divided by roundtrip time:
𝑅𝑉 =𝑂𝑉
𝑟𝑉
The required number of yearly vessel roundtrips to meet the market demand (𝑅𝐷) is calculated as yearly gas
market demand divided by the vessel delivery capacity:
𝑅𝐷 =𝐷 × 365
𝐶𝑉
Then the required number of vessels needed to meet the market demand (𝑉) is the required number of
yearly roundtrips to meet demand divided by the number of roundtrips a vessel can sail per year, rounded
up to the nearest whole integer:
𝑉 = ⌈𝑅𝐷
𝑅𝑉⌉
For each GASVESSEL reference scenario, only one vessel type is considered, and hence the delivery capacity
of the vessels in the fleet will have one single value only. No adjustments have been made to the operational
yearly time of the vessels or the sailing speed to see if the required number of vessels can be further
optimized as these values are set quite high (350 days and 16 knots, respectively).
As a general rule, the number of vessels is rounded up to nearest whole integer. However, in some cases, the
vessel needed to meet the yearly market demand may be just above a given number of vessels and hence
the rounding up procedure may impose very high costs of vessels where the spare delivery capacity of the
GASVESSEL – 723030 Compressed Natural Gas Transport System
_______________________________________________________________________________________
WP7 D7.2 Page | 24
vessel fleet is high. Therefore, it is also considered, for such instances, that the number of vessels is simply
rounded to nearest integer, and the delivered annual amount of gas will be less than the actual market
demand and this number will be used when calculating unit costs.
3.3.2 Storage vs continuous delivery For the GASVESSEL reference scenarios, gas storage option (Strategy 1: Storage) is compared with the option
of having continuous delivery (Strategy 2: Continuous delivery). With continuous delivery it is assumed that
one or more vessel is always unloading the daily market demand for gas at the unloading port. With Strategy
1, the number of vessels is minimized and delivered demand that exceeds the market demand during time
of delivery is stored in cylinders for the onshore unloading option, where each cylinder can store 12 400 m3
gas at a unit cost of 0,15 M €, in addition there is infrastructure costs estimated at 0.09 M € per cylinder.
Storage need is assumed similar for both loading and unloading ports/points. For the offshore unloading
option, storage is assumed to be equivalent to a GASVESSEL, and hence the cost of a GASVESSEL is used. With
Strategy 2, the number of vessels may have to be increased to account for continuously having a vessel that
delivers the daily market demand at the unloading port/point. For some GASVESSEL reference scenarios the
number of vessels will always account for continuous delivery and hence for these scenarios no storage
options are calculated, and continuous delivery assumed.
Some assumptions are made for the calculation of needed storage and needed number of vessels for
continuous delivery:
• Vessel utilization is spread evenly throughout the year.
• There is no time buffer between unmooring and mooring vessels at the unloading port/point, hence
continuous delivery to meet market demand can be considered.
For Strategy 1, the theoretical storage autonomy needed (𝑆) is calculated as number of days in the year
divided by the required number of yearly vessel roundtrips to meet the market demand (𝑅𝐷) minus the
unloading time (𝑡𝑈𝐿), multiplied with the daily gas market demand (𝐷):
𝑆 = (365
𝑅𝐷− 𝑡𝑈𝐿) × 𝐷
This number will become less than zero for the GASVESSEL reference scenarios where the number of vessels
accounts for continuous delivery without adjustments (daily total unloading capacity for all vessels in the
scenario equals daily demand). A positive value means that the daily total unloading capacity for all vessels
in the scenario is greater than daily demand and the storage is set to a size to cover the days between
unmooring of a vessel until mooring of next vessel at the unloading port.
If Strategy 2, continuous delivery, is to be used, an adjustment in the number of vessels in the fleet may be
needed. In the cases where 𝑆 is less than zero, no adjustments are needed, and continuous delivery is always
assumed. Otherwise, if the total unloaded quantity from the vessel exceeds the market demand during
unloading time, the unloading time is extended (𝑡𝑈𝐿∗) to match the daily market demand, and hence the
roundtrip time for a vessel is adjusted (𝑟𝑉∗) as follows:
𝑡𝑈𝐿∗ =𝐶𝑉
𝐷
𝑟𝑉∗ =𝑑
𝑠+ 𝑡𝑀 + 𝑡𝑈𝑀+𝑡𝐿 + 𝑡𝑈𝐿∗
Following the calculations from Section 3.3.1, the adjusted total number of roundtrips per year for each
vessel (𝑅𝑉∗) and the adjusted number of vessels needed for continuous delivery (𝑉∗) becomes:
GASVESSEL – 723030 Compressed Natural Gas Transport System
_______________________________________________________________________________________
WP7 D7.2 Page | 25
𝑅𝑉∗ =𝑂𝑉
𝑟𝑉∗
𝑉∗ = ⌈𝑅𝐷
𝑅𝑉∗⌉
3.3.3 VOYEX The cost associated with each voyage covers fuel cost and port fees.
Fuel costs are based on estimated fuel consumption:
As explained in Chapter 3.2.2, the estimated fuel consumption of the vessel is simplified to two phases: (1)
transit, estimated based on average power demand based on fixed speed; and (2) at loading/unloading point,
divided into power demand for hotel and for cargo handling (gas fuel for running the compressors). The fuel
oil price applied is 600€/t MGO. The fuel gas will be from the uploading cargo onboard the GASVESSEL. The
upstream tariff of this gas is unknown, and highly depending on the location and scenario at hand. To enable
the generalisation of the cost calculation and given that the fuel cost has low impact of the total shipping
costs (compared to high CAPEX and OPEX), it is decided to simplify the fuel gas price estimation by indexing
it on the fuel oil price (bunker price). The same approach is applied in Khalilpour & Karimi (2012)3. Factors of
25%, 50% and 75% of MGO are applied for the GASVESSEL fuel cost calculation.
The port fees for operation onshore/nearshore are estimated at 10 000€ for each port call as lumpsum costs
for pilots, tugs, agency, services, potential carbon tax etc. No port fees apply for operations offshore.
3.3.4 Unit cost The unit cost of the GASVESSEL is calculated based on total lifecycle cost (over 20 years) divided by the
quantity of gas delivered. The main assumption is that the quantity of gas delivered corresponds to the gas
demand indicated in each scenario. This is important to reflect the potential of GASVESSEL ships A and B, as
well as the volume/distance cases where GASVESSEL is not exploiting its full capacity. This aims at enabling
comparison with alternative options on the ranges predefined in the comparative analysis: volumes 0.5-15
bcm/year and distances 100-5000 km.
3 Khalilpour, R., & Karimi, I. A. (2012). Evaluation of utilization alternatives for stranded natural gas. Energy, 40(1), 317-328.
GASVESSEL – 723030 Compressed Natural Gas Transport System
_______________________________________________________________________________________
WP7 D7.2 Page | 26
3.4 GASVESSEL cost results This chapter presents the results of the cost calculation of GASVESSEL transport system. First for each of the
GASVESSEL scenarios specifically, then extrapolated to a range of volume/distance, based on a generalisation
of the cost calculation.
The scenarios established in WP2 went through several rounds of cost estimations throughout the project.
First the optimization tool from Esteco (VOLTA) was used to identify the scenarios with the best potential.
These scenarios are defined as those which maximise load factor and minimize cost. Further, the scenario
cost structure was expended in WP7's cost model by adding loading/unloading infrastructure cost, voyage
costs, updated OPEX, both to fine-tune the GASVESSEL unit cost estimate, and to enable comparison with
LNG and pipeline alternatives.
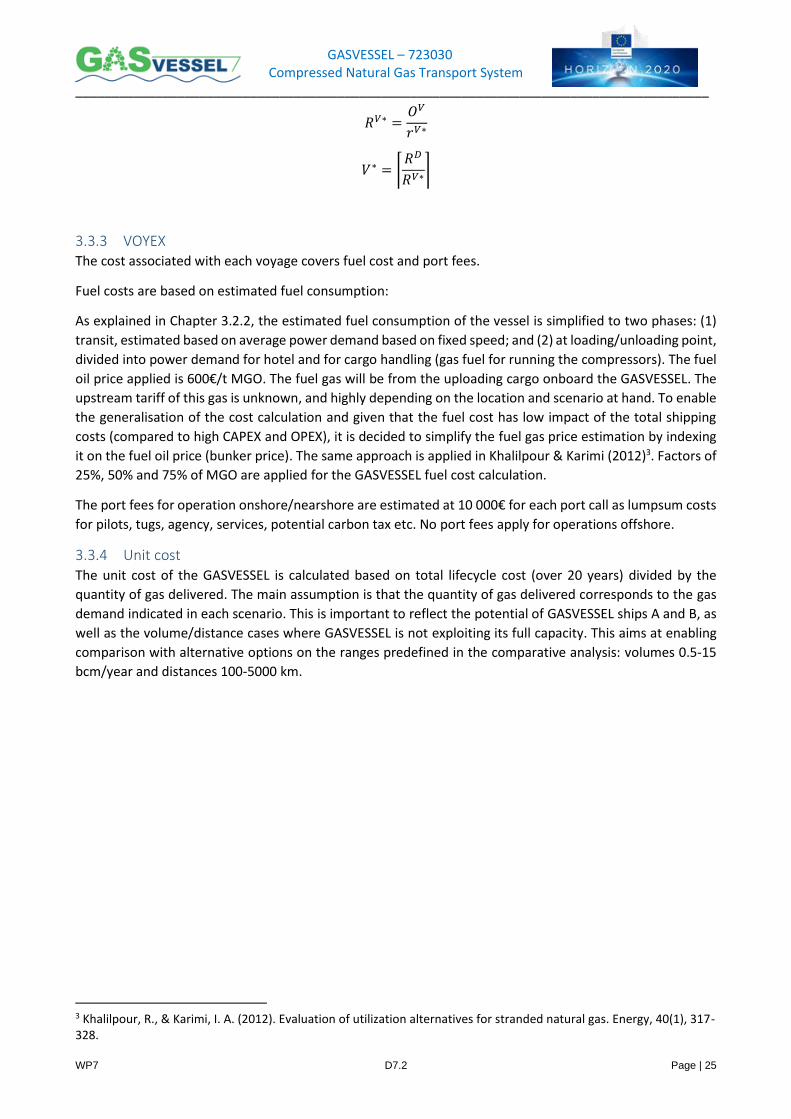
3.4.1 GASVESSEL costs: Scenarios In the following diagrams, the GASVESSEL cost for each scenario is broken down in vessel costs (CAPEX, OPEX,
VOYEX) in blue colour, loading/unloading costs (CAPEX, OPEX, including compressor related costs) in red
colour, and storage costs in green.
3.4.1.1 GASVESSEL scenarios
The main parameters for fleet estimation are constant speed of 16 knots, operational time 350 days, gas fuel
cost at 50% of fuel oil price estimate. The volume and distances are those of GASVESSEL geo-logistic
scenarios, and the ship A or B decided is specific to each case. These parameters are further explored through
the generic scenarios (Chapter 3.4.2).
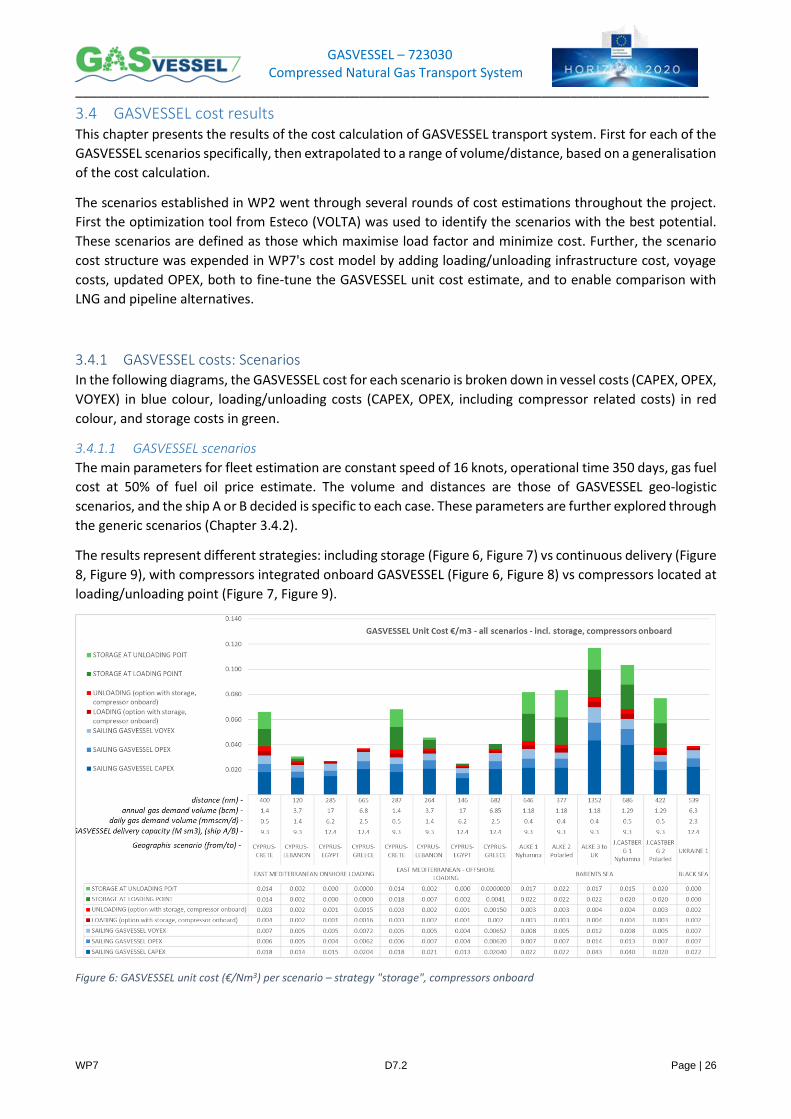
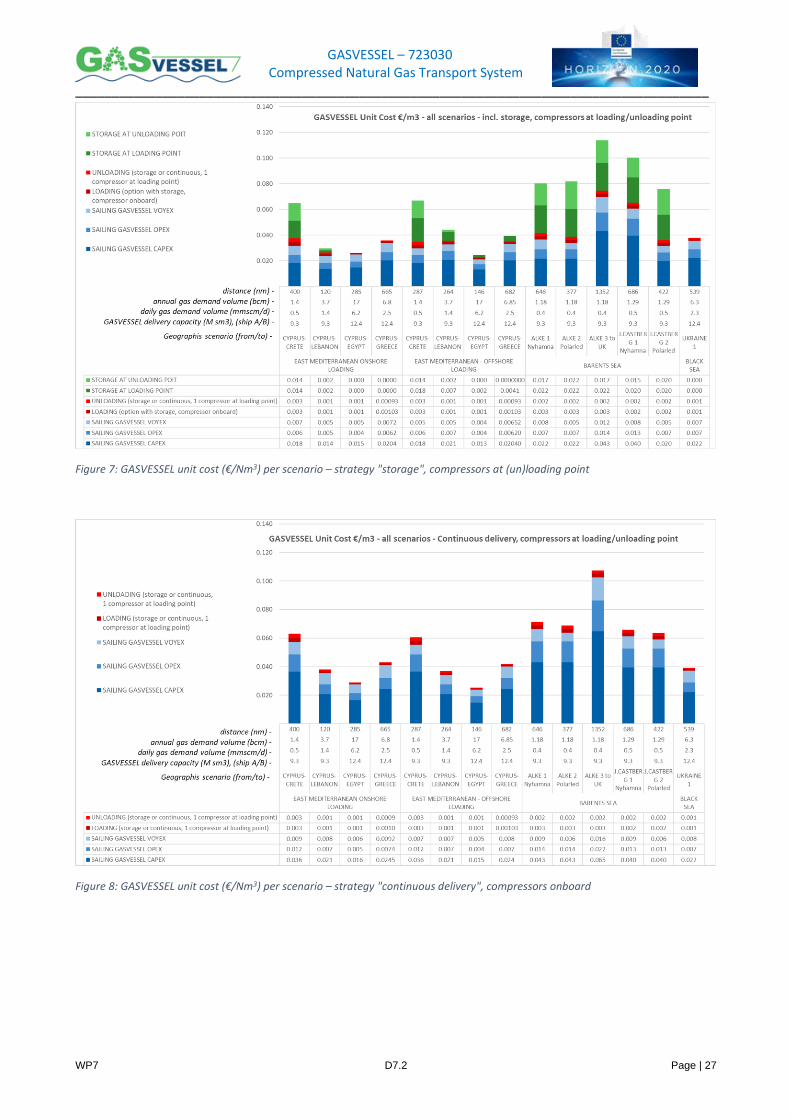
The results represent different strategies: including storage (Figure 6, Figure 7) vs continuous delivery (Figure
8, Figure 9), with compressors integrated onboard GASVESSEL (Figure 6, Figure 8) vs compressors located at
loading/unloading point (Figure 7, Figure 9).
Figure 6: GASVESSEL unit cost (€/Nm3) per scenario – strategy "storage", compressors onboard
GASVESSEL – 723030 Compressed Natural Gas Transport System
_______________________________________________________________________________________
WP7 D7.2 Page | 27
Figure 7: GASVESSEL unit cost (€/Nm3) per scenario – strategy "storage", compressors at (un)loading point
Figure 8: GASVESSEL unit cost (€/Nm3) per scenario – strategy "continuous delivery", compressors onboard
GASVESSEL – 723030 Compressed Natural Gas Transport System
_______________________________________________________________________________________
WP7 D7.2 Page | 28
Figure 9: GASVESSEL unit cost (€/Nm3) per scenario – strategy "continuous delivery", compressors at (un)loading point
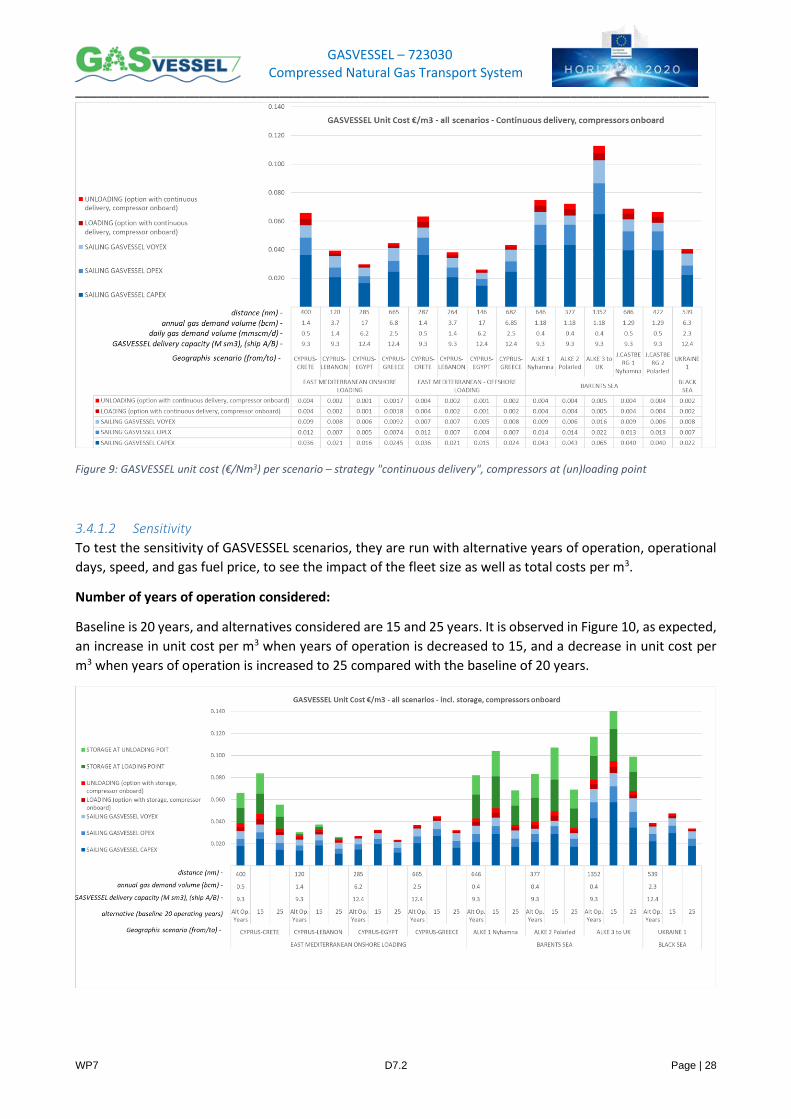
3.4.1.2 Sensitivity
To test the sensitivity of GASVESSEL scenarios, they are run with alternative years of operation, operational
days, speed, and gas fuel price, to see the impact of the fleet size as well as total costs per m3.
Number of years of operation considered:
Baseline is 20 years, and alternatives considered are 15 and 25 years. It is observed in Figure 10, as expected,
an increase in unit cost per m3 when years of operation is decreased to 15, and a decrease in unit cost per
m3 when years of operation is increased to 25 compared with the baseline of 20 years.
GASVESSEL – 723030 Compressed Natural Gas Transport System
_______________________________________________________________________________________
WP7 D7.2 Page | 29
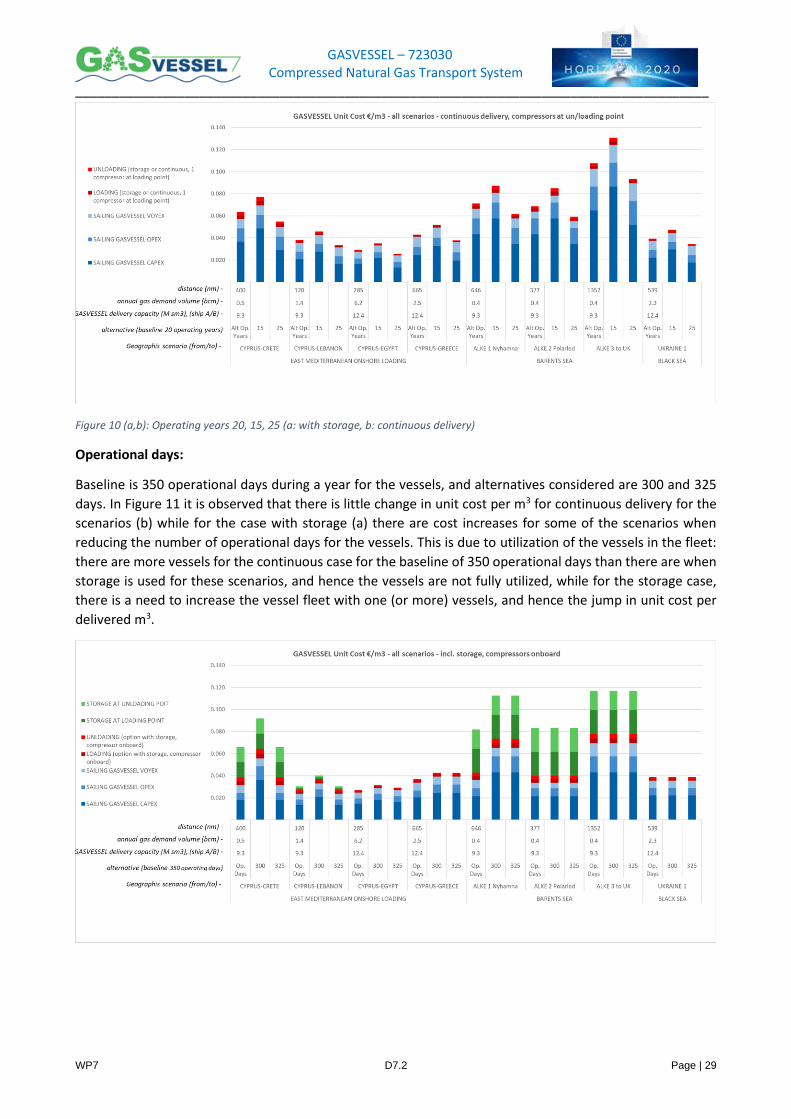
Figure 10 (a,b): Operating years 20, 15, 25 (a: with storage, b: continuous delivery)
Operational days:
Baseline is 350 operational days during a year for the vessels, and alternatives considered are 300 and 325
days. In Figure 11 it is observed that there is little change in unit cost per m3 for continuous delivery for the
scenarios (b) while for the case with storage (a) there are cost increases for some of the scenarios when
reducing the number of operational days for the vessels. This is due to utilization of the vessels in the fleet:
there are more vessels for the continuous case for the baseline of 350 operational days than there are when
storage is used for these scenarios, and hence the vessels are not fully utilized, while for the storage case,
there is a need to increase the vessel fleet with one (or more) vessels, and hence the jump in unit cost per
delivered m3.
GASVESSEL – 723030 Compressed Natural Gas Transport System
_______________________________________________________________________________________
WP7 D7.2 Page | 30
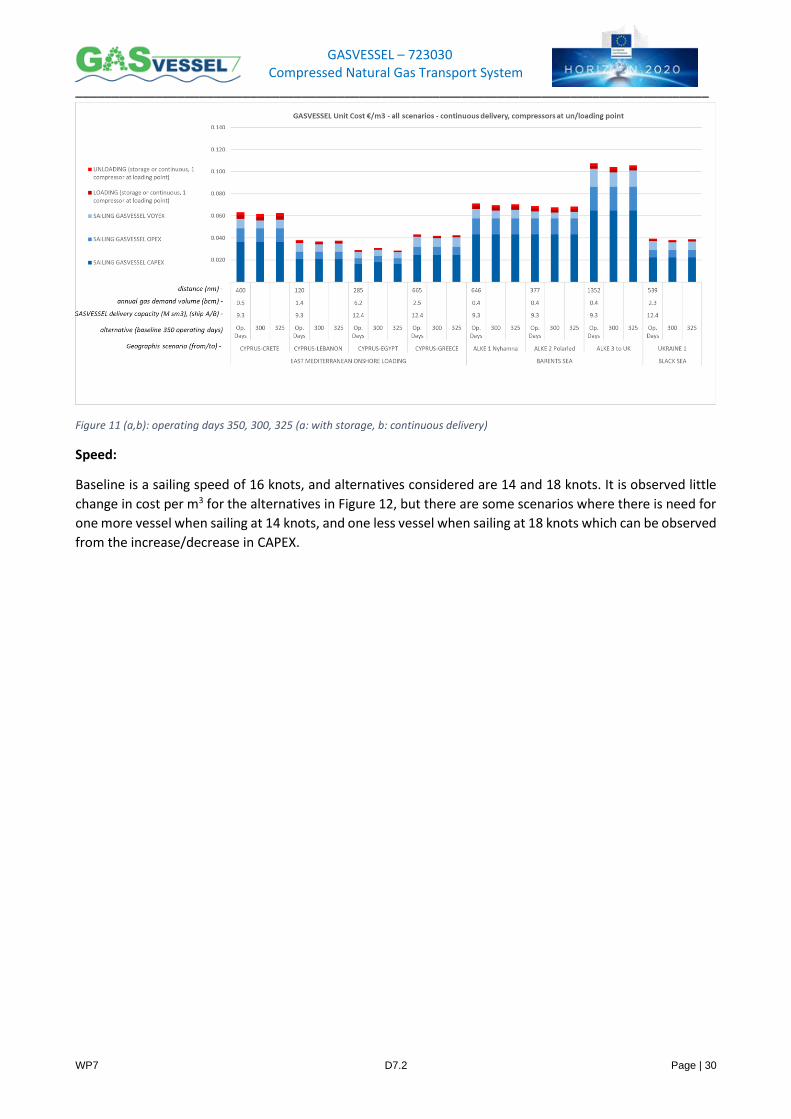
Figure 11 (a,b): operating days 350, 300, 325 (a: with storage, b: continuous delivery)
Speed:
Baseline is a sailing speed of 16 knots, and alternatives considered are 14 and 18 knots. It is observed little
change in cost per m3 for the alternatives in Figure 12, but there are some scenarios where there is need for
one more vessel when sailing at 14 knots, and one less vessel when sailing at 18 knots which can be observed
from the increase/decrease in CAPEX.
GASVESSEL – 723030 Compressed Natural Gas Transport System
_______________________________________________________________________________________
WP7 D7.2 Page | 31
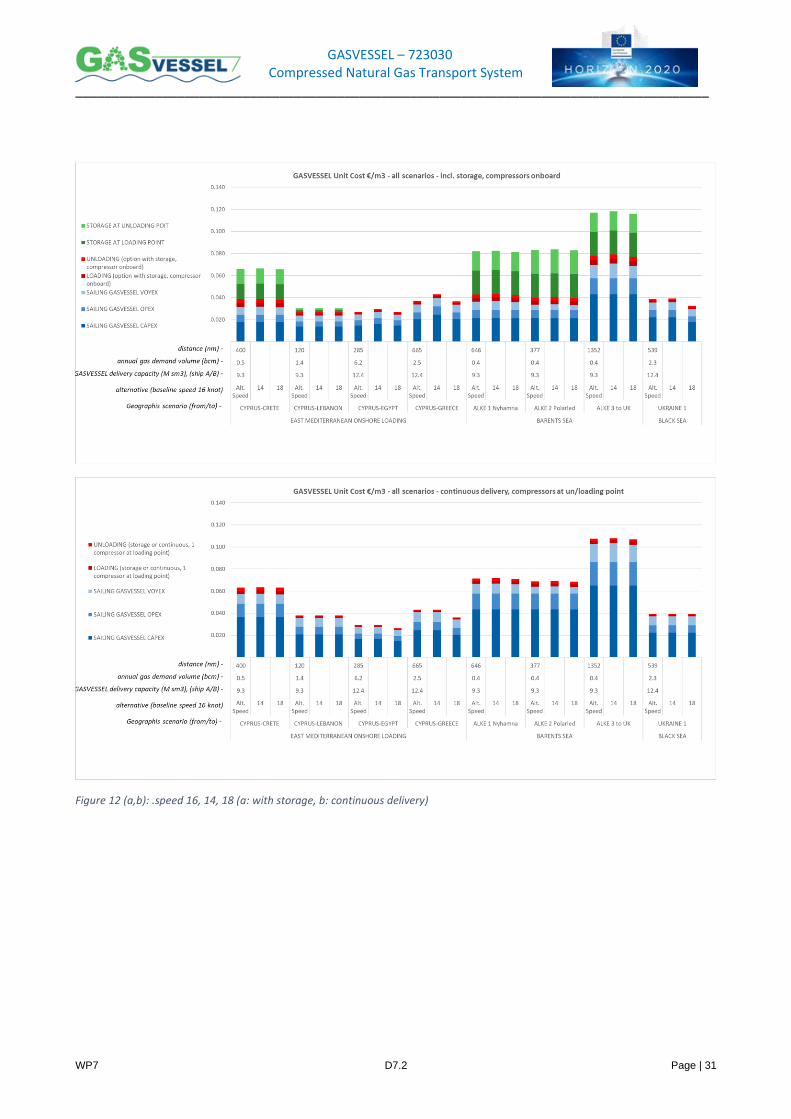
Figure 12 (a,b): .speed 16, 14, 18 (a: with storage, b: continuous delivery)
GASVESSEL – 723030 Compressed Natural Gas Transport System
_______________________________________________________________________________________
WP7 D7.2 Page | 32
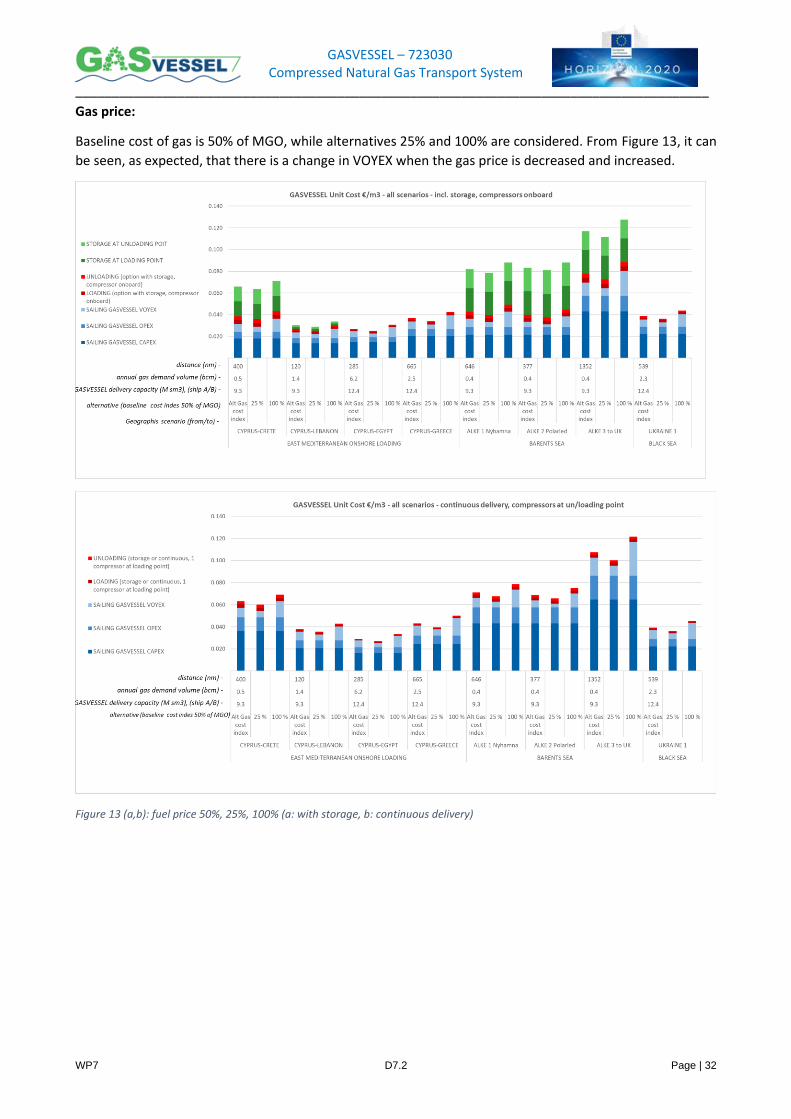
Gas price:
Baseline cost of gas is 50% of MGO, while alternatives 25% and 100% are considered. From Figure 13, it can
be seen, as expected, that there is a change in VOYEX when the gas price is decreased and increased.
Figure 13 (a,b): fuel price 50%, 25%, 100% (a: with storage, b: continuous delivery)
GASVESSEL – 723030 Compressed Natural Gas Transport System
_______________________________________________________________________________________
WP7 D7.2 Page | 33
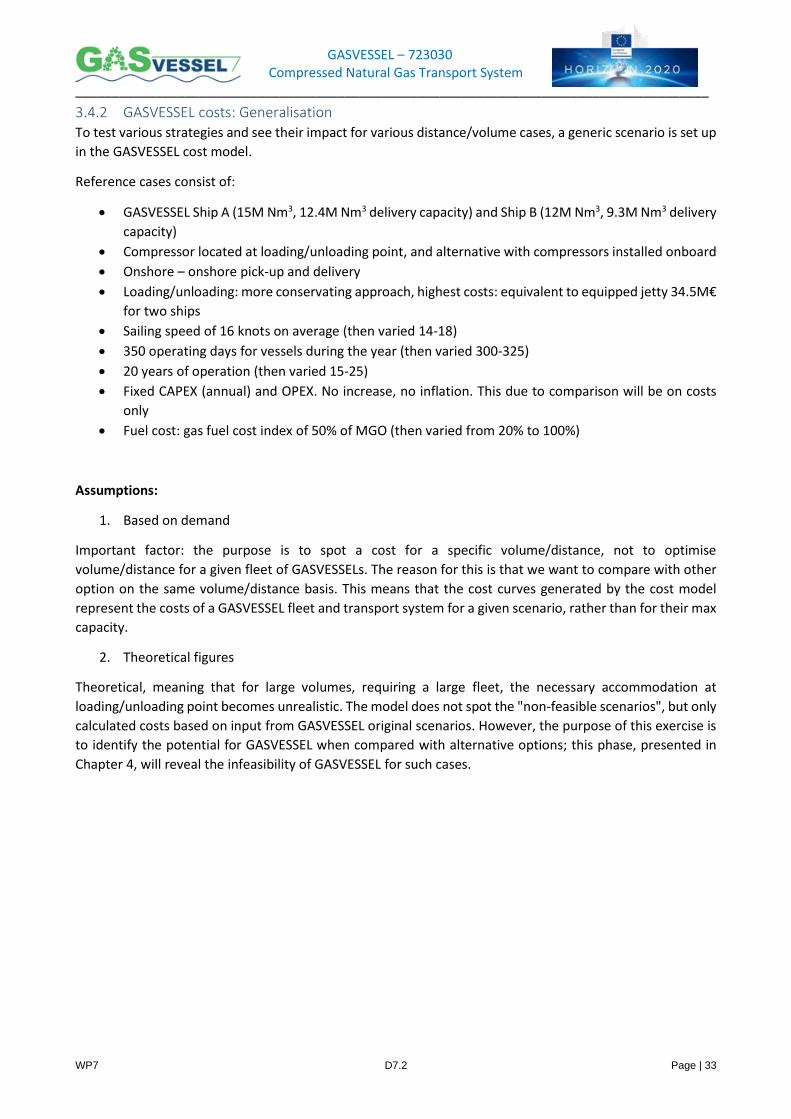
3.4.2 GASVESSEL costs: Generalisation To test various strategies and see their impact for various distance/volume cases, a generic scenario is set up
in the GASVESSEL cost model.
Reference cases consist of:
• GASVESSEL Ship A (15M Nm3, 12.4M Nm3 delivery capacity) and Ship B (12M Nm3, 9.3M Nm3 delivery
capacity)
• Compressor located at loading/unloading point, and alternative with compressors installed onboard
• Onshore – onshore pick-up and delivery
• Loading/unloading: more conservating approach, highest costs: equivalent to equipped jetty 34.5M€
for two ships
• Sailing speed of 16 knots on average (then varied 14-18)
• 350 operating days for vessels during the year (then varied 300-325)
• 20 years of operation (then varied 15-25)
• Fixed CAPEX (annual) and OPEX. No increase, no inflation. This due to comparison will be on costs
only
• Fuel cost: gas fuel cost index of 50% of MGO (then varied from 20% to 100%)
Assumptions:
1. Based on demand
Important factor: the purpose is to spot a cost for a specific volume/distance, not to optimise
volume/distance for a given fleet of GASVESSELs. The reason for this is that we want to compare with other
option on the same volume/distance basis. This means that the cost curves generated by the cost model
represent the costs of a GASVESSEL fleet and transport system for a given scenario, rather than for their max
capacity.
2. Theoretical figures
Theoretical, meaning that for large volumes, requiring a large fleet, the necessary accommodation at
loading/unloading point becomes unrealistic. The model does not spot the "non-feasible scenarios", but only
calculated costs based on input from GASVESSEL original scenarios. However, the purpose of this exercise is
to identify the potential for GASVESSEL when compared with alternative options; this phase, presented in
Chapter 4, will reveal the infeasibility of GASVESSEL for such cases.
GASVESSEL – 723030 Compressed Natural Gas Transport System
_______________________________________________________________________________________
WP7 D7.2 Page | 34
Continuous delivery, compressors at un/loading point.
Figure 14: GASVESSEL unit cost per distance (100-5000km) and annual volume (0.5-15 bcm) , based on onshore-onshore case, Ship B (12M Nm3), compressor at (un)loading point, continuous delivery
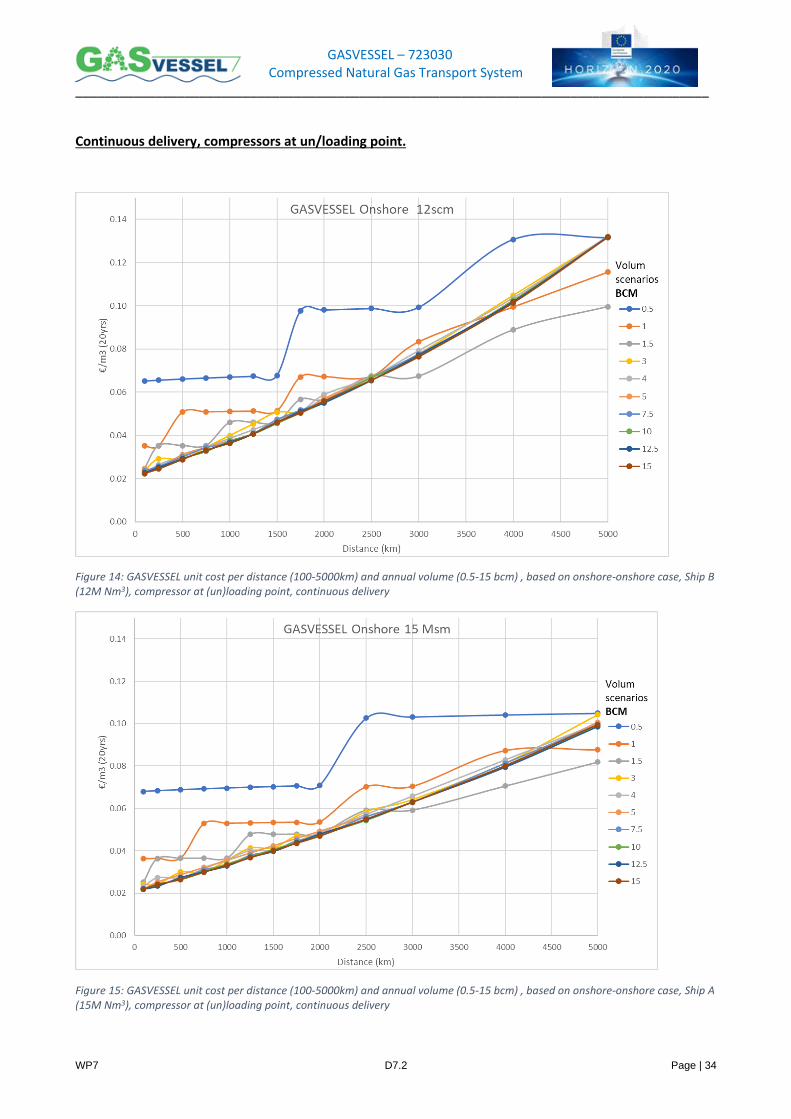
Figure 15: GASVESSEL unit cost per distance (100-5000km) and annual volume (0.5-15 bcm) , based on onshore-onshore case, Ship A (15M Nm3), compressor at (un)loading point, continuous delivery
GASVESSEL – 723030 Compressed Natural Gas Transport System
_______________________________________________________________________________________
WP7 D7.2 Page | 35
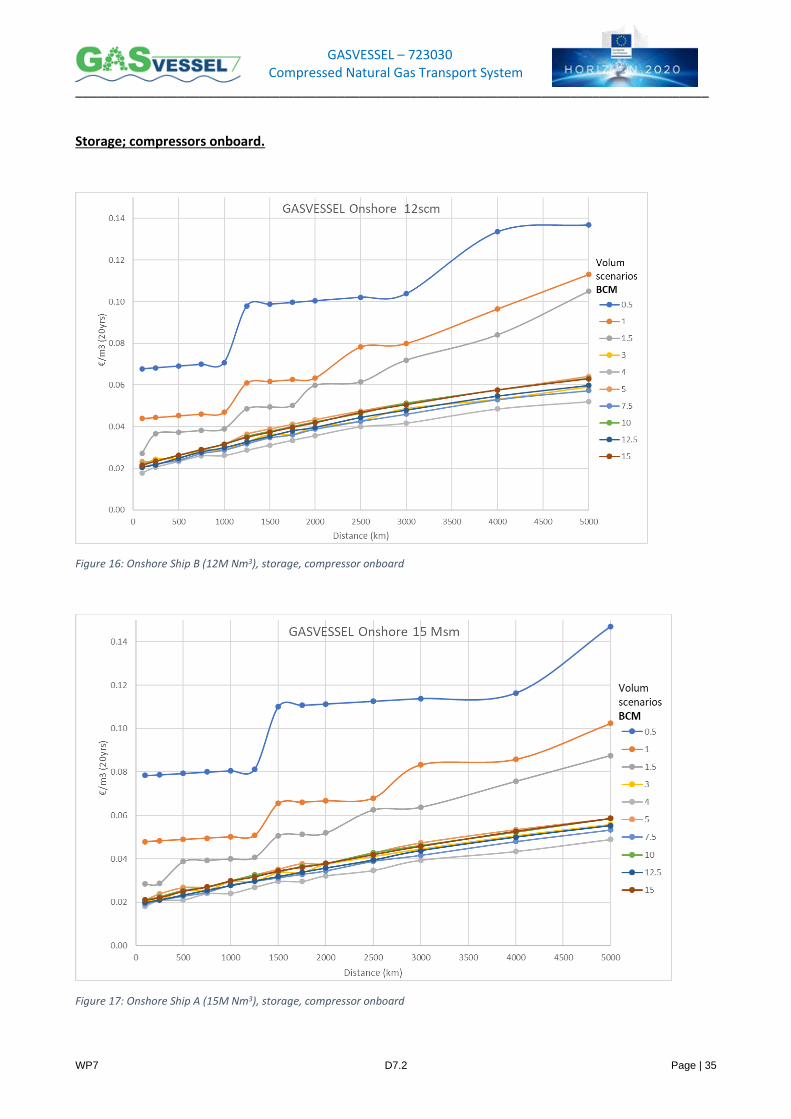
Storage; compressors onboard.
Figure 16: Onshore Ship B (12M Nm3), storage, compressor onboard
Figure 17: Onshore Ship A (15M Nm3), storage, compressor onboard
GASVESSEL – 723030 Compressed Natural Gas Transport System
_______________________________________________________________________________________
WP7 D7.2 Page | 36
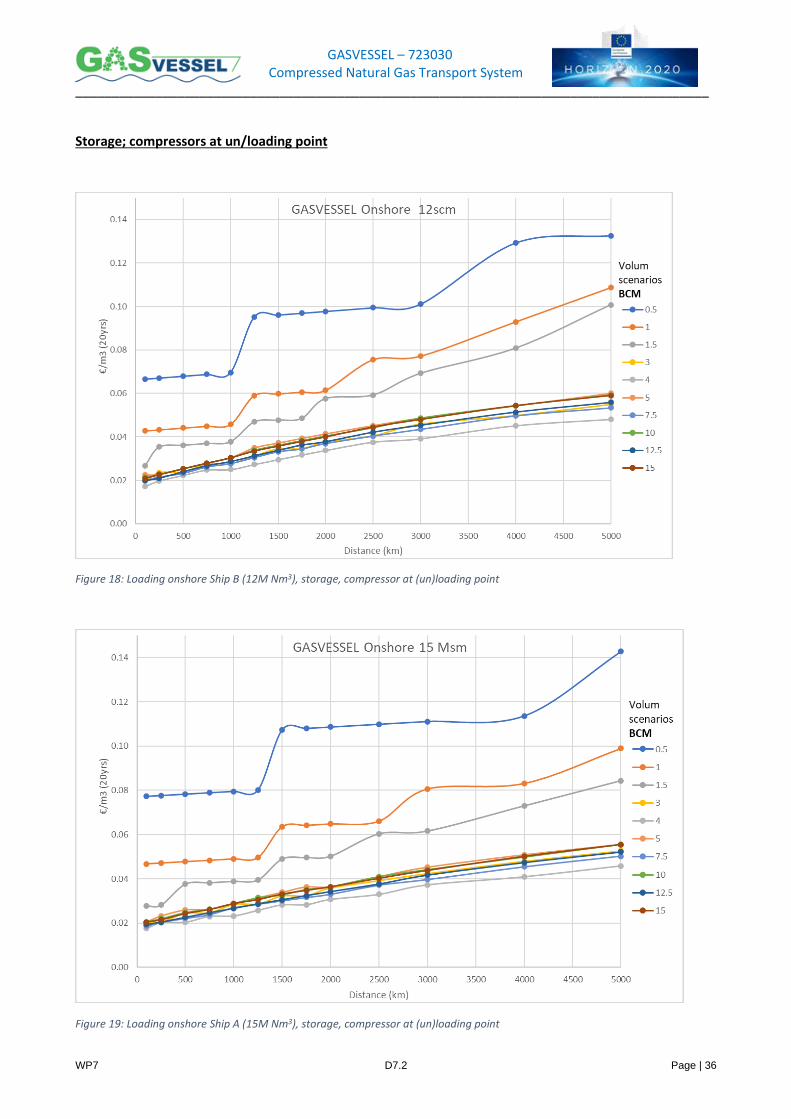
Storage; compressors at un/loading point
Figure 18: Loading onshore Ship B (12M Nm3), storage, compressor at (un)loading point
Figure 19: Loading onshore Ship A (15M Nm3), storage, compressor at (un)loading point
GASVESSEL – 723030 Compressed Natural Gas Transport System
_______________________________________________________________________________________
WP7 D7.2 Page | 37
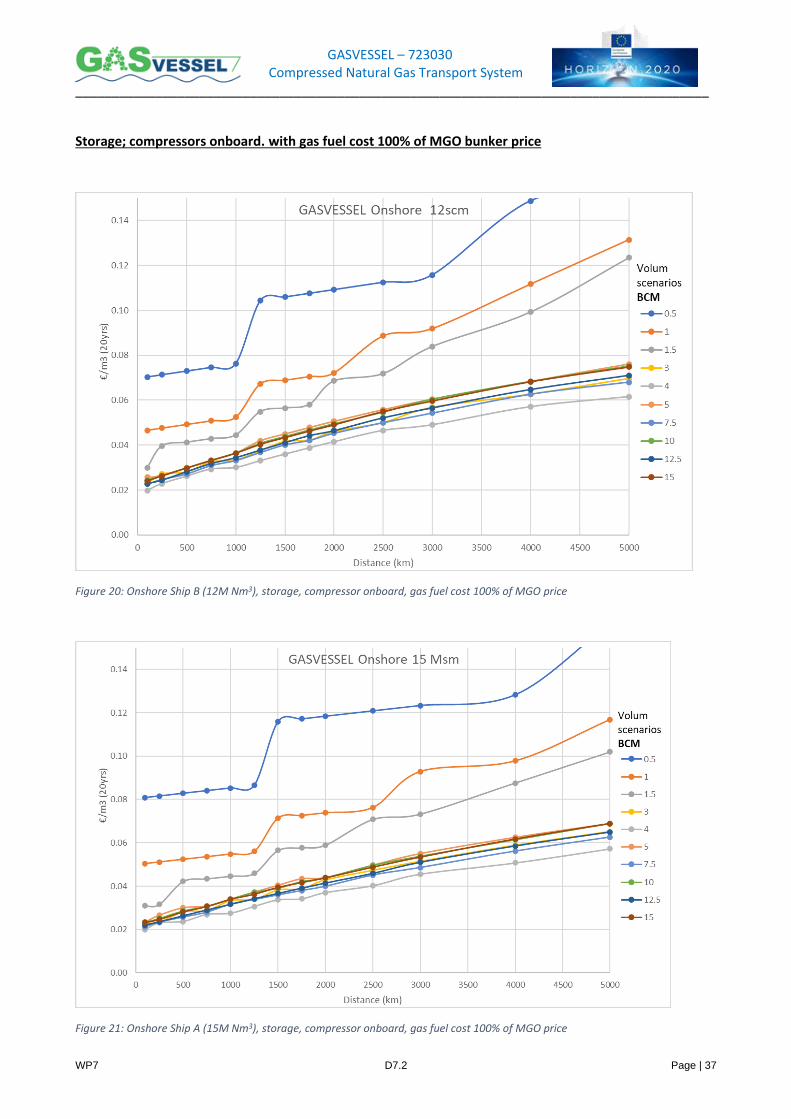
Storage; compressors onboard. with gas fuel cost 100% of MGO bunker price
Figure 20: Onshore Ship B (12M Nm3), storage, compressor onboard, gas fuel cost 100% of MGO price
Figure 21: Onshore Ship A (15M Nm3), storage, compressor onboard, gas fuel cost 100% of MGO price
GASVESSEL – 723030 Compressed Natural Gas Transport System
_______________________________________________________________________________________
WP7 D7.2 Page | 38
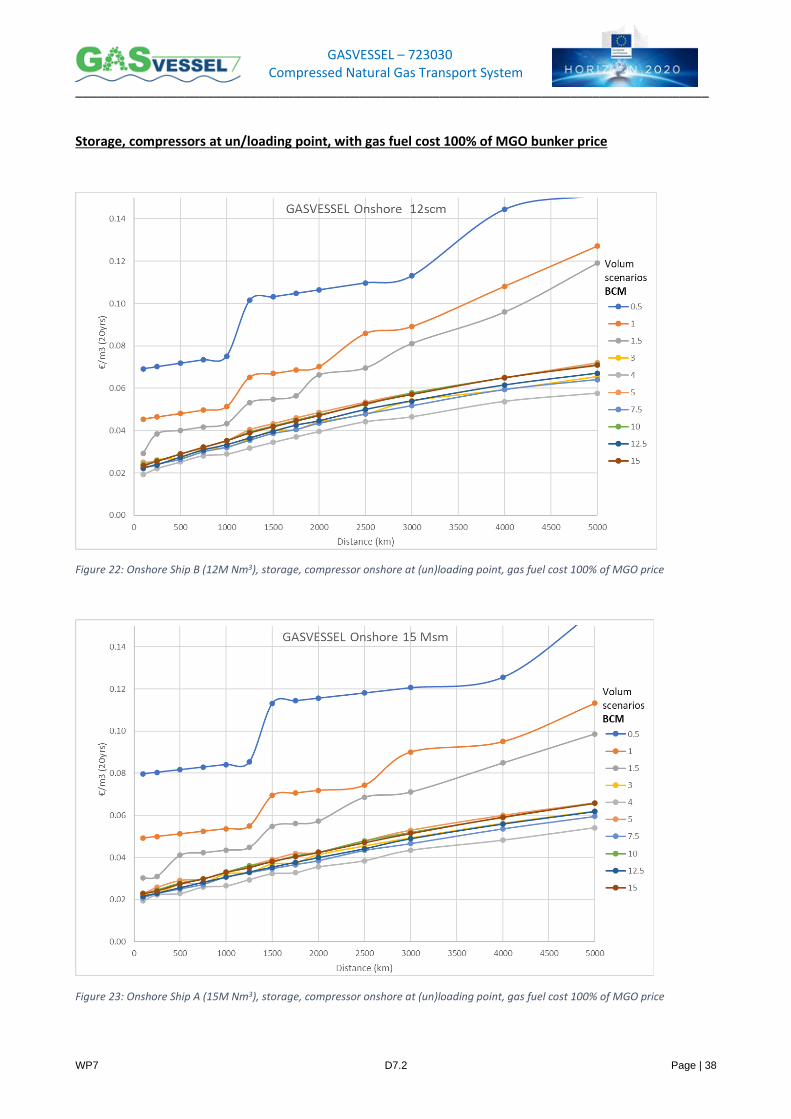
Storage, compressors at un/loading point, with gas fuel cost 100% of MGO bunker price
Figure 22: Onshore Ship B (12M Nm3), storage, compressor onshore at (un)loading point, gas fuel cost 100% of MGO price
Figure 23: Onshore Ship A (15M Nm3), storage, compressor onshore at (un)loading point, gas fuel cost 100% of MGO price
GASVESSEL – 723030 Compressed Natural Gas Transport System
_______________________________________________________________________________________
WP7 D7.2 Page | 39
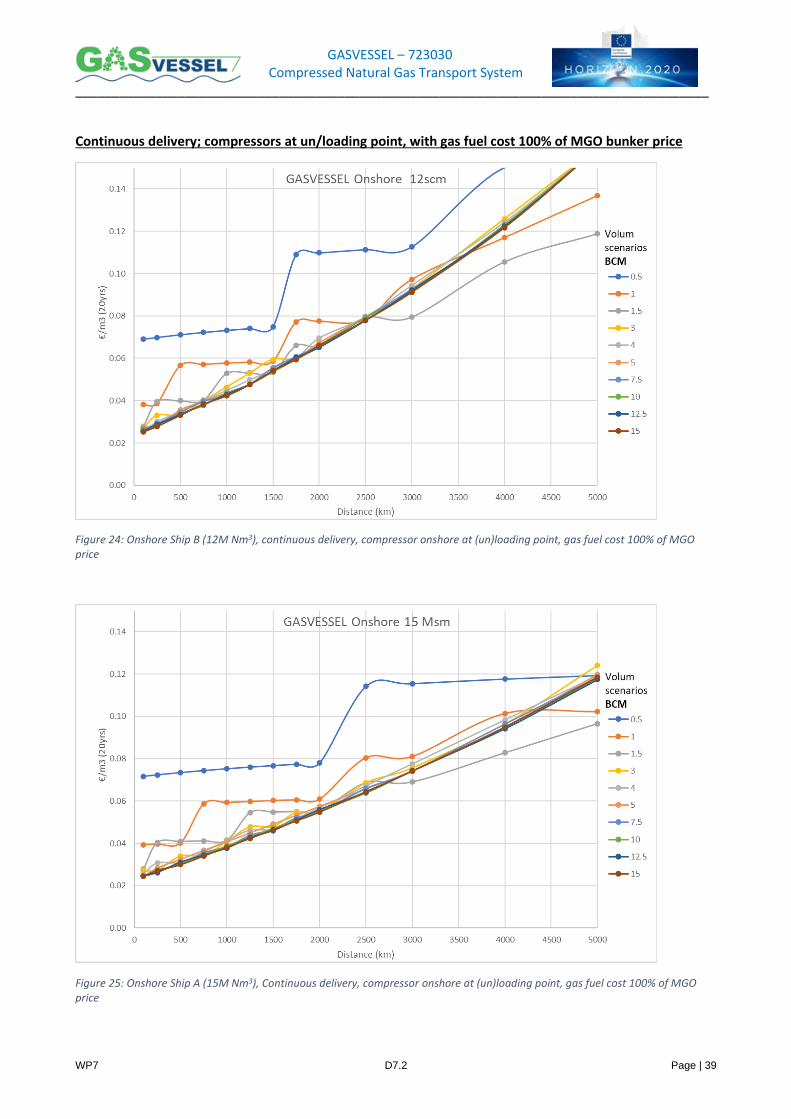
Continuous delivery; compressors at un/loading point, with gas fuel cost 100% of MGO bunker price
Figure 24: Onshore Ship B (12M Nm3), continuous delivery, compressor onshore at (un)loading point, gas fuel cost 100% of MGO price
Figure 25: Onshore Ship A (15M Nm3), Continuous delivery, compressor onshore at (un)loading point, gas fuel cost 100% of MGO price
GASVESSEL – 723030 Compressed Natural Gas Transport System
_______________________________________________________________________________________
WP7 D7.2 Page | 40
4 Comparative Analysis The purpose of the comparative study is to identify the conditions for which GASVESSEL is cost competitive
against alternatives pipeline and LNG. The comparison GASVESSEL-LNG-PIPELINE consists of two parts:
Scenario specific comparison and Generic comparison for a wider range of distance/volume, based on
extrapolation of the scenario specific data.
4.1 Method The method for building the comparison consists of:
1. Scenario specific costs:
a. For each GASVESSEL scenario, GASVESSEL unit costs are identified - Chap 3.4.1
b. LNG and PIPELINE related cost for the same scenarios are estimated - Chap 4.2.1 and 4.2.2
c. Comparison diagrams for specific scenarios are generated - Chap 4.3.1
2. Generic comparison:
a. Based on the data from GASVESSEL scenarios, LNG and pipeline costs corresponding to a
wider range of distance/volume are extrapolated - Chap 4.3.2.1
b. These are compared to GASVESSEL generic cost curves. The cost comparison for
volume/distance ranges of 0.5-15 bcm/year and 100-5000 km is established to visualise the
niche of competitiveness for GASVESSEL - Chap 4.3.2.2
The generic scenario assumes no utilization of existing infrastructure for LNG, pipeline or GASVESSEL to
ensure fair comparison and facilitate the generalisation of the cases to a wider range of distance/volumes.
The comparison is based exclusively on cost. No "stranded" or "economically unfeasible" range is highlighted
in the comparison plots.
The scope of the comparison is from loading point to unloading point. Necessary facility for storage and
infrastructure for loading/unloading are included in the comparison, but no upstream costs related to
production or upstream logistics, nor downstream distribution to end customer is considered.
GASVESSEL – 723030 Compressed Natural Gas Transport System
_______________________________________________________________________________________
WP7 D7.2 Page | 41
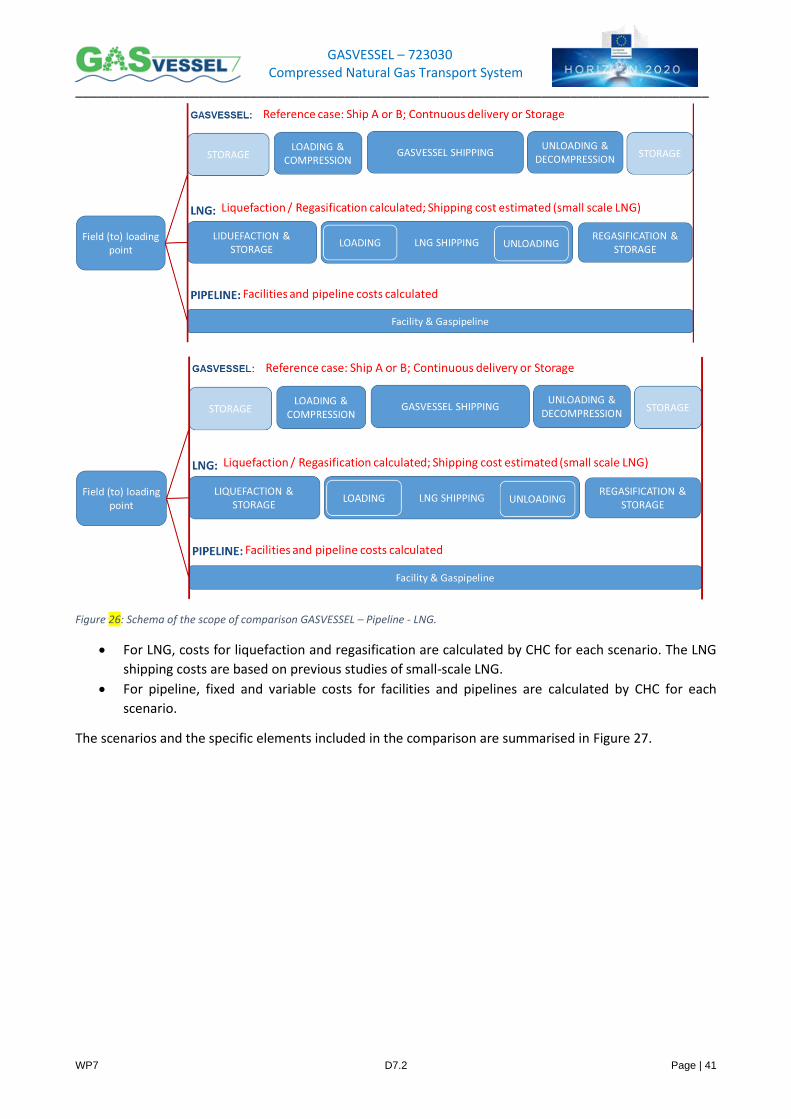
Figure 26: Schema of the scope of comparison GASVESSEL – Pipeline - LNG.
• For LNG, costs for liquefaction and regasification are calculated by CHC for each scenario. The LNG
shipping costs are based on previous studies of small-scale LNG.
• For pipeline, fixed and variable costs for facilities and pipelines are calculated by CHC for each
scenario.
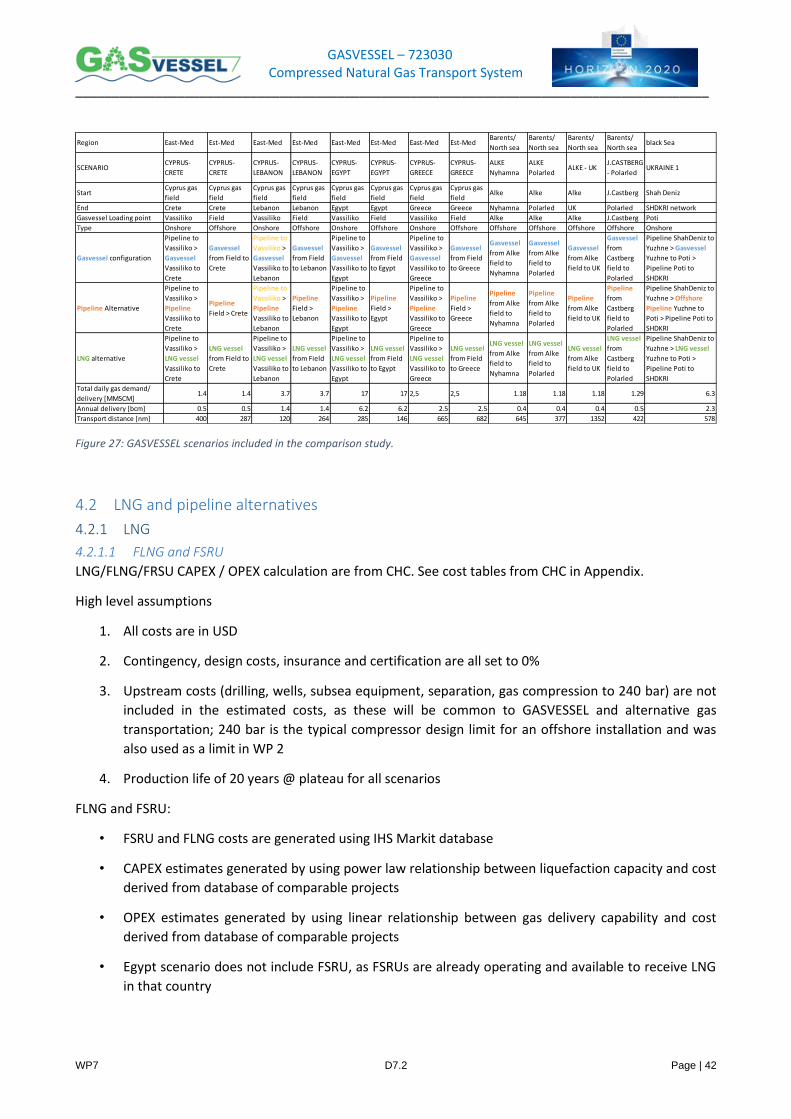
The scenarios and the specific elements included in the comparison are summarised in Figure 27.
GASVESSEL – 723030 Compressed Natural Gas Transport System
_______________________________________________________________________________________
WP7 D7.2 Page | 42
Figure 27: GASVESSEL scenarios included in the comparison study.
4.2 LNG and pipeline alternatives
4.2.1 LNG
4.2.1.1 FLNG and FSRU
LNG/FLNG/FRSU CAPEX / OPEX calculation are from CHC. See cost tables from CHC in Appendix.
High level assumptions
1. All costs are in USD
2. Contingency, design costs, insurance and certification are all set to 0%
3. Upstream costs (drilling, wells, subsea equipment, separation, gas compression to 240 bar) are not
included in the estimated costs, as these will be common to GASVESSEL and alternative gas
transportation; 240 bar is the typical compressor design limit for an offshore installation and was
also used as a limit in WP 2
4. Production life of 20 years @ plateau for all scenarios
FLNG and FSRU:
• FSRU and FLNG costs are generated using IHS Markit database
• CAPEX estimates generated by using power law relationship between liquefaction capacity and cost
derived from database of comparable projects
• OPEX estimates generated by using linear relationship between gas delivery capability and cost
derived from database of comparable projects
• Egypt scenario does not include FSRU, as FSRUs are already operating and available to receive LNG
in that country
Region East-Med Est-Med East-Med Est-Med East-Med Est-Med East-Med Est-MedBarents/
North sea
Barents/
North sea
Barents/
North sea
Barents/
North seablack Sea
SCENARIOCYPRUS-
CRETE
CYPRUS-
CRETE
CYPRUS-
LEBANON
CYPRUS-
LEBANON
CYPRUS-
EGYPT
CYPRUS-
EGYPT
CYPRUS-
GREECE
CYPRUS-
GREECE
ALKE
Nyhamna
ALKE
PolarledALKE - UK
J.CASTBERG
- PolarledUKRAINE 1
StartCyprus gas
field
Cyprus gas
field
Cyprus gas
field
Cyprus gas
field
Cyprus gas
field
Cyprus gas
field
Cyprus gas
field
Cyprus gas
fieldAlke Alke Alke J.Castberg Shah Deniz
End Crete Crete Lebanon Lebanon Egypt Egypt Greece Greece Nyhamna Polarled UK Polarled SHDKRI network
Gasvessel Loading point Vassiliko Field Vassiliko Field Vassiliko Field Vassiliko Field Alke Alke Alke J.Castberg Poti
Type Onshore Offshore Onshore Offshore Onshore Offshore Onshore Offshore Offshore Offshore Offshore Offshore Onshore
Gasvessel configuration
Pipeline to
Vassiliko >
Gasvessel
Vassiliko to
Crete
Gasvessel
from Field to
Crete
Pipeline to
Vassiliko >
Gasvessel
Vassiliko to
Lebanon
Gasvessel
from Field
to Lebanon
Pipeline to
Vassiliko >
Gasvessel
Vassiliko to
Egypt
Gasvessel
from Field
to Egypt
Pipeline to
Vassiliko >
Gasvessel
Vassiliko to
Greece
Gasvessel
from Field
to Greece
Gasvessel
from Alke
field to
Nyhamna
Gasvessel
from Alke
field to
Polarled
Gasvessel
from Alke
field to UK
Gasvessel
from
Castberg
field to
Polarled
Pipeline ShahDeniz to
Yuzhne > Gasvessel
Yuzhne to Poti >
Pipeline Poti to
SHDKRI
Pipeline Alternative
Pipeline to
Vassiliko >
Pipeline
Vassiliko to
Crete
Pipeline
Field > Crete
Pipeline to
Vassiliko >
Pipeline
Vassiliko to
Lebanon
Pipeline
Field >
Lebanon
Pipeline to
Vassiliko >
Pipeline
Vassiliko to
Egypt
Pipeline
Field >
Egypt
Pipeline to
Vassiliko >
Pipeline
Vassiliko to
Greece
Pipeline
Field >
Greece
Pipeline
from Alke
field to
Nyhamna
Pipeline
from Alke
field to
Polarled
Pipeline
from Alke
field to UK
Pipeline
from
Castberg
field to
Polarled
Pipeline ShahDeniz to
Yuzhne > Offshore
Pipeline Yuzhne to
Poti > Pipeline Poti to
SHDKRI
LNG alternative
Pipeline to
Vassiliko >
LNG vessel
Vassiliko to
Crete
LNG vessel
from Field to
Crete
Pipeline to
Vassiliko >
LNG vessel
Vassiliko to
Lebanon
LNG vessel
from Field
to Lebanon
Pipeline to
Vassiliko >
LNG vessel
Vassiliko to
Egypt
LNG vessel
from Field
to Egypt
Pipeline to
Vassiliko >
LNG vessel
Vassiliko to
Greece
LNG vessel
from Field
to Greece
LNG vessel
from Alke
field to
Nyhamna
LNG vessel
from Alke
field to
Polarled
LNG vessel
from Alke
field to UK
LNG vessel
from
Castberg
field to
Polarled
Pipeline ShahDeniz to
Yuzhne > LNG vessel
Yuzhne to Poti >
Pipeline Poti to
SHDKRI
Total daily gas demand/
delivery [MMSCM]1.4 1.4 3.7 3.7 17 17 2,5 2,5 1.18 1.18 1.18 1.29 6.3
Annual delivery [bcm] 0.5 0.5 1.4 1.4 6.2 6.2 2.5 2.5 0.4 0.4 0.4 0.5 2.3
Transport distance [nm] 400 287 120 264 285 146 665 682 645 377 1352 422 578
GASVESSEL – 723030 Compressed Natural Gas Transport System
_______________________________________________________________________________________
WP7 D7.2 Page | 43
• For the LNG cases, an onshore LNG terminal is included at Vasilkos for the Egypt case, and nearshore
FLNG moored at Vasilkos Port for the other cases
• For the lower production cases nearshore, FLNG is a better comparison to the GASVESSEL
option, and is more cost-effective than for land-based LNG
• Nearshore FLNG vessels are limited to about 2.5 mtpa, so cannot be used for cases larger
than this
• NFLNG cases include the costs of a jetty and offloading equipment
• Onshore costs for the processing facility include equipment required to process gas to required
GASVESSEL/pipeline/FLNG specification, i.e., dew pointing, dehydration, etc.
4.2.1.2 LNG Shipping
LNG shipping costs are estimated based on secondary sources. As benchmark:
(1) LNG rate for a 155 000 m3 LNG carrier, with long term charter rates, boil off gas priced at $6/mmbtu
and return voyage is approximately $0.22/mmbtu (Source CHC, based om market data).
Corresponding to appr. 0.007€/Nm3.
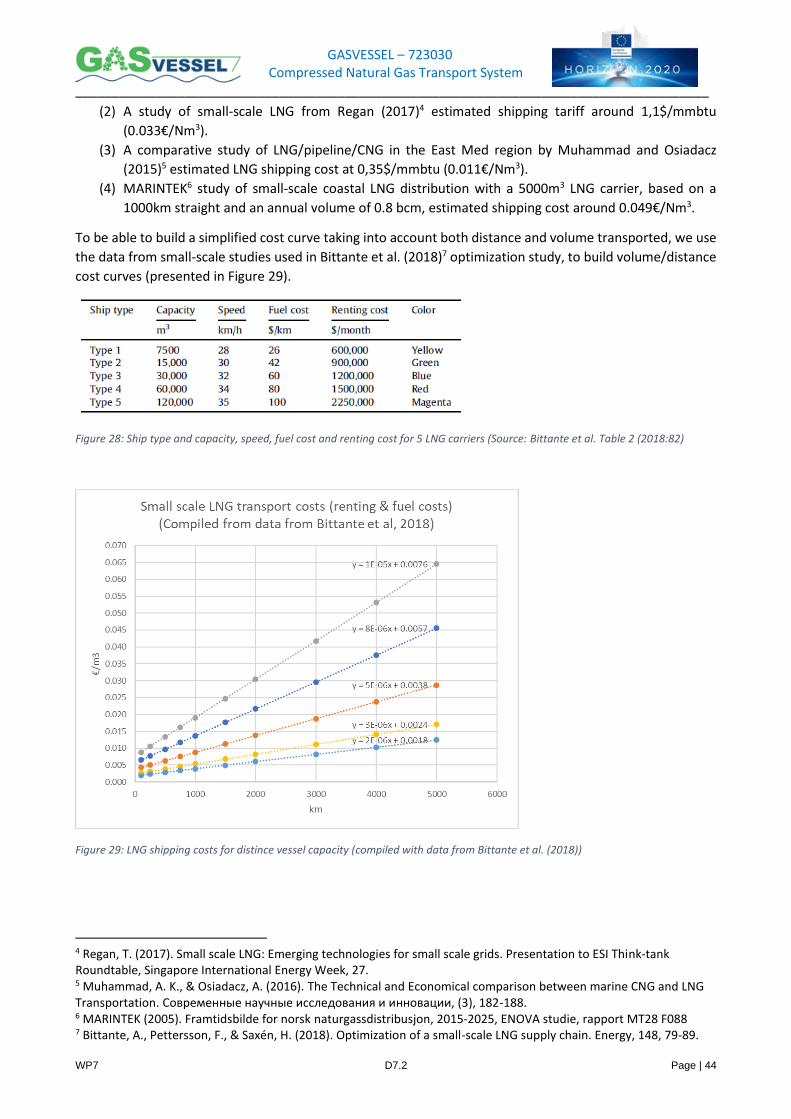
GASVESSEL – 723030 Compressed Natural Gas Transport System
_______________________________________________________________________________________
WP7 D7.2 Page | 44
(2) A study of small-scale LNG from Regan (2017)4 estimated shipping tariff around 1,1$/mmbtu
(0.033€/Nm3).
(3) A comparative study of LNG/pipeline/CNG in the East Med region by Muhammad and Osiadacz
(2015)5 estimated LNG shipping cost at 0,35$/mmbtu (0.011€/Nm3).
(4) MARINTEK6 study of small-scale coastal LNG distribution with a 5000m3 LNG carrier, based on a
1000km straight and an annual volume of 0.8 bcm, estimated shipping cost around 0.049€/Nm3.
To be able to build a simplified cost curve taking into account both distance and volume transported, we use
the data from small-scale studies used in Bittante et al. (2018)7 optimization study, to build volume/distance
cost curves (presented in Figure 29).
Figure 28: Ship type and capacity, speed, fuel cost and renting cost for 5 LNG carriers (Source: Bittante et al. Table 2 (2018:82)
Figure 29: LNG shipping costs for distince vessel capacity (compiled with data from Bittante et al. (2018))
4 Regan, T. (2017). Small scale LNG: Emerging technologies for small scale grids. Presentation to ESI Think-tank Roundtable, Singapore International Energy Week, 27. 5 Muhammad, A. K., & Osiadacz, A. (2016). The Technical and Economical comparison between marine CNG and LNG Transportation. Современные научные исследования и инновации, (3), 182-188. 6 MARINTEK (2005). Framtidsbilde for norsk naturgassdistribusjon, 2015-2025, ENOVA studie, rapport MT28 F088 7 Bittante, A., Pettersson, F., & Saxén, H. (2018). Optimization of a small-scale LNG supply chain. Energy, 148, 79-89.
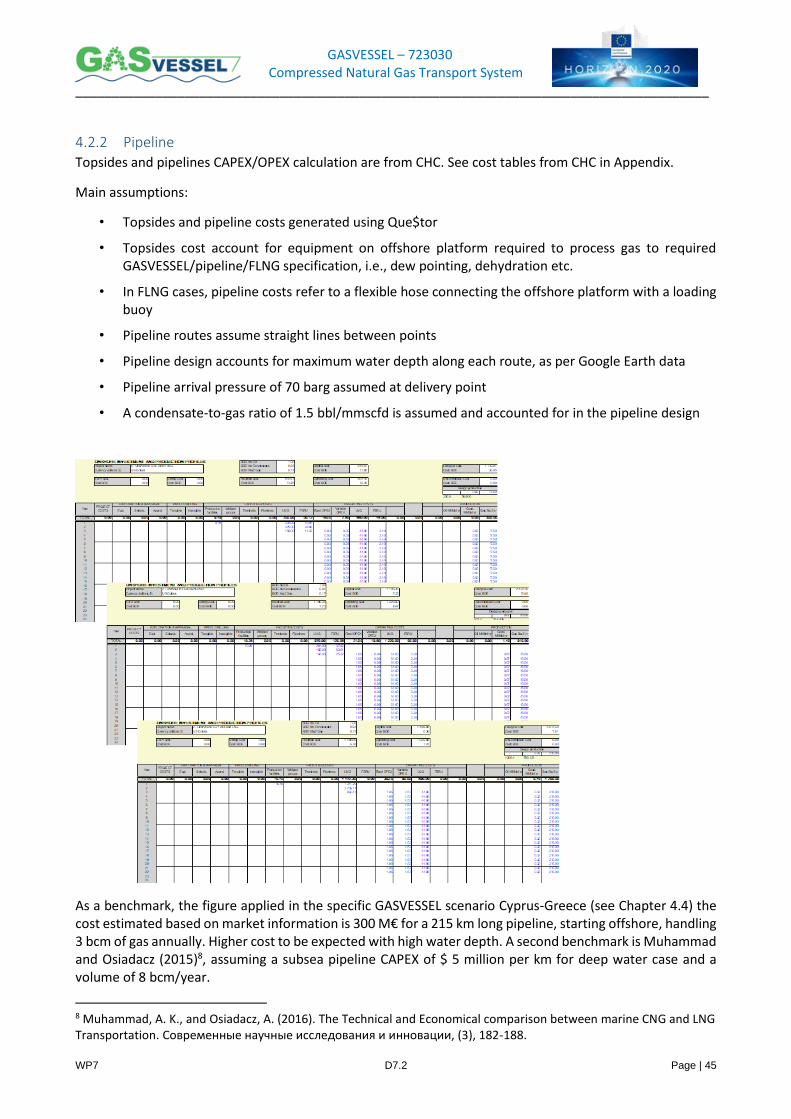
GASVESSEL – 723030 Compressed Natural Gas Transport System
_______________________________________________________________________________________
WP7 D7.2 Page | 45
4.2.2 Pipeline Topsides and pipelines CAPEX/OPEX calculation are from CHC. See cost tables from CHC in Appendix.
Main assumptions:
• Topsides and pipeline costs generated using Que$tor
• Topsides cost account for equipment on offshore platform required to process gas to required GASVESSEL/pipeline/FLNG specification, i.e., dew pointing, dehydration etc.
• In FLNG cases, pipeline costs refer to a flexible hose connecting the offshore platform with a loading buoy
• Pipeline routes assume straight lines between points
• Pipeline design accounts for maximum water depth along each route, as per Google Earth data
• Pipeline arrival pressure of 70 barg assumed at delivery point
• A condensate-to-gas ratio of 1.5 bbl/mmscfd is assumed and accounted for in the pipeline design
As a benchmark, the figure applied in the specific GASVESSEL scenario Cyprus-Greece (see Chapter 4.4) the cost estimated based on market information is 300 M€ for a 215 km long pipeline, starting offshore, handling 3 bcm of gas annually. Higher cost to be expected with high water depth. A second benchmark is Muhammad and Osiadacz (2015)8, assuming a subsea pipeline CAPEX of $ 5 million per km for deep water case and a volume of 8 bcm/year.
8 Muhammad, A. K., and Osiadacz, A. (2016). The Technical and Economical comparison between marine CNG and LNG Transportation. Современные научные исследования и инновации, (3), 182-188.
GASVESSEL – 723030 Compressed Natural Gas Transport System
_______________________________________________________________________________________
WP7 D7.2 Page | 46
4.3 Results (Comparative analysis)
4.3.1 GASVESSEL vs LNG vs pipeline: All scenarios Two GASVESSEL options are used in the comparison. Vessel size will be the one decided after optimization
through VOLTA software; the speed is kept constant at 16 knots, the compressors are onboard the vessel,
option 1 "Gasvessel – C" for Continuous delivery, and "Gasvessel – S" for option including storage.
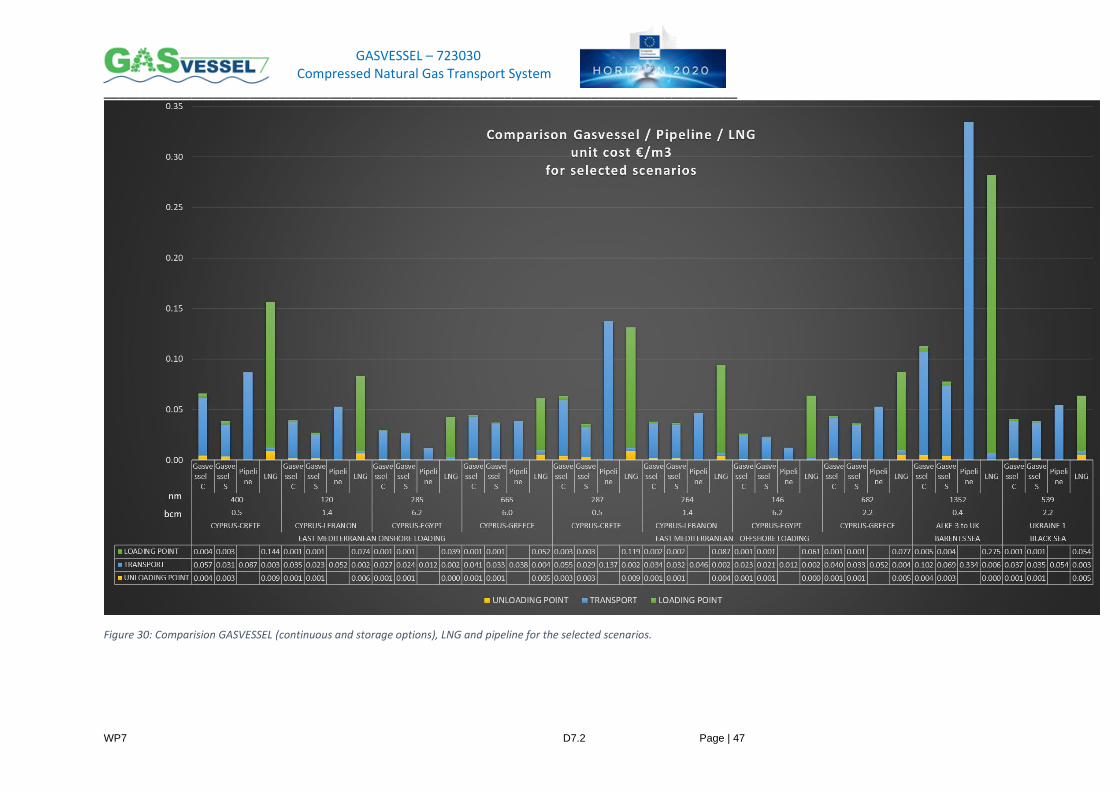
GASVESSEL – 723030 Compressed Natural Gas Transport System
_______________________________________________________________________________________
WP7 D7.2 Page | 47
Figure 30: Comparision GASVESSEL (continuous and storage options), LNG and pipeline for the selected scenarios.
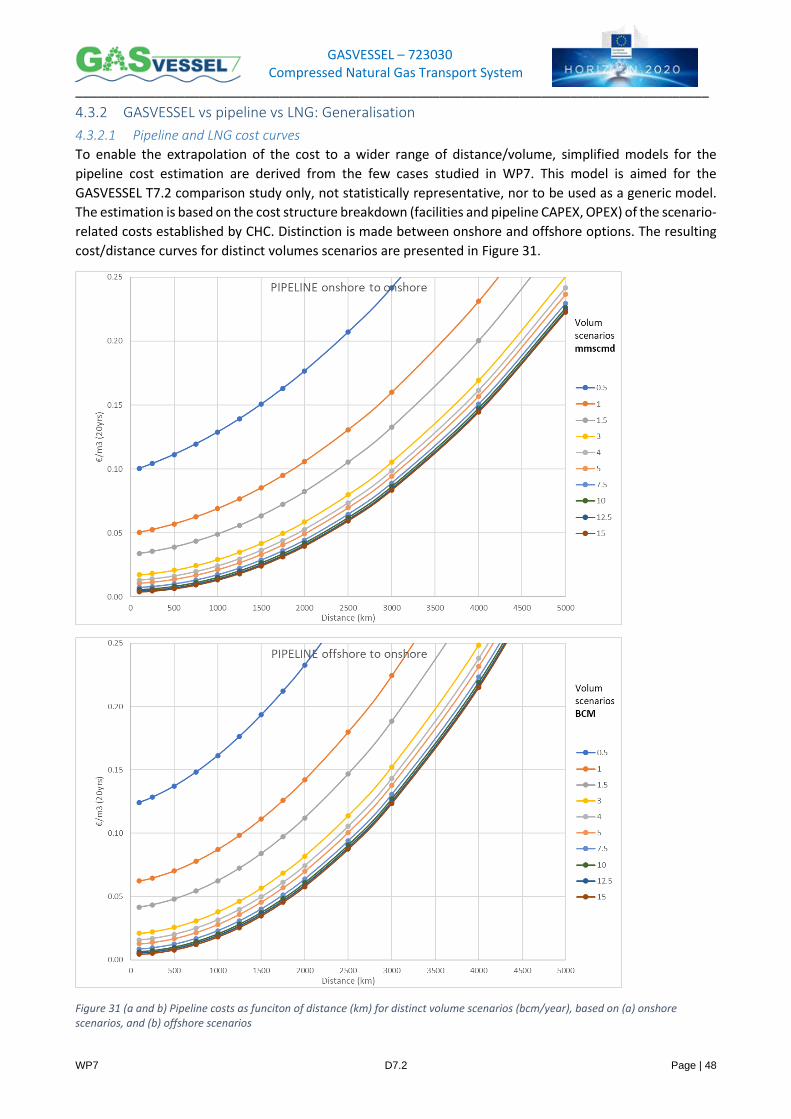
GASVESSEL – 723030 Compressed Natural Gas Transport System
_______________________________________________________________________________________
WP7 D7.2 Page | 48
4.3.2 GASVESSEL vs pipeline vs LNG: Generalisation
4.3.2.1 Pipeline and LNG cost curves
To enable the extrapolation of the cost to a wider range of distance/volume, simplified models for the
pipeline cost estimation are derived from the few cases studied in WP7. This model is aimed for the
GASVESSEL T7.2 comparison study only, not statistically representative, nor to be used as a generic model.
The estimation is based on the cost structure breakdown (facilities and pipeline CAPEX, OPEX) of the scenario-
related costs established by CHC. Distinction is made between onshore and offshore options. The resulting
cost/distance curves for distinct volumes scenarios are presented in Figure 31.
Figure 31 (a and b) Pipeline costs as funciton of distance (km) for distinct volume scenarios (bcm/year), based on (a) onshore scenarios, and (b) offshore scenarios
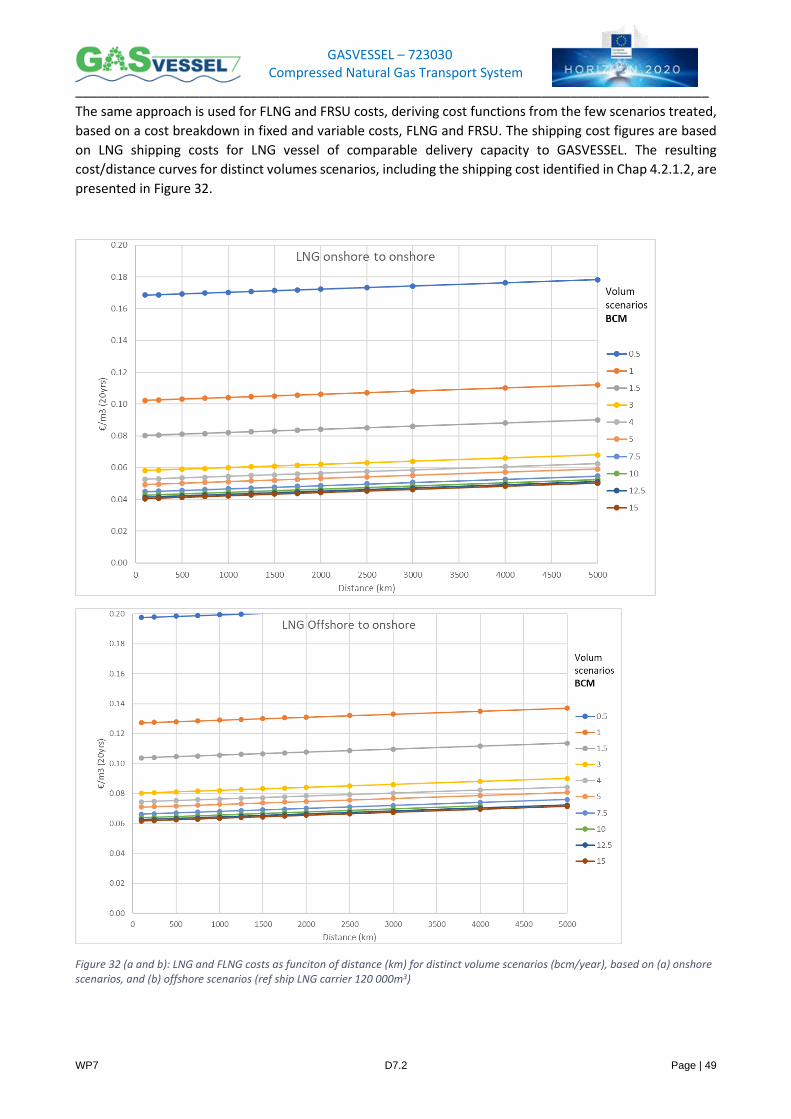
GASVESSEL – 723030 Compressed Natural Gas Transport System
_______________________________________________________________________________________
WP7 D7.2 Page | 49
The same approach is used for FLNG and FRSU costs, deriving cost functions from the few scenarios treated,
based on a cost breakdown in fixed and variable costs, FLNG and FRSU. The shipping cost figures are based
on LNG shipping costs for LNG vessel of comparable delivery capacity to GASVESSEL. The resulting
cost/distance curves for distinct volumes scenarios, including the shipping cost identified in Chap 4.2.1.2, are
presented in Figure 32.
Figure 32 (a and b): LNG and FLNG costs as funciton of distance (km) for distinct volume scenarios (bcm/year), based on (a) onshore scenarios, and (b) offshore scenarios (ref ship LNG carrier 120 000m3)
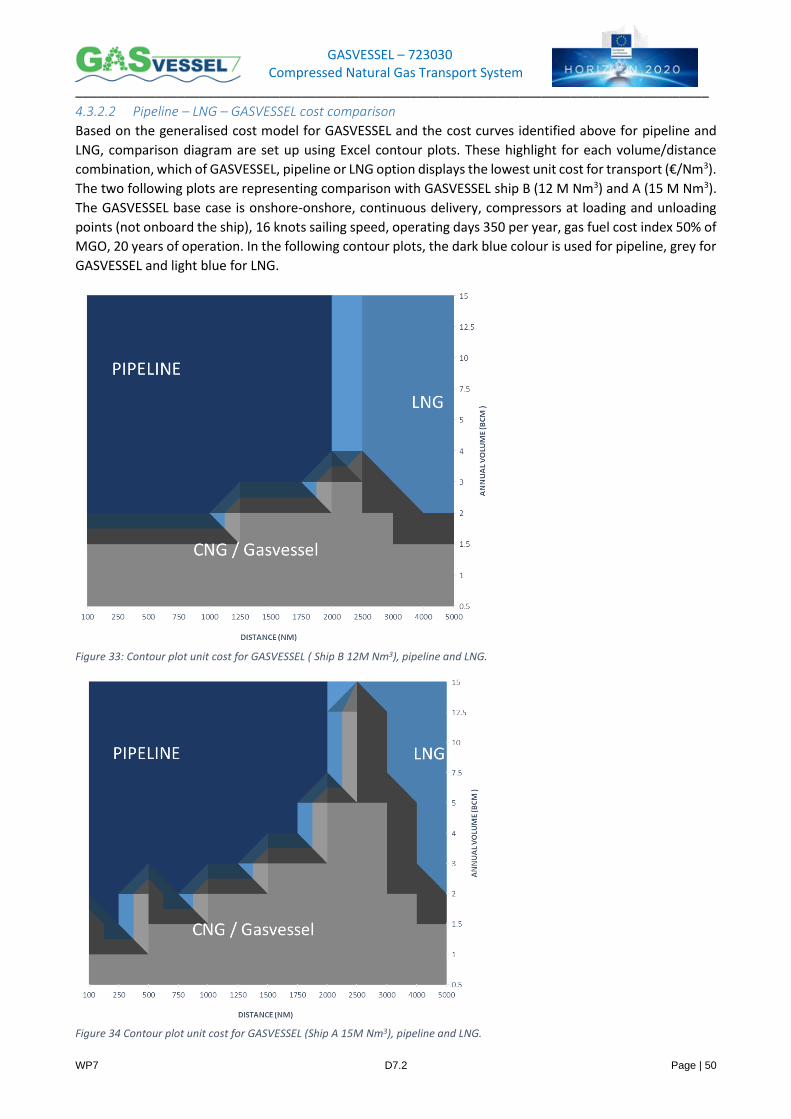
GASVESSEL – 723030 Compressed Natural Gas Transport System
_______________________________________________________________________________________
WP7 D7.2 Page | 50
4.3.2.2 Pipeline – LNG – GASVESSEL cost comparison
Based on the generalised cost model for GASVESSEL and the cost curves identified above for pipeline and
LNG, comparison diagram are set up using Excel contour plots. These highlight for each volume/distance
combination, which of GASVESSEL, pipeline or LNG option displays the lowest unit cost for transport (€/Nm3).
The two following plots are representing comparison with GASVESSEL ship B (12 M Nm3) and A (15 M Nm3).
The GASVESSEL base case is onshore-onshore, continuous delivery, compressors at loading and unloading
points (not onboard the ship), 16 knots sailing speed, operating days 350 per year, gas fuel cost index 50% of
MGO, 20 years of operation. In the following contour plots, the dark blue colour is used for pipeline, grey for
GASVESSEL and light blue for LNG.
Figure 33: Contour plot unit cost for GASVESSEL ( Ship B 12M Nm3), pipeline and LNG.
Figure 34 Contour plot unit cost for GASVESSEL (Ship A 15M Nm3), pipeline and LNG.
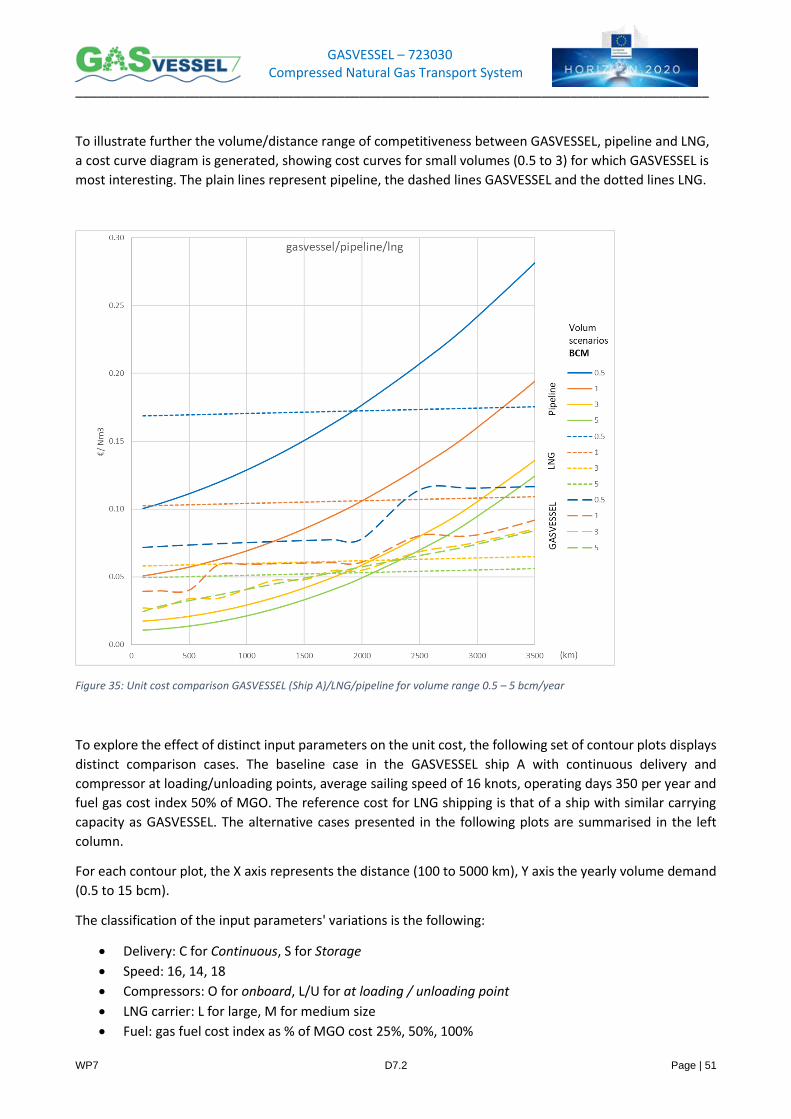
GASVESSEL – 723030 Compressed Natural Gas Transport System
_______________________________________________________________________________________
WP7 D7.2 Page | 51
To illustrate further the volume/distance range of competitiveness between GASVESSEL, pipeline and LNG,
a cost curve diagram is generated, showing cost curves for small volumes (0.5 to 3) for which GASVESSEL is
most interesting. The plain lines represent pipeline, the dashed lines GASVESSEL and the dotted lines LNG.
Figure 35: Unit cost comparison GASVESSEL (Ship A)/LNG/pipeline for volume range 0.5 – 5 bcm/year
To explore the effect of distinct input parameters on the unit cost, the following set of contour plots displays
distinct comparison cases. The baseline case in the GASVESSEL ship A with continuous delivery and
compressor at loading/unloading points, average sailing speed of 16 knots, operating days 350 per year and
fuel gas cost index 50% of MGO. The reference cost for LNG shipping is that of a ship with similar carrying
capacity as GASVESSEL. The alternative cases presented in the following plots are summarised in the left
column.
For each contour plot, the X axis represents the distance (100 to 5000 km), Y axis the yearly volume demand
(0.5 to 15 bcm).
The classification of the input parameters' variations is the following:
• Delivery: C for Continuous, S for Storage
• Speed: 16, 14, 18
• Compressors: O for onboard, L/U for at loading / unloading point
• LNG carrier: L for large, M for medium size
• Fuel: gas fuel cost index as % of MGO cost 25%, 50%, 100%
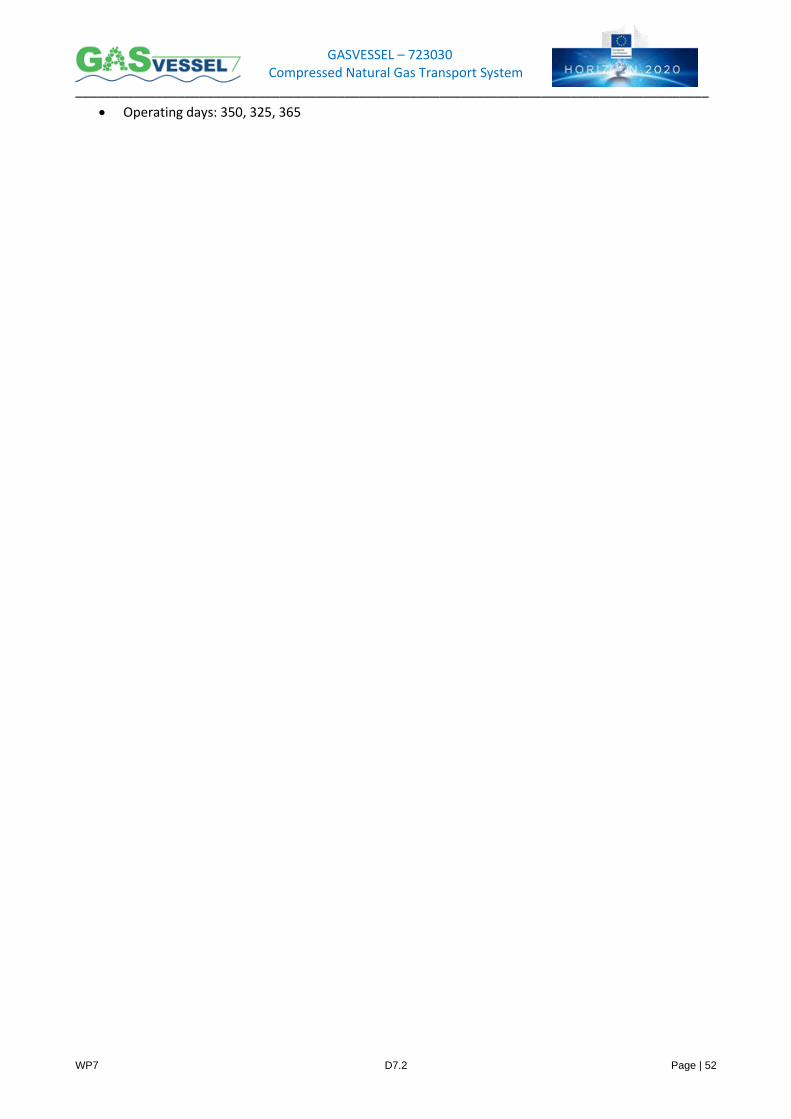
GASVESSEL – 723030 Compressed Natural Gas Transport System
_______________________________________________________________________________________
WP7 D7.2 Page | 52
• Operating days: 350, 325, 365
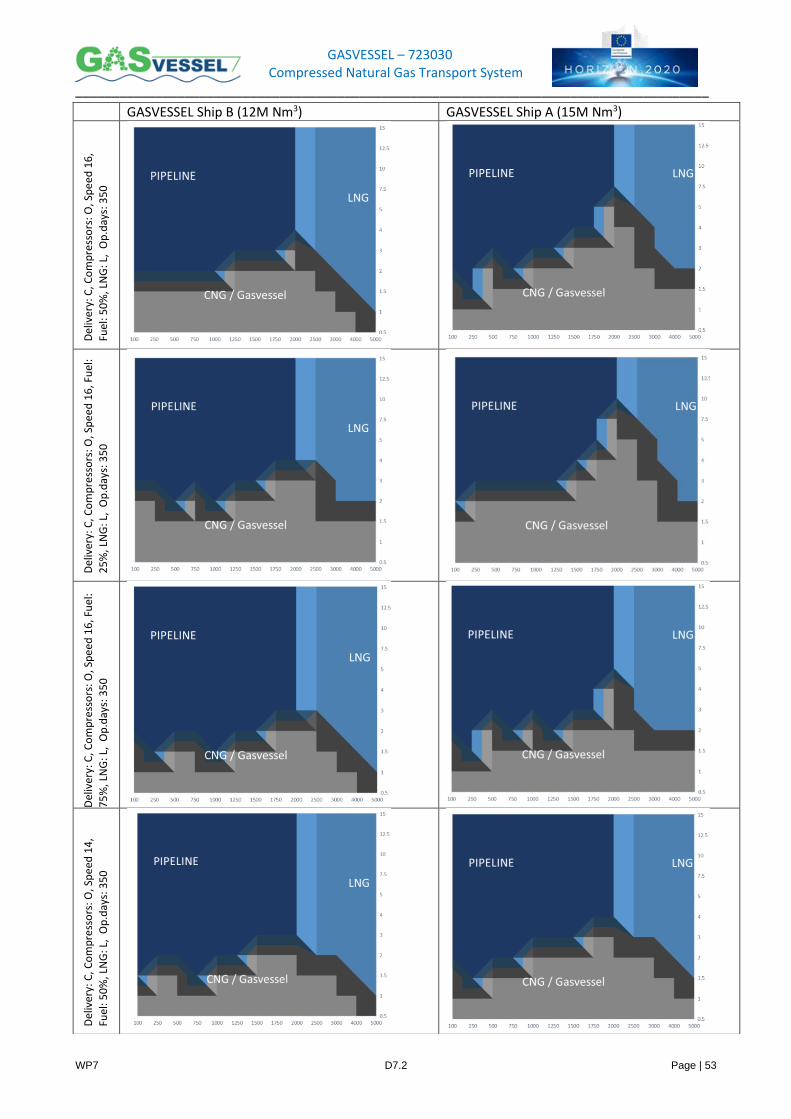
GASVESSEL – 723030 Compressed Natural Gas Transport System
_______________________________________________________________________________________
WP7 D7.2 Page | 53
GASVESSEL Ship B (12M Nm3) GASVESSEL Ship A (15M Nm3)
Del
iver
y: C
, Co
mp
ress
ors
: O, S
pe
ed 1
6,
Fuel
: 50
%, L
NG
: L,
Op
.day
s: 3
50
Del
iver
y: C
, Co
mp
ress
ors
: O, S
pe
ed 1
6, F
uel
:
25
%, L
NG
: L,
Op
.day
s: 3
50
Del
iver
y: C
, Co
mp
ress
ors
: O, S
pe
ed 1
6, F
uel
:
75
%, L
NG
: L,
Op
.day
s: 3
50
Del
iver
y: C
, Co
mp
ress
ors
: O, S
pe
ed 1
4,
Fuel
: 50
%, L
NG
: L,
Op
.day
s: 3
50
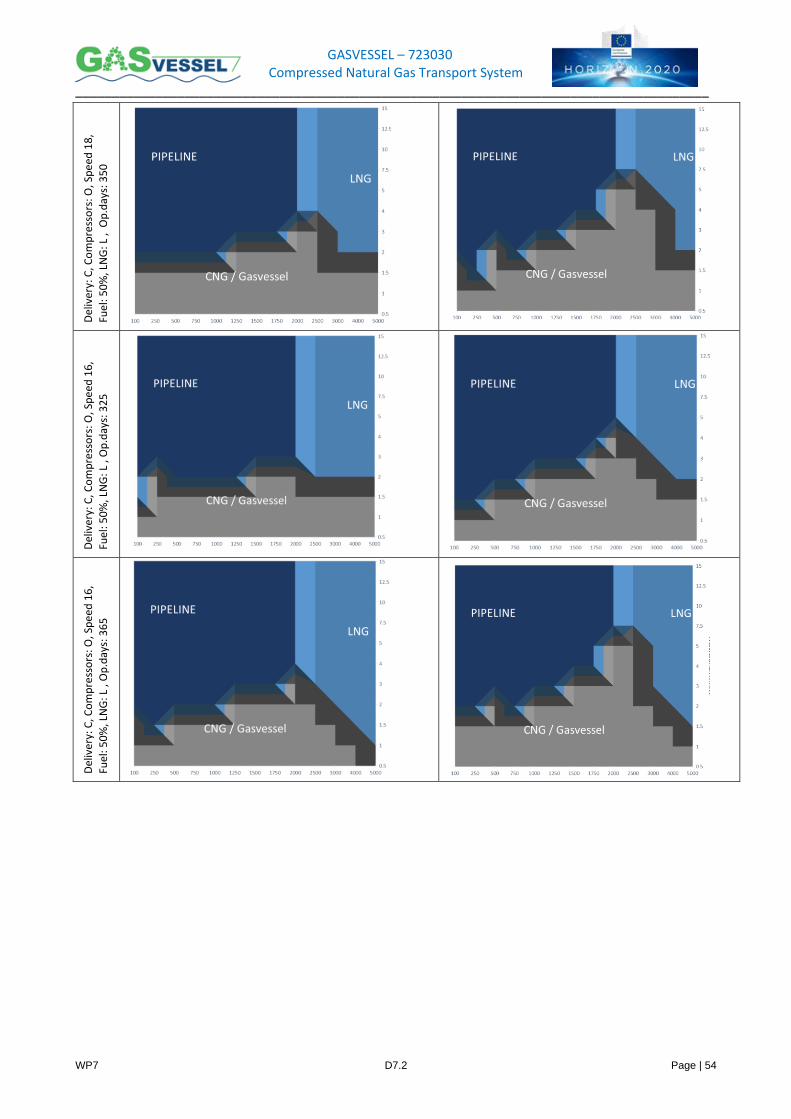
GASVESSEL – 723030 Compressed Natural Gas Transport System
_______________________________________________________________________________________
WP7 D7.2 Page | 54
Del
iver
y: C
, Co
mp
ress
ors
: O, S
pe
ed 1
8,
Fuel
: 50
%, L
NG
: L ,
Op
.day
s: 3
50
Del
iver
y: C
, Co
mp
ress
ors
: O, S
pe
ed 1
6,
Fuel
: 50
%, L
NG
: L ,
Op
.day
s: 3
25
Del
iver
y: C
, Co
mp
ress
ors
: O, S
pe
ed 1
6,
Fuel
: 50
%, L
NG
: L ,
Op
.day
s: 3
65
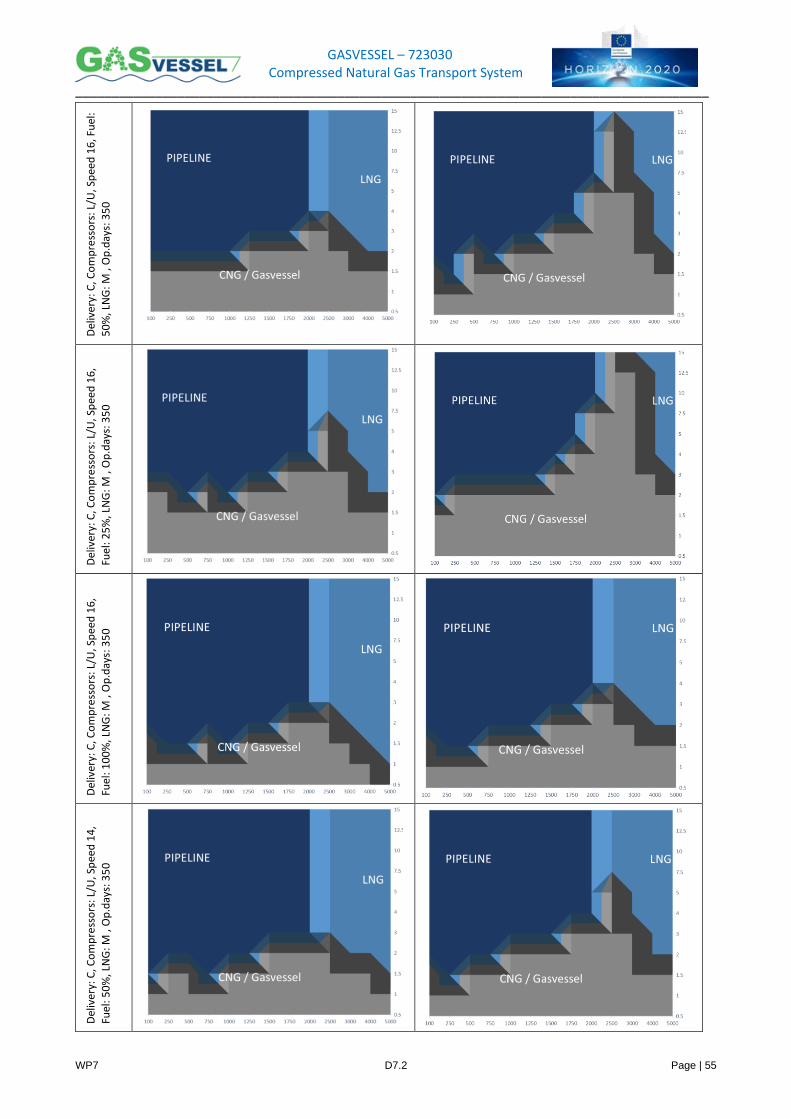
GASVESSEL – 723030 Compressed Natural Gas Transport System
_______________________________________________________________________________________
WP7 D7.2 Page | 55
Del
iver
y: C
, Co
mp
ress
ors
: L/
U, S
pee
d 1
6, F
uel
:
50
%, L
NG
: M
, O
p.d
ays:
35
0
Del
iver
y: C
, Co
mp
ress
ors
: L/U
, Sp
eed
16
,
Fuel
: 25
%, L
NG
: M ,
Op
.day
s: 3
50
Del
iver
y: C
, Co
mp
ress
ors
: L/U
, Sp
eed
16
,
Fuel
: 10
0%
, LN
G: M
, O
p.d
ays:
35
0
Del
iver
y: C
, Co
mp
ress
ors
: L/U
, Sp
eed
14
,
Fuel
: 50
%, L
NG
: M ,
Op
.day
s: 3
50
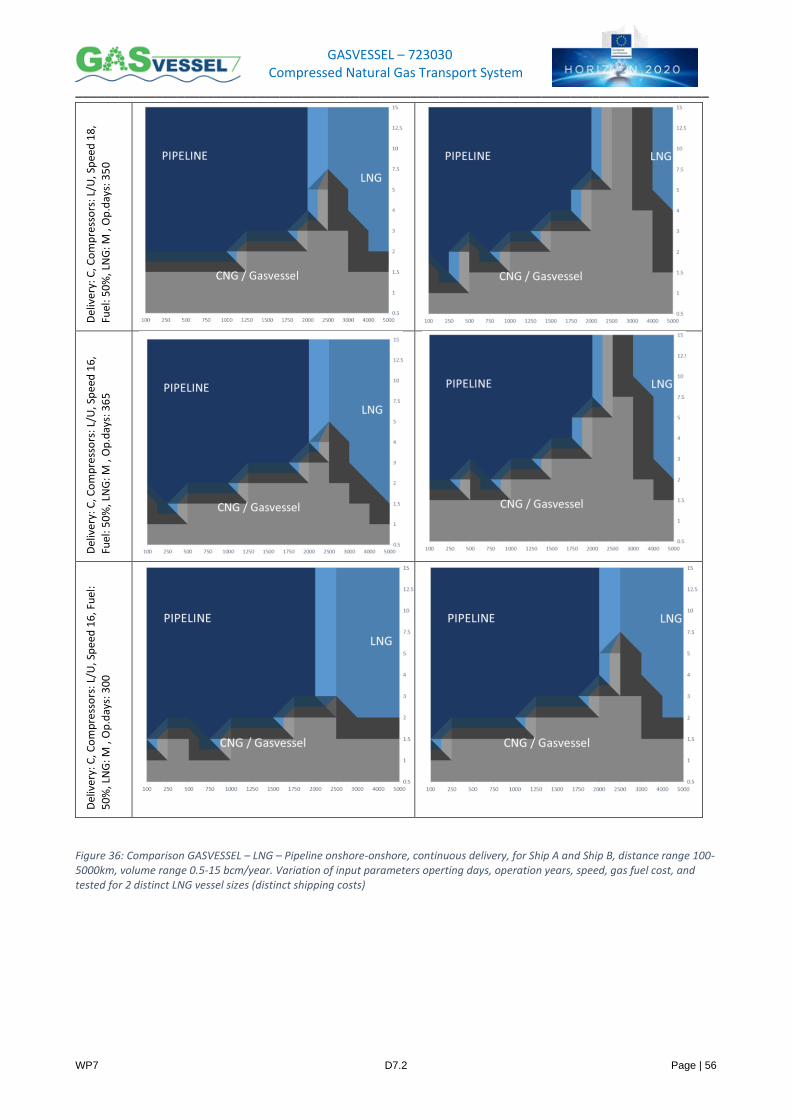
GASVESSEL – 723030 Compressed Natural Gas Transport System
_______________________________________________________________________________________
WP7 D7.2 Page | 56
Del
iver
y: C
, Co
mp
ress
ors
: L/U
, Sp
eed
18
,
Fuel
: 50
%, L
NG
: M ,
Op
.day
s: 3
50
Del
iver
y: C
, Co
mp
ress
ors
: L/U
, Sp
eed
16
,
Fuel
: 50
%, L
NG
: M ,
Op
.day
s: 3
65
Del
iver
y: C
, Co
mp
ress
ors
: L/U
, Sp
eed
16
, Fu
el:
50
%, L
NG
: M
, O
p.d
ays:
30
0
Figure 36: Comparison GASVESSEL – LNG – Pipeline onshore-onshore, continuous delivery, for Ship A and Ship B, distance range 100-5000km, volume range 0.5-15 bcm/year. Variation of input parameters operting days, operation years, speed, gas fuel cost, and tested for 2 distinct LNG vessel sizes (distinct shipping costs)
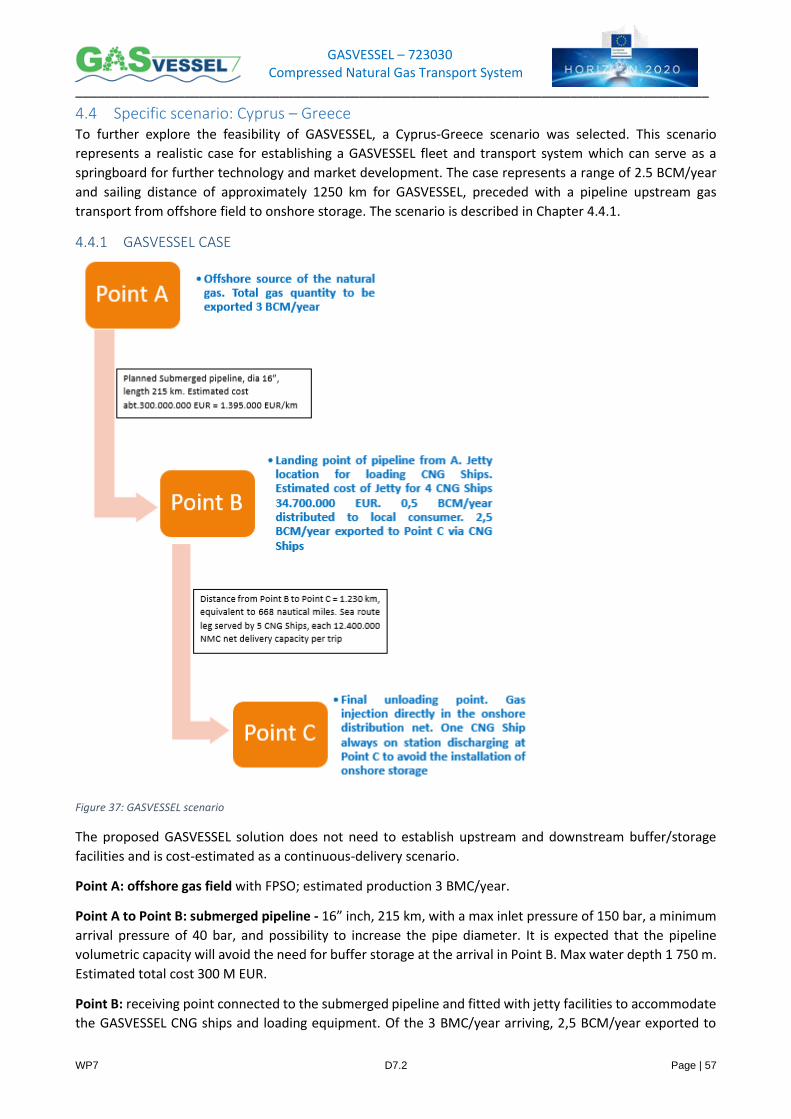
GASVESSEL – 723030 Compressed Natural Gas Transport System
_______________________________________________________________________________________
WP7 D7.2 Page | 57
4.4 Specific scenario: Cyprus – Greece To further explore the feasibility of GASVESSEL, a Cyprus-Greece scenario was selected. This scenario
represents a realistic case for establishing a GASVESSEL fleet and transport system which can serve as a
springboard for further technology and market development. The case represents a range of 2.5 BCM/year
and sailing distance of approximately 1250 km for GASVESSEL, preceded with a pipeline upstream gas
transport from offshore field to onshore storage. The scenario is described in Chapter 4.4.1.
4.4.1 GASVESSEL CASE
Figure 37: GASVESSEL scenario
The proposed GASVESSEL solution does not need to establish upstream and downstream buffer/storage
facilities and is cost-estimated as a continuous-delivery scenario.
Point A: offshore gas field with FPSO; estimated production 3 BMC/year.
Point A to Point B: submerged pipeline - 16” inch, 215 km, with a max inlet pressure of 150 bar, a minimum
arrival pressure of 40 bar, and possibility to increase the pipe diameter. It is expected that the pipeline
volumetric capacity will avoid the need for buffer storage at the arrival in Point B. Max water depth 1 750 m.
Estimated total cost 300 M EUR.
Point B: receiving point connected to the submerged pipeline and fitted with jetty facilities to accommodate
the GASVESSEL CNG ships and loading equipment. Of the 3 BMC/year arriving, 2,5 BCM/year exported to
GASVESSEL – 723030 Compressed Natural Gas Transport System
_______________________________________________________________________________________
WP7 D7.2 Page | 58
Point C via GASVESSEL CNG Ships. Estimated cost of jetty facilities for two GASVESSEL CNG Ships is 34.7 M €.
Onshore compression station from min. 40 bar to 335 bar necessary to load the CNG onboard GASVESSEL
located at point B. Estimated total cost 16 M €.
Point B to Point C: sea route. Waterborne GASVESSEL CNG transportation costs evaluation based on the
following assumptions:
• Gas delivered: 2.5 BCM/year (6.85 mmscmd)
• Service duration 20 years (to enable comparison with FLNG and pipeline),
• Distance B-C (loading/unloading points): 668 nm (1 230 km)
• Distance A-C (field/final destination): 682 nm (1 262 km)
• GASVESSEL ship used: Navalprogetti type A (total capacity 15 M Nm3)
• Net gas quantity delivered each voyage 12.4M Nm3
• Loading time: 43 hrs; Unmooring: 2 hrs; Sailing: 42 hrs (668 nm/16 kn); Mooring: 3 hrs; Unloading: 61 hrs.
• Vessel operating days/year: 350, inconveniences due to the weather conditions or technical problems such as class renewal and ship maintenance/dry docks, etc.
GASVESSEL fleet and transport system:
• Roundtrip time: 198 hrs, 8.2 days.
• Maximum roundtrip per vessel per year: 42 (given operating days).
• Number of CNG ships required for annual delivery 2,5 BMC: 5 Ships
• This fleet size ensures constant debit (daily) and takes into account the unloading debit from the vessel is distinct from the daily demand over the unlading period (unloading flow 0.2 M Nm3/hr vs. demand 0.28 M Nm3/hr). The sailing fleet to ensure no time lap between two unloading periods, taking into account operation time of 350 days, is: 350/roundtrip time = 4 vessels (3,57). Number of vessels required at all times to ensure daily supply = 6,85 M Nm3 / (12,4 M Nm3) / (61hrs/24hrs)) = 1,4 vessel. Rounding up, the theoretical fleet size is 6 vessels. However, taking into account some variation in daily delivery, one additional vessel to the fleet is sufficient to ensure supply without a large storage buffer.
Point C: final destination; with delivered gas injected into the existing gas distribution net. As explained
above, the gas quantity delivered by one GASVESSEL CNG Ship is enough for two days consumption, if one
ship is permanently present at the unloading point there is no need of buffer/storage facilities. The
GASVESSEL CNG Ship requires a similar jetty as in point B, with pressure reduction system to the 64 bar of
the local gas distribution net and compressor.
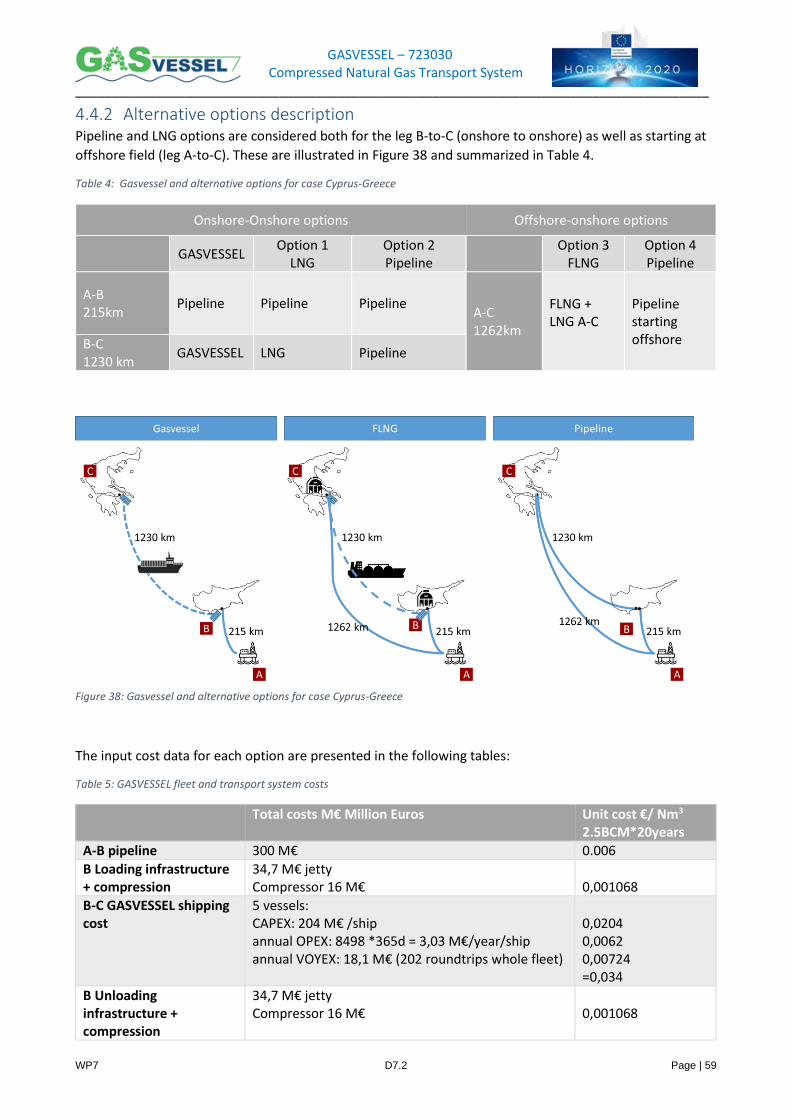
GASVESSEL – 723030 Compressed Natural Gas Transport System
_______________________________________________________________________________________
WP7 D7.2 Page | 59
4.4.2 Alternative options description Pipeline and LNG options are considered both for the leg B-to-C (onshore to onshore) as well as starting at
offshore field (leg A-to-C). These are illustrated in Figure 38 and summarized in Table 4.
Table 4: Gasvessel and alternative options for case Cyprus-Greece
Onshore-Onshore options Offshore-onshore options
GASVESSEL Option 1
LNG Option 2 Pipeline
Option 3
FLNG Option 4 Pipeline
A-B 215km
Pipeline Pipeline Pipeline A-C 1262km
FLNG + LNG A-C
Pipeline starting offshore B-C
1230 km GASVESSEL LNG Pipeline
Figure 38: Gasvessel and alternative options for case Cyprus-Greece
The input cost data for each option are presented in the following tables:
Table 5: GASVESSEL fleet and transport system costs
Total costs M€ Million Euros Unit cost €/ Nm3 2.5BCM*20years
A-B pipeline 300 M€ 0.006
B Loading infrastructure + compression
34,7 M€ jetty Compressor 16 M€
0,001068
B-C GASVESSEL shipping cost
5 vessels: CAPEX: 204 M€ /ship annual OPEX: 8498 *365d = 3,03 M€/year/ship annual VOYEX: 18,1 M€ (202 roundtrips whole fleet)
0,0204 0,0062 0,00724 =0,034
B Unloading infrastructure + compression
34,7 M€ jetty Compressor 16 M€
0,001068
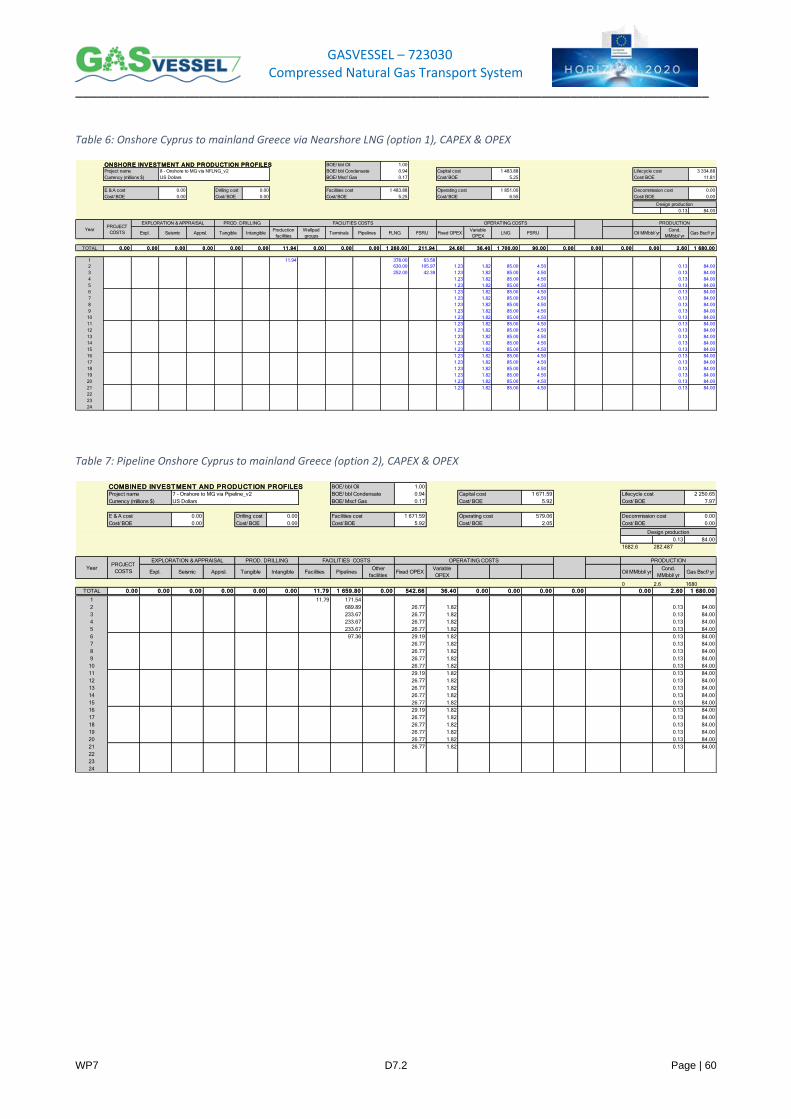
GASVESSEL – 723030 Compressed Natural Gas Transport System
_______________________________________________________________________________________
WP7 D7.2 Page | 60
Table 6: Onshore Cyprus to mainland Greece via Nearshore LNG (option 1), CAPEX & OPEX
Table 7: Pipeline Onshore Cyprus to mainland Greece (option 2), CAPEX & OPEX
ONSHORE INVEST MENT AND PRODUCT ION PROFILES 1.00
0.94 1 483.88 3 334.88
0.17 5.25 11.81
0.00 Drilling cost 0.00 1 483.88 1 851.00 0.00
0.00 Cost/ BOE 0.00 5.25 6.55 0.00
0.13 84.00
Expl. Seismic Apprsl. Tangible IntangibleProduction
facilities
Wellpad
groupsTerminals Pipelines FLNG FSRU Fixed OPEX
Variable
OPEXLNG FSRU Oil MMbbl/ yr
Cond.
MMbbl/ yrGas Bscf/ yr
TOTAL 0.00 0.00 0.00 0.00 0.00 0.00 11.94 0.00 0.00 0.00 1 260.00 211.94 24.60 36.40 1 700.00 90.00 0.00 0.00 0.00 0.00 2.60 1 680.00
1 11.94 378.00 63.58
2 630.00 105.97 1.23 1.82 85.00 4.50 0.13 84.00
3 252.00 42.39 1.23 1.82 85.00 4.50 0.13 84.00
4 1.23 1.82 85.00 4.50 0.13 84.00
5 1.23 1.82 85.00 4.50 0.13 84.00
6 1.23 1.82 85.00 4.50 0.13 84.00
7 1.23 1.82 85.00 4.50 0.13 84.00
8 1.23 1.82 85.00 4.50 0.13 84.00
9 1.23 1.82 85.00 4.50 0.13 84.00
10 1.23 1.82 85.00 4.50 0.13 84.00
11 1.23 1.82 85.00 4.50 0.13 84.00
12 1.23 1.82 85.00 4.50 0.13 84.00
13 1.23 1.82 85.00 4.50 0.13 84.00
14 1.23 1.82 85.00 4.50 0.13 84.00
15 1.23 1.82 85.00 4.50 0.13 84.00
16 1.23 1.82 85.00 4.50 0.13 84.00
17 1.23 1.82 85.00 4.50 0.13 84.00
18 1.23 1.82 85.00 4.50 0.13 84.00
19 1.23 1.82 85.00 4.50 0.13 84.00
20 1.23 1.82 85.00 4.50 0.13 84.00
21 1.23 1.82 85.00 4.50 0.13 84.00
22
23
24
E & A cost Facilities cost
OPERATING COSTS PRODUCTION
Cost/ BOE Cost/ BOE Cost/ BOE Cost/ BOE
Design production
Project name 8 - Onshore to MG via NFLNG_v2 Capital cost Lifecycle cost
Currency (millions $)
YearPROJECT
COSTS
EXPLORATION & APPRAISAL PROD. DRILLING FACILITIES COSTS
US Dollars Cost/ BOE Cost/ BOE
Operating cost Decommission cost
BOE/ bbl Oil
BOE/ bbl Condensate
BOE/ Mscf Gas
COMBINED INVEST MENT AND PRODUCT ION PROFILES 1.00
0.94 1 671.59 2 250.65
0.17 5.92 7.97
0.00 Drilling cost 0.00 1 671.59 579.06 0.00
0.00 Cost/ BOE 0.00 5.92 2.05 0.00
0.13 84.00
1682.6 282.487
Expl. Seismic Apprsl. Tangible Intangible Facilities PipelinesOther
facilitiesFixed OPEX
Variable
OPEXOil MMbbl/ yr
Cond.
MMbbl/ yrGas Bscf/ yr
0 2.6 1680
TOTAL 0.00 0.00 0.00 0.00 0.00 0.00 11.79 1 659.80 0.00 542.66 36.40 0.00 0.00 0.00 0.00 0.00 2.60 1 680.00
1 11.79 171.54
2 689.89 26.77 1.82 0.13 84.00
3 233.67 26.77 1.82 0.13 84.00
4 233.67 26.77 1.82 0.13 84.00
5 233.67 26.77 1.82 0.13 84.00
6 97.36 29.19 1.82 0.13 84.00
7 26.77 1.82 0.13 84.00
8 26.77 1.82 0.13 84.00
9 26.77 1.82 0.13 84.00
10 26.77 1.82 0.13 84.00
11 29.19 1.82 0.13 84.00
12 26.77 1.82 0.13 84.00
13 26.77 1.82 0.13 84.00
14 26.77 1.82 0.13 84.00
15 26.77 1.82 0.13 84.00
16 29.19 1.82 0.13 84.00
17 26.77 1.82 0.13 84.00
18 26.77 1.82 0.13 84.00
19 26.77 1.82 0.13 84.00
20 26.77 1.82 0.13 84.00
21 26.77 1.82 0.13 84.00
22
23
24
E & A cost Facilities cost
OPERATING COSTS PRODUCTION
Cost/ BOE Cost/ BOE Cost/ BOE Cost/ BOE
Design production
Project name 7 - Onshore to MG via Pipeline_v2 Capital cost Lifecycle cost
Currency (millions $)
YearPROJECT
COSTS
EXPLORATION & APPRAISAL PROD. DRILLING FACILITIES COSTS
US Dollars Cost/ BOE Cost/ BOE
Operating cost Decommission cost
BOE/ bbl Oil
BOE/ bbl Condensate
BOE/ Mscf Gas
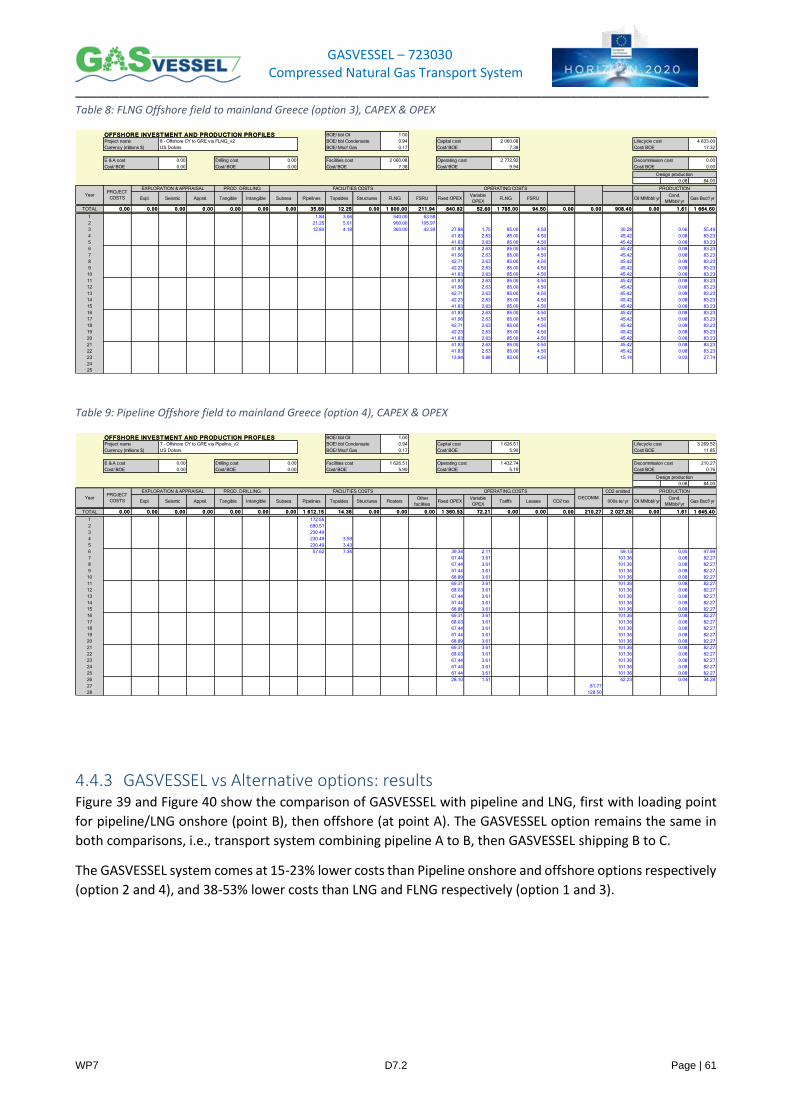
GASVESSEL – 723030 Compressed Natural Gas Transport System
_______________________________________________________________________________________
WP7 D7.2 Page | 61
Table 8: FLNG Offshore field to mainland Greece (option 3), CAPEX & OPEX
Table 9: Pipeline Offshore field to mainland Greece (option 4), CAPEX & OPEX
4.4.3 GASVESSEL vs Alternative options: results Figure 39 and Figure 40 show the comparison of GASVESSEL with pipeline and LNG, first with loading point
for pipeline/LNG onshore (point B), then offshore (at point A). The GASVESSEL option remains the same in
both comparisons, i.e., transport system combining pipeline A to B, then GASVESSEL shipping B to C.
The GASVESSEL system comes at 15-23% lower costs than Pipeline onshore and offshore options respectively
(option 2 and 4), and 38-53% lower costs than LNG and FLNG respectively (option 1 and 3).
OFFSHORE INVEST MENT AND PRODUCT ION PROFILES 1.00
0.94 2 060.08 4 833.00
0.17 7.38 17.32
0.00 0.00 2 060.08 2 772.92 0.00
0.00 0.00 7.38 9.94 0.00
0.08 84.00
Expl. Seismic Apprsl. Tangible Intangible Subsea Pipelines Topsides Structures FLNG FSRU Fixed OPEXVariable
OPEXFLNG FSRU Oil MMbbl/ yr
Cond.
MMbbl/ yrGas Bscf/ yr
TOTAL 0.00 0.00 0.00 0.00 0.00 0.00 0.00 35.89 12.25 0.00 1 800.00 211.94 840.82 52.60 1 785.00 94.50 0.00 0.00 908.40 0.00 1.61 1 664.60
1 1.84 3.06 540.00 63.58
2 21.25 5.01 900.00 105.97
3 12.80 4.18 360.00 42.39 27.88 1.75 85.00 4.50 30.28 0.06 55.49
4 41.83 2.63 85.00 4.50 45.42 0.08 83.23
5 41.83 2.63 85.00 4.50 45.42 0.08 83.23
6 41.83 2.63 85.00 4.50 45.42 0.08 83.23
7 41.96 2.63 85.00 4.50 45.42 0.08 83.23
8 42.71 2.63 85.00 4.50 45.42 0.08 83.23
9 42.23 2.63 85.00 4.50 45.42 0.08 83.23
10 41.83 2.63 85.00 4.50 45.42 0.08 83.23
11 41.83 2.63 85.00 4.50 45.42 0.08 83.23
12 41.96 2.63 85.00 4.50 45.42 0.08 83.23
13 42.71 2.63 85.00 4.50 45.42 0.08 83.23
14 42.23 2.63 85.00 4.50 45.42 0.08 83.23
15 41.83 2.63 85.00 4.50 45.42 0.08 83.23
16 41.83 2.63 85.00 4.50 45.42 0.08 83.23
17 41.96 2.63 85.00 4.50 45.42 0.08 83.23
18 42.71 2.63 85.00 4.50 45.42 0.08 83.23
19 42.23 2.63 85.00 4.50 45.42 0.08 83.23
20 41.83 2.63 85.00 4.50 45.42 0.08 83.23
21 41.83 2.63 85.00 4.50 45.42 0.08 83.23
22 41.83 2.63 85.00 4.50 45.42 0.08 83.23
23 13.94 0.88 85.00 4.50 15.14 0.03 27.74
24
25
PRODUCTION
YearPROJECT
COSTS
EXPLORATION & APPRAISAL PROD. DRILLING FACILITIES COSTS OPERATING COSTS
Cost/ BOE Cost/ BOE Cost/ BOE Cost/ BOE Cost/ BOE
Design production
E & A cost Drilling cost Facilities cost Operating cost Decommission cost
BOE/ bbl Oil
BOE/ bbl Condensate
BOE/ Mscf Gas
Project name 8 - Offshore CY to GRE via FLNG_v2 Capital cost Lifecycle cost
Currency (millions $) US Dollars Cost/ BOE Cost/ BOE
OFFSHORE INVEST MENT AND PRODUCT ION PROFILES 1.00
0.94 1 626.51 3 269.52
0.17 5.90 11.85
0.00 0.00 1 626.51 1 432.74 210.27
0.00 0.00 5.90 5.19 0.76
0.08 84.00
CO2 emitted
Expl. Seismic Apprsl. Tangible Intangible Subsea Pipelines Topsides Structures FloatersOther
facilitiesFixed OPEX
Variable
OPEXTariffs Leases CO2 tax 000s te/ yr Oil MMbbl/ yr
Cond.
MMbbl/ yrGas Bscf/ yr
TOTAL 0.00 0.00 0.00 0.00 0.00 0.00 0.00 1 612.15 14.36 0.00 0.00 0.00 1 360.53 72.21 0.00 0.00 0.00 210.27 2 027.20 0.00 1.61 1 645.40
1 172.55
2 690.51
3 230.49
4 230.49 3.59
5 230.49 3.43
6 57.62 7.34 39.34 2.11 59.13 0.05 47.99
7 67.44 3.61 101.36 0.08 82.27
8 67.44 3.61 101.36 0.08 82.27
9 67.44 3.61 101.36 0.08 82.27
10 68.89 3.61 101.36 0.08 82.27
11 69.31 3.61 101.36 0.08 82.27
12 68.03 3.61 101.36 0.08 82.27
13 67.44 3.61 101.36 0.08 82.27
14 67.44 3.61 101.36 0.08 82.27
15 68.89 3.61 101.36 0.08 82.27
16 69.31 3.61 101.36 0.08 82.27
17 68.03 3.61 101.36 0.08 82.27
18 67.44 3.61 101.36 0.08 82.27
19 67.44 3.61 101.36 0.08 82.27
20 68.89 3.61 101.36 0.08 82.27
21 69.31 3.61 101.36 0.08 82.27
22 68.03 3.61 101.36 0.08 82.27
23 67.44 3.61 101.36 0.08 82.27
24 67.44 3.61 101.36 0.08 82.27
25 67.44 3.61 101.36 0.08 82.27
26 28.10 1.51 42.23 0.04 34.28
27 81.77
28 128.50
DECOMM.
PRODUCTION
YearPROJECT
COSTS
EXPLORATION & APPRAISAL PROD. DRILLING FACILITIES COSTS OPERATING COSTS
Cost/ BOE Cost/ BOE Cost/ BOE Cost/ BOE Cost/ BOE
Design production
E & A cost Drilling cost Facilities cost Operating cost Decommission cost
BOE/ bbl Oil
BOE/ bbl Condensate
BOE/ Mscf Gas
Project name 7 - Offshore CY to GRE via Pipeline_v2 Capital cost Lifecycle cost
Currency (millions $) US Dollars Cost/ BOE Cost/ BOE
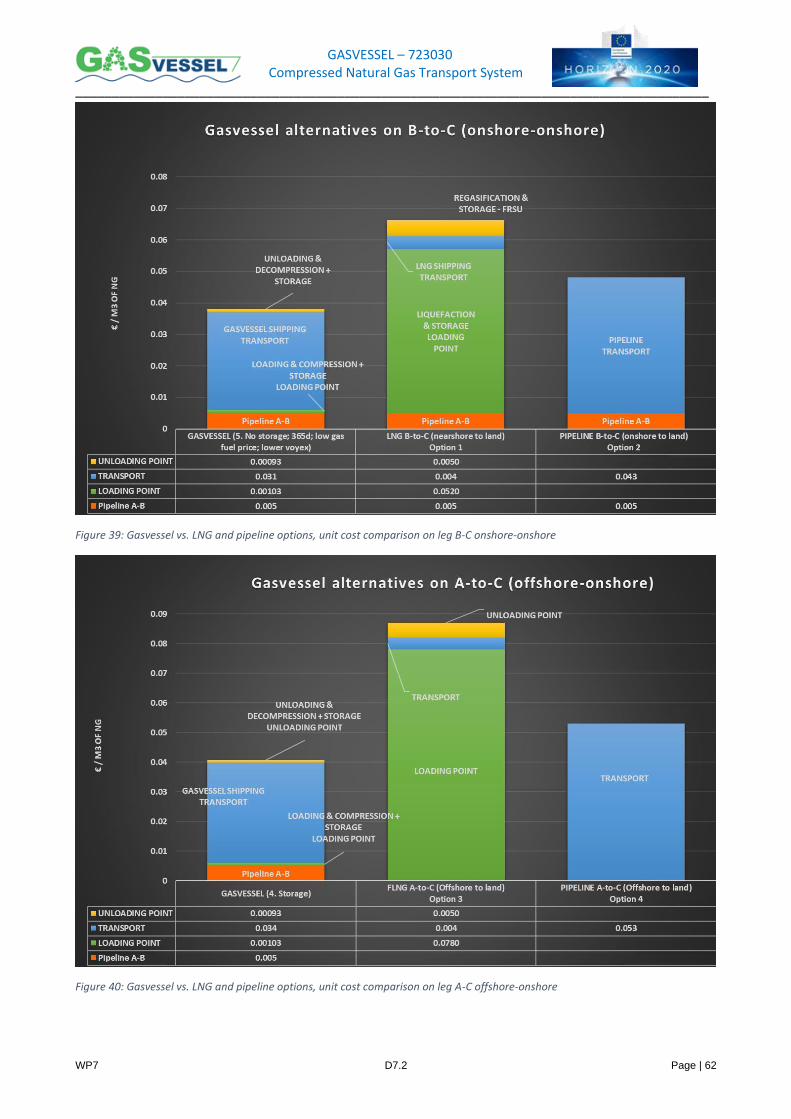
GASVESSEL – 723030 Compressed Natural Gas Transport System
_______________________________________________________________________________________
WP7 D7.2 Page | 62
Figure 39: Gasvessel vs. LNG and pipeline options, unit cost comparison on leg B-C onshore-onshore
Figure 40: Gasvessel vs. LNG and pipeline options, unit cost comparison on leg A-C offshore-onshore
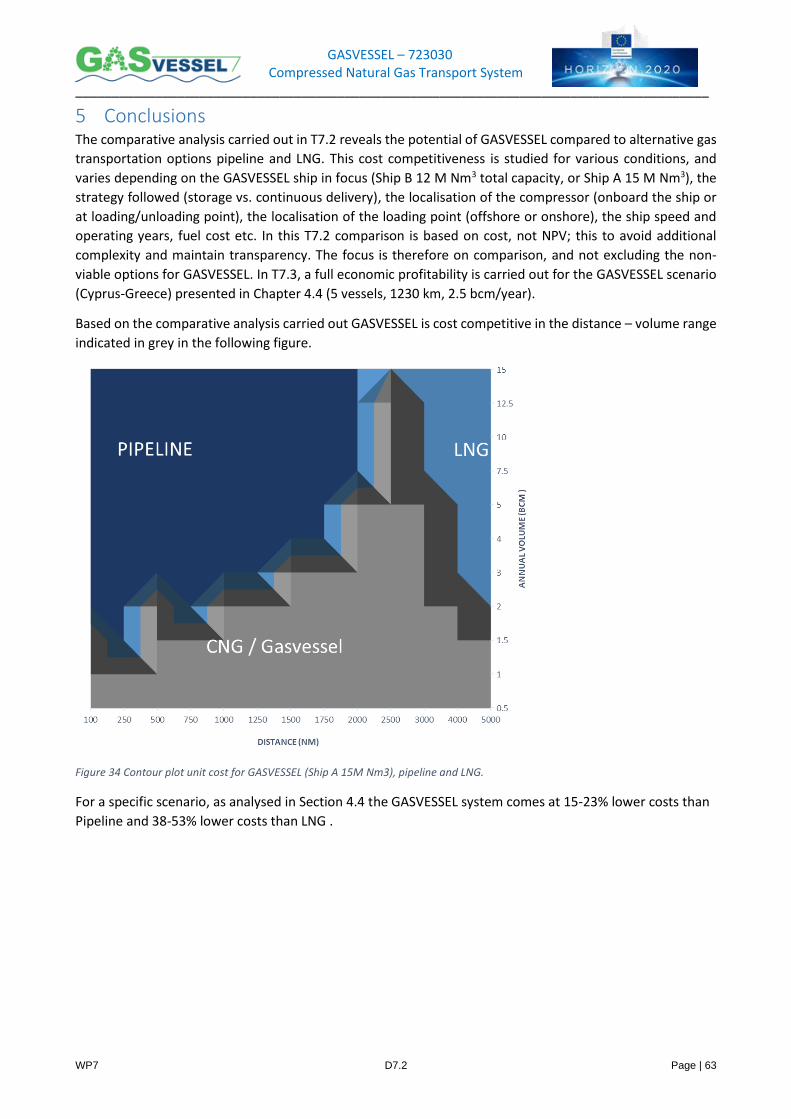
GASVESSEL – 723030 Compressed Natural Gas Transport System
_______________________________________________________________________________________
WP7 D7.2 Page | 63
5 Conclusions The comparative analysis carried out in T7.2 reveals the potential of GASVESSEL compared to alternative gas
transportation options pipeline and LNG. This cost competitiveness is studied for various conditions, and
varies depending on the GASVESSEL ship in focus (Ship B 12 M Nm3 total capacity, or Ship A 15 M Nm3), the
strategy followed (storage vs. continuous delivery), the localisation of the compressor (onboard the ship or
at loading/unloading point), the localisation of the loading point (offshore or onshore), the ship speed and
operating years, fuel cost etc. In this T7.2 comparison is based on cost, not NPV; this to avoid additional
complexity and maintain transparency. The focus is therefore on comparison, and not excluding the non-
viable options for GASVESSEL. In T7.3, a full economic profitability is carried out for the GASVESSEL scenario
(Cyprus-Greece) presented in Chapter 4.4 (5 vessels, 1230 km, 2.5 bcm/year).
Based on the comparative analysis carried out GASVESSEL is cost competitive in the distance – volume range
indicated in grey in the following figure.
Figure 34 Contour plot unit cost for GASVESSEL (Ship A 15M Nm3), pipeline and LNG.
For a specific scenario, as analysed in Section 4.4 the GASVESSEL system comes at 15-23% lower costs than
Pipeline and 38-53% lower costs than LNG .
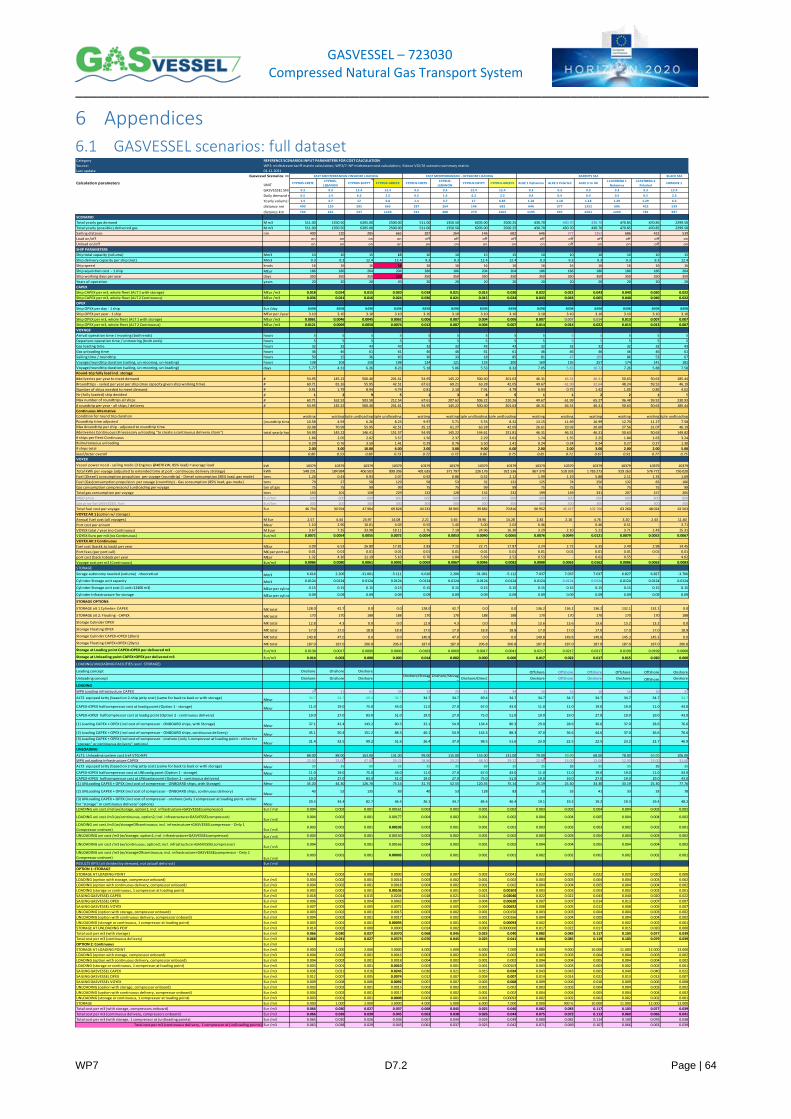
GASVESSEL – 723030 Compressed Natural Gas Transport System
_______________________________________________________________________________________
WP7 D7.2 Page | 64
6 Appendices
6.1 GASVESSEL scenarios: full dataset
Category REFERENCE SCENARIOS INPUT PARAMETERS FOR COST CALCULATION
Source: WP2: midtstream tariff matrix calculation; WP2/7: NP midstream cost calculation; Esteco VOLTA scenario summary matrix
Last update 01.11.2021
Gasvessel Scenarios >> BLACK SEA
Calculation parameters UNITCYPRUS-CRETE
CYPRUS-
LEBANON CYPRUS-EGYPT CYPRUS-GREECE CYPRUS-CRETE
CYPRUS-
LEBANON CYPRUS-EGYPT CYPRUS-GREECE ALKE 1 Nyhamna ALKE 2 Polarled ALKE 3 to UK
J.CASTBERG 1
Nyhamna
J.CASTBERG 2
PolarledUKRAINE 1
GASVESSEL SHIP 9.3 9.3 12.4 12.4 9.3 9.3 12.4 12.4 9.3 9.3 9.3 9.3 9.3 12.4
Daily demand mmscmd0.5 1.4 6.2 2.5 0.5 1.4 6.2 2.5 0.4 0.4 0.4 0.5 0.5 2.3
Yearly volume bcm 1.4 3.7 17 6.8 1.4 3.7 17 6.85 1.18 1.18 1.18 1.29 1.29 6.3
distance nm 400 120 285 665 287 264 146 682 646 377 1352 686 422 539
distance km 740 222 527 1230 531 488 270 1262 1195 697 2501 1269 781 997
SCENARIO
Total yearly gas demand M m3 511.00 1350.50 6205.00 2500.00 511.00 1350.50 6205.00 2500.25 430.70 430.70 430.70 470.85 470.85 2299.50
Total yearly (possible) delivered gas M m3 511.00 1350.50 6205.00 2500.00 511.00 1350.50 6205.00 2500.25 430.70 430.70 430.70 470.85 470.85 2299.50
Sailing distance nm 400 120 285 665 287 264 146 682 646 377 1352 686 422 539
Load on/off on on on on off off off off off off off off off on
Unload on/off on on on on on on on on on off on on off on
SHIP PARAMETERS
Ship total capacity (volume) Mm3 10 10 15 15 10 10 15 15 10 10 10 10 10 15
Ship delivery capacity per ship (net) Mm3 9.3 9.3 12.4 12.4 9.3 9.3 12.4 12.4 9.3 9.3 9.3 9.3 9.3 12.4
Ship speed knots 16 16 16 16 16 16 16 16 16 16 16 16 16 16
Ship aquisition cost - 1 ship MEur 186 186 204 204 186 186 204 204 186 186 186 186 186 204
Ship working days per year days 350 350 350 350 350 350 350 350 350 350 350 350 350 350
Years of operation years 20 20 20 20 20 20 20 20 20 20 20 20 20 20
CAPEX
Ship CAPEX per m3, whole fleet (ALT 1 with storage) MEur /m3 0.018 0.014 0.015 0.020 0.018 0.021 0.013 0.020 0.022 0.022 0.043 0.040 0.020 0.022
Ship CAPEX per m3, whole fleet (ALT 2 Continuous) MEur /m3 0.036 0.021 0.016 0.024 0.036 0.021 0.015 0.024 0.043 0.043 0.065 0.040 0.040 0.022
OPEX
Ship OPEX per day - 1 ship Eur /day 8498 8498 8498 8498 8498 8498 8498 8498 8498 8498 8498 8498 8498 8498
Ship OPEX per year - 1 ship MEur per /year 3.10 3.10 3.10 3.10 3.10 3.10 3.10 3.10 3.10 3.10 3.10 3.10 3.10 3.10
Ship OPEX per m3, whole fleet (ALT 1 with storage) MEur /m3 0.0061 0.0046 0.0045 0.0062 0.006 0.007 0.004 0.006 0.007 0.007 0.014 0.013 0.007 0.007
Ship OPEX per m3, whole fleet (ALT 2 Continuous) MEur /m3 0.0121 0.0069 0.0050 0.0074 0.012 0.007 0.004 0.007 0.014 0.014 0.022 0.013 0.013 0.007
VOYAGE
Arrival operation time / mooring (both ends) hours 5 5 5 5 5 5 5 5 5 5 5 5 5 5
Departure operation time / unmooring (both ends) hours 5 5 5 5 5 5 5 5 5 5 5 5 5 5
Gas loading time hours 32 32 43 43 32 32 43 43 32 32 32 32 32 43
Gas unloading time hours 46 46 61 61 46 46 61 61 46 46 46 46 46 61
Sailing time / roundtrip hours 50 15 36 83 36 33 18 85 81 47 169 86 53 67
Voyage/roundtrip duration (sailing, un-mooring, un-loading) hours 138 103 150 198 124 121 133 200 169 135 257 174 141 182
Voyage/roundtrip duration (sailing, un-mooring, un-loading) days 5.77 4.31 6.26 8.23 5.18 5.06 5.53 8.32 7.05 5.65 10.72 7.26 5.88 7.58
Round-trip fully load incl. storage
#deliveries per year to meet demand # 54.95 145.22 500.40 201.61 54.95 145.22 500.40 201.63 46.31 46.31 46.31 50.63 50.63 185.44
#roundtrips - sailed per year per ship (max capacity given ship working time) # 60.71 81.26 55.95 42.51 67.61 69.21 63.28 42.05 49.67 61.99 32.64 48.24 59.52 46.19
Number of ships needed to meet demand # 0.91 1.79 8.94 4.74 0.81 2.10 7.91 4.79 0.93 0.75 1.42 1.05 0.85 4.02
Nr (fully loaded) ship decided # 1 2 9 5 1 3 8 5 1 1 2 2 1 5
Max number of roundtrips all ships # 60.71 162.52 503.58 212.54 67.61 207.62 506.22 210.26 49.67 61.99 65.27 96.48 59.52 230.93
# roundtrip per year - all ships / delivery # 54.95 145.22 500.40 201.61 54.95 145.22 500.40 201.63 46.31 46.31 46.31 50.63 50.63 185.44
Continuous Alternative
Condition for round trip duration waiting waitingmultiple undloadingmultiple undloading waiting waitingmultiple undloadingmultiple undloading waiting waiting waiting waiting waitingmultiple undloading
Roundtrip time adjusted (roundtrip time as vessel always lays on dock and deliver daily demand)10.58 4.93 6.26 8.23 9.97 5.71 5.53 8.32 13.15 11.69 16.99 12.70 11.27 7.58
Max #roundtrip per ship - adjusted to roundtrip time 33.08 70.99 55.95 42.51 35.12 61.27 63.28 42.05 26.61 29.93 20.60 27.56 31.07 46.19
#deliveries Continuous (# necessary unloading "to create a continuous delivery chain") total yearly hours / time at berth unloading54.95 145.22 146.41 151.57 54.95 145.22 144.61 151.81 46.31 46.31 46.31 50.63 50.63 149.82
# ships per fleet Continuous 1.66 2.05 2.62 3.57 1.56 2.37 2.29 3.61 1.74 1.55 2.25 1.84 1.63 3.24
#simultaneous unloading 0.29 0.76 3.50 1.41 0.29 0.76 3.50 1.41 0.24 0.24 0.24 0.27 0.27 1.30
# ships total 2.00 3.00 10.00 6.00 2.00 3.00 9.00 6.00 2.00 2.00 3.00 2.00 2.00 5.00
load factor overall 0.80 0.53 0.88 0.73 0.72 0.73 0.86 0.75 0.85 0.71 0.67 0.91 0.77 0.75
VOYEX
Vessel power need - sailing mode (3 Engines @4070 kW, 85% load) = average load kW 10379 10379 10379 10379 10379 10379 10379 10379 10379 10379 10379 10379 10379 10379
Total kWh per voyage (adjusted to extended time at port - continuosu delivery strategy) kWh 548 231 184 984 406 503 899 306 401 635 371 797 226 176 921 536 867 370 518 393 1 783 273 919 263 576 772 736 020
Fuel (Diesel) consumption propulsion per voyage (roundtrip) - Diesel consumption (85% load, gas mode) tons 1.26 0.43 0.93 2.07 0.92 0.86 0.52 2.12 1.99 1.19 5.88 2.11 1.33 1.69
Fuel (Gas)consumption propulsion per voyage (roundtrip) - Gas consumption (85% load, gas mode) tons 79 27 58 129 58 53 32 132 125 74 256 132 83 106
Gas consumption compressors/ (un)loading per voyage ton of gas 75 75 99 99 75 75 99 99 75 75 75 75 75 99
Total gas consumption per voyage tons 153 101 158 229 132 128 132 232 199 149 331 207 157 205
MGO price Eur/ton 600 600 600 600 600 600 600 600 600 600 600 600 600 600
Gas price for GASVESSEL fuel Eur/ton 300 300 300 300 300 300 300 300 300 300 300 300 300 300
Total fuel cost per voyage Eur 46 754 30 594 47 904 69 828 40 232 38 905 39 882 70 816 60 952 45 427 102 768 63 260 48 024 62 563
VOYEZ Alt 1 (option w/ storage)
Annual fuel cost (all voyages) M Eur 2.57 4.44 23.97 14.08 2.21 5.65 19.96 14.28 2.82 2.10 4.76 3.20 2.43 11.60
Port cost per annum Meur 1.10 2.90 10.01 4.03 0.55 1.45 5.00 2.02 0.46 - 0.46 0.51 - 3.71
VOYEX total / year (no Continuous) M Euur 3.67 7.35 33.98 18.11 2.76 7.10 24.96 16.30 3.29 2.10 5.22 3.71 2.43 15.31
VOYEX Euro per m3 (no Continuous) Eur/m3 0.0072 0.0054 0.0055 0.0072 0.0054 0.0053 0.0040 0.0065 0.0076 0.0049 0.0121 0.0079 0.0052 0.0067
VOYEX Alt 2 Continuous
fuel cost (backk.to.back) per year MEur 3.09 6.52 26.80 17.81 2.83 7.15 22.71 17.87 3.24 2.72 6.35 3.49 2.98 14.45
Port fees (per port call) M€ per port call 0.01 0.01 0.01 0.01 0.01 0.01 0.01 0.01 0.01 0.01 0.01 0.01 0.01 0.01
port cost (back.toback per year MEur 1.32 4.26 11.19 5.10 0.70 1.84 5.69 2.52 0.53 - 0.62 0.55 - 4.62
Voyage cost per m3 (Continuous) Eur/m3 0.0086 0.0080 0.0061 0.0092 0.0069 0.0067 0.0046 0.0082 0.0088 0.0063 0.0162 0.0086 0.0063 0.0083
STORAGE
Sorage autonomy needed (volume) -theoretical Mm3 6.616 2.206 -31.061 -5.111 6.616 2.206 -31.061 -5.112 7.037 7.037 7.037 6.827 6.827 -3.706
Cylinder Storage unit capacity Mm3 0.0124 0.0124 0.0124 0.0124 0.0124 0.0124 0.0124 0.0124 0.0124 0.0124 0.0124 0.0124 0.0124 0.0124
Cylinder Storage unit cost (1 unit=12400 m3) MEur per cylinder 0.15 0.15 0.15 0.15 0.15 0.15 0.15 0.15 0.15 0.15 0.15 0.15 0.15 0.15
Cylinder Infrastructure for storage MEur per cylinder 0.09 0.09 0.09 0.09 0.09 0.09 0.09 0.09 0.09 0.09 0.09 0.09 0.09 0.09
STORAGE OPTIONS
STORAGE alt 1 Cylinder: CAPEX M€ total 128.0 42.7 0.0 0.0 128.0 42.7 0.0 0.0 136.2 136.2 136.2 132.1 132.1 0.0
STORAGE alt 2: Floating - CAPEX M€ total 170 170 188 188 170 170 188 188 170 170 170 170 170 188
Storage Cylinder OPEX M€ total 12.8 4.3 0.0 0.0 12.8 4.3 0.0 0.0 13.6 13.6 13.6 13.2 13.2 0.0
Storage Floating OPEX M€ total 17.0 17.0 18.8 18.8 17.0 17.0 18.8 18.8 17.0 17.0 17.0 17.0 17.0 18.8
Storage Cylinder CAPEX+OPEX (20yrs) M€ total 140.8 47.0 0.0 0.0 140.8 47.0 0.0 0.0 149.8 149.8 149.8 145.3 145.3 0.0
Storage Floating CAPEX+OPEX (20yrs) M€ total 187.0 187.0 206.8 206.8 187.0 187.0 206.8 206.8 187.0 187.0 187.0 187.0 187.0 206.8
Storage at Loading point CAPEX+OPEX per delivered m3 Eur/m3 0.0138 0.0017 0.0000 0.0000 0.0183 0.0069 0.0017 0.0041 0.0217 0.0217 0.0217 0.0199 0.0199 0.0000
Storage at Unloading point CAPEX+OPEX per delivered m3 Eur/m3 0.014 0.002 0.000 0.000 0.014 0.002 0.000 0.000 0.017 0.022 0.017 0.015 0.020 0.000
LOADING/UNLOADING FACILITIES (excl. STORAGE)
Loading concept Onshore Onshore Onshore Offshore Offshore Offshore Offshore Offshore Onshore
Unloading concept Onshore Onshore OnshoreOnshore/Storag
e
Onshore/Storag
eOnshore/Direct Onshore Offshore Onshore Onshore Offshore Onshore
LOADING
WP6 Loading infrastructure CAPEX 24 21 62 34 19 25 61 34 16 16 16 16 16 31
ALT2 equiped Jetty (based on 2-ship jetty cost) (same for back to back or with storage) Meur 34.7 34.7 69.4 34.7 34.7 34.7 69.4 34.7 34.7 34.7 34.7 34.7 34.7 34.7
CAPEX+OPEX halfcompressor cost at loadig point (Option 1 - storage) Meur 11.0 19.0 75.0 43.0 11.0 27.0 67.0 43.0 11.0 11.0 19.0 19.0 11.0 43.0
CAPEX+OPEX halfcompressor cost at loadig point (Option 2 - continuous delivery) 19.0 27.0 83.0 51.0 19.0 27.0 75.0 51.0 19.0 19.0 27.0 19.0 19.0 43.0
(1) Loading CAPEX + OPEX (incl cost of compressor - ONBOARD ships, with Storage) Meur 37.1 42.4 143.2 80.3 32.1 54.9 134.4 80.3 29.0 28.6 36.6 37.0 28.6 76.6
(2) Loading CAPEX + OPEX (incl cost of compressor - ONBOARD ships, continuous delivery) Meur 45.1 50.4 151.2 88.3 40.1 54.9 142.4 88.3 37.0 36.6 44.6 37.0 36.6 76.6
(3) Loading CAPEX + OPEX (incl cost of compressor - onshore (only 1 compressor at loading point - either for
"storage" or continuous delivery" options) Meur 31.4 32.5 99.2 51.6 26.4 37.0 98.5 51.6 23.0 22.5 22.5 23.2 22.7 46.9
UNLOADING
ALT1: Unloading system cost (ref VTG>NP) Meur 88.00 88.00 163.00 131.00 99.00 115.00 155.00 131.00 70.00 70.00 68.00 78.00 60.00 106.00
WP6 unLoading infrastructure CAPEX 22.00 23.00 47.00 29.21 18.86 23.23 48.50 29.22 12.90 13.00 13.00 12.90 13.00 31.60
ALT2 equiped Jetty (based on 2-ship jetty cost) (same for back to back or with storage) Meur 35 35 69 35 35 35 69 35 35 35 35 35 35 35
CAPEX+OPEX halfcompressor cost at UNloadig point (Option 1 - storage) Meur 11.0 19.0 75.0 43.0 11.0 27.0 67.0 43.0 11.0 11.0 19.0 19.0 11.0 43.0
CAPEX+OPEX halfcompressor cost at UNloadig point (Option 2 - continuous delivery) 19.0 27.0 83.0 51.0 19.0 27.0 75.0 51.0 19.0 19.0 27.0 19.0 19.0 43.0
(1) UNLoading CAPEX + OPEX (incl cost of compressor - ONBOARD ships, with Storage) Meur 35.20 44.30 126.70 75.14 31.75 52.55 120.35 75.14 25.19 25.30 33.30 33.19 25.30 77.76
(2) UNLoading CAPEX + OPEX (incl cost of compressor - ONBOARD ships, continuous delivery)Meur
43 52 135 83 40 53 128 83 33 33 41 33 33 78
(3) UNLoading CAPEX + OPEX (incl cost of compressor - onshore (only 1 compressor at loading point - either
for "storage" or continuous delivery" options) Meur29.5 34.4 82.7 46.4 26.1 34.7 84.4 46.4 19.1 19.2 19.2 19.3 19.4 48.2
LOADING uni cost /m3 (w/storage, option1; incl. infrastructure+GASVESSELcompressor) Eur / m3 0.004 0.002 0.001 0.00161 0.003 0.002 0.001 0.002 0.003 0.003 0.004 0.004 0.003 0.002
LOADING uni cost /m3 (w/continuous, option2; incl. infrastructure+GASVESSELcompressor)Eur / m3
0.004 0.002 0.001 0.00177 0.004 0.002 0.001 0.002 0.004 0.004 0.005 0.004 0.004 0.002
LOADING uni cost /m3 (w/storageORcontinuous; incl. infrastructure+GASVESSELcompressor - Only 1
Compressor onshore) Eur / m30.003 0.001 0.001 0.00103 0.003 0.001 0.001 0.001 0.003 0.003 0.003 0.002 0.002 0.001
UNLOADING uni cost /m3 (w/storage, option1; incl. infrastructure+GASVESSELcompressor) Eur / m3 0.003 0.002 0.001 0.00150 0.003 0.002 0.001 0.002 0.003 0.003 0.004 0.004 0.003 0.002
UNLOADING uni cost /m3 (w/continuous, option2; incl. infrastructure+GASVESSELcompressor)Eur / m3
0.004 0.002 0.001 0.00166 0.004 0.002 0.001 0.002 0.004 0.004 0.005 0.004 0.004 0.002
UNLOADING uni cost /m3 (w/storageORcontinuous; incl. infrastructure+GASVESSELcompressor - Only 1
Compressor onshore) Eur / m30.003 0.001 0.001 0.00093 0.003 0.001 0.001 0.001 0.002 0.002 0.002 0.002 0.002 0.001
RESULTS KPIS (all divided by demand, not actuall deliv vol) Eur / m3
OPTION 1: STORAGE
STORAGE AT LOADING POINT 0.014 0.002 0.000 0.0000 0.018 0.007 0.002 0.0041 0.022 0.022 0.022 0.020 0.020 0.000
LOADING (option with storage, compressor onboard) Eur /m3 0.004 0.002 0.001 0.0016 0.003 0.002 0.001 0.002 0.003 0.003 0.004 0.004 0.003 0.002
LOADING (option with continuous delivery, compressor onboard) Eur /m3 0.004 0.002 0.001 0.0018 0.004 0.002 0.001 0.002 0.004 0.004 0.005 0.004 0.004 0.002
LOADING (storage or continuous, 1 compressor at loading point) Eur /m3 0.003 0.001 0.001 0.00103 0.003 0.001 0.001 0.00103 0.003 0.003 0.003 0.002 0.002 0.001
SAILING GASVESSEL CAPEX Eur /m3 0.018 0.014 0.015 0.0204 0.018 0.021 0.013 0.02040 0.022 0.022 0.043 0.040 0.020 0.022
SAILING GASVESSEL OPEX Eur /m3 0.006 0.005 0.004 0.0062 0.006 0.007 0.004 0.00620 0.007 0.007 0.014 0.013 0.007 0.007
SAILING GASVESSEL VOYEX Eur /m3 0.007 0.005 0.005 0.0072 0.005 0.005 0.004 0.00652 0.008 0.005 0.012 0.008 0.005 0.007
UNLOADING (option with storage, compressor onboard) Eur /m3 0.003 0.002 0.001 0.0015 0.003 0.002 0.001 0.00150 0.003 0.003 0.004 0.004 0.003 0.002
UNLOADING (option with continuous delivery, compressor onboard) Eur /m3 0.004 0.002 0.001 0.0017 0.004 0.002 0.001 0.00166 0.004 0.004 0.005 0.004 0.004 0.002
UNLOADING (storage or continuous, 1 compressor at loading point) Eur /m3 0.003 0.001 0.001 0.00093 0.003 0.001 0.001 0.00093 0.002 0.002 0.002 0.002 0.002 0.001
STORAGE AT UNLOADING POIT Eur /m3 0.014 0.002 0.000 0.0000 0.014 0.002 0.000 0.0000000 0.017 0.022 0.017 0.015 0.020 0.000
Total cost per m3 (with storage) Eur /m3 0.066 0.030 0.027 0.0370 0.068 0.045 0.025 0.040 0.082 0.083 0.117 0.103 0.077 0.039
Total cost per m3 (continuous delivery) Eur /m3 0.068 0.031 0.027 0.0373 0.070 0.045 0.025 0.041 0.084 0.085 0.119 0.103 0.079 0.039
OPTION 2: Continuous Eur /m3
STORAGE AT LOADING POINT Eur /m3 0.000 1.000 2.000 3.0000 4.000 5.000 6.000 7.000 8.000 9.000 10.000 11.000 12.000 13.000
LOADING (option with storage, compressor onboard) Eur /m3 0.004 0.002 0.001 0.0016 0.003 0.002 0.001 0.002 0.003 0.003 0.004 0.004 0.003 0.002
LOADING (option with continuous delivery, compressor onboard) Eur /m3 0.004 0.002 0.001 0.0018 0.004 0.002 0.001 0.002 0.004 0.004 0.005 0.004 0.004 0.002
LOADING (storage or continuous, 1 compressor at loading point) Eur /m3 0.003 0.001 0.001 0.0010 0.003 0.001 0.001 0.00103 0.003 0.003 0.003 0.002 0.002 0.001
SAILING GASVESSEL CAPEX Eur /m3 0.036 0.021 0.016 0.0245 0.036 0.021 0.015 0.024 0.043 0.043 0.065 0.040 0.040 0.022
SAILING GASVESSEL OPEX Eur /m3 0.012 0.007 0.005 0.0074 0.012 0.007 0.004 0.007 0.014 0.014 0.022 0.013 0.013 0.007
SAILING GASVESSEL VOYEX Eur /m3 0.009 0.008 0.006 0.0092 0.007 0.007 0.005 0.008 0.009 0.006 0.016 0.009 0.006 0.008
UNLOADING (option with storage, compressor onboard) Eur /m3 0.003 0.002 0.001 0.0015 0.003 0.002 0.001 0.002 0.003 0.003 0.004 0.004 0.003 0.002
UNLOADING (option with continuous delivery, compressor onboard) Eur /m3 0.004 0.002 0.001 0.0017 0.004 0.002 0.001 0.002 0.004 0.004 0.005 0.004 0.004 0.002
UNLOADING (storage or continuous, 1 compressor at loading point) Eur /m3 0.003 0.001 0.001 0.0009 0.003 0.001 0.001 0.00093 0.002 0.002 0.002 0.002 0.002 0.001
STORAGE Eur /m3 0.000 1.000 2.000 3.0000 4.000 5.000 6.000 7.000 8.000 900 % 10.000 11.000 12.000 13.000
Total cost per m3 (with storage, compressors onboard) Eur /m3 0.066 0.030 0.027 0.037 0.068 0.045 0.025 0.040 0.082 0.083 0.117 0.103 0.077 0.039
Total cost per m3 (continuous delivery, compressors onboard) Eur /m3 0.066 0.039 0.030 0.045 0.063 0.038 0.026 0.044 0.075 0.072 0.113 0.069 0.066 0.041
Total cost per m3 (with storage, 1 compressor at (un)loading points) Eur /m3 0.065 0.030 0.026 0.036 0.067 0.044 0.024 0.039 0.080 0.082 0.114 0.100 0.076 0.038
Total cost per m3 (continuous delivery, 1 compressor at (un)loading points) Eur /m3 0.063 0.038 0.029 0.043 0.061 0.037 0.025 0.042 0.071 0.069 0.107 0.066 0.063 0.039
BARENTS SEAEAST MEDITERRANEAN ONSHORE LOADING EAST MEDITERRANEAN - OFFSHORE LOADING
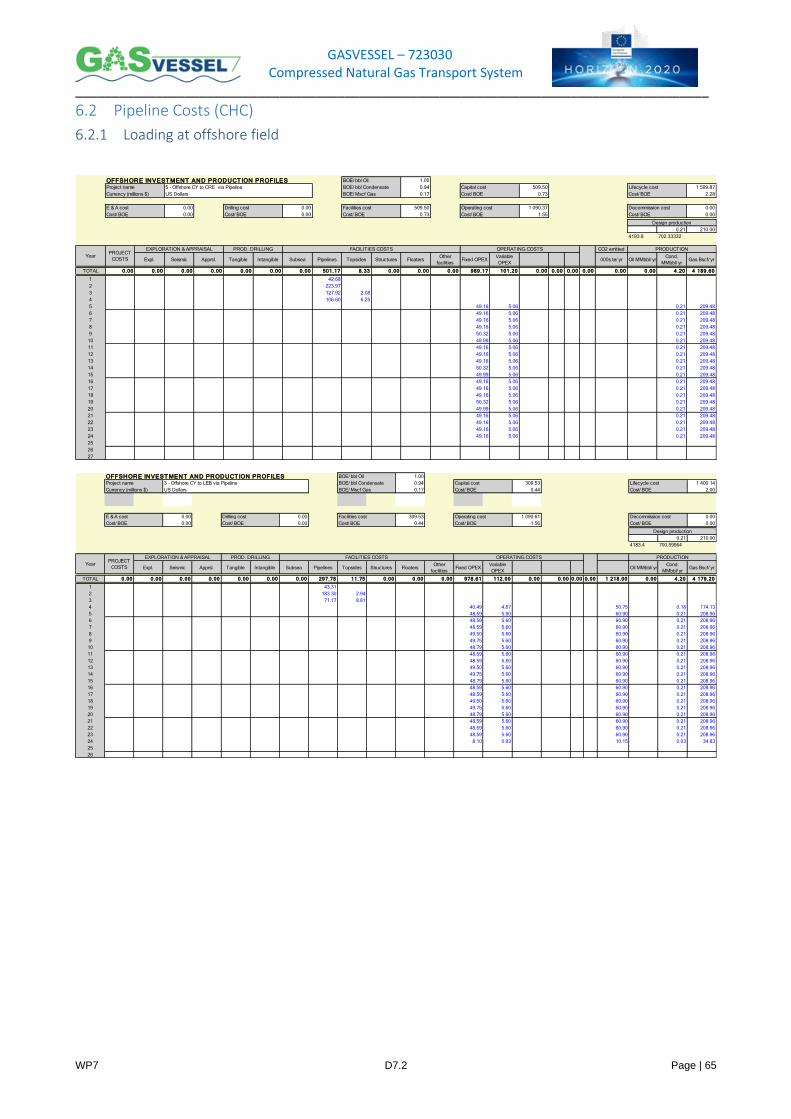
GASVESSEL – 723030 Compressed Natural Gas Transport System
_______________________________________________________________________________________
WP7 D7.2 Page | 65
6.2 Pipeline Costs (CHC)
6.2.1 Loading at offshore field
OFFSHORE INVEST MENT AND PRODUCT ION PROFILES 1.00
0.94 509.50 1 599.87
0.17 0.73 2.28
0.00 0.00 509.50 1 090.37 0.00
0.00 0.00 0.73 1.55 0.00
0.21 210.00
4193.8 702.33332
CO2 emitted
Expl. Seismic Apprsl. Tangible Intangible Subsea Pipelines Topsides Structures FloatersOther
facilitiesFixed OPEX
Variable
OPEX000s te/ yr Oil MMbbl/ yr
Cond.
MMbbl/ yrGas Bscf/ yr
TOTAL 0.00 0.00 0.00 0.00 0.00 0.00 0.00 501.17 8.33 0.00 0.00 0.00 989.17 101.20 0.00 0.00 0.00 0.00 0.00 0.00 4.20 4 189.60
1 42.68
2 223.97
3 127.92 2.08
4 106.60 6.25
5 49.16 5.06 0.21 209.48
6 49.16 5.06 0.21 209.48
7 49.16 5.06 0.21 209.48
8 49.16 5.06 0.21 209.48
9 50.32 5.06 0.21 209.48
10 49.99 5.06 0.21 209.48
11 49.16 5.06 0.21 209.48
12 49.16 5.06 0.21 209.48
13 49.16 5.06 0.21 209.48
14 50.32 5.06 0.21 209.48
15 49.99 5.06 0.21 209.48
16 49.16 5.06 0.21 209.48
17 49.16 5.06 0.21 209.48
18 49.16 5.06 0.21 209.48
19 50.32 5.06 0.21 209.48
20 49.99 5.06 0.21 209.48
21 49.16 5.06 0.21 209.48
22 49.16 5.06 0.21 209.48
23 49.16 5.06 0.21 209.48
24 49.16 5.06 0.21 209.48
25
26
27
PRODUCTION
YearPROJECT
COSTS
EXPLORATION & APPRAISAL PROD. DRILLING FACILITIES COSTS OPERATING COSTS
Cost/ BOE Cost/ BOE Cost/ BOE Cost/ BOE Cost/ BOE
Design production
E & A cost Drilling cost Facilities cost Operating cost Decommission cost
BOE/ bbl Oil
BOE/ bbl Condensate
BOE/ Mscf Gas
Project name 5 - Offshore CY to CRE via Pipeline Capital cost Lifecycle cost
Currency (millions $) US Dollars Cost/ BOE Cost/ BOE
OFFSHORE INVEST MENT AND PRODUCT ION PROFILES 1.00
0.94 309.53 1 400.14
0.17 0.44 2.00
0.00 0.00 309.53 1 090.61 0.00
0.00 0.00 0.44 1.56 0.00
0.21 210.00
4183.4 700.59964
Expl. Seismic Apprsl. Tangible Intangible Subsea Pipelines Topsides Structures FloatersOther
facilitiesFixed OPEX
Variable
OPEXOil MMbbl/ yr
Cond.
MMbbl/ yrGas Bscf/ yr
TOTAL 0.00 0.00 0.00 0.00 0.00 0.00 0.00 297.78 11.75 0.00 0.00 0.00 978.61 112.00 0.00 0.00 0.00 0.00 1 218.00 0.00 4.20 4 179.20
1 43.31
2 183.30 2.94
3 71.17 8.81
4 40.49 4.67 50.75 0.18 174.13
5 48.59 5.60 60.90 0.21 208.96
6 48.59 5.60 60.90 0.21 208.96
7 48.59 5.60 60.90 0.21 208.96
8 49.50 5.60 60.90 0.21 208.96
9 49.75 5.60 60.90 0.21 208.96
10 48.79 5.60 60.90 0.21 208.96
11 48.59 5.60 60.90 0.21 208.96
12 48.59 5.60 60.90 0.21 208.96
13 49.50 5.60 60.90 0.21 208.96
14 49.75 5.60 60.90 0.21 208.96
15 48.79 5.60 60.90 0.21 208.96
16 48.59 5.60 60.90 0.21 208.96
17 48.59 5.60 60.90 0.21 208.96
18 49.50 5.60 60.90 0.21 208.96
19 49.75 5.60 60.90 0.21 208.96
20 48.79 5.60 60.90 0.21 208.96
21 48.59 5.60 60.90 0.21 208.96
22 48.59 5.60 60.90 0.21 208.96
23 48.59 5.60 60.90 0.21 208.96
24 8.10 0.93 10.15 0.03 34.83
25
26
PRODUCTION
YearPROJECT
COSTS
EXPLORATION & APPRAISAL PROD. DRILLING FACILITIES COSTS OPERATING COSTS
Cost/ BOE Cost/ BOE Cost/ BOE Cost/ BOE Cost/ BOE
Design production
E & A cost Drilling cost Facilities cost Operating cost Decommission cost
BOE/ bbl Oil
BOE/ bbl Condensate
BOE/ Mscf Gas
Project name 3 - Offshore CY to LEB via Pipeline Capital cost Lifecycle cost
Currency (millions $) US Dollars Cost/ BOE Cost/ BOE
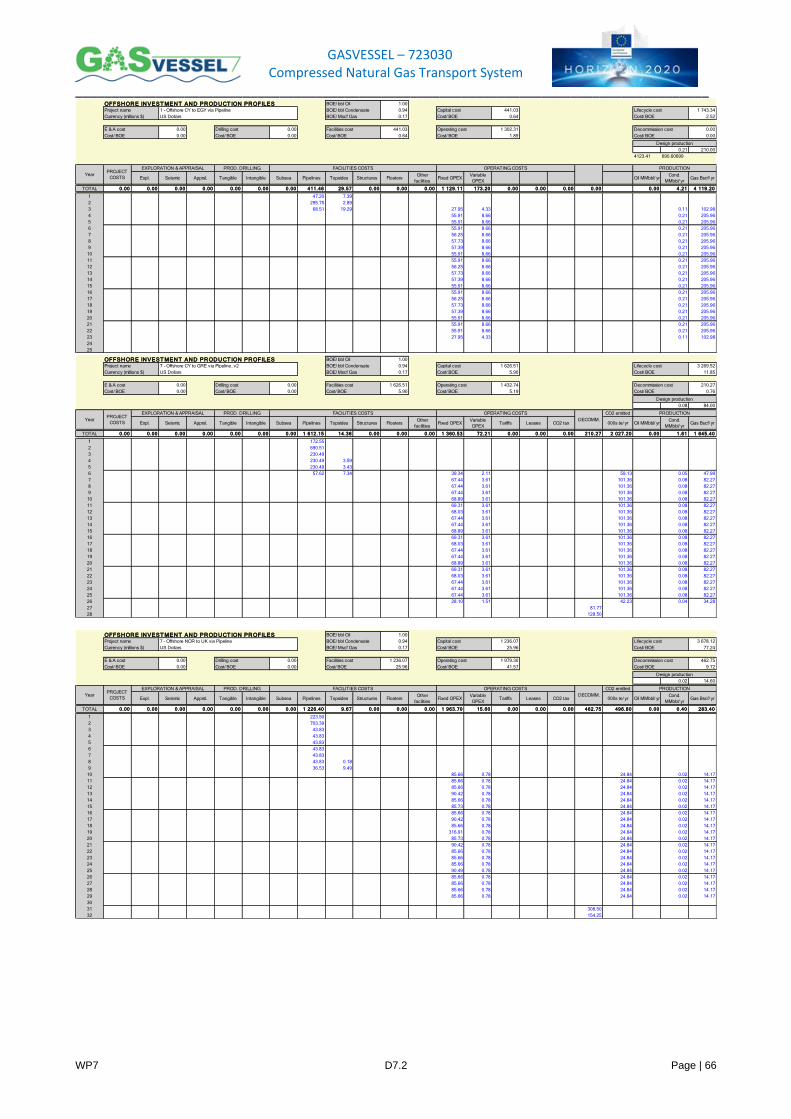
GASVESSEL – 723030 Compressed Natural Gas Transport System
_______________________________________________________________________________________
WP7 D7.2 Page | 66
OFFSHORE INVEST MENT AND PRODUCT ION PROFILES 1.00
0.94 441.03 1 743.34
0.17 0.64 2.52
0.00 0.00 441.03 1 302.31 0.00
0.00 0.00 0.64 1.89 0.00
0.21 210.00
4123.41 690.60699
Expl. Seismic Apprsl. Tangible Intangible Subsea Pipelines Topsides Structures FloatersOther
facilitiesFixed OPEX
Variable
OPEXOil MMbbl/ yr
Cond.
MMbbl/ yrGas Bscf/ yr
TOTAL 0.00 0.00 0.00 0.00 0.00 0.00 0.00 411.46 29.57 0.00 0.00 0.00 1 129.11 173.20 0.00 0.00 0.00 0.00 0.00 4.21 4 119.20
1 47.20 7.39
2 295.75 2.89
3 68.51 19.29 27.95 4.33 0.11 102.98
4 55.91 8.66 0.21 205.96
5 55.91 8.66 0.21 205.96
6 55.91 8.66 0.21 205.96
7 56.25 8.66 0.21 205.96
8 57.73 8.66 0.21 205.96
9 57.39 8.66 0.21 205.96
10 55.91 8.66 0.21 205.96
11 55.91 8.66 0.21 205.96
12 56.25 8.66 0.21 205.96
13 57.73 8.66 0.21 205.96
14 57.39 8.66 0.21 205.96
15 55.91 8.66 0.21 205.96
16 55.91 8.66 0.21 205.96
17 56.25 8.66 0.21 205.96
18 57.73 8.66 0.21 205.96
19 57.39 8.66 0.21 205.96
20 55.91 8.66 0.21 205.96
21 55.91 8.66 0.21 205.96
22 55.91 8.66 0.21 205.96
23 27.95 4.33 0.11 102.98
24
25
Capital cost Lifecycle cost
Currency (millions $) US Dollars Cost/ BOE Cost/ BOE
E & A cost Drilling cost Facilities cost Operating cost Decommission cost
BOE/ bbl Oil
BOE/ bbl Condensate
BOE/ Mscf Gas
Project name 1 - Offshore CY to EGY via Pipeline
Cost/ BOE Cost/ BOE Cost/ BOE Cost/ BOE Cost/ BOE
Design production
PRODUCTION
YearPROJECT
COSTS
EXPLORATION & APPRAISAL PROD. DRILLING FACILITIES COSTS OPERATING COSTS
OFFSHORE INVEST MENT AND PRODUCT ION PROFILES 1.00
0.94 1 626.51 3 269.52
0.17 5.90 11.85
0.00 0.00 1 626.51 1 432.74 210.27
0.00 0.00 5.90 5.19 0.76
0.08 84.00
CO2 emitted
Expl. Seismic Apprsl. Tangible Intangible Subsea Pipelines Topsides Structures FloatersOther
facilitiesFixed OPEX
Variable
OPEXTariffs Leases CO2 tax 000s te/ yr Oil MMbbl/ yr
Cond.
MMbbl/ yrGas Bscf/ yr
TOTAL 0.00 0.00 0.00 0.00 0.00 0.00 0.00 1 612.15 14.36 0.00 0.00 0.00 1 360.53 72.21 0.00 0.00 0.00 210.27 2 027.20 0.00 1.61 1 645.40
1 172.55
2 690.51
3 230.49
4 230.49 3.59
5 230.49 3.43
6 57.62 7.34 39.34 2.11 59.13 0.05 47.99
7 67.44 3.61 101.36 0.08 82.27
8 67.44 3.61 101.36 0.08 82.27
9 67.44 3.61 101.36 0.08 82.27
10 68.89 3.61 101.36 0.08 82.27
11 69.31 3.61 101.36 0.08 82.27
12 68.03 3.61 101.36 0.08 82.27
13 67.44 3.61 101.36 0.08 82.27
14 67.44 3.61 101.36 0.08 82.27
15 68.89 3.61 101.36 0.08 82.27
16 69.31 3.61 101.36 0.08 82.27
17 68.03 3.61 101.36 0.08 82.27
18 67.44 3.61 101.36 0.08 82.27
19 67.44 3.61 101.36 0.08 82.27
20 68.89 3.61 101.36 0.08 82.27
21 69.31 3.61 101.36 0.08 82.27
22 68.03 3.61 101.36 0.08 82.27
23 67.44 3.61 101.36 0.08 82.27
24 67.44 3.61 101.36 0.08 82.27
25 67.44 3.61 101.36 0.08 82.27
26 28.10 1.51 42.23 0.04 34.28
27 81.77
28 128.50
DECOMM.
PRODUCTION
YearPROJECT
COSTS
EXPLORATION & APPRAISAL PROD. DRILLING FACILITIES COSTS OPERATING COSTS
Cost/ BOE Cost/ BOE Cost/ BOE Cost/ BOE Cost/ BOE
Design production
E & A cost Drilling cost Facilities cost Operating cost Decommission cost
BOE/ bbl Oil
BOE/ bbl Condensate
BOE/ Mscf Gas
Project name 7 - Offshore CY to GRE via Pipeline_v2 Capital cost Lifecycle cost
Currency (millions $) US Dollars Cost/ BOE Cost/ BOE
OFFSHORE INVEST MENT AND PRODUCT ION PROFILES 1.00
0.94 1 236.07 3 678.12
0.17 25.96 77.24
0.00 0.00 1 236.07 1 979.30 462.75
0.00 0.00 25.96 41.57 9.72
0.02 14.60
CO2 emitted
Expl. Seismic Apprsl. Tangible Intangible Subsea Pipelines Topsides Structures FloatersOther
facilitiesFixed OPEX
Variable
OPEXTariffs Leases CO2 tax 000s te/ yr Oil MMbbl/ yr
Cond.
MMbbl/ yrGas Bscf/ yr
TOTAL 0.00 0.00 0.00 0.00 0.00 0.00 0.00 1 226.40 9.67 0.00 0.00 0.00 1 963.70 15.60 0.00 0.00 0.00 462.75 496.80 0.00 0.40 283.40
1 223.50
2 703.39
3 43.83
4 43.83
5 43.83
6 43.83
7 43.83
8 43.83 0.18
9 36.53 9.49
10 85.66 0.78 24.84 0.02 14.17
11 85.66 0.78 24.84 0.02 14.17
12 85.66 0.78 24.84 0.02 14.17
13 90.42 0.78 24.84 0.02 14.17
14 85.66 0.78 24.84 0.02 14.17
15 85.73 0.78 24.84 0.02 14.17
16 85.66 0.78 24.84 0.02 14.17
17 90.42 0.78 24.84 0.02 14.17
18 85.66 0.78 24.84 0.02 14.17
19 316.91 0.78 24.84 0.02 14.17
20 85.73 0.78 24.84 0.02 14.17
21 90.42 0.78 24.84 0.02 14.17
22 85.66 0.78 24.84 0.02 14.17
23 85.66 0.78 24.84 0.02 14.17
24 85.66 0.78 24.84 0.02 14.17
25 90.49 0.78 24.84 0.02 14.17
26 85.66 0.78 24.84 0.02 14.17
27 85.66 0.78 24.84 0.02 14.17
28 85.66 0.78 24.84 0.02 14.17
29 85.66 0.78 24.84 0.02 14.17
30
31 308.50
32 154.25
DECOMM.
PRODUCTION
YearPROJECT
COSTS
EXPLORATION & APPRAISAL PROD. DRILLING FACILITIES COSTS OPERATING COSTS
Cost/ BOE Cost/ BOE Cost/ BOE Cost/ BOE Cost/ BOE
Design production
E & A cost Drilling cost Facilities cost Operating cost Decommission cost
BOE/ bbl Oil
BOE/ bbl Condensate
BOE/ Mscf Gas
Project name 7 - Offshore NOR to UK via Pipeline Capital cost Lifecycle cost
Currency (millions $) US Dollars Cost/ BOE Cost/ BOE
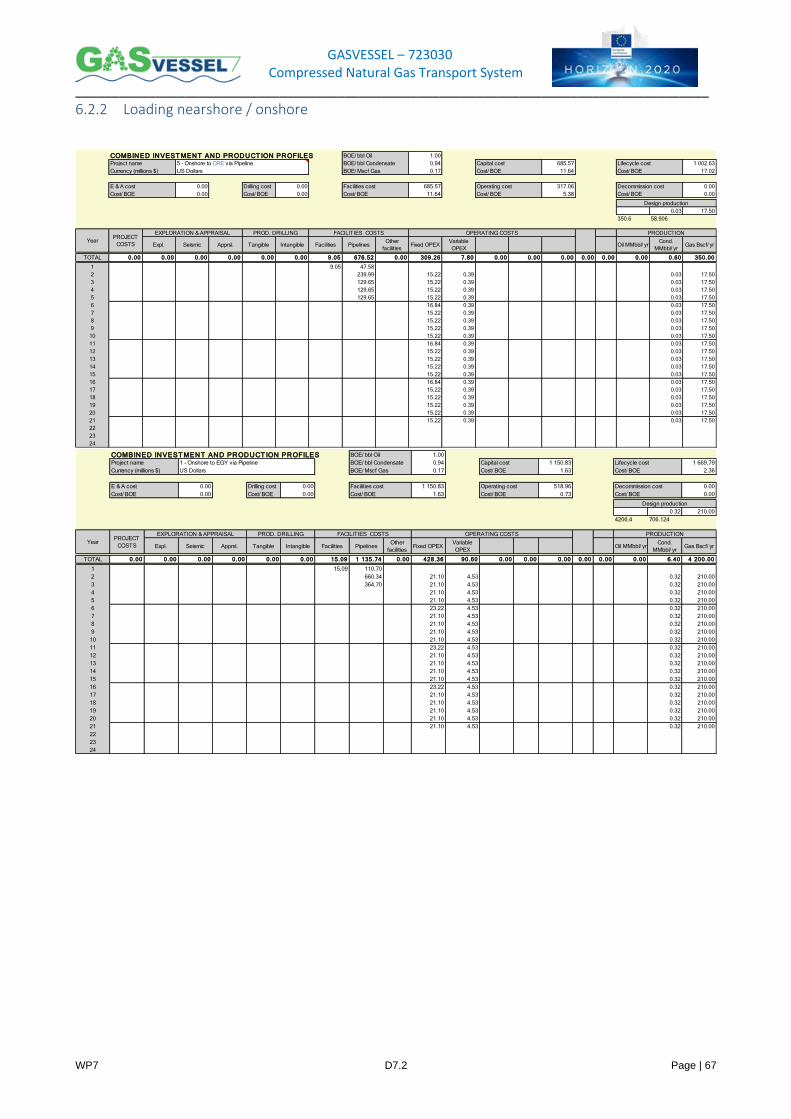
GASVESSEL – 723030 Compressed Natural Gas Transport System
_______________________________________________________________________________________
WP7 D7.2 Page | 67
6.2.2 Loading nearshore / onshore
COMBINED INVEST MENT AND PRODUCT ION PROFILES 1.00
0.94 685.57 1 002.63
0.17 11.64 17.02
0.00 Drilling cost 0.00 685.57 317.06 0.00
0.00 Cost/ BOE 0.00 11.64 5.38 0.00
0.03 17.50
350.6 58.906
Expl. Seismic Apprsl. Tangible Intangible Facilities PipelinesOther
facilitiesFixed OPEX
Variable
OPEXOil MMbbl/ yr
Cond.
MMbbl/ yrGas Bscf/ yr
TOTAL 0.00 0.00 0.00 0.00 0.00 0.00 9.05 676.52 0.00 309.26 7.80 0.00 0.00 0.00 0.00 0.00 0.00 0.60 350.00
1 9.05 47.58
2 239.99 15.22 0.39 0.03 17.50
3 129.65 15.22 0.39 0.03 17.50
4 129.65 15.22 0.39 0.03 17.50
5 129.65 15.22 0.39 0.03 17.50
6 16.84 0.39 0.03 17.50
7 15.22 0.39 0.03 17.50
8 15.22 0.39 0.03 17.50
9 15.22 0.39 0.03 17.50
10 15.22 0.39 0.03 17.50
11 16.84 0.39 0.03 17.50
12 15.22 0.39 0.03 17.50
13 15.22 0.39 0.03 17.50
14 15.22 0.39 0.03 17.50
15 15.22 0.39 0.03 17.50
16 16.84 0.39 0.03 17.50
17 15.22 0.39 0.03 17.50
18 15.22 0.39 0.03 17.50
19 15.22 0.39 0.03 17.50
20 15.22 0.39 0.03 17.50
21 15.22 0.39 0.03 17.50
22
23
24
US Dollars Cost/ BOE Cost/ BOE
Operating cost Decommission cost
BOE/ bbl Oil
BOE/ bbl Condensate
BOE/ Mscf Gas
Project name 5 - Onshore to CRE via Pipeline Capital cost Lifecycle cost
Currency (millions $)
YearPROJECT
COSTS
EXPLORATION & APPRAISAL PROD. DRILLING FACILITIES COSTS
E & A cost Facilities cost
OPERATING COSTS PRODUCTION
Cost/ BOE Cost/ BOE Cost/ BOE Cost/ BOE
Design production
COMBINED INVEST MENT AND PRODUCT ION PROFILES 1.00
0.94 1 150.83 1 669.79
0.17 1.63 2.36
0.00 Drilling cost 0.00 1 150.83 518.96 0.00
0.00 Cost/ BOE 0.00 1.63 0.73 0.00
0.32 210.00
4206.4 706.124
Expl. Seismic Apprsl. Tangible Intangible Facilities PipelinesOther
facilitiesFixed OPEX
Variable
OPEXOil MMbbl/ yr
Cond.
MMbbl/ yrGas Bscf/ yr
TOTAL 0.00 0.00 0.00 0.00 0.00 0.00 15.09 1 135.74 0.00 428.36 90.60 0.00 0.00 0.00 0.00 0.00 0.00 6.40 4 200.00
1 15.09 110.70
2 660.34 21.10 4.53 0.32 210.00
3 364.70 21.10 4.53 0.32 210.00
4 21.10 4.53 0.32 210.00
5 21.10 4.53 0.32 210.00
6 23.22 4.53 0.32 210.00
7 21.10 4.53 0.32 210.00
8 21.10 4.53 0.32 210.00
9 21.10 4.53 0.32 210.00
10 21.10 4.53 0.32 210.00
11 23.22 4.53 0.32 210.00
12 21.10 4.53 0.32 210.00
13 21.10 4.53 0.32 210.00
14 21.10 4.53 0.32 210.00
15 21.10 4.53 0.32 210.00
16 23.22 4.53 0.32 210.00
17 21.10 4.53 0.32 210.00
18 21.10 4.53 0.32 210.00
19 21.10 4.53 0.32 210.00
20 21.10 4.53 0.32 210.00
21 21.10 4.53 0.32 210.00
22
23
24
US Dollars Cost/ BOE Cost/ BOE
Operating cost Decommission cost
BOE/ bbl Oil
BOE/ bbl Condensate
BOE/ Mscf Gas
Project name 1 - Onshore to EGY via Pipeline Capital cost Lifecycle cost
Currency (millions $)
YearPROJECT
COSTS
EXPLORATION & APPRAISAL PROD. DRILLING FACILITIES COSTS
E & A cost Facilities cost
OPERATING COSTS PRODUCTION
Cost/ BOE Cost/ BOE Cost/ BOE Cost/ BOE
Design production
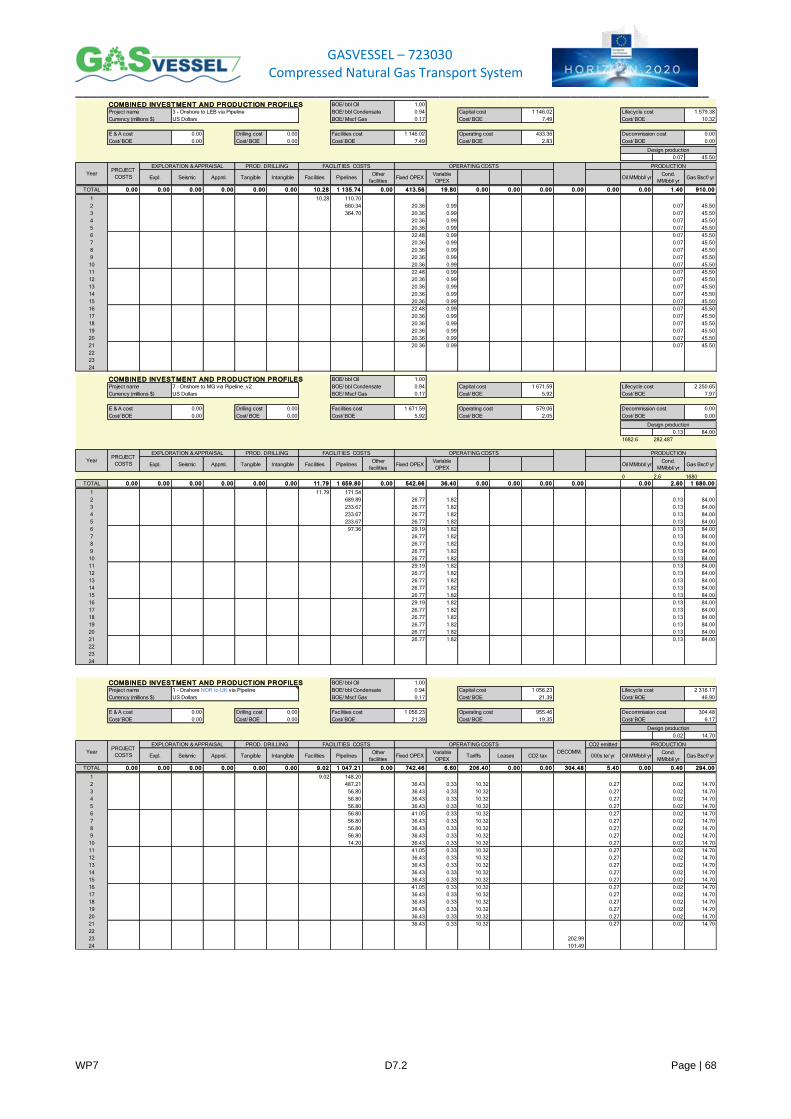
GASVESSEL – 723030 Compressed Natural Gas Transport System
_______________________________________________________________________________________
WP7 D7.2 Page | 68
COMBINED INVEST MENT AND PRODUCT ION PROFILES 1.00
0.94 1 146.02 1 579.38
0.17 7.49 10.32
0.00 Drilling cost 0.00 1 146.02 433.36 0.00
0.00 Cost/ BOE 0.00 7.49 2.83 0.00
0.07 45.50
Expl. Seismic Apprsl. Tangible Intangible Facilities PipelinesOther
facilitiesFixed OPEX
Variable
OPEXOil MMbbl/ yr
Cond.
MMbbl/ yrGas Bscf/ yr
TOTAL 0.00 0.00 0.00 0.00 0.00 0.00 10.28 1 135.74 0.00 413.56 19.80 0.00 0.00 0.00 0.00 0.00 0.00 1.40 910.00
1 10.28 110.70
2 660.34 20.36 0.99 0.07 45.50
3 364.70 20.36 0.99 0.07 45.50
4 20.36 0.99 0.07 45.50
5 20.36 0.99 0.07 45.50
6 22.48 0.99 0.07 45.50
7 20.36 0.99 0.07 45.50
8 20.36 0.99 0.07 45.50
9 20.36 0.99 0.07 45.50
10 20.36 0.99 0.07 45.50
11 22.48 0.99 0.07 45.50
12 20.36 0.99 0.07 45.50
13 20.36 0.99 0.07 45.50
14 20.36 0.99 0.07 45.50
15 20.36 0.99 0.07 45.50
16 22.48 0.99 0.07 45.50
17 20.36 0.99 0.07 45.50
18 20.36 0.99 0.07 45.50
19 20.36 0.99 0.07 45.50
20 20.36 0.99 0.07 45.50
21 20.36 0.99 0.07 45.50
22
23
24
E & A cost Facilities cost
OPERATING COSTS PRODUCTION
Cost/ BOE Cost/ BOE Cost/ BOE Cost/ BOE
Design production
Project name 3 - Onshore to LEB via Pipeline Capital cost Lifecycle cost
Currency (millions $)
YearPROJECT
COSTS
EXPLORATION & APPRAISAL PROD. DRILLING FACILITIES COSTS
US Dollars Cost/ BOE Cost/ BOE
Operating cost Decommission cost
BOE/ bbl Oil
BOE/ bbl Condensate
BOE/ Mscf Gas
COMBINED INVEST MENT AND PRODUCT ION PROFILES 1.00
0.94 1 671.59 2 250.65
0.17 5.92 7.97
0.00 Drilling cost 0.00 1 671.59 579.06 0.00
0.00 Cost/ BOE 0.00 5.92 2.05 0.00
0.13 84.00
1682.6 282.487
Expl. Seismic Apprsl. Tangible Intangible Facilities PipelinesOther
facilitiesFixed OPEX
Variable
OPEXOil MMbbl/ yr
Cond.
MMbbl/ yrGas Bscf/ yr
0 2.6 1680
TOTAL 0.00 0.00 0.00 0.00 0.00 0.00 11.79 1 659.80 0.00 542.66 36.40 0.00 0.00 0.00 0.00 0.00 2.60 1 680.00
1 11.79 171.54
2 689.89 26.77 1.82 0.13 84.00
3 233.67 26.77 1.82 0.13 84.00
4 233.67 26.77 1.82 0.13 84.00
5 233.67 26.77 1.82 0.13 84.00
6 97.36 29.19 1.82 0.13 84.00
7 26.77 1.82 0.13 84.00
8 26.77 1.82 0.13 84.00
9 26.77 1.82 0.13 84.00
10 26.77 1.82 0.13 84.00
11 29.19 1.82 0.13 84.00
12 26.77 1.82 0.13 84.00
13 26.77 1.82 0.13 84.00
14 26.77 1.82 0.13 84.00
15 26.77 1.82 0.13 84.00
16 29.19 1.82 0.13 84.00
17 26.77 1.82 0.13 84.00
18 26.77 1.82 0.13 84.00
19 26.77 1.82 0.13 84.00
20 26.77 1.82 0.13 84.00
21 26.77 1.82 0.13 84.00
22
23
24
E & A cost Facilities cost
OPERATING COSTS PRODUCTION
Cost/ BOE Cost/ BOE Cost/ BOE Cost/ BOE
Design production
Project name 7 - Onshore to MG via Pipeline_v2 Capital cost Lifecycle cost
Currency (millions $)
YearPROJECT
COSTS
EXPLORATION & APPRAISAL PROD. DRILLING FACILITIES COSTS
US Dollars Cost/ BOE Cost/ BOE
Operating cost Decommission cost
BOE/ bbl Oil
BOE/ bbl Condensate
BOE/ Mscf Gas
COMBINED INVEST MENT AND PRODUCT ION PROFILES 1.00
0.94 1 056.23 2 316.17
0.17 21.39 46.90
0.00 Drilling cost 0.00 1 056.23 955.46 304.48
0.00 Cost/ BOE 0.00 21.39 19.35 6.17
0.02 14.70
CO2 emitted
Expl. Seismic Apprsl. Tangible Intangible Facilities PipelinesOther
facilitiesFixed OPEX
Variable
OPEXTariffs Leases CO2 tax 000s te/ yr Oil MMbbl/ yr
Cond.
MMbbl/ yrGas Bscf/ yr
TOTAL 0.00 0.00 0.00 0.00 0.00 0.00 9.02 1 047.21 0.00 742.46 6.60 206.40 0.00 0.00 304.48 5.40 0.00 0.40 294.00
1 9.02 148.20
2 487.21 36.43 0.33 10.32 0.27 0.02 14.70
3 56.80 36.43 0.33 10.32 0.27 0.02 14.70
4 56.80 36.43 0.33 10.32 0.27 0.02 14.70
5 56.80 36.43 0.33 10.32 0.27 0.02 14.70
6 56.80 41.05 0.33 10.32 0.27 0.02 14.70
7 56.80 36.43 0.33 10.32 0.27 0.02 14.70
8 56.80 36.43 0.33 10.32 0.27 0.02 14.70
9 56.80 36.43 0.33 10.32 0.27 0.02 14.70
10 14.20 36.43 0.33 10.32 0.27 0.02 14.70
11 41.05 0.33 10.32 0.27 0.02 14.70
12 36.43 0.33 10.32 0.27 0.02 14.70
13 36.43 0.33 10.32 0.27 0.02 14.70
14 36.43 0.33 10.32 0.27 0.02 14.70
15 36.43 0.33 10.32 0.27 0.02 14.70
16 41.05 0.33 10.32 0.27 0.02 14.70
17 36.43 0.33 10.32 0.27 0.02 14.70
18 36.43 0.33 10.32 0.27 0.02 14.70
19 36.43 0.33 10.32 0.27 0.02 14.70
20 36.43 0.33 10.32 0.27 0.02 14.70
21 36.43 0.33 10.32 0.27 0.02 14.70
22
23 202.99
24 101.49
OPERATING COSTS
DECOMM.
PRODUCTION
Cost/ BOE Cost/ BOE Cost/ BOE Cost/ BOE
Design production
YearPROJECT
COSTS
EXPLORATION & APPRAISAL PROD. DRILLING FACILITIES COSTS
E & A cost Facilities cost Operating cost Decommission cost
BOE/ bbl Oil
BOE/ bbl Condensate
BOE/ Mscf Gas
Project name 1 - Onshore NOR to UK via Pipeline Capital cost Lifecycle cost
Currency (millions $) US Dollars Cost/ BOE Cost/ BOE
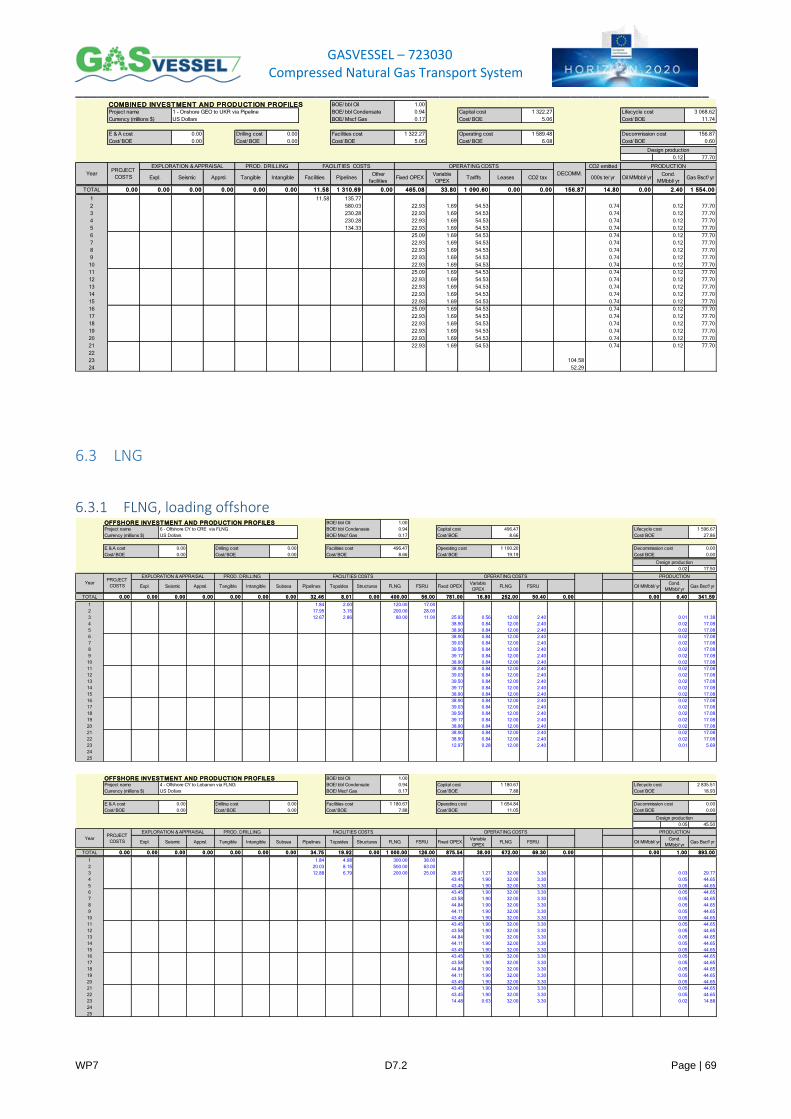
GASVESSEL – 723030 Compressed Natural Gas Transport System
_______________________________________________________________________________________
WP7 D7.2 Page | 69
6.3 LNG
6.3.1 FLNG, loading offshore
COMBINED INVEST MENT AND PRODUCT ION PROFILES 1.00
0.94 1 322.27 3 068.62
0.17 5.06 11.74
0.00 Drilling cost 0.00 1 322.27 1 589.48 156.87
0.00 Cost/ BOE 0.00 5.06 6.08 0.60
0.12 77.70
CO2 emitted
Expl. Seismic Apprsl. Tangible Intangible Facilities PipelinesOther
facilitiesFixed OPEX
Variable
OPEXTariffs Leases CO2 tax 000s te/ yr Oil MMbbl/ yr
Cond.
MMbbl/ yrGas Bscf/ yr
TOTAL 0.00 0.00 0.00 0.00 0.00 0.00 11.58 1 310.69 0.00 465.08 33.80 1 090.60 0.00 0.00 156.87 14.80 0.00 2.40 1 554.00
1 11.58 135.77
2 580.03 22.93 1.69 54.53 0.74 0.12 77.70
3 230.28 22.93 1.69 54.53 0.74 0.12 77.70
4 230.28 22.93 1.69 54.53 0.74 0.12 77.70
5 134.33 22.93 1.69 54.53 0.74 0.12 77.70
6 25.09 1.69 54.53 0.74 0.12 77.70
7 22.93 1.69 54.53 0.74 0.12 77.70
8 22.93 1.69 54.53 0.74 0.12 77.70
9 22.93 1.69 54.53 0.74 0.12 77.70
10 22.93 1.69 54.53 0.74 0.12 77.70
11 25.09 1.69 54.53 0.74 0.12 77.70
12 22.93 1.69 54.53 0.74 0.12 77.70
13 22.93 1.69 54.53 0.74 0.12 77.70
14 22.93 1.69 54.53 0.74 0.12 77.70
15 22.93 1.69 54.53 0.74 0.12 77.70
16 25.09 1.69 54.53 0.74 0.12 77.70
17 22.93 1.69 54.53 0.74 0.12 77.70
18 22.93 1.69 54.53 0.74 0.12 77.70
19 22.93 1.69 54.53 0.74 0.12 77.70
20 22.93 1.69 54.53 0.74 0.12 77.70
21 22.93 1.69 54.53 0.74 0.12 77.70
22
23 104.58
24 52.29
OPERATING COSTS
DECOMM.
PRODUCTION
Cost/ BOE Cost/ BOE Cost/ BOE Cost/ BOE
Design production
YearPROJECT
COSTS
EXPLORATION & APPRAISAL PROD. DRILLING FACILITIES COSTS
E & A cost Facilities cost Operating cost Decommission cost
BOE/ bbl Oil
BOE/ bbl Condensate
BOE/ Mscf Gas
Project name 1 - Onshore GEO to UKR via Pipeline Capital cost Lifecycle cost
Currency (millions $) US Dollars Cost/ BOE Cost/ BOE
OFFSHORE INVEST MENT AND PRODUCT ION PROFILES 1.00
0.94 496.47 1 596.67
0.17 8.66 27.86
0.00 0.00 496.47 1 100.20 0.00
0.00 0.00 8.66 19.19 0.00
0.02 17.50
Expl. Seismic Apprsl. Tangible Intangible Subsea Pipelines Topsides Structures FLNG FSRU Fixed OPEXVariable
OPEXFLNG FSRU Oil MMbbl/ yr
Cond.
MMbbl/ yrGas Bscf/ yr
TOTAL 0.00 0.00 0.00 0.00 0.00 0.00 0.00 32.46 8.01 0.00 400.00 56.00 781.00 16.80 252.00 50.40 0.00 0.00 0.40 341.59
1 1.84 2.00 120.00 17.00
2 17.95 3.15 200.00 28.00
3 12.67 2.86 80.00 11.00 25.93 0.56 12.00 2.40 0.01 11.38
4 38.90 0.84 12.00 2.40 0.02 17.08
5 38.90 0.84 12.00 2.40 0.02 17.08
6 38.90 0.84 12.00 2.40 0.02 17.08
7 39.03 0.84 12.00 2.40 0.02 17.08
8 39.50 0.84 12.00 2.40 0.02 17.08
9 39.17 0.84 12.00 2.40 0.02 17.08
10 38.90 0.84 12.00 2.40 0.02 17.08
11 38.90 0.84 12.00 2.40 0.02 17.08
12 39.03 0.84 12.00 2.40 0.02 17.08
13 39.50 0.84 12.00 2.40 0.02 17.08
14 39.17 0.84 12.00 2.40 0.02 17.08
15 38.90 0.84 12.00 2.40 0.02 17.08
16 38.90 0.84 12.00 2.40 0.02 17.08
17 39.03 0.84 12.00 2.40 0.02 17.08
18 39.50 0.84 12.00 2.40 0.02 17.08
19 39.17 0.84 12.00 2.40 0.02 17.08
20 38.90 0.84 12.00 2.40 0.02 17.08
21 38.90 0.84 12.00 2.40 0.02 17.08
22 38.90 0.84 12.00 2.40 0.02 17.08
23 12.97 0.28 12.00 2.40 0.01 5.69
24
25
Capital cost Lifecycle cost
Currency (millions $) US Dollars Cost/ BOE Cost/ BOE
E & A cost Drilling cost Facilities cost Operating cost Decommission cost
BOE/ bbl Oil
BOE/ bbl Condensate
BOE/ Mscf Gas
Project name 6 - Offshore CY to CRE via FLNG
Cost/ BOE Cost/ BOE Cost/ BOE Cost/ BOE Cost/ BOE
Design production
PRODUCTION
YearPROJECT
COSTS
EXPLORATION & APPRAISAL PROD. DRILLING FACILITIES COSTS OPERATING COSTS
OFFSHORE INVEST MENT AND PRODUCT ION PROFILES 1.00
0.94 1 180.67 2 835.51
0.17 7.88 18.93
0.00 0.00 1 180.67 1 654.84 0.00
0.00 0.00 7.88 11.05 0.00
0.05 45.50
Expl. Seismic Apprsl. Tangible Intangible Subsea Pipelines Topsides Structures FLNG FSRU Fixed OPEXVariable
OPEXFLNG FSRU Oil MMbbl/ yr
Cond.
MMbbl/ yrGas Bscf/ yr
TOTAL 0.00 0.00 0.00 0.00 0.00 0.00 0.00 34.75 19.92 0.00 1 000.00 126.00 875.54 38.00 672.00 69.30 0.00 0.00 1.00 893.00
1 1.84 4.98 300.00 38.00
2 20.03 8.15 500.00 63.00
3 12.88 6.79 200.00 25.00 28.97 1.27 32.00 3.30 0.03 29.77
4 43.45 1.90 32.00 3.30 0.05 44.65
5 43.45 1.90 32.00 3.30 0.05 44.65
6 43.45 1.90 32.00 3.30 0.05 44.65
7 43.58 1.90 32.00 3.30 0.05 44.65
8 44.84 1.90 32.00 3.30 0.05 44.65
9 44.11 1.90 32.00 3.30 0.05 44.65
10 43.45 1.90 32.00 3.30 0.05 44.65
11 43.45 1.90 32.00 3.30 0.05 44.65
12 43.58 1.90 32.00 3.30 0.05 44.65
13 44.84 1.90 32.00 3.30 0.05 44.65
14 44.11 1.90 32.00 3.30 0.05 44.65
15 43.45 1.90 32.00 3.30 0.05 44.65
16 43.45 1.90 32.00 3.30 0.05 44.65
17 43.58 1.90 32.00 3.30 0.05 44.65
18 44.84 1.90 32.00 3.30 0.05 44.65
19 44.11 1.90 32.00 3.30 0.05 44.65
20 43.45 1.90 32.00 3.30 0.05 44.65
21 43.45 1.90 32.00 3.30 0.05 44.65
22 43.45 1.90 32.00 3.30 0.05 44.65
23 14.48 0.63 32.00 3.30 0.02 14.88
24
25
PRODUCTION
YearPROJECT
COSTS
EXPLORATION & APPRAISAL PROD. DRILLING FACILITIES COSTS OPERATING COSTS
Cost/ BOE Cost/ BOE Cost/ BOE Cost/ BOE Cost/ BOE
Design production
E & A cost Drilling cost Facilities cost Operating cost Decommission cost
BOE/ bbl Oil
BOE/ bbl Condensate
BOE/ Mscf Gas
Project name 4 - Offshore CY to Lebanon via FLNG Capital cost Lifecycle cost
Currency (millions $) US Dollars Cost/ BOE Cost/ BOE
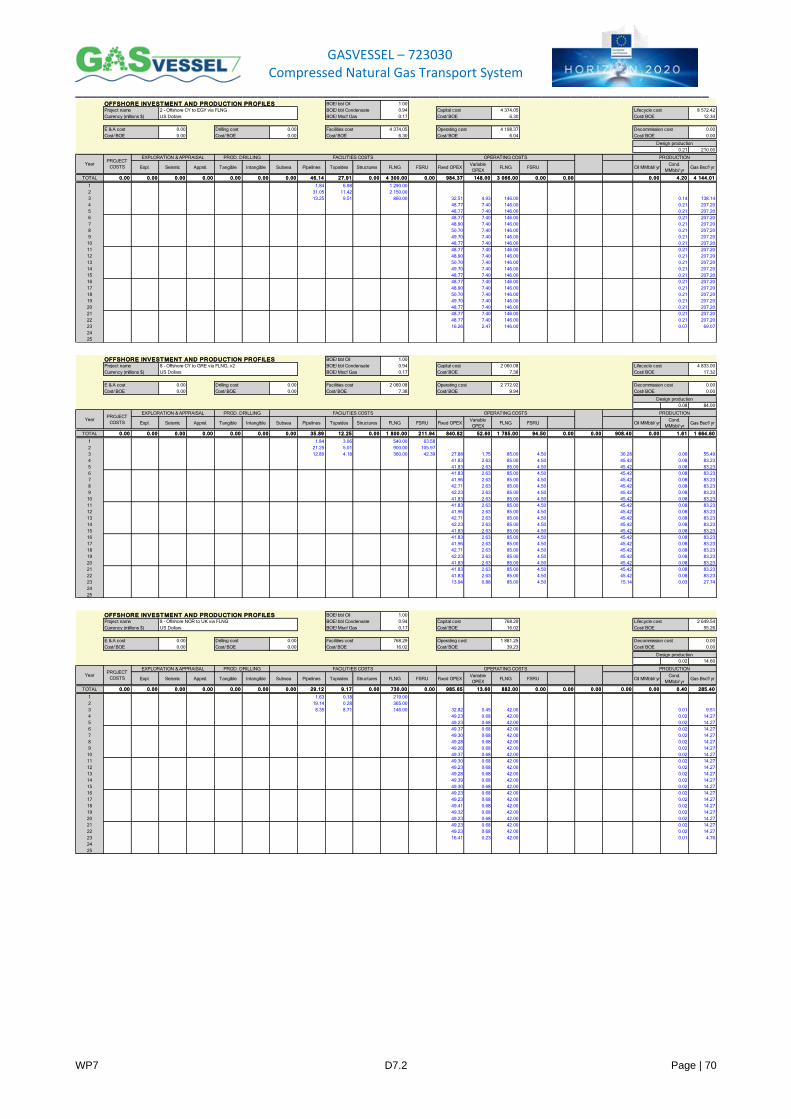
GASVESSEL – 723030 Compressed Natural Gas Transport System
_______________________________________________________________________________________
WP7 D7.2 Page | 70
OFFSHORE INVEST MENT AND PRODUCT ION PROFILES 1.00
0.94 4 374.05 8 572.42
0.17 6.30 12.34
0.00 0.00 4 374.05 4 198.37 0.00
0.00 0.00 6.30 6.04 0.00
0.21 210.00
Expl. Seismic Apprsl. Tangible Intangible Subsea Pipelines Topsides Structures FLNG FSRU Fixed OPEXVariable
OPEXFLNG FSRU Oil MMbbl/ yr
Cond.
MMbbl/ yrGas Bscf/ yr
TOTAL 0.00 0.00 0.00 0.00 0.00 0.00 0.00 46.14 27.91 0.00 4 300.00 0.00 984.37 148.00 3 066.00 0.00 0.00 0.00 4.20 4 144.0121500
1 1.84 6.98 1 290.00
2 31.05 11.42 2 150.00
3 13.25 9.51 860.00 32.51 4.93 146.00 0.14 138.14
4 48.77 7.40 146.00 0.21 207.20
5 48.77 7.40 146.00 0.21 207.20
6 48.77 7.40 146.00 0.21 207.20
7 48.90 7.40 146.00 0.21 207.20
8 50.70 7.40 146.00 0.21 207.20
9 49.70 7.40 146.00 0.21 207.20
10 48.77 7.40 146.00 0.21 207.20
11 48.77 7.40 146.00 0.21 207.20
12 48.90 7.40 146.00 0.21 207.20
13 50.70 7.40 146.00 0.21 207.20
14 49.70 7.40 146.00 0.21 207.20
15 48.77 7.40 146.00 0.21 207.20
16 48.77 7.40 146.00 0.21 207.20
17 48.90 7.40 146.00 0.21 207.20
18 50.70 7.40 146.00 0.21 207.20
19 49.70 7.40 146.00 0.21 207.20
20 48.77 7.40 146.00 0.21 207.20
21 48.77 7.40 146.00 0.21 207.20
22 48.77 7.40 146.00 0.21 207.20
23 16.26 2.47 146.00 0.07 69.07
24
25
Capital cost Lifecycle cost
Currency (millions $) US Dollars Cost/ BOE Cost/ BOE
E & A cost Drilling cost Facilities cost Operating cost Decommission cost
BOE/ bbl Oil
BOE/ bbl Condensate
BOE/ Mscf Gas
Project name 2 - Offshore CY to EGY via FLNG
Cost/ BOE Cost/ BOE Cost/ BOE Cost/ BOE Cost/ BOE
Design production
PRODUCTION
YearPROJECT
COSTS
EXPLORATION & APPRAISAL PROD. DRILLING FACILITIES COSTS OPERATING COSTS
OFFSHORE INVEST MENT AND PRODUCT ION PROFILES 1.00
0.94 2 060.08 4 833.00
0.17 7.38 17.32
0.00 0.00 2 060.08 2 772.92 0.00
0.00 0.00 7.38 9.94 0.00
0.08 84.00
Expl. Seismic Apprsl. Tangible Intangible Subsea Pipelines Topsides Structures FLNG FSRU Fixed OPEXVariable
OPEXFLNG FSRU Oil MMbbl/ yr
Cond.
MMbbl/ yrGas Bscf/ yr
TOTAL 0.00 0.00 0.00 0.00 0.00 0.00 0.00 35.89 12.25 0.00 1 800.00 211.94 840.82 52.60 1 785.00 94.50 0.00 0.00 908.40 0.00 1.61 1 664.60
1 1.84 3.06 540.00 63.58
2 21.25 5.01 900.00 105.97
3 12.80 4.18 360.00 42.39 27.88 1.75 85.00 4.50 30.28 0.06 55.49
4 41.83 2.63 85.00 4.50 45.42 0.08 83.23
5 41.83 2.63 85.00 4.50 45.42 0.08 83.23
6 41.83 2.63 85.00 4.50 45.42 0.08 83.23
7 41.96 2.63 85.00 4.50 45.42 0.08 83.23
8 42.71 2.63 85.00 4.50 45.42 0.08 83.23
9 42.23 2.63 85.00 4.50 45.42 0.08 83.23
10 41.83 2.63 85.00 4.50 45.42 0.08 83.23
11 41.83 2.63 85.00 4.50 45.42 0.08 83.23
12 41.96 2.63 85.00 4.50 45.42 0.08 83.23
13 42.71 2.63 85.00 4.50 45.42 0.08 83.23
14 42.23 2.63 85.00 4.50 45.42 0.08 83.23
15 41.83 2.63 85.00 4.50 45.42 0.08 83.23
16 41.83 2.63 85.00 4.50 45.42 0.08 83.23
17 41.96 2.63 85.00 4.50 45.42 0.08 83.23
18 42.71 2.63 85.00 4.50 45.42 0.08 83.23
19 42.23 2.63 85.00 4.50 45.42 0.08 83.23
20 41.83 2.63 85.00 4.50 45.42 0.08 83.23
21 41.83 2.63 85.00 4.50 45.42 0.08 83.23
22 41.83 2.63 85.00 4.50 45.42 0.08 83.23
23 13.94 0.88 85.00 4.50 15.14 0.03 27.74
24
25
PRODUCTION
YearPROJECT
COSTS
EXPLORATION & APPRAISAL PROD. DRILLING FACILITIES COSTS OPERATING COSTS
Cost/ BOE Cost/ BOE Cost/ BOE Cost/ BOE Cost/ BOE
Design production
E & A cost Drilling cost Facilities cost Operating cost Decommission cost
BOE/ bbl Oil
BOE/ bbl Condensate
BOE/ Mscf Gas
Project name 8 - Offshore CY to GRE via FLNG_v2 Capital cost Lifecycle cost
Currency (millions $) US Dollars Cost/ BOE Cost/ BOE
OFFSHORE INVEST MENT AND PRODUCT ION PROFILES 1.00
0.94 768.29 2 649.54
0.17 16.02 55.26
0.00 0.00 768.29 1 881.25 0.00
0.00 0.00 16.02 39.23 0.00
0.02 14.60
Expl. Seismic Apprsl. Tangible Intangible Subsea Pipelines Topsides Structures FLNG FSRU Fixed OPEXVariable
OPEXFLNG FSRU Oil MMbbl/ yr
Cond.
MMbbl/ yrGas Bscf/ yr
TOTAL 0.00 0.00 0.00 0.00 0.00 0.00 0.00 29.12 9.17 0.00 730.00 0.00 985.65 13.60 882.00 0.00 0.00 0.00 0.00 0.00 0.40 285.40
1 1.63 0.18 219.00
2 19.14 0.28 365.00
3 8.35 8.71 146.00 32.82 0.45 42.00 0.01 9.51
4 49.23 0.68 42.00 0.02 14.27
5 49.23 0.68 42.00 0.02 14.27
6 49.37 0.68 42.00 0.02 14.27
7 49.30 0.68 42.00 0.02 14.27
8 49.28 0.68 42.00 0.02 14.27
9 49.26 0.68 42.00 0.02 14.27
10 49.37 0.68 42.00 0.02 14.27
11 49.30 0.68 42.00 0.02 14.27
12 49.23 0.68 42.00 0.02 14.27
13 49.28 0.68 42.00 0.02 14.27
14 49.39 0.68 42.00 0.02 14.27
15 49.30 0.68 42.00 0.02 14.27
16 49.23 0.68 42.00 0.02 14.27
17 49.23 0.68 42.00 0.02 14.27
18 49.41 0.68 42.00 0.02 14.27
19 49.32 0.68 42.00 0.02 14.27
20 49.23 0.68 42.00 0.02 14.27
21 49.23 0.68 42.00 0.02 14.27
22 49.23 0.68 42.00 0.02 14.27
23 16.41 0.23 42.00 0.01 4.76
24
25
Capital cost Lifecycle cost
Currency (millions $) US Dollars Cost/ BOE Cost/ BOE
E & A cost Drilling cost Facilities cost Operating cost Decommission cost
BOE/ bbl Oil
BOE/ bbl Condensate
BOE/ Mscf Gas
Project name 8 - Offshore NOR to UK via FLNG
Cost/ BOE Cost/ BOE Cost/ BOE Cost/ BOE Cost/ BOE
Design production
PRODUCTION
YearPROJECT
COSTS
EXPLORATION & APPRAISAL PROD. DRILLING FACILITIES COSTS OPERATING COSTS
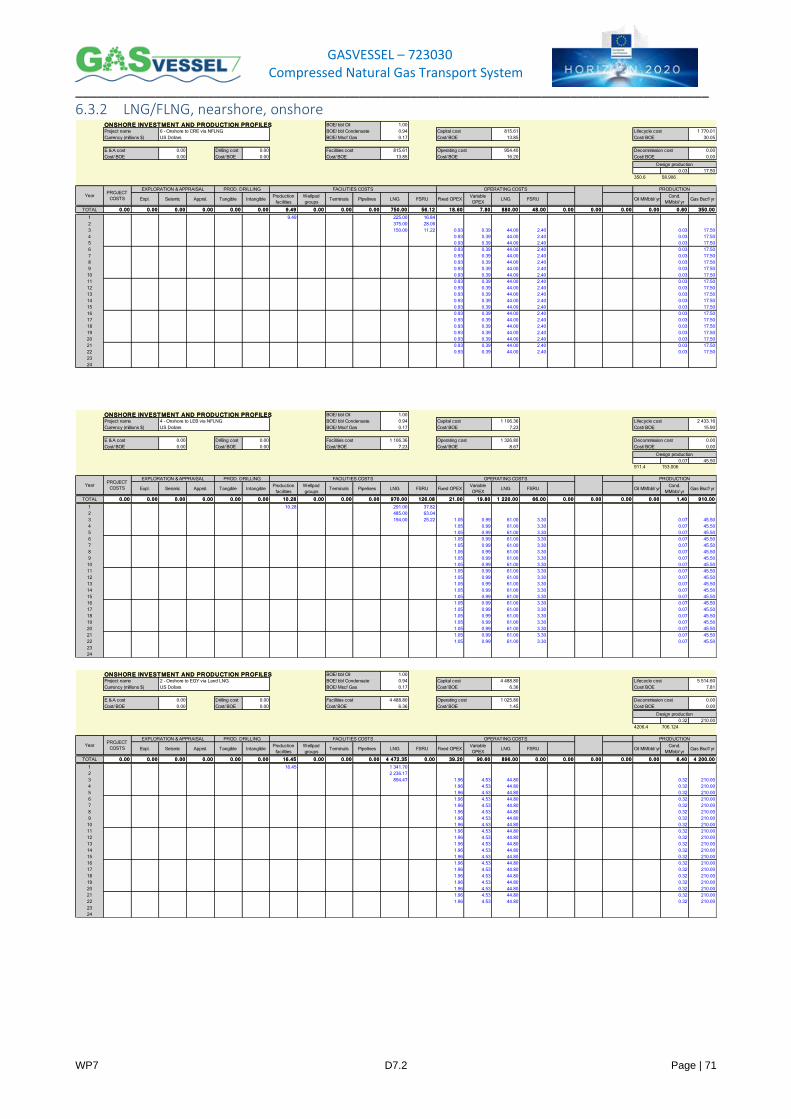
GASVESSEL – 723030 Compressed Natural Gas Transport System
_______________________________________________________________________________________
WP7 D7.2 Page | 71
6.3.2 LNG/FLNG, nearshore, onshore
ONSHORE INVEST MENT AND PRODUCT ION PROFILES 1.00
0.94 815.61 1 770.01
0.17 13.85 30.05
0.00 Drilling cost 0.00 815.61 954.40 0.00
0.00 Cost/ BOE 0.00 13.85 16.20 0.00
0.03 17.50
350.6 58.906
Expl. Seismic Apprsl. Tangible IntangibleProduction
facilities
Wellpad
groupsTerminals Pipelines LNG FSRU Fixed OPEX
Variable
OPEXLNG FSRU Oil MMbbl/ yr
Cond.
MMbbl/ yrGas Bscf/ yr
TOTAL 0.00 0.00 0.00 0.00 0.00 0.00 9.49 0.00 0.00 0.00 750.00 56.12 18.60 7.80 880.00 48.00 0.00 0.00 0.00 0.00 0.60 350.00
1 9.49 225.00 16.84
2 375.00 28.06
3 150.00 11.22 0.93 0.39 44.00 2.40 0.03 17.50
4 0.93 0.39 44.00 2.40 0.03 17.50
5 0.93 0.39 44.00 2.40 0.03 17.50
6 0.93 0.39 44.00 2.40 0.03 17.50
7 0.93 0.39 44.00 2.40 0.03 17.50
8 0.93 0.39 44.00 2.40 0.03 17.50
9 0.93 0.39 44.00 2.40 0.03 17.50
10 0.93 0.39 44.00 2.40 0.03 17.50
11 0.93 0.39 44.00 2.40 0.03 17.50
12 0.93 0.39 44.00 2.40 0.03 17.50
13 0.93 0.39 44.00 2.40 0.03 17.50
14 0.93 0.39 44.00 2.40 0.03 17.50
15 0.93 0.39 44.00 2.40 0.03 17.50
16 0.93 0.39 44.00 2.40 0.03 17.50
17 0.93 0.39 44.00 2.40 0.03 17.50
18 0.93 0.39 44.00 2.40 0.03 17.50
19 0.93 0.39 44.00 2.40 0.03 17.50
20 0.93 0.39 44.00 2.40 0.03 17.50
21 0.93 0.39 44.00 2.40 0.03 17.50
22 0.93 0.39 44.00 2.40 0.03 17.50
23
24
E & A cost Facilities cost
OPERATING COSTS PRODUCTION
Cost/ BOE Cost/ BOE Cost/ BOE Cost/ BOE
Design production
Project name 6 - Onshore to CRE via NFLNG Capital cost Lifecycle cost
Currency (millions $)
YearPROJECT
COSTS
EXPLORATION & APPRAISAL PROD. DRILLING FACILITIES COSTS
US Dollars Cost/ BOE Cost/ BOE
Operating cost Decommission cost
BOE/ bbl Oil
BOE/ bbl Condensate
BOE/ Mscf Gas
ONSHORE INVEST MENT AND PRODUCT ION PROFILES 1.00
0.94 1 106.36 2 433.16
0.17 7.23 15.90
0.00 Drilling cost 0.00 1 106.36 1 326.80 0.00
0.00 Cost/ BOE 0.00 7.23 8.67 0.00
0.07 45.50
911.4 153.006
Expl. Seismic Apprsl. Tangible IntangibleProduction
facilities
Wellpad
groupsTerminals Pipelines LNG FSRU Fixed OPEX
Variable
OPEXLNG FSRU Oil MMbbl/ yr
Cond.
MMbbl/ yrGas Bscf/ yr
TOTAL 0.00 0.00 0.00 0.00 0.00 0.00 10.28 0.00 0.00 0.00 970.00 126.08 21.00 19.80 1 220.00 66.00 0.00 0.00 0.00 0.00 1.40 910.00
1 10.28 291.00 37.82
2 485.00 63.04
3 194.00 25.22 1.05 0.99 61.00 3.30 0.07 45.50
4 1.05 0.99 61.00 3.30 0.07 45.50
5 1.05 0.99 61.00 3.30 0.07 45.50
6 1.05 0.99 61.00 3.30 0.07 45.50
7 1.05 0.99 61.00 3.30 0.07 45.50
8 1.05 0.99 61.00 3.30 0.07 45.50
9 1.05 0.99 61.00 3.30 0.07 45.50
10 1.05 0.99 61.00 3.30 0.07 45.50
11 1.05 0.99 61.00 3.30 0.07 45.50
12 1.05 0.99 61.00 3.30 0.07 45.50
13 1.05 0.99 61.00 3.30 0.07 45.50
14 1.05 0.99 61.00 3.30 0.07 45.50
15 1.05 0.99 61.00 3.30 0.07 45.50
16 1.05 0.99 61.00 3.30 0.07 45.50
17 1.05 0.99 61.00 3.30 0.07 45.50
18 1.05 0.99 61.00 3.30 0.07 45.50
19 1.05 0.99 61.00 3.30 0.07 45.50
20 1.05 0.99 61.00 3.30 0.07 45.50
21 1.05 0.99 61.00 3.30 0.07 45.50
22 1.05 0.99 61.00 3.30 0.07 45.50
23
24
E & A cost Facilities cost
OPERATING COSTS PRODUCTION
Cost/ BOE Cost/ BOE Cost/ BOE Cost/ BOE
Design production
Project name 4 - Onshore to LEB via NFLNG Capital cost Lifecycle cost
Currency (millions $)
YearPROJECT
COSTS
EXPLORATION & APPRAISAL PROD. DRILLING FACILITIES COSTS
US Dollars Cost/ BOE Cost/ BOE
Operating cost Decommission cost
BOE/ bbl Oil
BOE/ bbl Condensate
BOE/ Mscf Gas
ONSHORE INVEST MENT AND PRODUCT ION PROFILES 1.00
0.94 4 488.80 5 514.60
0.17 6.36 7.81
0.00 Drilling cost 0.00 4 488.80 1 025.80 0.00
0.00 Cost/ BOE 0.00 6.36 1.45 0.00
0.32 210.00
4206.4 706.124
Expl. Seismic Apprsl. Tangible IntangibleProduction
facilities
Wellpad
groupsTerminals Pipelines LNG FSRU Fixed OPEX
Variable
OPEXLNG FSRU Oil MMbbl/ yr
Cond.
MMbbl/ yrGas Bscf/ yr
TOTAL 0.00 0.00 0.00 0.00 0.00 0.00 16.45 0.00 0.00 0.00 4 472.35 0.00 39.20 90.60 896.00 0.00 0.00 0.00 0.00 0.00 6.40 4 200.00
1 16.45 1 341.70
2 2 236.17
3 894.47 1.96 4.53 44.80 0.32 210.00
4 1.96 4.53 44.80 0.32 210.00
5 1.96 4.53 44.80 0.32 210.00
6 1.96 4.53 44.80 0.32 210.00
7 1.96 4.53 44.80 0.32 210.00
8 1.96 4.53 44.80 0.32 210.00
9 1.96 4.53 44.80 0.32 210.00
10 1.96 4.53 44.80 0.32 210.00
11 1.96 4.53 44.80 0.32 210.00
12 1.96 4.53 44.80 0.32 210.00
13 1.96 4.53 44.80 0.32 210.00
14 1.96 4.53 44.80 0.32 210.00
15 1.96 4.53 44.80 0.32 210.00
16 1.96 4.53 44.80 0.32 210.00
17 1.96 4.53 44.80 0.32 210.00
18 1.96 4.53 44.80 0.32 210.00
19 1.96 4.53 44.80 0.32 210.00
20 1.96 4.53 44.80 0.32 210.00
21 1.96 4.53 44.80 0.32 210.00
22 1.96 4.53 44.80 0.32 210.00
23
24
E & A cost Facilities cost
OPERATING COSTS PRODUCTION
Cost/ BOE Cost/ BOE Cost/ BOE Cost/ BOE
Design production
Project name 2 - Onshore to EGY via Land LNG Capital cost Lifecycle cost
Currency (millions $)
YearPROJECT
COSTS
EXPLORATION & APPRAISAL PROD. DRILLING FACILITIES COSTS
US Dollars Cost/ BOE Cost/ BOE
Operating cost Decommission cost
BOE/ bbl Oil
BOE/ bbl Condensate
BOE/ Mscf Gas
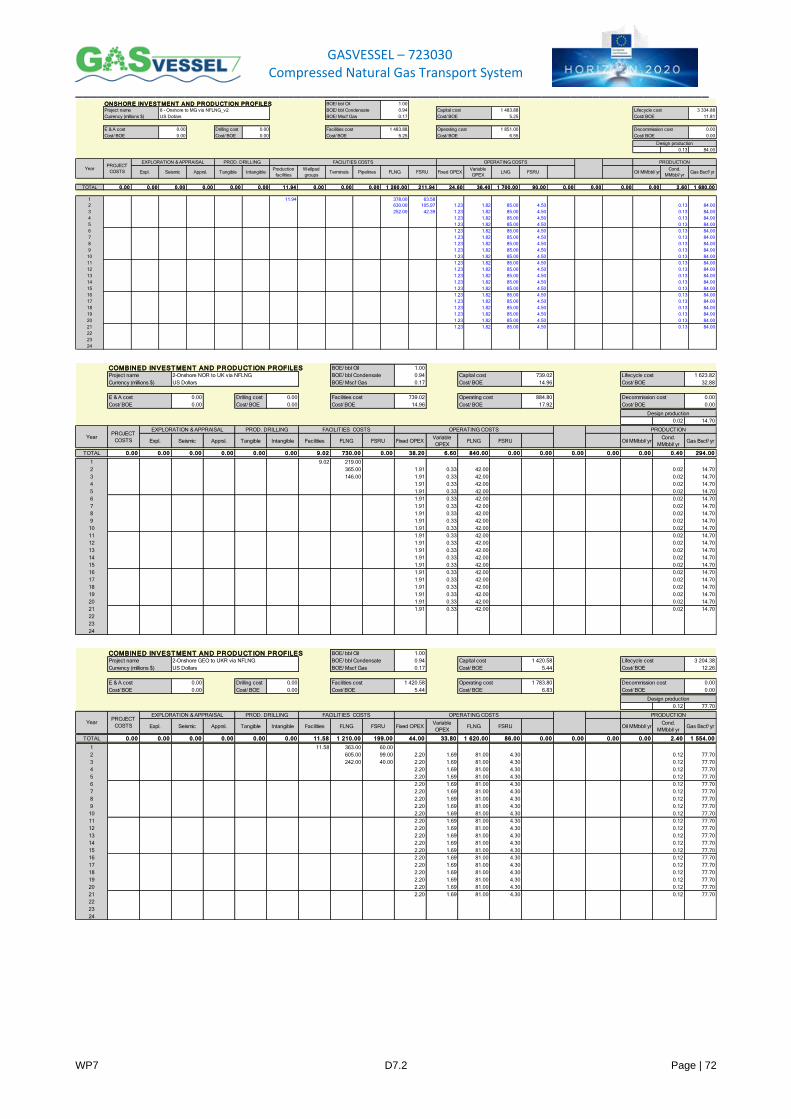
GASVESSEL – 723030 Compressed Natural Gas Transport System
_______________________________________________________________________________________
WP7 D7.2 Page | 72
ONSHORE INVEST MENT AND PRODUCT ION PROFILES 1.00
0.94 1 483.88 3 334.88
0.17 5.25 11.81
0.00 Drilling cost 0.00 1 483.88 1 851.00 0.00
0.00 Cost/ BOE 0.00 5.25 6.55 0.00
0.13 84.00
Expl. Seismic Apprsl. Tangible IntangibleProduction
facilities
Wellpad
groupsTerminals Pipelines FLNG FSRU Fixed OPEX
Variable
OPEXLNG FSRU Oil MMbbl/ yr
Cond.
MMbbl/ yrGas Bscf/ yr
TOTAL 0.00 0.00 0.00 0.00 0.00 0.00 11.94 0.00 0.00 0.00 1 260.00 211.94 24.60 36.40 1 700.00 90.00 0.00 0.00 0.00 0.00 2.60 1 680.00
1 11.94 378.00 63.58
2 630.00 105.97 1.23 1.82 85.00 4.50 0.13 84.00
3 252.00 42.39 1.23 1.82 85.00 4.50 0.13 84.00
4 1.23 1.82 85.00 4.50 0.13 84.00
5 1.23 1.82 85.00 4.50 0.13 84.00
6 1.23 1.82 85.00 4.50 0.13 84.00
7 1.23 1.82 85.00 4.50 0.13 84.00
8 1.23 1.82 85.00 4.50 0.13 84.00
9 1.23 1.82 85.00 4.50 0.13 84.00
10 1.23 1.82 85.00 4.50 0.13 84.00
11 1.23 1.82 85.00 4.50 0.13 84.00
12 1.23 1.82 85.00 4.50 0.13 84.00
13 1.23 1.82 85.00 4.50 0.13 84.00
14 1.23 1.82 85.00 4.50 0.13 84.00
15 1.23 1.82 85.00 4.50 0.13 84.00
16 1.23 1.82 85.00 4.50 0.13 84.00
17 1.23 1.82 85.00 4.50 0.13 84.00
18 1.23 1.82 85.00 4.50 0.13 84.00
19 1.23 1.82 85.00 4.50 0.13 84.00
20 1.23 1.82 85.00 4.50 0.13 84.00
21 1.23 1.82 85.00 4.50 0.13 84.00
22
23
24
E & A cost Facilities cost
OPERATING COSTS PRODUCTION
Cost/ BOE Cost/ BOE Cost/ BOE Cost/ BOE
Design production
Project name 8 - Onshore to MG via NFLNG_v2 Capital cost Lifecycle cost
Currency (millions $)
YearPROJECT
COSTS
EXPLORATION & APPRAISAL PROD. DRILLING FACILITIES COSTS
US Dollars Cost/ BOE Cost/ BOE
Operating cost Decommission cost
BOE/ bbl Oil
BOE/ bbl Condensate
BOE/ Mscf Gas
COMBINED INVEST MENT AND PRODUCT ION PROFILES 1.00
0.94 739.02 1 623.82
0.17 14.96 32.88
0.00 Drilling cost 0.00 739.02 884.80 0.00
0.00 Cost/ BOE 0.00 14.96 17.92 0.00
0.02 14.70
Expl. Seismic Apprsl. Tangible Intangible Facilities FLNG FSRU Fixed OPEXVariable
OPEXFLNG FSRU Oil MMbbl/ yr
Cond.
MMbbl/ yrGas Bscf/ yr
TOTAL 0.00 0.00 0.00 0.00 0.00 0.00 9.02 730.00 0.00 38.20 6.60 840.00 0.00 0.00 0.00 0.00 0.00 0.40 294.00
1 9.02 219.00
2 365.00 1.91 0.33 42.00 0.02 14.70
3 146.00 1.91 0.33 42.00 0.02 14.70
4 1.91 0.33 42.00 0.02 14.70
5 1.91 0.33 42.00 0.02 14.70
6 1.91 0.33 42.00 0.02 14.70
7 1.91 0.33 42.00 0.02 14.70
8 1.91 0.33 42.00 0.02 14.70
9 1.91 0.33 42.00 0.02 14.70
10 1.91 0.33 42.00 0.02 14.70
11 1.91 0.33 42.00 0.02 14.70
12 1.91 0.33 42.00 0.02 14.70
13 1.91 0.33 42.00 0.02 14.70
14 1.91 0.33 42.00 0.02 14.70
15 1.91 0.33 42.00 0.02 14.70
16 1.91 0.33 42.00 0.02 14.70
17 1.91 0.33 42.00 0.02 14.70
18 1.91 0.33 42.00 0.02 14.70
19 1.91 0.33 42.00 0.02 14.70
20 1.91 0.33 42.00 0.02 14.70
21 1.91 0.33 42.00 0.02 14.70
22
23
24
US Dollars Cost/ BOE Cost/ BOE
Operating cost Decommission cost
BOE/ bbl Oil
BOE/ bbl Condensate
BOE/ Mscf Gas
Project name 2-Onshore NOR to UK via NFLNG Capital cost Lifecycle cost
Currency (millions $)
YearPROJECT
COSTS
EXPLORATION & APPRAISAL PROD. DRILLING FACILITIES COSTS
E & A cost Facilities cost
OPERATING COSTS PRODUCTION
Cost/ BOE Cost/ BOE Cost/ BOE Cost/ BOE
Design production
COMBINED INVEST MENT AND PRODUCT ION PROFILES 1.00
0.94 1 420.58 3 204.38
0.17 5.44 12.26
0.00 Drilling cost 0.00 1 420.58 1 783.80 0.00
0.00 Cost/ BOE 0.00 5.44 6.83 0.00
0.12 77.70
Expl. Seismic Apprsl. Tangible Intangible Facilities FLNG FSRU Fixed OPEXVariable
OPEXFLNG FSRU Oil MMbbl/ yr
Cond.
MMbbl/ yrGas Bscf/ yr
TOTAL 0.00 0.00 0.00 0.00 0.00 0.00 11.58 1 210.00 199.00 44.00 33.80 1 620.00 86.00 0.00 0.00 0.00 0.00 2.40 1 554.00
1 11.58 363.00 60.00
2 605.00 99.00 2.20 1.69 81.00 4.30 0.12 77.70
3 242.00 40.00 2.20 1.69 81.00 4.30 0.12 77.70
4 2.20 1.69 81.00 4.30 0.12 77.70
5 2.20 1.69 81.00 4.30 0.12 77.70
6 2.20 1.69 81.00 4.30 0.12 77.70
7 2.20 1.69 81.00 4.30 0.12 77.70
8 2.20 1.69 81.00 4.30 0.12 77.70
9 2.20 1.69 81.00 4.30 0.12 77.70
10 2.20 1.69 81.00 4.30 0.12 77.70
11 2.20 1.69 81.00 4.30 0.12 77.70
12 2.20 1.69 81.00 4.30 0.12 77.70
13 2.20 1.69 81.00 4.30 0.12 77.70
14 2.20 1.69 81.00 4.30 0.12 77.70
15 2.20 1.69 81.00 4.30 0.12 77.70
16 2.20 1.69 81.00 4.30 0.12 77.70
17 2.20 1.69 81.00 4.30 0.12 77.70
18 2.20 1.69 81.00 4.30 0.12 77.70
19 2.20 1.69 81.00 4.30 0.12 77.70
20 2.20 1.69 81.00 4.30 0.12 77.70
21 2.20 1.69 81.00 4.30 0.12 77.70
22
23
24
US Dollars Cost/ BOE Cost/ BOE
Operating cost Decommission cost
BOE/ bbl Oil
BOE/ bbl Condensate
BOE/ Mscf Gas
Project name 2-Onshore GEO to UKR via NFLNG Capital cost Lifecycle cost
Currency (millions $)
YearPROJECT
COSTS
EXPLORATION & APPRAISAL PROD. DRILLING FACILITIES COSTS
E & A cost Facilities cost
OPERATING COSTS PRODUCTION
Cost/ BOE Cost/ BOE Cost/ BOE Cost/ BOE
Design production
Related Documents