GRANT AGREEMENT 671458 Swiss (SERI) Contract No 15.0252 STATUS: FINAL PUBLIC Ref. Ares(2018)1493045 - 19/03/2018

Welcome message from author
This document is posted to help you gain knowledge. Please leave a comment to let me know what you think about it! Share it to your friends and learn new things together.
Transcript
GRANT AGREEMENT 671458
Swiss (SERI) Contract No 15.0252
STATUS: FINAL
PUBLIC
Ref. Ares(2018)1493045 - 19/03/2018
D6.4 Assessment of market potential
ELYNTEGRATION. FCH-JU Grant Agreement 671458. SERI Contract number 15.0252 2
This project has received funding from the Fuel Cells and Hydrogen 2 Joint Undertaking
under grant agreement No 671458. This Joint Undertaking receives support from the European
Union’s Horizon 2020 research and innovation programme and Spain, Belgium, Germany,
Switzerland.
This work is supported by the Swiss State Secretariat for Education, Research and
Innovation (SERI) under contract number 15.0252.
The contents of this document are provided “AS IS”. It reflects only the authors’ view and
the JU is not responsible for any use that may be made of the information it contains.
Patrick Larscheid1, Lara Lück1, Rubén Canalejas 2, Vanesa Gil 2,3, Pablo Marcuello4, Nicola
Zandonà4, Guillermo Matute5
1 RWTH Aachen University, Institute of Power Systems and Power Economics, Germany
2 Fundación para el desarrollo de las nuevas tecnologías del Hidrógeno en Aragón, Spain
3 Fundación Agencia Aragonesa para la Investigación y Desarrollo (ARAID), Spain
4 Industrie Haute Technologie, Switzerland
5 Instrumentación y componentes, Spain
Author printed in bold is the contact person/corresponding author
March, 2018
D6.4 Assessment of market potential
ELYNTEGRATION. FCH-JU Grant Agreement 671458. SERI Contract number 15.0252 3
Content
1 Executive Summary..................................................................................................... 7
1.1 Target Sectors for Hydrogen Demand...................................................................... 7
1.2 Drivers and Risks .................................................................................................... 8
1.3 Sensitivity Analyses ................................................................................................ 8
1.4 Key findings ......................................................................................................... 10
2 Objectives ................................................................................................................ 11
2.1 Target Sectors for Hydrogen Demand.................................................................... 11
2.2 Potential Drivers and Risks.................................................................................... 12
2.3 Sensitivity Analysis ............................................................................................... 12
3 Description of work................................................................................................... 13
3.1 Target Sectors for Hydrogen Demand.................................................................... 13
3.1.1 Industry Sector ........................................................................................... 13
3.1.2 Mobility Sector ........................................................................................... 19
3.1.3 Natural Gas System..................................................................................... 21
3.1.4 Other Applications ...................................................................................... 22
3.2 Potential Drivers and Risks.................................................................................... 23
3.2.1 End User Price for Electricity ....................................................................... 24
3.2.2 Development of Power Generation System .................................................. 24
3.2.3 Price of Emission Certificates....................................................................... 25
3.2.4 Policies towards Energy Storage .................................................................. 26
3.2.5 Competition within Control Reserve Markets ............................................... 27
3.2.6 Design of Future Flexibility Markets for Grid Services.................................... 28
3.3 Sensitivity Analyses .............................................................................................. 30
3.3.1 Methodology.............................................................................................. 30
3.3.2 Base Scenario ............................................................................................. 30
3.3.3 End User Prices of Electricity ....................................................................... 32
3.3.4 Hydrogen Prices ......................................................................................... 34
3.3.5 Share of RES within Generation System ....................................................... 35
3.3.6 Transmission Grid Expansion ....................................................................... 37
4 Conclusions .............................................................................................................. 40

D6.4 Assessment of market potential
ELYNTEGRATION. FCH-JU Grant Agreement 671458. SERI Contract number 15.0252 4
5 Appendix .................................................................................................................. 47
5.1 Transmission Grid Simulation Results .................................................................... 47
D6.4 Assessment of market potential
ELYNTEGRATION. FCH-JU Grant Agreement 671458. SERI Contract number 15.0252 5
Figures
Figure 1: Potential key markets of future hydrogen demand ...................................................7
Figure 2: Electrolyser net margins for 2024 considering different hydrogen prices ...................9
Figure 3: Electrolyser net margins for 2024 for a scenario with 20 % more RES production and
with 20 % less RES production compared to the base case .................................................... 10
Figure 4: Potential key markets of future hydrogen demand [1] ............................................ 13
Figure 5: Global share of hydrogen consumption within industry sector [3] ........................... 14
Figure 6: Share of total ammonia production capacity within EU countries in 2012 (total capacity
20,613 k tonnes) [4]............................................................................................................ 15
Figure 7: Share of total crude refinery capacities within EU countries (total 777.8 Gt/year) [6]16
Figure 8: Share of total chlorine production capacities based on chlor-alkali methods within
Europe (total capacity 12,174 kt/year) [17] ......................................................................... 18
Figure 9: Expected hydrogen demand within mobility sector for France, UK and Germany based
on national mobility partnerships [29] [28] [27] ................................................................... 21
Figure 10: Net margins for 10 MW electrolyser for cross-commodity arbitrage trading........... 32
Figure 11: End-user costs for electricity in addition to wholesale market prices [1] [35] .......... 33
Figure 12: Full load hours considering exemptions from grid fees.......................................... 34
Figure 13: Net margins considering reduced hydrogen prices................................................ 35
Figure 14: Net margins considering increased hydrogen prices.............................................. 35
Figure 15: Potential electrolyser net margins in 2024 for a scenario with 20 % less RES production
compared to the base case ................................................................................................. 36
Figure 16: Potential electrolyser net margins in 2024 for a scenario with 20 % more RES
production compared to the base case ............................................................................... 37
Figure 17: HVDC links for reference scenario 4HVDC and sensitivity scenario 1HVDC for
transmission grid model 2024 ............................................................................................. 38
Figure 18: Allocation of yearly RES curtailment for reference scenario 4HVDC and sensitivity
scenario 1HVDC for 2024 .................................................................................................... 38
Figure 19: Full load hours for electrolyser providing grid services based on business model 8 for
the 10 locations with highest full load hours ........................................................................ 39
Figure 20: Line overloading for reference scenario 4HVDC and sensitivity scenario 1HVDC for
2024 .................................................................................................................................. 47
Figure 21: Allocation of yearly redispatch and curtailment for reference scenario 4HVDC and
sensitivity scenario 1HVDC for 2024 .................................................................................... 47
D6.4 Assessment of market potential
ELYNTEGRATION. FCH-JU Grant Agreement 671458. SERI Contract number 15.0252 6
Tables
Table 1: Estimation of FCEV in Europe and globally in 2030 ................................................... 20
Table 2: Expected hydrogen mobility demand in Europe and globally in 2030 ........................ 20
Table 3: Relevant markets for the different business models of deliverable 2.3 ...................... 23
Table 4: Main impact of potential risks and drivers on relevant markets for electrolyser business
models .............................................................................................................................. 24
Table 5: Potential future competitors on control reserve markets for electrolyser units ......... 27
Table 6: Key Assumptions for business model evaluation [1] ................................................. 30
Table 7: Assumed key performance indicators for the evaluation of business models of a 10 MW
alkaline water electrolyser project [1].................................................................................. 31
D6.4 Assessment of market potential
ELYNTEGRATION. FCH-JU Grant Agreement 671458. SERI Contract number 15.0252 7
1 EXECUTIVE SUMMARY
This study presents the results of task 6.1 of the ELYntegration project. The main objective
of this task is the assessment of the market potential for future electrolyser applications with a
close and dynamic interaction with the electric power grid and with the power markets taking
into account high shares of renewable energy sources. Within this assessment, relevant target
sectors for hydrogen demand are addressed and major risks and drivers for the market potential
of electrolyser business models are identified. Based on these identified risks and drivers, a
sensitivity analysis is conducted in order to quantify the impact of these influencing factors on
the profitability of electrolyser operation.
1.1 Target Sectors for Hydrogen Demand
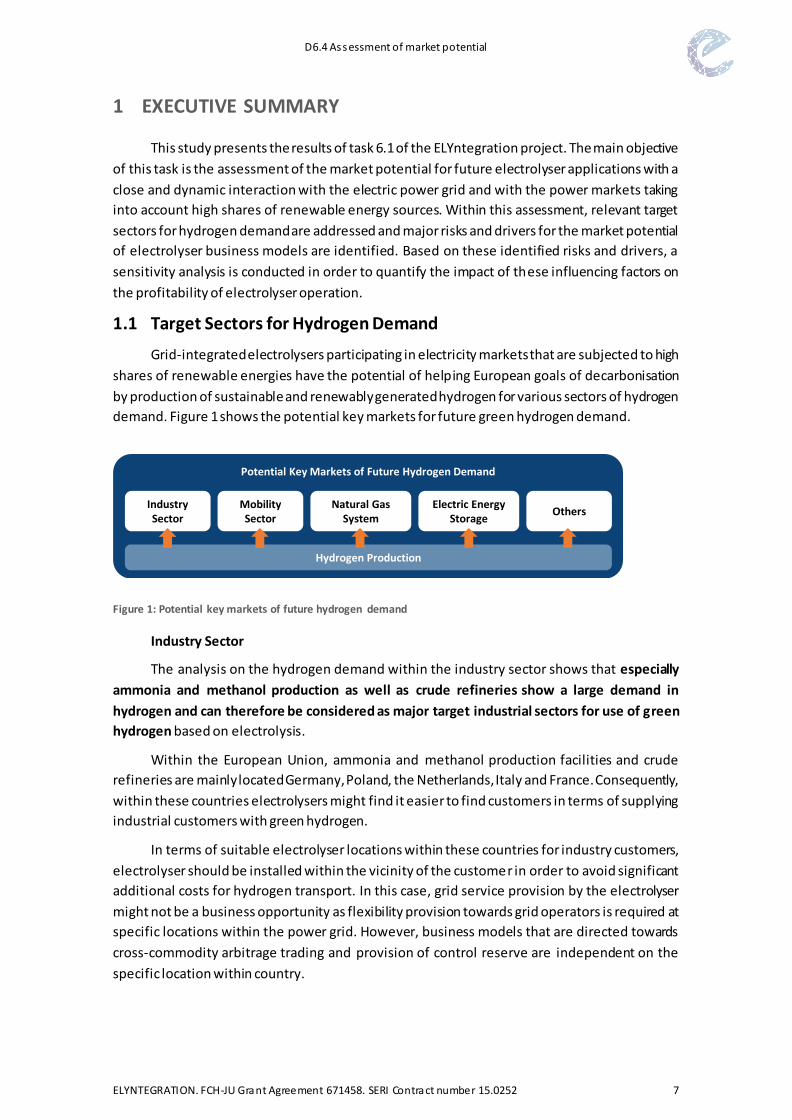
Grid-integrated electrolysers participating in electricity markets that are subjected to high
shares of renewable energies have the potential of helping European goals of decarbonisation
by production of sustainable and renewably generated hydrogen for various sectors of hydrogen
demand. Figure 1 shows the potential key markets for future green hydrogen demand.
Figure 1: Potential key markets of future hydrogen demand
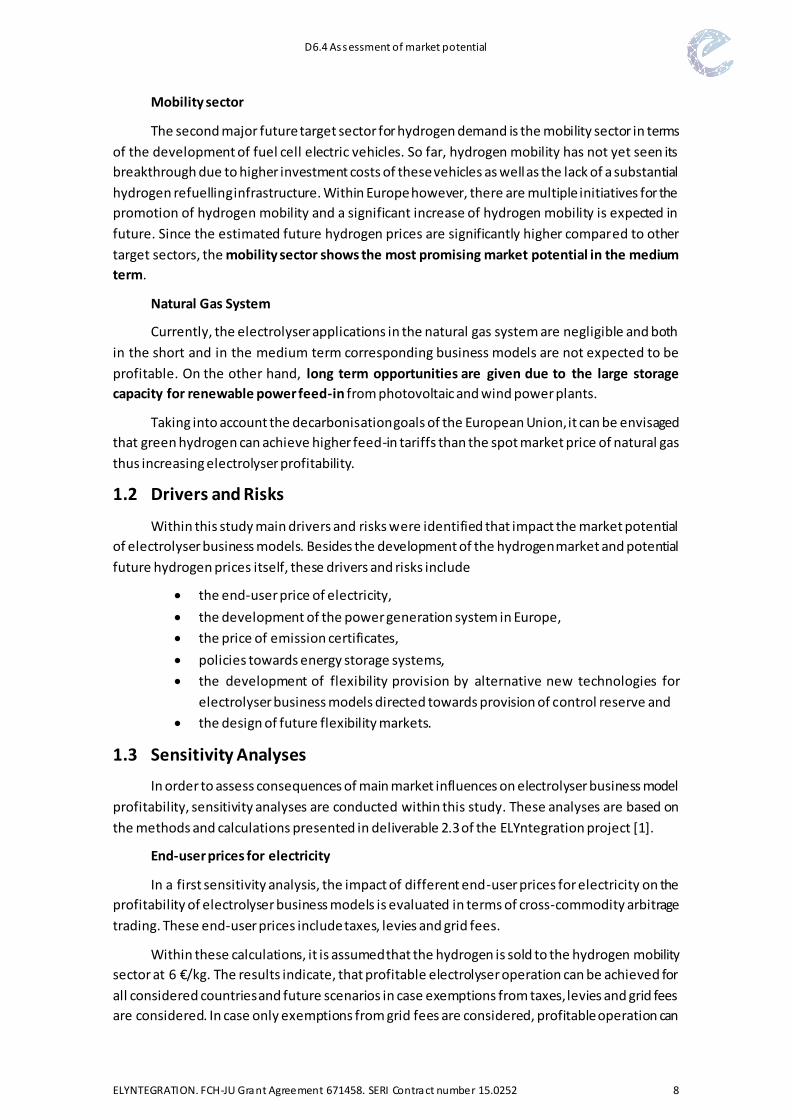
Industry Sector
The analysis on the hydrogen demand within the industry sector shows that especially
ammonia and methanol production as well as crude refineries show a large demand in
hydrogen and can therefore be considered as major target industrial sectors for use of green
hydrogen based on electrolysis.
Within the European Union, ammonia and methanol production facilities and crude
refineries are mainly located Germany, Poland, the Netherlands, Italy and France. Consequently,
within these countries electrolysers might find it easier to find customers in terms of supplying
industrial customers with green hydrogen.
In terms of suitable electrolyser locations within these countries for industry customers,
electrolyser should be installed within the vicinity of the customer in order to avoid significant
additional costs for hydrogen transport. In this case, grid service provision by the electrolyser
might not be a business opportunity as flexibility provision towards grid operators is required at
specific locations within the power grid. However, business models that are directed towards
cross-commodity arbitrage trading and provision of control reserve are independent on the
specific location within country.
Potential Key Markets of Future Hydrogen Demand
Mobility Sector
IndustrySector
OthersElectric Energy
Storage
Hydrogen Production
Natural Gas System
D6.4 Assessment of market potential
ELYNTEGRATION. FCH-JU Grant Agreement 671458. SERI Contract number 15.0252 8
Mobility sector
The second major future target sector for hydrogen demand is the mobility sector in terms
of the development of fuel cell electric vehicles. So far, hydrogen mobility has not yet seen its
breakthrough due to higher investment costs of these vehicles as well as the lack of a substantial
hydrogen refuelling infrastructure. Within Europe however, there are multiple initiatives for the
promotion of hydrogen mobility and a significant increase of hydrogen mobility is expected in
future. Since the estimated future hydrogen prices are significantly higher compared to other
target sectors, the mobility sector shows the most promising market potential in the medium
term.
Natural Gas System
Currently, the electrolyser applications in the natural gas system are negligible and both
in the short and in the medium term corresponding business models are not expected to be
profitable. On the other hand, long term opportunities are given due to the large storage
capacity for renewable power feed-in from photovoltaic and wind power plants.
Taking into account the decarbonisation goals of the European Union, it can be envisaged
that green hydrogen can achieve higher feed-in tariffs than the spot market price of natural gas
thus increasing electrolyser profitability.
1.2 Drivers and Risks
Within this study main drivers and risks were identified that impact the market potential
of electrolyser business models. Besides the development of the hydrogen market and potential
future hydrogen prices itself, these drivers and risks include
the end-user price of electricity,
the development of the power generation system in Europe,
the price of emission certificates,
policies towards energy storage systems,
the development of flexibility provision by alternative new technologies for
electrolyser business models directed towards provision of control reserve and
the design of future flexibility markets.
1.3 Sensitivity Analyses
In order to assess consequences of main market influences on electrolyser business model
profitability, sensitivity analyses are conducted within this study. These analyses are based on
the methods and calculations presented in deliverable 2.3 of the ELYntegration project [1].
End-user prices for electricity
In a first sensitivity analysis, the impact of different end-user prices for electricity on the
profitability of electrolyser business models is evaluated in terms of cross-commodity arbitrage
trading. These end-user prices include taxes, levies and grid fees.
Within these calculations, it is assumed that the hydrogen is sold to the hydrogen mobility
sector at 6 €/kg. The results indicate, that profitable electrolyser operation can be achieved for
all considered countries and future scenarios in case exemptions from taxes, levies and grid fees
are considered. In case only exemptions from grid fees are considered, profitable operation can
D6.4 Assessment of market potential
ELYNTEGRATION. FCH-JU Grant Agreement 671458. SERI Contract number 15.0252 9
only be achieved for future scenarios for Spain and the Netherlands while electrolyser operation
is unprofitable in Germany and Portugal. In case of exemption are considered only for taxes and
levies and in case no exemptions are considered, the electrolyser operation is unprofitable for
all considered countries and future scenarios.
Consequently, it can be concluded, that exemptions from additional end-user price
elements for electricity are crucial for a profitable electrolyser operation in cross-commodity
arbitrage trading.
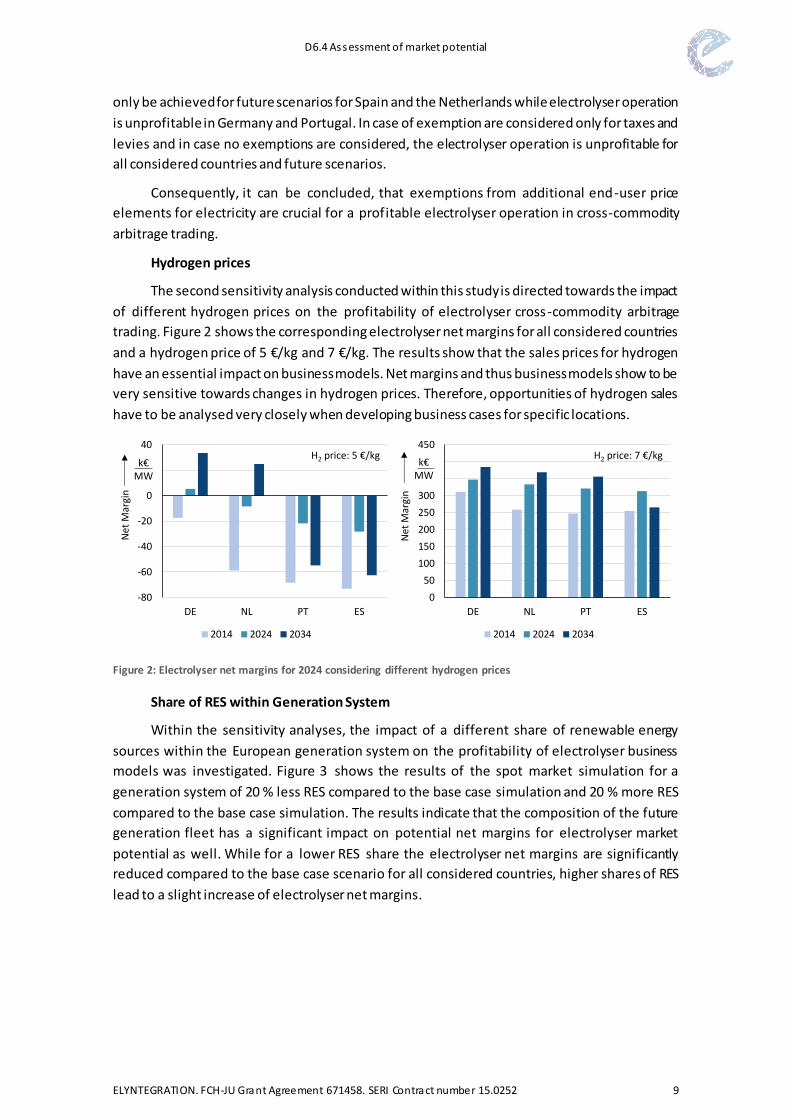
Hydrogen prices
The second sensitivity analysis conducted within this study is directed towards the impact
of different hydrogen prices on the profitability of electrolyser cross-commodity arbitrage
trading. Figure 2 shows the corresponding electrolyser net margins for all considered countries
and a hydrogen price of 5 €/kg and 7 €/kg. The results show that the sales prices for hydrogen
have an essential impact on business models. Net margins and thus business models show to be
very sensitive towards changes in hydrogen prices. Therefore, opportunities of hydrogen sales
have to be analysed very closely when developing business cases for specific locations.
Figure 2: Electrolyser net margins for 2024 considering different hydrogen prices
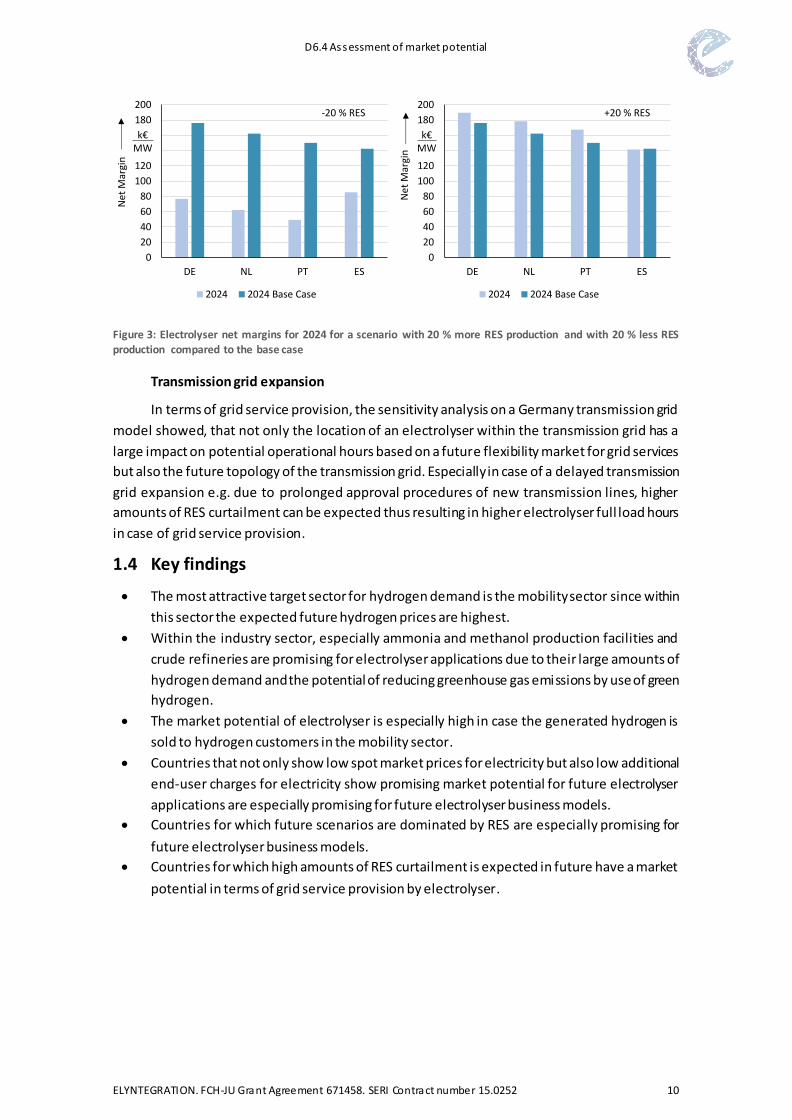
Share of RES within Generation System
Within the sensitivity analyses, the impact of a different share of renewable energy
sources within the European generation system on the profitability of electrolyser business
models was investigated. Figure 3 shows the results of the spot market simulation for a
generation system of 20 % less RES compared to the base case simulation and 20 % more RES
compared to the base case simulation. The results indicate that the composition of the future
generation fleet has a significant impact on potential net margins for electrolyser market
potential as well. While for a lower RES share the electrolyser net margins are significantly
reduced compared to the base case scenario for all considered countries, higher shares of RES
lead to a slight increase of electrolyser net margins.
-80
-60
-40
-20
0
20
40
DE NL PT ES
Net
Mar
gin
2014 2024 2034
k€MW
0
50
100
150
200
250
300
350
400
450
DE NL PT ES
Net
Mar
gin
2014 2024 2034
k€MW
H2 price: 5 €/kg H2 price: 7 €/kg
D6.4 Assessment of market potential
ELYNTEGRATION. FCH-JU Grant Agreement 671458. SERI Contract number 15.0252 10
Figure 3: Electrolyser net margins for 2024 for a scenario with 20 % more RES production and with 20 % less RES production compared to the base case
Transmission grid expansion
In terms of grid service provision, the sensitivity analysis on a Germany transmission grid
model showed, that not only the location of an electrolyser within the transmission grid has a
large impact on potential operational hours based on a future flexibility market for grid services
but also the future topology of the transmission grid. Especially in case of a delayed transmission
grid expansion e.g. due to prolonged approval procedures of new transmission lines, higher
amounts of RES curtailment can be expected thus resulting in higher electrolyser full load hours
in case of grid service provision.
1.4 Key findings
The most attractive target sector for hydrogen demand is the mobility sector since within
this sector the expected future hydrogen prices are highest.
Within the industry sector, especially ammonia and methanol production facilities and
crude refineries are promising for electrolyser applications due to their large amounts of
hydrogen demand and the potential of reducing greenhouse gas emissions by use of green
hydrogen.
The market potential of electrolyser is especially high in case the generated hydrogen is
sold to hydrogen customers in the mobility sector.
Countries that not only show low spot market prices for electricity but also low additional
end-user charges for electricity show promising market potential for future electrolyser
applications are especially promising for future electrolyser business models.
Countries for which future scenarios are dominated by RES are especially promising for
future electrolyser business models.
Countries for which high amounts of RES curtailment is expected in future have a market
potential in terms of grid service provision by electrolyser.
0
20
40
60
80
100
120
140
160
180
200
DE NL PT ES
Net
Mar
gin
2024 2024 Base Case
k€MW
0
20
40
60
80
100
120
140
160
180
200
DE NL PT ES
Net
Mar
gin
2024 2024 Base Case
k€MW
-20 % RES +20 % RES
D6.4 Assessment of market potential
ELYNTEGRATION. FCH-JU Grant Agreement 671458. SERI Contract number 15.0252 11
2 OBJECTIVES
The research and innovation project „Grid Integrated Multi Megawatt High Pressure
Alkaline Electrolysers for Energy Applications“ (ELYntegration) is focused on the design and
engineering of a robust, flexible, efficient and cost-competitive single stack multi megawatt high
pressure alkaline water electrolyser (hereafter referred to as electrolyser). Besides the design
and demonstration of an industrial prototype of a 250 kW electrolyser taking into account all
technical improvements for stack, membrane, electrode and balance of plant design gained
throughout this project, one main goal of ELYntegration is the investigation and assessment of
future grid integration and future energy applications for electrolysers.
This deliverable presents the results of task 6.1 of the ELYntegration project. The main
objective of this task is the assessment of the market potential for future electrolyser
applications with a close and dynamic interaction with the electric power grid and with the
power markets.
The market potential of these electrolyser applications is highly dependent on the specific
business model and the corresponding key markets. On the product side of the electrolyser,
these key markets include the hydrogen and natural gas market. On the electricity side of the
electrolyser, the relevant markets are the spot market for electric energy, the control reserve
markets of the power system and potential future flexibility markets for grid services. Specific
business models directed towards these different markets and corresponding operational
strategies for electrolyser unit commitment are presented in detail in deliverable 2.3 of the
ELYntegration project [1]. While deliverable 2.3 focuses on the analysis, development and
evaluation of these specific business models, this deliverable targets a more general assessment
of market potential identifying target sectors, business climate as well as potential risks and
drivers that impact a wider implementation of electrolyser applications for these business
models. Consequently, throughout this report, results of deliverable 2.3 are taken into account
and referenced.
2.1 Target Sectors for Hydrogen Demand
The objective of the first part of this study is directed towards identifying the market
potential in terms of expected hydrogen demand. An analysis of different target sector for
hydrogen demand is presented. Special focus is given to
chemical industry,
crude refinery industry,
mobility sector,
natural gas sector and
other potential target sectors.
Based on this analysis of the presence and future development of end-users of hydrogen,
the business climate for electrolyser applications is evaluated. The final goal of this part is to
identify attractive hydrogen demand sectors as well as countries within Europe with a high net
demand for hydrogen taking into account other hydrogen production pathways within these
countries. In terms of the hydrogen side of the electrolyser business models, these countries
would be suited for electrolyser applications.
D6.4 Assessment of market potential
ELYNTEGRATION. FCH-JU Grant Agreement 671458. SERI Contract number 15.0252 12
2.2 Potential Drivers and Risks
The second part of the deliverable is directed towards potential drive rs and risks. The
objective of this part of the study focuses on the identification of major influencing factors that
are expected to have a significant impact on the future market potential for grid integrated
water electrolyser. This includes uncertainties and risks perceived by potential investors in
electrolyser technology with regards towards short and medium and long term opportunities
within the relevant markets. Potential drivers that might improve business climate for
electrolyser applications are addressed. These factors include
future scenarios on the development of the European power generation system with
impact on spot market and control reserve markets,
the price of CO2 emission certificates influencing both prices for hydrogen and
electricity,
policies towards energy storage systems as potential drivers for electrolyser units,
end-user prices for electricity and potential future exemptions from taxes or other
surcharges to be faced by electrolyser units,
potential future competitors within control reserve markets that might lower
revenues from control reserve markets in corresponding business models and
uncertainties related to the design of future flexibility markets for electrolyser
applications within grid services.
This discussion is closely related to the assessment of potential business models in
deliverable 2.3 of the ELYntegration project [1] as it determines factors that influence the
revenues to be expected by each business model. Based on this assessment, influencing factors
are selected in order to run a sensitivity analysis on the simulations presented in deliverable 2.3.
2.3 Sensitivity Analysis
Based on the identified major risks and drivers for electrolyser application, a sensitivity
analysis is conduced. The objective of this task is the quantification of the influence of these
factors on the contribution margin to be expected by the business models. This is done by
simulations based on scenarios presented in deliverable 2.3 with changes in the simulation
environment according to the identified influencing factors. This sensitivity analysis includes the
assessment of
the impact of end-user prices for electricity,
the influence of different hydrogen prices seen by the electrolyser,
the effect of a different composition of the future European generation system in
terms of different RES shares and
the impact of a delayed transmission grid expansion process on the operational hours
of an electrolyser providing grid services.
D6.4 Assessment of market potential
ELYNTEGRATION. FCH-JU Grant Agreement 671458. SERI Contract number 15.0252 13
3 DESCRIPTION OF WORK
3.1 Target Sectors for Hydrogen Demand
Grid-integrated electrolysers participating in electricity markets that are subjected to high
shares of renewable energies have the potential of helping European goals of decarbonisation
by production of sustainable and renewably generated hydrogen. This “green” hydrogen can be
used in various end-user applications.
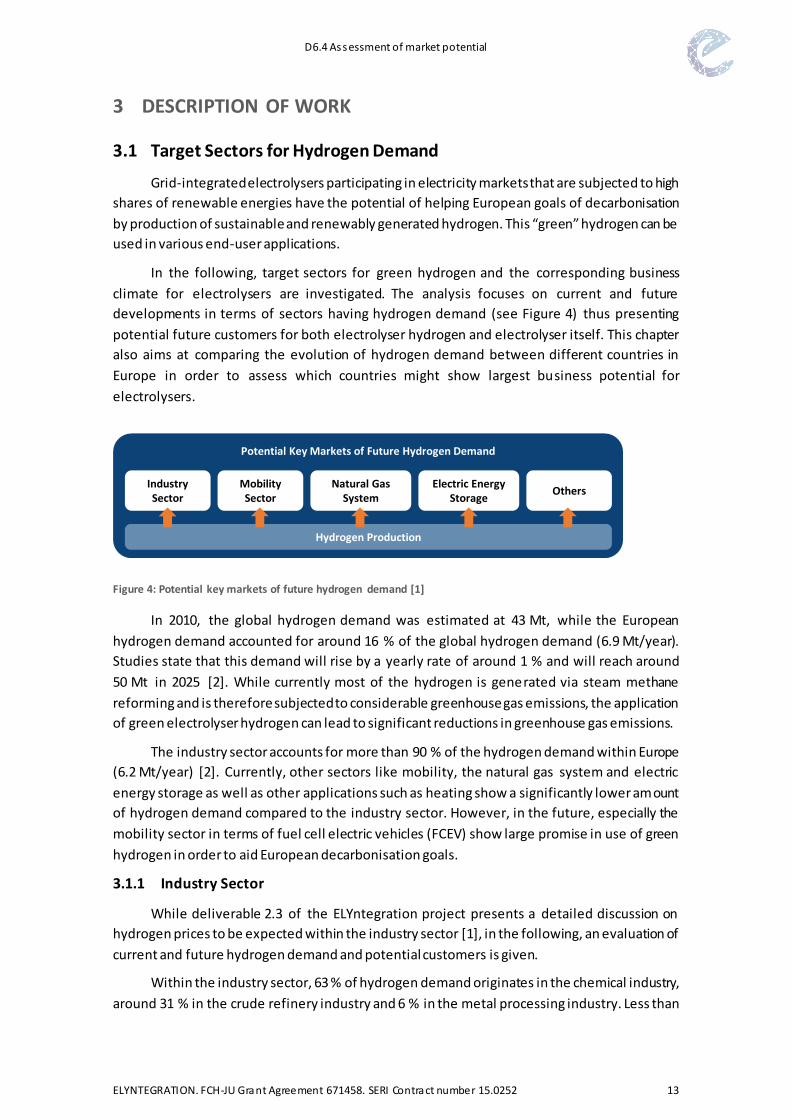
In the following, target sectors for green hydrogen and the corresponding business
climate for electrolysers are investigated. The analysis focuses on current and future
developments in terms of sectors having hydrogen demand (see Figure 4) thus presenting
potential future customers for both electrolyser hydrogen and electrolyser itself. This chapter
also aims at comparing the evolution of hydrogen demand between different countries in
Europe in order to assess which countries might show largest business potential for
electrolysers.
Figure 4: Potential key markets of future hydrogen demand [1]
In 2010, the global hydrogen demand was estimated at 43 Mt, while the European
hydrogen demand accounted for around 16 % of the global hydrogen demand (6.9 Mt/year).
Studies state that this demand will rise by a yearly rate of around 1 % and will reach around
50 Mt in 2025 [2]. While currently most of the hydrogen is generated via steam methane
reforming and is therefore subjected to considerable greenhouse gas emissions, the application
of green electrolyser hydrogen can lead to significant reductions in greenhouse gas emissions.
The industry sector accounts for more than 90 % of the hydrogen demand within Europe
(6.2 Mt/year) [2]. Currently, other sectors like mobility, the natural gas system and electric
energy storage as well as other applications such as heating show a significantly lower amount
of hydrogen demand compared to the industry sector. However, in the future, especially the
mobility sector in terms of fuel cell electric vehicles (FCEV) show large promise in use of green
hydrogen in order to aid European decarbonisation goals.
3.1.1 Industry Sector
While deliverable 2.3 of the ELYntegration project presents a detailed discussion on
hydrogen prices to be expected within the industry sector [1], in the following, an evaluation of
current and future hydrogen demand and potential customers is given.
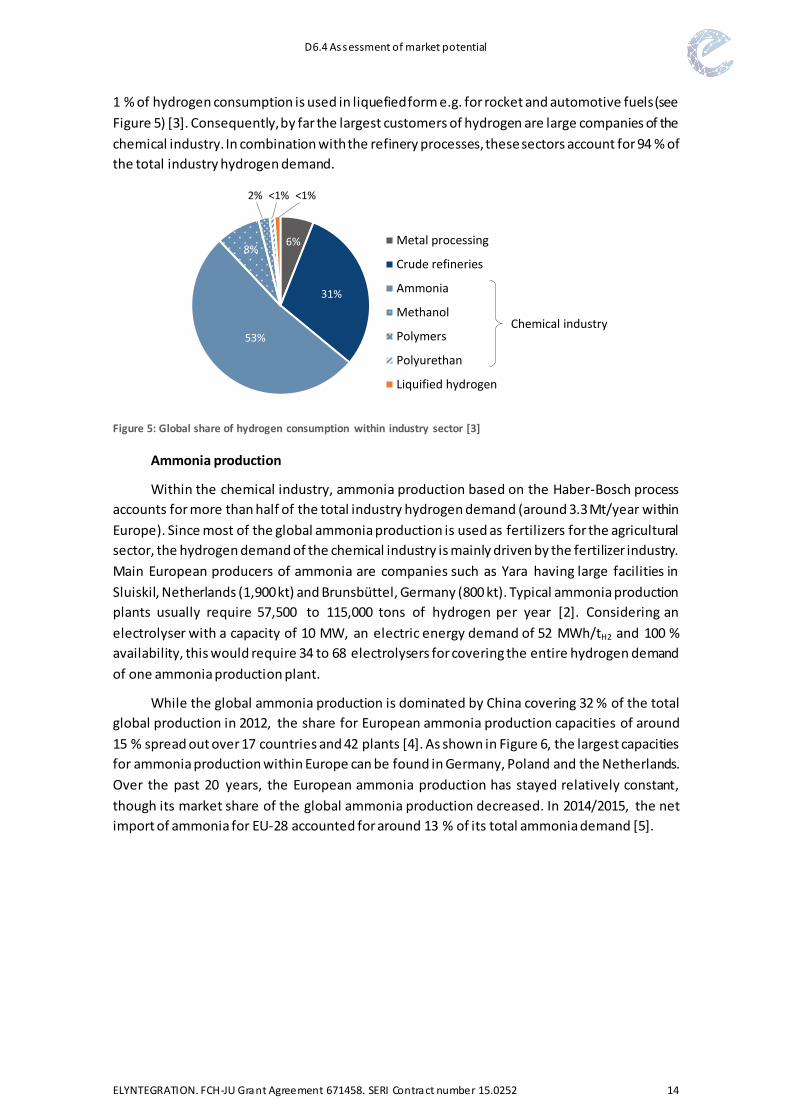
Within the industry sector, 63 % of hydrogen demand originates in the chemical industry,
around 31 % in the crude refinery industry and 6 % in the metal processing industry. Less than
Potential Key Markets of Future Hydrogen Demand
Mobility Sector
IndustrySector
OthersElectric Energy
Storage
Hydrogen Production
Natural Gas System
D6.4 Assessment of market potential
ELYNTEGRATION. FCH-JU Grant Agreement 671458. SERI Contract number 15.0252 14
1 % of hydrogen consumption is used in liquefied form e.g. for rocket and automotive fuels (see
Figure 5) [3]. Consequently, by far the largest customers of hydrogen are large companies of the
chemical industry. In combination with the refinery processes, these sectors account for 94 % of
the total industry hydrogen demand.
Figure 5: Global share of hydrogen consumption within industry sector [3]
Ammonia production
Within the chemical industry, ammonia production based on the Haber-Bosch process
accounts for more than half of the total industry hydrogen demand (around 3.3 Mt/year within
Europe). Since most of the global ammonia production is used as fertilizers for the agricultural
sector, the hydrogen demand of the chemical industry is mainly driven by the fertilizer industry.
Main European producers of ammonia are companies such as Yara having large facilities in
Sluiskil, Netherlands (1,900 kt) and Brunsbüttel, Germany (800 kt). Typical ammonia production
plants usually require 57,500 to 115,000 tons of hydrogen per year [2]. Considering an
electrolyser with a capacity of 10 MW, an electric energy demand of 52 MWh/tH2 and 100 %
availability, this would require 34 to 68 electrolysers for covering the entire hydrogen demand
of one ammonia production plant.
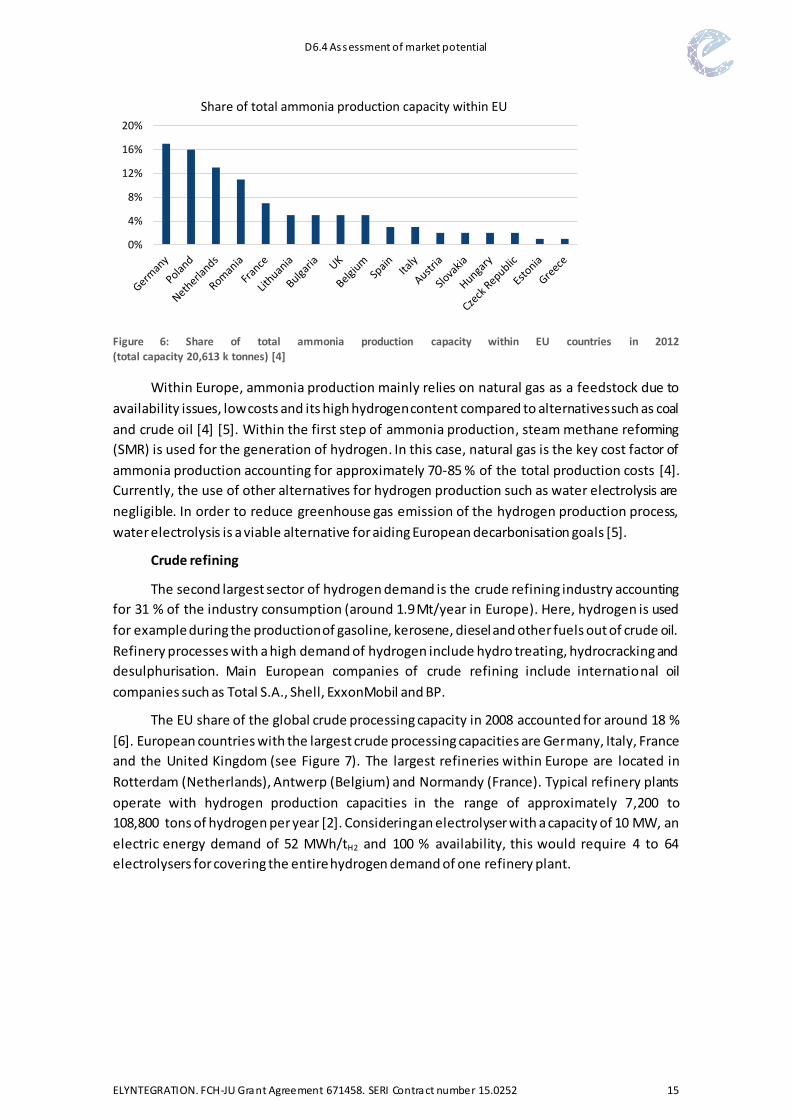
While the global ammonia production is dominated by China covering 32 % of the total
global production in 2012, the share for European ammonia production capacities of around
15 % spread out over 17 countries and 42 plants [4]. As shown in Figure 6, the largest capacities
for ammonia production within Europe can be found in Germany, Poland and the Netherlands.
Over the past 20 years, the European ammonia production has stayed relatively constant,
though its market share of the global ammonia production decreased. In 2014/2015, the net
import of ammonia for EU-28 accounted for around 13 % of its total ammonia demand [5].
Metal processing
Crude refineries
Ammonia
Methanol
Polymers
Polyurethan
Liquified hydrogen
6%
31%
<1%<1%2%
8%
53%Chemical industry
D6.4 Assessment of market potential
ELYNTEGRATION. FCH-JU Grant Agreement 671458. SERI Contract number 15.0252 15
Figure 6: Share of total ammonia production capacity within EU countries in 2012
(total capacity 20,613 k tonnes) [4]
Within Europe, ammonia production mainly relies on natural gas as a feedstock due to
availability issues, low costs and its high hydrogen content compared to alternatives such as coal
and crude oil [4] [5]. Within the first step of ammonia production, steam methane reforming
(SMR) is used for the generation of hydrogen. In this case, natural gas is the key cost factor of
ammonia production accounting for approximately 70-85 % of the total production costs [4].
Currently, the use of other alternatives for hydrogen production such as water electrolysis are
negligible. In order to reduce greenhouse gas emission of the hydrogen production process,
water electrolysis is a viable alternative for aiding European decarbonisation goals [5].
Crude refining
The second largest sector of hydrogen demand is the crude refining industry accounting
for 31 % of the industry consumption (around 1.9 Mt/year in Europe). Here, hydrogen is used
for example during the production of gasoline, kerosene, diesel and other fuels out of crude oil.
Refinery processes with a high demand of hydrogen include hydro treating, hydrocracking and
desulphurisation. Main European companies of crude refining include international oil
companies such as Total S.A., Shell, ExxonMobil and BP.
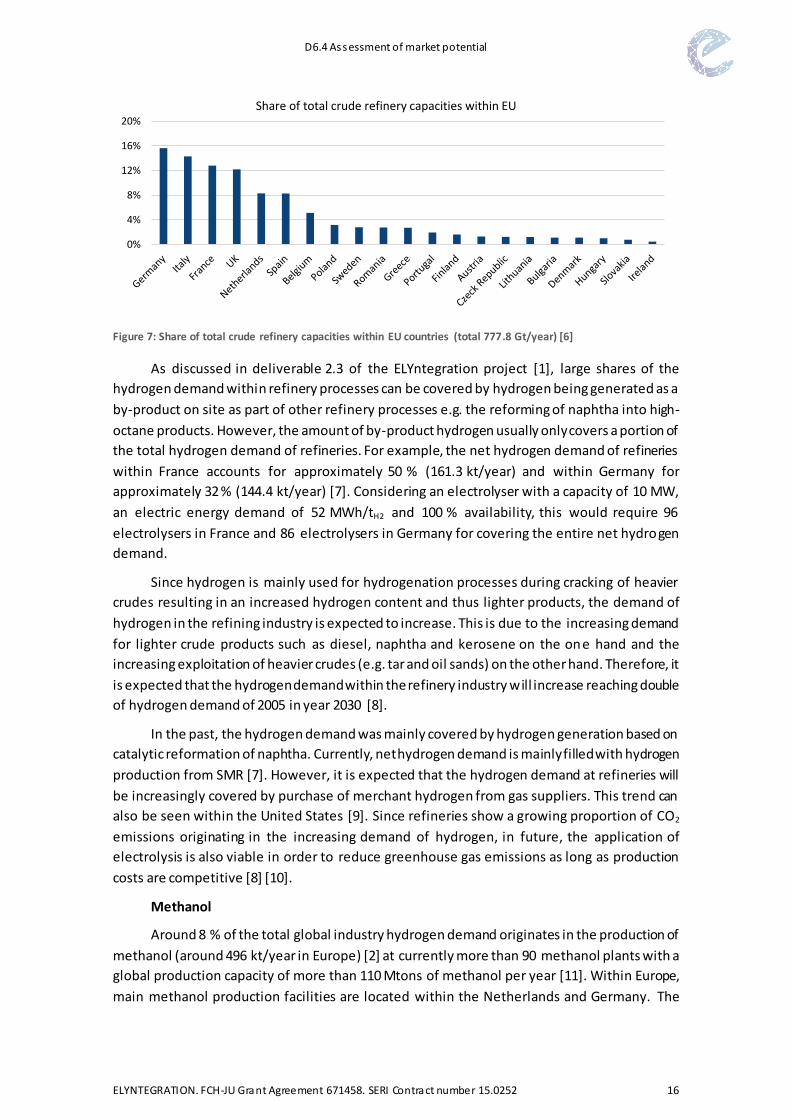
The EU share of the global crude processing capacity in 2008 accounted for around 18 %
[6]. European countries with the largest crude processing capacities are Germany, Italy, France
and the United Kingdom (see Figure 7). The largest refineries within Europe are located in
Rotterdam (Netherlands), Antwerp (Belgium) and Normandy (France). Typical refinery plants
operate with hydrogen production capacities in the range of approximately 7,200 to
108,800 tons of hydrogen per year [2]. Considering an electrolyser with a capacity of 10 MW, an
electric energy demand of 52 MWh/tH2 and 100 % availability, this would require 4 to 64
electrolysers for covering the entire hydrogen demand of one refinery plant.
0%
4%
8%
12%
16%
20%
Share of total ammonia production capacity within EU
D6.4 Assessment of market potential
ELYNTEGRATION. FCH-JU Grant Agreement 671458. SERI Contract number 15.0252 16
Figure 7: Share of total crude refinery capacities within EU countries (total 777.8 Gt/year) [6]
As discussed in deliverable 2.3 of the ELYntegration project [1], large shares of the
hydrogen demand within refinery processes can be covered by hydrogen being generated as a
by-product on site as part of other refinery processes e.g. the reforming of naphtha into high-
octane products. However, the amount of by-product hydrogen usually only covers a portion of
the total hydrogen demand of refineries. For example, the net hydrogen demand of refineries
within France accounts for approximately 50 % (161.3 kt/year) and within Germany for
approximately 32 % (144.4 kt/year) [7]. Considering an electrolyser with a capacity of 10 MW,
an electric energy demand of 52 MWh/tH2 and 100 % availability, this would require 96
electrolysers in France and 86 electrolysers in Germany for covering the entire net hydrogen
demand.
Since hydrogen is mainly used for hydrogenation processes during cracking of heavier
crudes resulting in an increased hydrogen content and thus lighter products, the demand of
hydrogen in the refining industry is expected to increase. This is due to the increasing demand
for lighter crude products such as diesel, naphtha and kerosene on the one hand and the
increasing exploitation of heavier crudes (e.g. tar and oil sands) on the other hand. Therefore, it
is expected that the hydrogen demand within the refinery industry will increase reaching double
of hydrogen demand of 2005 in year 2030 [8].
In the past, the hydrogen demand was mainly covered by hydrogen generation based on
catalytic reformation of naphtha. Currently, net hydrogen demand is mainly filled with hydrogen
production from SMR [7]. However, it is expected that the hydrogen demand at refineries will
be increasingly covered by purchase of merchant hydrogen from gas suppliers. This trend can
also be seen within the United States [9]. Since refineries show a growing proportion of CO2
emissions originating in the increasing demand of hydrogen, in future, the application of
electrolysis is also viable in order to reduce greenhouse gas emissions as long as production
costs are competitive [8] [10].
Methanol
Around 8 % of the total global industry hydrogen demand originates in the production of
methanol (around 496 kt/year in Europe) [2] at currently more than 90 methanol plants with a
global production capacity of more than 110 Mtons of methanol per year [11]. Within Europe,
main methanol production facilities are located within the Netherlands and Germany. The
Share of total crude refinery capacities within EU
0%
4%
8%
12%
16%
20%
D6.4 Assessment of market potential
ELYNTEGRATION. FCH-JU Grant Agreement 671458. SERI Contract number 15.0252 17
characteristic amount of hydrogen demand of a methanol plant is around 15,000 to 80,000 tons
of hydrogen per year. Considering an electrolyser with a capacity of 10 MW, an electric energy
demand of 52 MWh/tH2 and 100 % availability, this would require 9 to 50 electrolysers for
covering the entire hydrogen demand of one methanol production plant.
The conventional feedstock in methanol processing is natural gas that is used in order to
produce a mixture of CO, CO2 and hydrogen (synthesis gas) via steam methane reforming. This
synthetic gas is then used for methanol production. Consequently, green methanol pathways
using green hydrogen based on water electrolysis can significantly reduce greenhouse gas
emissions. Currently, projects at demonstration level and pilot plants exist that are directed
towards the production of green methanol or the synthesis of chemicals (power-to-liquids) from
CO2 capture and electrolytic hydrogen [12] [13] [14] [15].
Metal processing
The hydrogen demand for metal processing within steel industry accounts for a share of
6 % of the total global industry hydrogen demand (around 372 kt/year in Europe). Currently,
main hydrogen demand arises in processes for the reduction of iron ore as well as in uses of
forming and blanketing gas [3]. The typical hydrogen consumption of a metal processing plant
is around 36 to 720 tons per year [2]. Considering an electrolyser with a capacity of 10 MW, an
electric energy demand of 52 MWh/tH2 and 100 % availability, the hydrogen production of one
single electrolyser would cover the demand of 2.5 to 50 metal processing plants. As explained
within deliverable 2.3 of the ELYntegration project [1], by-product hydrogen within steel
industry is currently mainly used for contributing to the heat demand on site resulting in an
increased overall energy efficiency of the operation. Generally, the generated hydrogen could
also be used for other purposes. However, due to low hydrogen purities of by-product hydrogen,
many industry purposes would require extensive purification [8].
Other industry sectors
The hydrogen demand of other industry sectors including chemical industries such as the
production of polymers (nylon) and polyurethanes (resins) as well as other applications as rocket
or automotive fuel and within the semiconductor industry accounts for only a fraction of the
total industry demand of hydrogen. Typical plant capacities for these sectors can be found within
[2]. Smaller amounts of hydrogen demand can also be found in the food industry where the
hydrogenation process is used for oil and fat. Within this process, unsaturated fat is saturated,
which requires hydrogen. This process is typically used for the development of margarine and
similar hardened fats for human consumption. Currently, this industry represents only a small
fraction of the total hydrogen consumption [2] and is not expected to increase in size within
near future because the process also develops trans fats, whose effects on health have been
discovered to be harmful. Concluding, the hydrogen business market for electrolysers is much
smaller within these industry sectors. However, viable electrolyser applications may especially
arise within sectors that depend on a high purity level of hydrogen such as the semiconductor
industry.
By-product hydrogen from chlorine production
When identifying countries with large hydrogen net demand, it also needs to be
considered, that several industry processes generate hydrogen as a by-product. It needs to be
D6.4 Assessment of market potential
ELYNTEGRATION. FCH-JU Grant Agreement 671458. SERI Contract number 15.0252 18
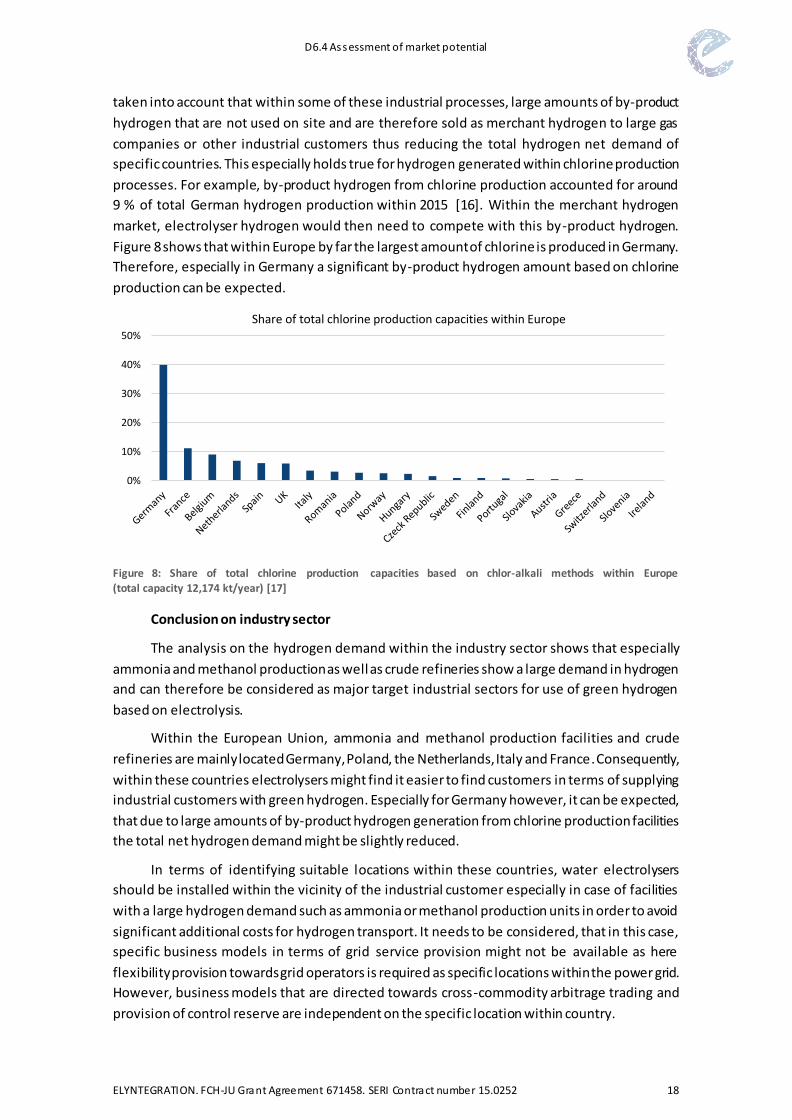
taken into account that within some of these industrial processes, large amounts of by-product
hydrogen that are not used on site and are therefore sold as merchant hydrogen to large gas
companies or other industrial customers thus reducing the total hydrogen net demand of
specific countries. This especially holds true for hydrogen generated within chlorine production
processes. For example, by-product hydrogen from chlorine production accounted for around
9 % of total German hydrogen production within 2015 [16]. Within the merchant hydrogen
market, electrolyser hydrogen would then need to compete with this by-product hydrogen.
Figure 8 shows that within Europe by far the largest amount of chlorine is produced in Germany.
Therefore, especially in Germany a significant by-product hydrogen amount based on chlorine
production can be expected.
Figure 8: Share of total chlorine production capacities based on chlor-alkali methods within Europe
(total capacity 12,174 kt/year) [17]
Conclusion on industry sector
The analysis on the hydrogen demand within the industry sector shows that especially
ammonia and methanol production as well as crude refineries show a large demand in hydrogen
and can therefore be considered as major target industrial sectors for use of green hydrogen
based on electrolysis.
Within the European Union, ammonia and methanol production facilities and crude
refineries are mainly located Germany, Poland, the Netherlands, Italy and France. Consequently,
within these countries electrolysers might find it easier to find customers in terms of supplying
industrial customers with green hydrogen. Especially for Germany however, it can be expected,
that due to large amounts of by-product hydrogen generation from chlorine production facilities
the total net hydrogen demand might be slightly reduced.
In terms of identifying suitable locations within these countries, water electrolysers
should be installed within the vicinity of the industrial customer especially in case of facilities
with a large hydrogen demand such as ammonia or methanol production units in order to avoid
significant additional costs for hydrogen transport. It needs to be considered, that in this case,
specific business models in terms of grid service provision might not be available as here
flexibility provision towards grid operators is required as specific locations within the power grid.
However, business models that are directed towards cross-commodity arbitrage trading and
provision of control reserve are independent on the specific location within country.
Share of total chlorine production capacities within Europe
0%
10%
20%
30%
40%
50%
D6.4 Assessment of market potential
ELYNTEGRATION. FCH-JU Grant Agreement 671458. SERI Contract number 15.0252 19
3.1.2 Mobility Sector
In the following, an assessment of the future hydrogen demand within mobility sector
shall be given. A detailed analysis in terms of hydrogen prices to be expected within the mobility
sector can be found in deliverable 2.3 of the ELYntegration project [1].
While estimations for current and future hydrogen demand by industry customers can be
made rather easily, estimations for future hydrogen demand within the mobility sector are quite
difficult since hydrogen mobility currently remains within a status of demonstration projects.
The development of hydrogen demand for mobility sector based on fuel cell electric vehicles
(FCEV) is mainly dependent on four factors:
Driving characteristics (range and time for refuelling)
Investment costs of the vehicle
Infrastructure on hydrogen refuelling stations (HRS)
Fuel costs
Even though driving characteristics of FCEV are already comparable to combustion engine
vehicles (CEV), investment costs for FCEV are currently significantly higher than for CEV [8].
Additionally, the number of FCEV remains low, since the current infrastructure on HRS is limited
to only a few stations within several cities leading to a suboptimal user-friendliness of FCEV.
Here, the problem is intrinsic, since for large infrastructure projects the major obstacle is a low
number of FCEV customers. As a consequence, there has not been a breakthrough of FCEV
within Europe so far and current hydrogen mobility projects remain dependent on subsidies.
Hence, the hydrogen demand within the mobility sector is currently negligible.
On the other hand, many studies indicate that the mobility sector might be the key sector
that can generate substantial growth and demand for green hydrogen [2] thus representing one
of the main target sectors for hydrogen generated by electrolyser applications. In 2009, the EU
agreed on reducing CO2 emissions by at least 80 % until 2050. This would require a
decarbonisation of the road transport by 95 % [18]. Besides using other alternatives to CEV like
battery only electric vehicles (BOEV), plug-in hybrid electric vehicles (PHEV) or CEV with fuels
based on renewable sources, this could be achieved by use of FCEV.
In future, FCEV may become an important market for Fuel Cell and Hydrogen (FCH)
technologies both in terms of European and global scope. Estimations for 2030 reflect a
penetration between 7-12 % for the European market [19] while globally the corresponding
share varies between 4 % and 25 % [20] [21]. The corresponding estimation of FCEV vehicles for
Europe and worldwide for 2030 is shown in Table 1 considering estimation on the total number
of all types of passenger vehicles of 313 million in Europe and 1,478 million worldwide for 2030
based on [22].
D6.4 Assessment of market potential
ELYNTEGRATION. FCH-JU Grant Agreement 671458. SERI Contract number 15.0252 20
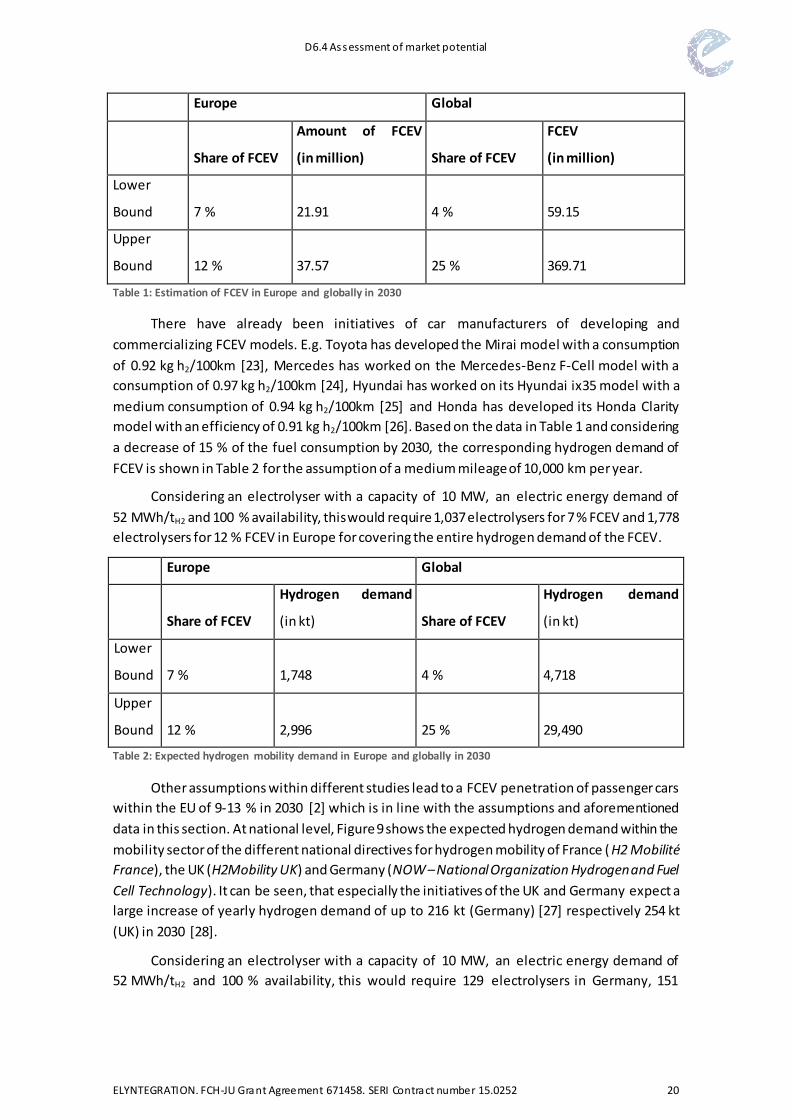
Europe Global
Share of FCEV
Amount of FCEV
(in million) Share of FCEV
FCEV
(in million)
Lower
Bound 7 % 21.91 4 % 59.15
Upper
Bound 12 % 37.57 25 % 369.71
Table 1: Estimation of FCEV in Europe and globally in 2030
There have already been initiatives of car manufacturers of developing and
commercializing FCEV models. E.g. Toyota has developed the Mirai model with a consumption
of 0.92 kg h2/100km [23], Mercedes has worked on the Mercedes-Benz F-Cell model with a
consumption of 0.97 kg h2/100km [24], Hyundai has worked on its Hyundai ix35 model with a
medium consumption of 0.94 kg h2/100km [25] and Honda has developed its Honda Clarity
model with an efficiency of 0.91 kg h2/100km [26]. Based on the data in Table 1 and considering
a decrease of 15 % of the fuel consumption by 2030, the corresponding hydrogen demand of
FCEV is shown in Table 2 for the assumption of a medium mileage of 10,000 km per year.
Considering an electrolyser with a capacity of 10 MW, an electric energy demand of
52 MWh/tH2 and 100 % availability, this would require 1,037 electrolysers for 7 % FCEV and 1,778
electrolysers for 12 % FCEV in Europe for covering the entire hydrogen demand of the FCEV.
Europe Global
Share of FCEV
Hydrogen demand
(in kt) Share of FCEV
Hydrogen demand
(in kt)
Lower
Bound 7 % 1,748 4 % 4,718
Upper
Bound 12 % 2,996 25 % 29,490
Table 2: Expected hydrogen mobility demand in Europe and globally in 2030
Other assumptions within different studies lead to a FCEV penetration of passenger cars
within the EU of 9-13 % in 2030 [2] which is in line with the assumptions and aforementioned
data in this section. At national level, Figure 9 shows the expected hydrogen demand within the
mobility sector of the different national directives for hydrogen mobility of France ( H2 Mobilité
France), the UK (H2Mobility UK) and Germany (NOW – National Organization Hydrogen and Fuel
Cell Technology). It can be seen, that especially the initiatives of the UK and Germany expect a
large increase of yearly hydrogen demand of up to 216 kt (Germany) [27] respectively 254 kt
(UK) in 2030 [28].
Considering an electrolyser with a capacity of 10 MW, an electric energy demand of
52 MWh/tH2 and 100 % availability, this would require 129 electrolysers in Germany, 151
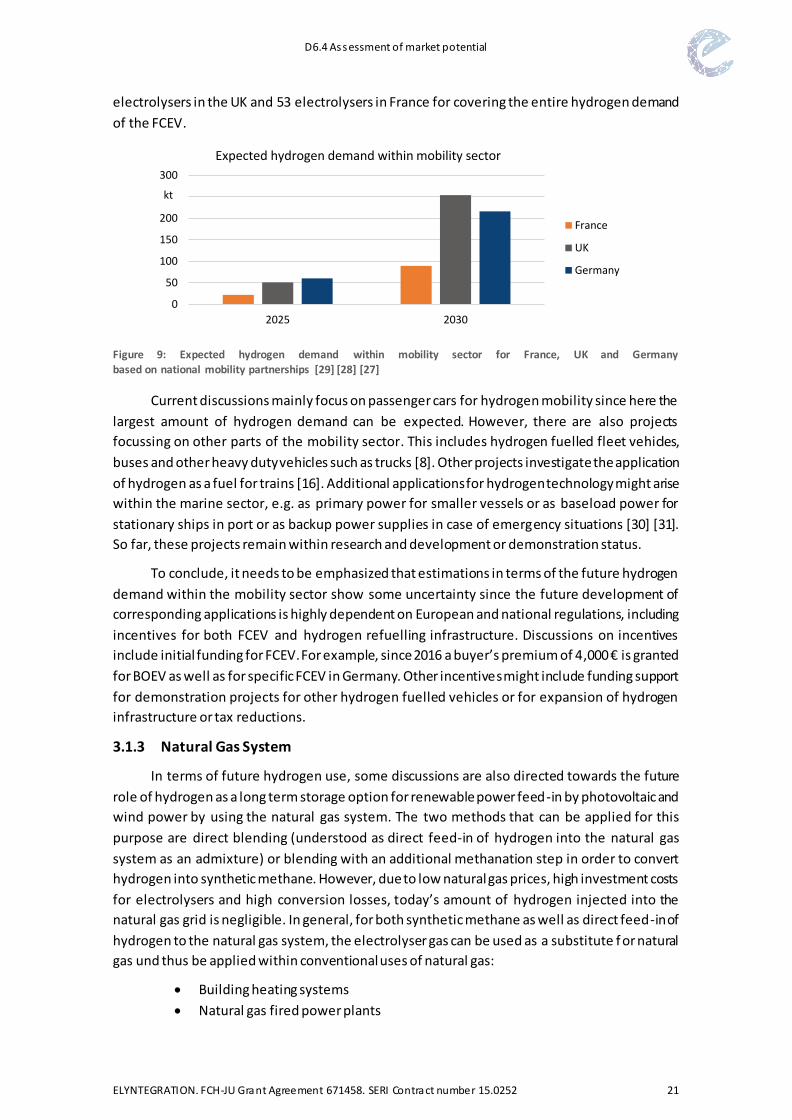
D6.4 Assessment of market potential
ELYNTEGRATION. FCH-JU Grant Agreement 671458. SERI Contract number 15.0252 21
electrolysers in the UK and 53 electrolysers in France for covering the entire hydrogen demand
of the FCEV.
Figure 9: Expected hydrogen demand within mobility sector for France, UK and Germany based on national mobility partnerships [29] [28] [27]
Current discussions mainly focus on passenger cars for hydrogen mobility since here the
largest amount of hydrogen demand can be expected. However, there are also projects
focussing on other parts of the mobility sector. This includes hydrogen fuelled fleet vehicles,
buses and other heavy duty vehicles such as trucks [8]. Other projects investigate the application
of hydrogen as a fuel for trains [16]. Additional applications for hydrogen technology might arise
within the marine sector, e.g. as primary power for smaller vessels or as baseload power for
stationary ships in port or as backup power supplies in case of emergency situations [30] [31].
So far, these projects remain within research and development or demonstration status.
To conclude, it needs to be emphasized that estimations in terms of the future hydrogen
demand within the mobility sector show some uncertainty since the future development of
corresponding applications is highly dependent on European and national regulations, including
incentives for both FCEV and hydrogen refuelling infrastructure. Discussions on incentives
include initial funding for FCEV. For example, since 2016 a buyer’s premium of 4,000 € is granted
for BOEV as well as for specific FCEV in Germany. Other incentives might include funding support
for demonstration projects for other hydrogen fuelled vehicles or for expansion of hydrogen
infrastructure or tax reductions.
3.1.3 Natural Gas System
In terms of future hydrogen use, some discussions are also directed towards the future
role of hydrogen as a long term storage option for renewable power feed-in by photovoltaic and
wind power by using the natural gas system. The two methods that can be applied for this
purpose are direct blending (understood as direct feed-in of hydrogen into the natural gas
system as an admixture) or blending with an additional methanation step in order to convert
hydrogen into synthetic methane. However, due to low natural gas prices, high investment costs
for electrolysers and high conversion losses, today’s amount of hydrogen injected into the
natural gas grid is negligible. In general, for both synthetic methane as well as direct feed-in of
hydrogen to the natural gas system, the electrolyser gas can be used as a substitute f or natural
gas und thus be applied within conventional uses of natural gas:
Building heating systems
Natural gas fired power plants
0
50
100
150
200
250
300
2025 2030
France
UK
Germany
Expected hydrogen demand within mobility sector
kt
D6.4 Assessment of market potential
ELYNTEGRATION. FCH-JU Grant Agreement 671458. SERI Contract number 15.0252 22
Combined heat and power plants
Natural gas vehicles (NGV)
Industrial applications
In terms of blending however, it needs to be considered that the maximum amount of
hydrogen within the natural gas system is limited. In literature, studies differ in terms of the
maximum permissible amount of hydrogen admixture to the natural gas system. While [2]
states, that a hydrogen injection of 1 %vol up to 15 % vol would only cause minor technical
drawbacks to the natural gas system. According to [32] and [33] an admixture of more than 4-
5 % might already be critical. When it comes to end users of natural gas, even this ratio could
already cause damages to technology. For example, in case of conventional combustion engines,
an admixture of up to 2 %vol of hydrogen is permitted within the natural gas fuel. However, even
at ratios of around 2-5 %vol, large amounts of hydrogen could be stored within the existing
natural gas system of more than 0.5 million tons of hydrogen [2]. In case an additional
methanation step is used, the produced synthetic methane can be used as an equivalent of
natural gas. Therefore, there is no maximum amount of admixture. Because of no volume
restricts, the storage capacity within the natural gas system is even larger compared to a direct
admixture of hydrogen [33]. However, due to additional conversion losses for the methanation
process, the efficiency of the overall process decreases.
Currently, the electrolyser applications in the natural gas system are negligible and both
in the short and in the medium run corresponding business models are not expected to be
profitable. On the other hand, long term opportunities are given due to the large storage
capacity for renewable power feed-in from photovoltaic and wind power plants. Especially in
terms of its long discharge times and its large storage capacity, the technical potential of
electrolysers is very high compared to other storage alternatives like batteries, compressed air
or pumped storage [33]. Taking into account the decarbonisation goals of the European Union,
it can be envisaged, that “green” hydrogen can achieve higher feed-in tariffs than the spot
market price of natural gas. Analogous to current feed-in tariff schemes of bio methane, green
hydrogen injection tariffs could support electrolyser business models directed towards natural
gas system in order to aid decarbonisation goals and could lead to more efficient operation also
in the short and medium run for electrolyser applications [1] [34].
3.1.4 Other Applications
In addition to industry sector, mobility sector and natural gas system, other applications
for hydrogen use are currently in discussion. These applications include
Co-generation of power and heat within buildings
Fuel cell fork lifts
Autonomous power systems for stationary or portable off -grid applications
Uninterruptible power systems
Being niche applications, hydrogen and fuel cell use within these applications is viable
option e.g. in order present alternatives to conventional fuels and to bring down CO2 emissions.
However, even in case of a significant amount of hydrogen applications within these sectors in
future, their future hydrogen demand will most likely be small compared to the other end user
sectors for hydrogen.
D6.4 Assessment of market potential
ELYNTEGRATION. FCH-JU Grant Agreement 671458. SERI Contract number 15.0252 23
3.2 Potential Drivers and Risks
In the following, potential drivers and risks for the future market potential of electrolysers
are discussed. Besides uncertainties in terms of future green hydrogen prices for example within
the mobility sector, this includes the end user price of electricity for electrolysers and potential
future exemptions from taxes, network costs and other surcharges that might present a
significant driver. Additionally, influencing factors on future developments within the relevant
key markets of the electrolyser both in terms of hydrogen and electric energy have to be taken
into account since uncertainties within future scenarios of these markets have a significant
impact on the future profitability of electrolyser energy applications. Consequently, based on
the business models developed and evaluated in deliverable 2.3 of the ELYntegration project [1]
and summarized in the following, important factors influencing the economic efficiency of
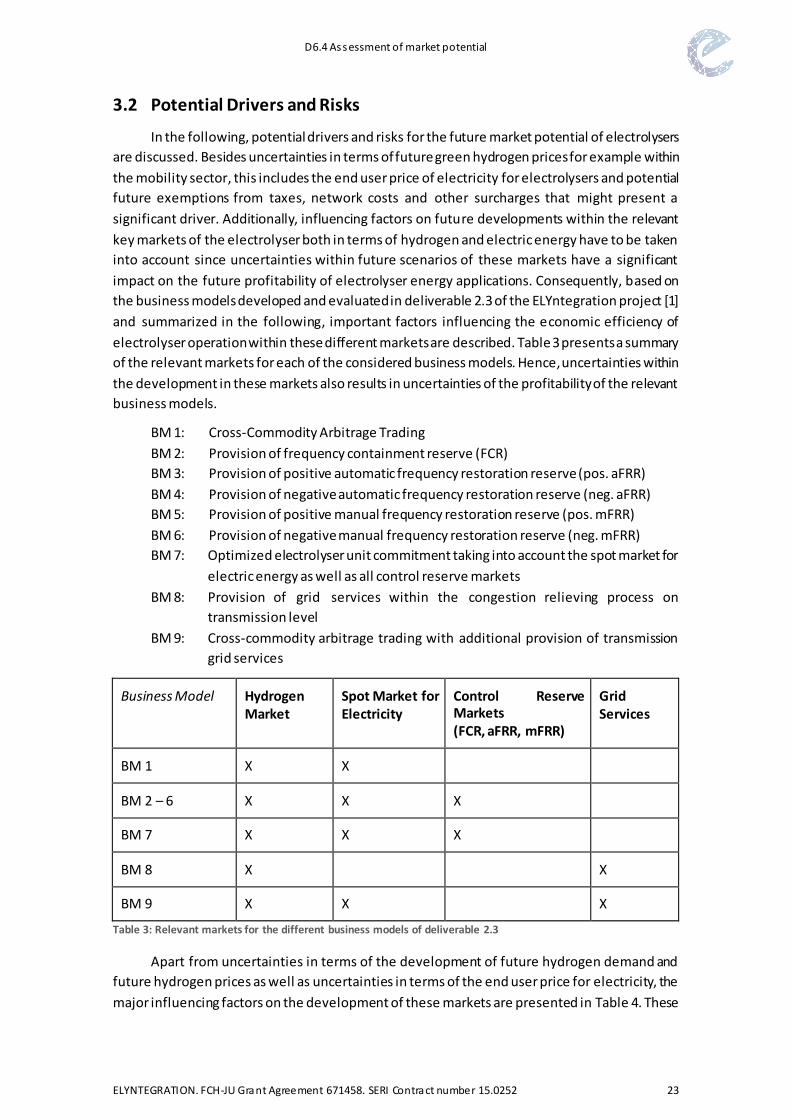
electrolyser operation within these different markets are described. Table 3 presents a summary
of the relevant markets for each of the considered business models. Hence, uncertainties within
the development in these markets also results in uncertainties of the profitability of the relevant
business models.
BM 1: Cross-Commodity Arbitrage Trading
BM 2: Provision of frequency containment reserve (FCR)
BM 3: Provision of positive automatic frequency restoration reserve (pos. aFRR)
BM 4: Provision of negative automatic frequency restoration reserve (neg. aFRR)
BM 5: Provision of positive manual frequency restoration reserve (pos. mFRR)
BM 6: Provision of negative manual frequency restoration reserve (neg. mFRR)
BM 7: Optimized electrolyser unit commitment taking into account the spot market for
electric energy as well as all control reserve markets
BM 8: Provision of grid services within the congestion relieving process on
transmission level
BM 9: Cross-commodity arbitrage trading with additional provision of transmission
grid services
Business Model Hydrogen Market
Spot Market for Electricity
Control Reserve Markets (FCR, aFRR, mFRR)
Grid Services
BM 1 X X
BM 2 – 6 X X X
BM 7 X X X
BM 8 X X
BM 9 X X X
Table 3: Relevant markets for the different business models of deliverable 2.3
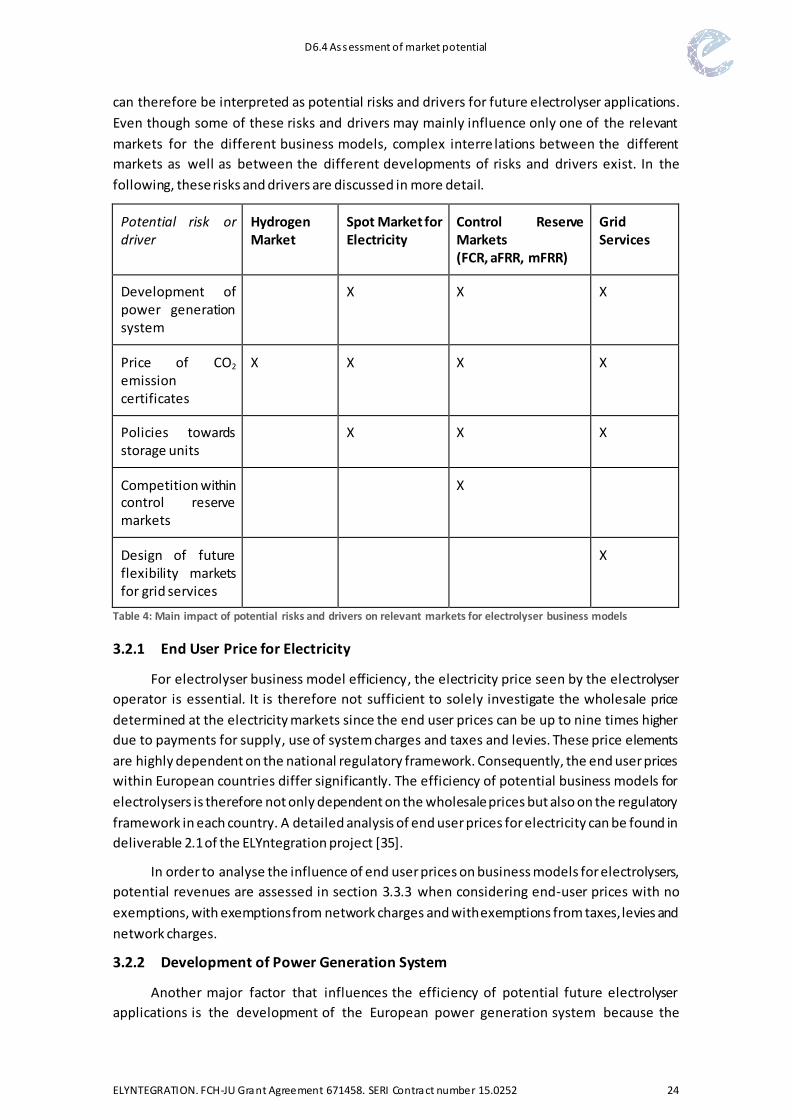
Apart from uncertainties in terms of the development of future hydrogen demand and
future hydrogen prices as well as uncertainties in terms of the end user price for electricity, the
major influencing factors on the development of these markets are presented in Table 4. These
D6.4 Assessment of market potential
ELYNTEGRATION. FCH-JU Grant Agreement 671458. SERI Contract number 15.0252 24
can therefore be interpreted as potential risks and drivers for future electrolyser applications.
Even though some of these risks and drivers may mainly influence only one of the relevant
markets for the different business models, complex interre lations between the different
markets as well as between the different developments of risks and drivers exist. In the
following, these risks and drivers are discussed in more detail.
Potential risk or driver
Hydrogen Market
Spot Market for Electricity
Control Reserve Markets (FCR, aFRR, mFRR)
Grid Services
Development of power generation system
X X X
Price of CO2 emission certificates
X X X X
Policies towards storage units
X X X
Competition within control reserve markets
X
Design of future flexibility markets for grid services
X
Table 4: Main impact of potential risks and drivers on relevant markets for electrolyser business models
3.2.1 End User Price for Electricity
For electrolyser business model efficiency, the electricity price seen by the electrolyser
operator is essential. It is therefore not sufficient to solely investigate the wholesale price
determined at the electricity markets since the end user prices can be up to nine times higher
due to payments for supply, use of system charges and taxes and levies. These price elements
are highly dependent on the national regulatory framework. Consequently, the end user prices
within European countries differ significantly. The efficiency of potential business models for
electrolysers is therefore not only dependent on the wholesale prices but also on the regulatory
framework in each country. A detailed analysis of end user prices for electricity can be found in
deliverable 2.1 of the ELYntegration project [35].
In order to analyse the influence of end user prices on business models for electrolysers,
potential revenues are assessed in section 3.3.3 when considering end-user prices with no
exemptions, with exemptions from network charges and with exemptions from taxes, levies and
network charges.
3.2.2 Development of Power Generation System
Another major factor that influences the efficiency of potential future electrolyser
applications is the development of the European power generation system because the
D6.4 Assessment of market potential
ELYNTEGRATION. FCH-JU Grant Agreement 671458. SERI Contract number 15.0252 25
composition of the generation stack determines electricity prices. Especially the capacity of RES
power plants due to its intermittent power feed-in has a significant impact on future prices at
the spot market for electricity as well as the different control reserve markets. On the one hand,
a large amount of RES leads to an increasing amount of situations with very low spot prices for
electricity (e.g. high wind/low load situations) as well as an increasing amount of situations with
high spot prices (e.g. low wind/high load situations). On the other hand, the demand for control
reserve increases in case of high shares of RES in the generation system. Additionally, especially
the allocation of RES in combination with the corresponding grid expansion has an impact on
the congestions within the power grid and therefore on the potential of electrolyser applications
within a future market for grid services. Consequently, also national policies and roadmaps for
RES expansion or the plan for a phase-out of specific conventional power generation
technologies such as nuclear power or lignite fired power plants have a large impact on the
economic efficiency of future electrolyser applications.
The evaluation of business models in deliverable 2.3 uses best guess scenarios for the
development of the power generation system within the market and transmissi on grid
simulations. However, since the composition of future generation system imposes a significant
uncertainty within the simulations, in section 3.3.5 a sensitivity analysis for year 2024 is
performed that identified the potential risks seen by investors for electrolysers due to different
estimates for the future share of RES in the European power system.
3.2.3 Price of Emission Certificates
The development of CO2 emission certificate prices also has a significant impact on the
development of all key markets and therefore impacts the future potential of all considered
future business models for electrolyser applications.
Firstly, it is expected that the merchant hydrogen price is strongly influenced by emission
certificate prices. Since merchant hydrogen is mainly dominated by hydrogen production via
SMR of natural gas, CO2 equivalent emissions of this production pathway accounting for
11.888 g per kg of hydrogen produced [36] impact the expected hydrogen price. Consequently,
rising prices of emission certificates are most likely to result in increasing hydrogen prices thus
having a positive effect on the revenues generated by the sales of hydrogen within all business
models. Additionally, increasing CO2 emission certificate prices are expected to impact on
willingness to search for alternatives than SMR not only for future hydrogen sectors such as
mobility but also and especially for hydrogen demand in the industry sector.
The influence of increasing CO2 emission certificate prices on spot market prices are not
that easily to be assessed. On the one hand, rising certificate prices lead to increasing
operational costs of conventional power plants with large amounts of CO2 emissions such as
large lignite fired power plants. As a result, in case the marginal costs of these power plants are
price setting at the spot market for electric energy, a direct increase of spot market price s is to
be expected. On the other hand, in case the increase in prices for the certificates are high
enough, a fuel switch might occur. Currently, primary energy costs for lignite are lower than for
coal and natural gas while CO2 emissions are highest for lignite fired power plants followed by
hard coal and natural gas fired power plants. Currently, the resulting marginal costs for lignite
are still lower than for coal and for natural gas fired power plants. However, rising certificate
prices might reverse this effect. Consequently, in this case marginal costs for coal and natural
D6.4 Assessment of market potential
ELYNTEGRATION. FCH-JU Grant Agreement 671458. SERI Contract number 15.0252 26
gas fired power plants would be lower resulting in an increasingly unprofitable operation of
lignite fired power plants as their full load hours would decrease. Eventually, this fuel switch
would lead to a gradual displacement of those generation capacities that show large amounts
of CO2 emissions significantly increasing future prices at the spot market for electric energy.
Since a large amount of control reserve is covered by conventional power plants, CO2
emission certificate prices also affect the energy prices on these markets. Hence, the economic
efficiency of business models of electrolyser participation in control reserve is affected.
A fuel switch would also lead to impacts on the potential of electrolyser provision of
transmission grid services in a possible future flexibility market within the congestion relieving
process. The replacement of existing generation capacities of lignite power plants by natural gas
fired power plants has an impact on transmission grid congestions and therefore on the
necessary curtailment of RES in order to ensure a secure transmission grid operation. Thus, also
the full load hours of business model 8 and 9 would be affected by a variation of CO2 emission
certificate prices.
3.2.4 Policies towards Energy Storage
The economic efficiency of electrolysers is influenced by political and regulatory decisions.
Generally, regulation sees storage units as end-users. This is lawfully reasoned by arguing that
storage unit at first consume electricity, the latter reconversion of stored energy into electricity
is a different topic. Policies that promote storage units as end-users in general and thereof
electrolysers are exemptions from certain electricity elements for end-users. Current possible
exemptions are discussed within section 3.2.1, where the end-user prices for electricity are
assessed.
Another possibility of funding is financial support for investments in storage units. The
European Union addresses the funding of storage in the “Guidelines on State aid for
environmental protection and energy 2014-2020” [37]. If a financial assistance falls in the
category of state aid, these guidelines apply. Within the guidelines, it is stated that state aid is
to be designed as investment support and no operational support for the unit. Furthermore, the
aid is not allowed to cover 100 % of investment costs, because then it would not be compatible
with the European domestic market. However, these guidelines do not require for countries to
act on storage support policies. This as well applies for the directive on the promotion of the use
of energy from renewable sources, which urges the member states to take suitable measures
for the support of storage units. It states: “There is a need to support the integration of energy
from renewable sources into the transmission and distribution grid and the use of energy
storage systems for integrated intermittent production of energy from renewable sources” [38].
However, this is only formulated as a suggestion without establishing the legal requirement for
a financial support of storage units, so investment support schemes or further exemptions for
storage units cannot be safely foreseen for the future.
The support of storage units may not only benefit electrolysers, but as well bears the risk
of higher competition in the markets when more storage units – may it be electrolysers or other
storage systems – penetrate the market due to increased financial support. This higher market
penetration of storage units would lead to peak shaving effects for electricity prices at the spot
market and thus a lower volatility. The “shaved” peaks may be high or low peaks. For the
electrolyser, this would lead to fewer hours of low electricity prices and reduced full load hours.
D6.4 Assessment of market potential
ELYNTEGRATION. FCH-JU Grant Agreement 671458. SERI Contract number 15.0252 27
3.2.5 Competition within Control Reserve Markets
The economic efficiency of electrolyser business models that are directed towards
participation in control reserve markets is highly dependent on the future development on
control reserve markets. This includes on the one hand the required future capacity of control
reserve markets for FCR, aFRR and mFRR and on the other hand on the amount of participants
within these markets. A risk towards these business models are therefore other technologies
that might supply control reserve in future power systems dominated by large shares of RES
power. A large competition by other technologies that might show higher maturity or higher
cost efficiency than electrolysers could destroy profitability of electrolyser business models.
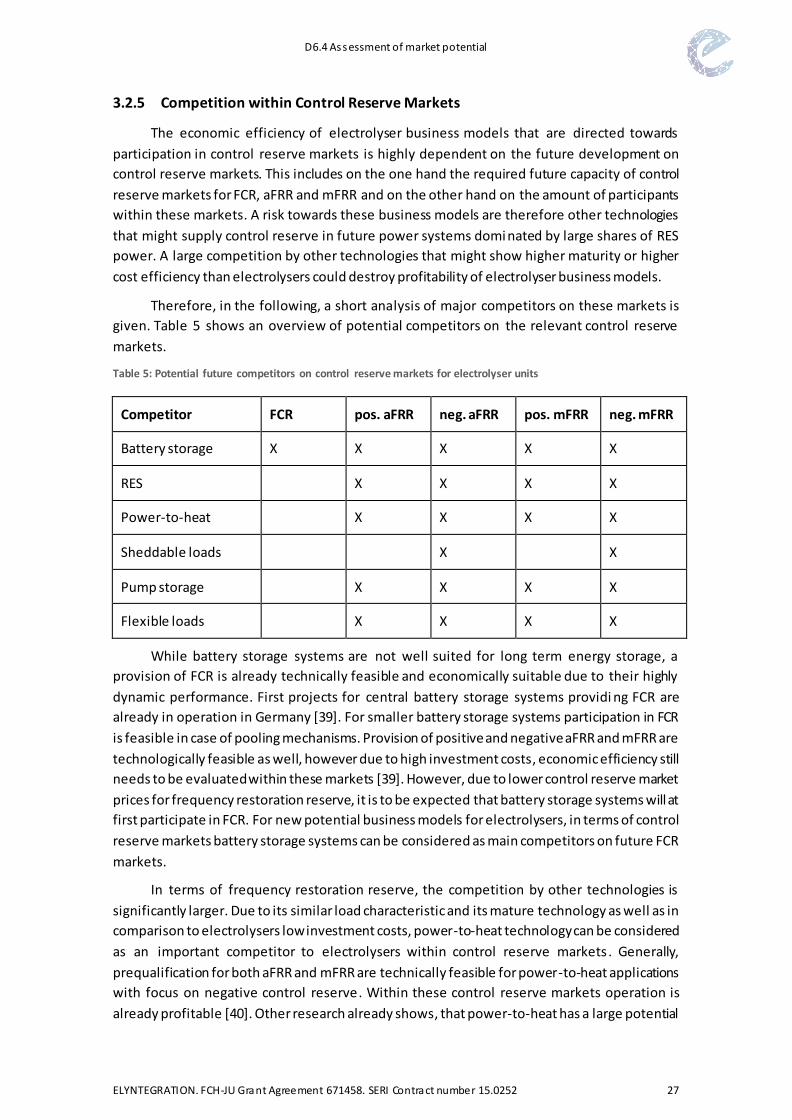
Therefore, in the following, a short analysis of major competitors on these markets is
given. Table 5 shows an overview of potential competitors on the relevant control reserve
markets.
Table 5: Potential future competitors on control reserve markets for electrolyser units
Competitor FCR pos. aFRR neg. aFRR pos. mFRR neg. mFRR
Battery storage X X X X X
RES X X X X
Power-to-heat X X X X
Sheddable loads X X
Pump storage X X X X
Flexible loads X X X X
While battery storage systems are not well suited for long term energy storage, a
provision of FCR is already technically feasible and economically suitable due to their highly
dynamic performance. First projects for central battery storage systems providi ng FCR are
already in operation in Germany [39]. For smaller battery storage systems participation in FCR
is feasible in case of pooling mechanisms. Provision of positive and negative aFRR and mFRR are
technologically feasible as well, however due to high investment costs, economic efficiency still
needs to be evaluated within these markets [39]. However, due to lower control reserve market
prices for frequency restoration reserve, it is to be expected that battery storage systems will at
first participate in FCR. For new potential business models for electrolysers, in terms of control
reserve markets battery storage systems can be considered as main competitors on future FCR
markets.
In terms of frequency restoration reserve, the competition by other technologies is
significantly larger. Due to its similar load characteristic and its mature technology as well as in
comparison to electrolysers low investment costs, power-to-heat technology can be considered
as an important competitor to electrolysers within control reserve markets. Generally,
prequalification for both aFRR and mFRR are technically feasible for power-to-heat applications
with focus on negative control reserve. Within these control reserve markets operation is
already profitable [40]. Other research already shows, that power-to-heat has a large potential
D6.4 Assessment of market potential
ELYNTEGRATION. FCH-JU Grant Agreement 671458. SERI Contract number 15.0252 28
for decreasing prices at control reserve markets as well as reducing the amount of must-run
capacities of conventional power plants within the power system [41]. Consequently, a future
high participation of power-to-heat units in control reserve markets might significantly decrease
contribution margins for electrolyser business models that are focused on these markets.
Other potential competitors within aFRR and mFRR are pumped hydro power plants that
can participate at both positive and negative automatic and manual frequency restoration
reserve markets. The same holds true for RES power plants. Here, a provision of positive FRR is
possible [42]. In medium and long term, also a reduction of feed-in of intermittent RES power
units as negative control reserve is possible. Generally, f lexible biomass power plants such as
bio methane fired power plants are also suitable for participation at FRR markets. However, due
to regulation these units mostly run in base load operation participating at the spot market for
electricity [40]. Large sheddable industrial loads are able to provide both negative aFRR and
mFRR. By use of an aggregator for shiftable loads a collective provision of FCR is theoretically
possible [43].
It can also be expected that pooling companies, that aggregate smaller power units of
different technologies such as biomass and RES power plants, emergency generators, flexible
industrial loads and heat pumps, will participate in these control reserve markets. By pooling,
participation within all control reserve markets (FCR, aFRR and mFRR) can be achieved [42].
Additionally, the increasing cooperation between the European transmission system
operators within the international grid control cooperation (IGCC) significantly impacts future
control reserve markets. An increasing cooperation might lead to a reduced amount of required
control reserve to be kept available and thus to reduced prices at the control reserve markets
within Europe. Consequently, revenues to be gained by electrolyser business models within
these markets might face decreasing profitability in case of an increased cooperation within
Europe.
3.2.6 Design of Future Flexibility Markets for Grid Services
In terms of business model 8 and 9, which are both directed towards future provision of
grid services by electrolysers, the design of corresponding future flexibility markets imposes a
high uncertainty to future electrolyser application and especially to potential contribution
margins. As already discussed in the analysis of future business models in deliverable 2.3,
currently, there is no regulatory framework for those flexibility markets on distribution levels
even though potential future designs are discussed. The same holds true for regulation in terms
of flexible load in order to absorb curtailment energy of RES that may remove stress on the
transmission grid. Since corresponding electricity prices and potential reimbursements are not
to foreseeable, profitability of these business models is challenging to evaluate. Additionally,
within such flexibility markets, it is to be expected that electrolysers would face competition by
other technologies with load flexibility such as power-to-heat applications or battery systems.
Even in case these flexibility markets exist in future, economic efficiency of corresponding
electrolyser applications would be dependent on the location of the electrolyser within the
distribution or transmission grid. Only locations within regions of excess RES energy would be
suited for electrolyser provision of grid services, thus limiting market potential.
D6.4 Assessment of market potential
ELYNTEGRATION. FCH-JU Grant Agreement 671458. SERI Contract number 15.0252 29
It also needs to be taken into account that grid expansion planning is directed towards a
congestion free grid (apart from a curtailment of 3 % of the overall RES feed-in in Germany).
Consequently, in the long run it is to be expected that potential operational hours of an
electrolyser only providing grid services would be rather low resulting in poor economic
efficiency. However, in the short to medium run, larger potential full load hours can be expected
in case the grid expansion does not hold pace with RES expansion due to delays in installation
of new power lines. In order to evaluate corresponding short to medium potential of electrolyser
grid service provision on transmission level, section 3.3.6 presents a sensitivity analysis
exemplarily for the German transmission system for year 2024 with delayed installations of
HVDC links connecting northern to southern Germany.
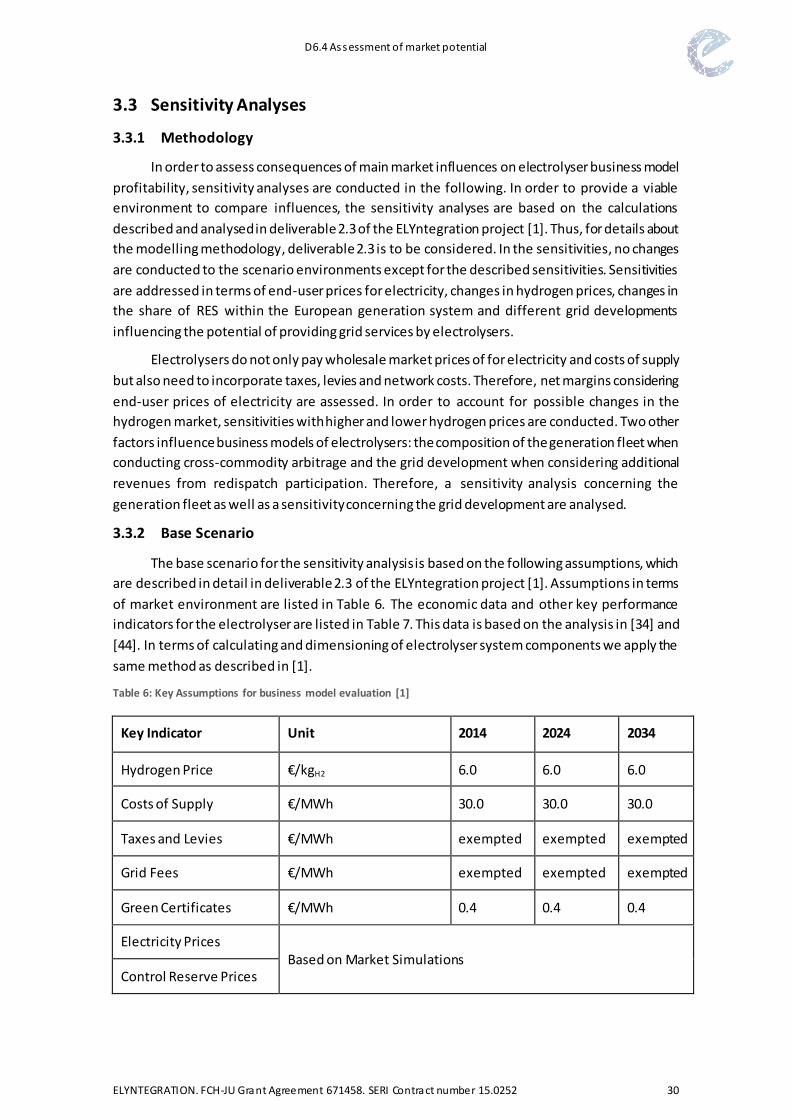
D6.4 Assessment of market potential
ELYNTEGRATION. FCH-JU Grant Agreement 671458. SERI Contract number 15.0252 30
3.3 Sensitivity Analyses
3.3.1 Methodology
In order to assess consequences of main market influences on electrolyser business model
profitability, sensitivity analyses are conducted in the following. In order to provide a viable
environment to compare influences, the sensitivity analyses are based on the calculations
described and analysed in deliverable 2.3 of the ELYntegration project [1]. Thus, for details about
the modelling methodology, deliverable 2.3 is to be considered. In the sensitivities, no changes
are conducted to the scenario environments except for the described sensitivities. Sensitivities
are addressed in terms of end-user prices for electricity, changes in hydrogen prices, changes in
the share of RES within the European generation system and different grid developments
influencing the potential of providing grid services by electrolysers.
Electrolysers do not only pay wholesale market prices of for electricity and costs of supply
but also need to incorporate taxes, levies and network costs. Therefore, net margins considering
end-user prices of electricity are assessed. In order to account for possible changes in the
hydrogen market, sensitivities with higher and lower hydrogen prices are conducted. Two other
factors influence business models of electrolysers: the composition of the generation fleet when
conducting cross-commodity arbitrage and the grid development when considering additional
revenues from redispatch participation. Therefore, a sensitivity analysis concerning the
generation fleet as well as a sensitivity concerning the grid development are analysed.
3.3.2 Base Scenario
The base scenario for the sensitivity analysis is based on the following assumptions, which
are described in detail in deliverable 2.3 of the ELYntegration project [1]. Assumptions in terms
of market environment are listed in Table 6. The economic data and other key performance
indicators for the electrolyser are listed in Table 7. This data is based on the analysis in [34] and
[44]. In terms of calculating and dimensioning of electrolyser system components we apply the
same method as described in [1].
Table 6: Key Assumptions for business model evaluation [1]
Key Indicator Unit 2014 2024 2034
Hydrogen Price €/kgH2 6.0 6.0 6.0
Costs of Supply €/MWh 30.0 30.0 30.0
Taxes and Levies €/MWh exempted exempted exempted
Grid Fees €/MWh exempted exempted exempted
Green Certificates €/MWh 0.4 0.4 0.4
Electricity Prices Based on Market Simulations
Control Reserve Prices
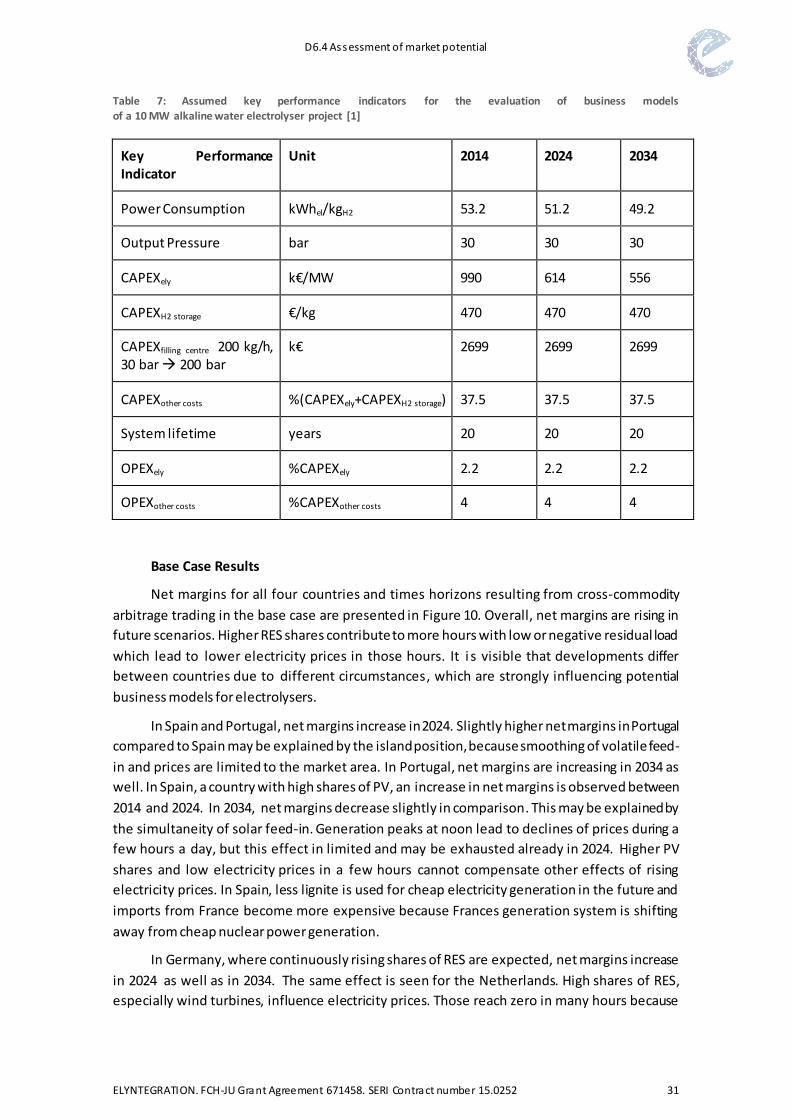
D6.4 Assessment of market potential
ELYNTEGRATION. FCH-JU Grant Agreement 671458. SERI Contract number 15.0252 31
Table 7: Assumed key performance indicators for the evaluation of business models of a 10 MW alkaline water electrolyser project [1]
Key Performance Indicator
Unit 2014 2024 2034
Power Consumption kWhel/kgH2 53.2 51.2 49.2
Output Pressure bar 30 30 30
CAPEXely k€/MW 990 614 556
CAPEXH2 storage €/kg 470 470 470
CAPEXfilling centre 200 kg/h, 30 bar 200 bar
k€ 2699 2699 2699
CAPEXother costs %(CAPEXely+CAPEXH2 storage) 37.5 37.5 37.5
System lifetime years 20 20 20
OPEXely %CAPEXely 2.2 2.2 2.2
OPEXother costs %CAPEXother costs 4 4 4
Base Case Results
Net margins for all four countries and times horizons resulting from cross-commodity
arbitrage trading in the base case are presented in Figure 10. Overall, net margins are rising in
future scenarios. Higher RES shares contribute to more hours with low or negative residual load
which lead to lower electricity prices in those hours. It i s visible that developments differ
between countries due to different circumstances, which are strongly influencing potential
business models for electrolysers.
In Spain and Portugal, net margins increase in 2024. Slightly higher net margins in Portugal
compared to Spain may be explained by the island position, because smoothing of volatile feed-
in and prices are limited to the market area. In Portugal, net margins are increasing in 2034 as
well. In Spain, a country with high shares of PV, an increase in net margins is observed between
2014 and 2024. In 2034, net margins decrease slightly in comparison. This may be explained by
the simultaneity of solar feed-in. Generation peaks at noon lead to declines of prices during a
few hours a day, but this effect in limited and may be exhausted already in 2024. Higher PV
shares and low electricity prices in a few hours cannot compensate other effects of rising
electricity prices. In Spain, less lignite is used for cheap electricity generation in the future and
imports from France become more expensive because Frances generation system is shifting
away from cheap nuclear power generation.
In Germany, where continuously rising shares of RES are expected, net margins increase
in 2024 as well as in 2034. The same effect is seen for the Netherlands. High shares of RES,
especially wind turbines, influence electricity prices. Those reach zero in many hours because
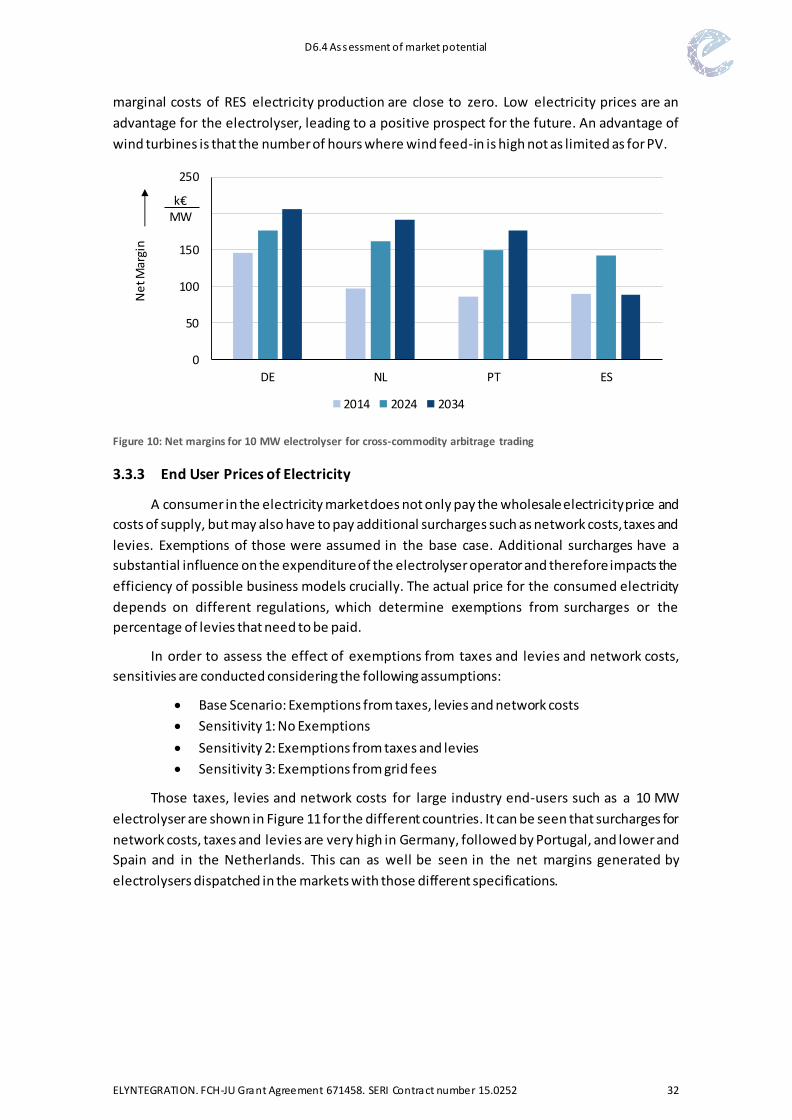
D6.4 Assessment of market potential
ELYNTEGRATION. FCH-JU Grant Agreement 671458. SERI Contract number 15.0252 32
marginal costs of RES electricity production are close to zero. Low electricity prices are an
advantage for the electrolyser, leading to a positive prospect for the future. An advantage of
wind turbines is that the number of hours where wind feed-in is high not as limited as for PV.
Figure 10: Net margins for 10 MW electrolyser for cross-commodity arbitrage trading
3.3.3 End User Prices of Electricity
A consumer in the electricity market does not only pay the wholesale electricity price and
costs of supply, but may also have to pay additional surcharges such as network costs, taxes and
levies. Exemptions of those were assumed in the base case. Additional surcharges have a
substantial influence on the expenditure of the electrolyser operator and therefore impacts the
efficiency of possible business models crucially. The actual price for the consumed electricity
depends on different regulations, which determine exemptions from surcharges or the
percentage of levies that need to be paid.
In order to assess the effect of exemptions from taxes and levies and network costs,
sensitivies are conducted considering the following assumptions:
Base Scenario: Exemptions from taxes, levies and network costs
Sensitivity 1: No Exemptions
Sensitivity 2: Exemptions from taxes and levies
Sensitivity 3: Exemptions from grid fees
Those taxes, levies and network costs for large industry end-users such as a 10 MW
electrolyser are shown in Figure 11 for the different countries. It can be seen that surcharges for
network costs, taxes and levies are very high in Germany, followed by Portugal, and lower and
Spain and in the Netherlands. This can as well be seen in the net margins generated by
electrolysers dispatched in the markets with those different specifications.
0
50
100
150
200
250
DE NL PT ES
Ne
t Mar
gin
2014 2024 2034
k€MW
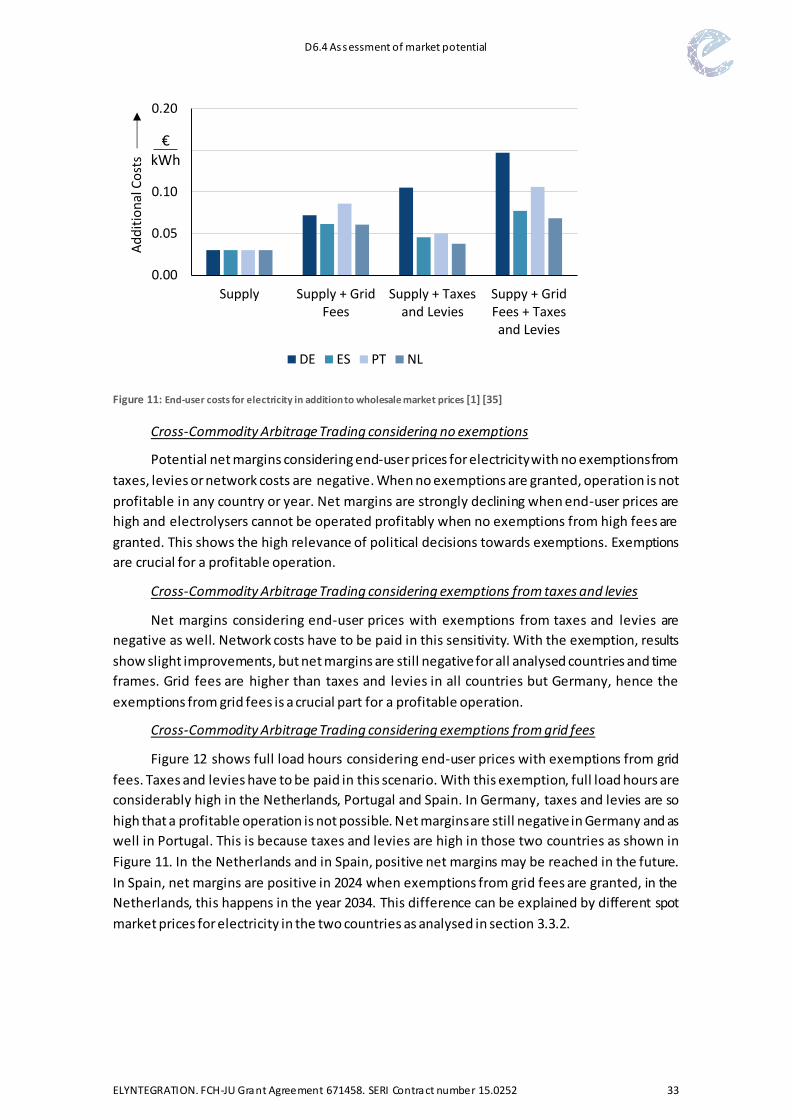
D6.4 Assessment of market potential
ELYNTEGRATION. FCH-JU Grant Agreement 671458. SERI Contract number 15.0252 33
Figure 11: End-user costs for electricity in addition to wholesale market prices [1] [35]
Cross-Commodity Arbitrage Trading considering no exemptions
Potential net margins considering end-user prices for electricity with no exemptions from
taxes, levies or network costs are negative. When no exemptions are granted, operation is not
profitable in any country or year. Net margins are strongly declining when end-user prices are
high and electrolysers cannot be operated profitably when no exemptions from high fees are
granted. This shows the high relevance of political decisions towards exemptions. Exemptions
are crucial for a profitable operation.
Cross-Commodity Arbitrage Trading considering exemptions from taxes and levies
Net margins considering end-user prices with exemptions from taxes and levies are
negative as well. Network costs have to be paid in this sensitivity. With the exemption, results
show slight improvements, but net margins are still negative for all analysed countries and time
frames. Grid fees are higher than taxes and levies in all countries but Germany, hence the
exemptions from grid fees is a crucial part for a profitable operation.
Cross-Commodity Arbitrage Trading considering exemptions from grid fees
Figure 12 shows full load hours considering end-user prices with exemptions from grid
fees. Taxes and levies have to be paid in this scenario. With this exemption, full load hours are
considerably high in the Netherlands, Portugal and Spain. In Germany, taxes and levies are so
high that a profitable operation is not possible. Net margins are still negative in Germany and as
well in Portugal. This is because taxes and levies are high in those two countries as shown in
Figure 11. In the Netherlands and in Spain, positive net margins may be reached in the future.
In Spain, net margins are positive in 2024 when exemptions from grid fees are granted, in the
Netherlands, this happens in the year 2034. This difference can be explained by different spot
market prices for electricity in the two countries as analysed in section 3.3.2.
0.00
0.05
0.10
0.15
0.20
Supply Supply + GridFees
Supply + Taxesand Levies
Suppy + GridFees + Taxesand Levies
Ad
dit
ion
al C
ost
s
DE ES PT NL
€kWh
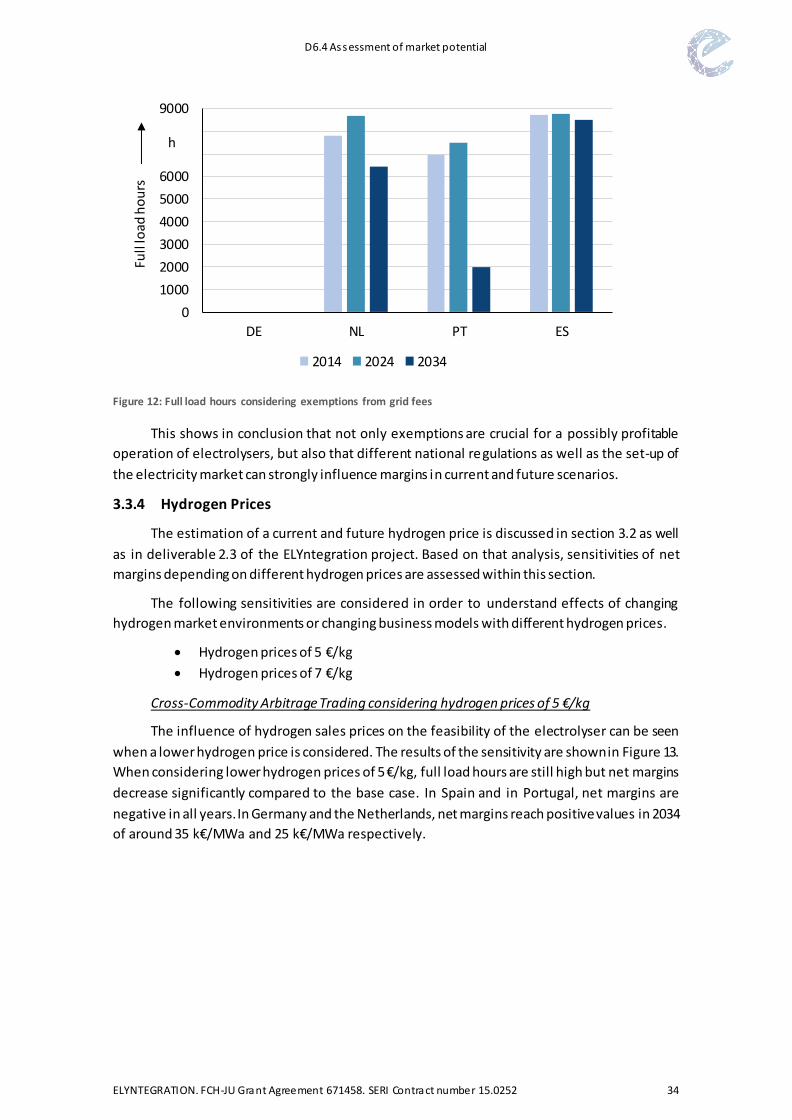
D6.4 Assessment of market potential
ELYNTEGRATION. FCH-JU Grant Agreement 671458. SERI Contract number 15.0252 34
Figure 12: Full load hours considering exemptions from grid fees
This shows in conclusion that not only exemptions are crucial for a possibly profitable
operation of electrolysers, but also that different national regulations as well as the set-up of
the electricity market can strongly influence margins in current and future scenarios.
3.3.4 Hydrogen Prices
The estimation of a current and future hydrogen price is discussed in section 3.2 as well
as in deliverable 2.3 of the ELYntegration project. Based on that analysis, sensitivities of net
margins depending on different hydrogen prices are assessed within this section.
The following sensitivities are considered in order to understand effects of changing
hydrogen market environments or changing business models with different hydrogen prices.
Hydrogen prices of 5 €/kg
Hydrogen prices of 7 €/kg
Cross-Commodity Arbitrage Trading considering hydrogen prices of 5 €/kg
The influence of hydrogen sales prices on the feasibility of the electrolyser can be seen
when a lower hydrogen price is considered. The results of the sensitivity are shown in Figure 13.
When considering lower hydrogen prices of 5 €/kg, full load hours are still high but net margins
decrease significantly compared to the base case. In Spain and in Portugal, net margins are
negative in all years. In Germany and the Netherlands, net margins reach positive values in 2034
of around 35 k€/MWa and 25 k€/MWa respectively.
0
1000
2000
3000
4000
5000
6000
7000
8000
9000
DE NL PT ES
Full
load
ho
urs
2014 2024 2034
h
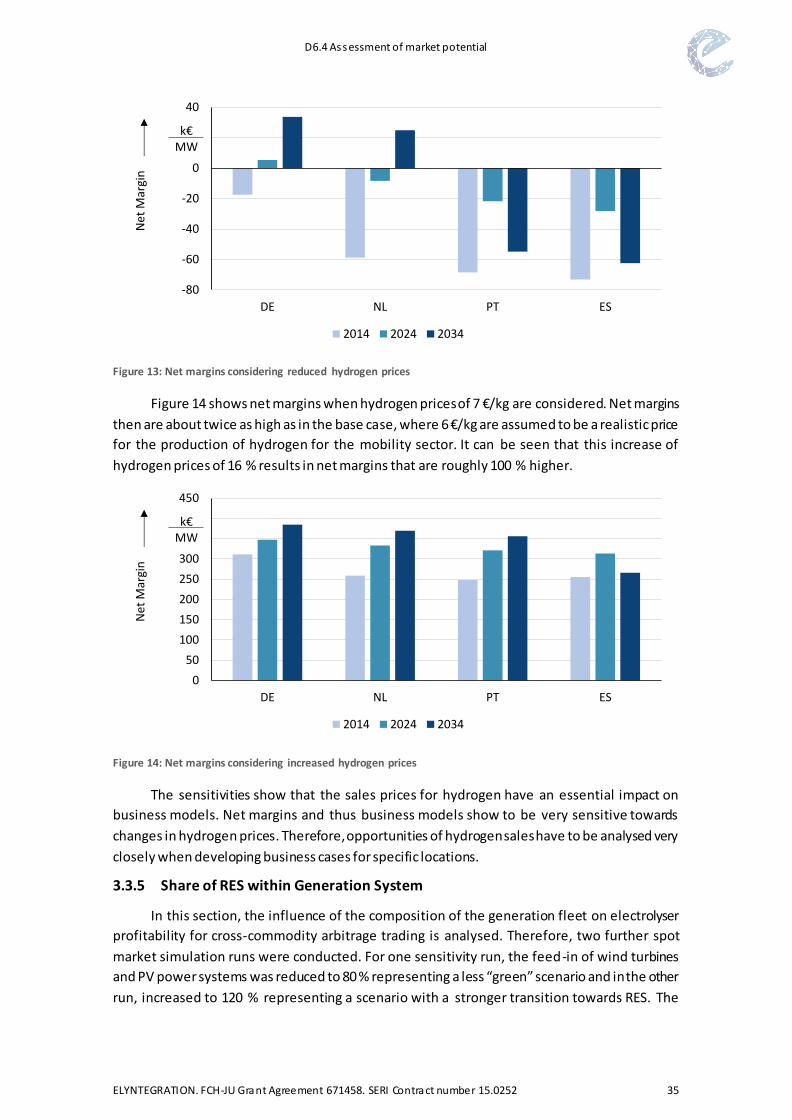
D6.4 Assessment of market potential
ELYNTEGRATION. FCH-JU Grant Agreement 671458. SERI Contract number 15.0252 35
Figure 13: Net margins considering reduced hydrogen prices
Figure 14 shows net margins when hydrogen prices of 7 €/kg are considered. Net margins
then are about twice as high as in the base case, where 6 €/kg are assumed to be a realistic price
for the production of hydrogen for the mobility sector. It can be seen that this increase of
hydrogen prices of 16 % results in net margins that are roughly 100 % higher.
Figure 14: Net margins considering increased hydrogen prices
The sensitivities show that the sales prices for hydrogen have an essential impact on
business models. Net margins and thus business models show to be very sensitive towards
changes in hydrogen prices. Therefore, opportunities of hydrogen sales have to be analysed very
closely when developing business cases for specific locations.
3.3.5 Share of RES within Generation System
In this section, the influence of the composition of the generation fleet on electrolyser
profitability for cross-commodity arbitrage trading is analysed. Therefore, two further spot
market simulation runs were conducted. For one sensitivity run, the feed-in of wind turbines
and PV power systems was reduced to 80 % representing a less “green” scenario and in the other
run, increased to 120 % representing a scenario with a stronger transition towards RES. The
-80
-60
-40
-20
0
20
40
DE NL PT ES
Net
Mar
gin
2014 2024 2034
k€MW
0
50
100
150
200
250
300
350
400
450
DE NL PT ES
Net
Mar
gin
2014 2024 2034
k€MW
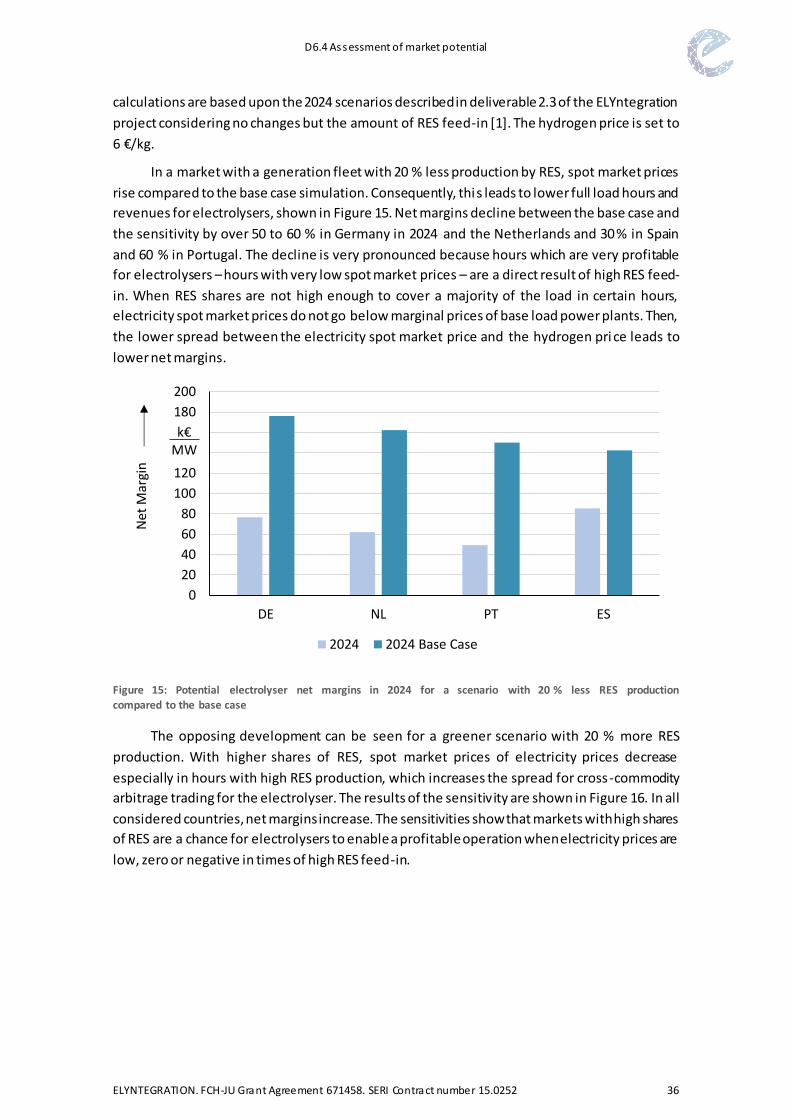
D6.4 Assessment of market potential
ELYNTEGRATION. FCH-JU Grant Agreement 671458. SERI Contract number 15.0252 36
calculations are based upon the 2024 scenarios described in deliverable 2.3 of the ELYntegration
project considering no changes but the amount of RES feed-in [1]. The hydrogen price is set to
6 €/kg.
In a market with a generation fleet with 20 % less production by RES, spot market prices
rise compared to the base case simulation. Consequently, this leads to lower full load hours and
revenues for electrolysers, shown in Figure 15. Net margins decline between the base case and
the sensitivity by over 50 to 60 % in Germany in 2024 and the Netherlands and 30 % in Spain
and 60 % in Portugal. The decline is very pronounced because hours which are very profitable
for electrolysers – hours with very low spot market prices – are a direct result of high RES feed-
in. When RES shares are not high enough to cover a majority of the load in certain hours,
electricity spot market prices do not go below marginal prices of base load power plants. Then,
the lower spread between the electricity spot market price and the hydrogen pri ce leads to
lower net margins.
Figure 15: Potential electrolyser net margins in 2024 for a scenario with 20 % less RES production
compared to the base case
The opposing development can be seen for a greener scenario with 20 % more RES
production. With higher shares of RES, spot market prices of electricity prices decrease
especially in hours with high RES production, which increases the spread for cross-commodity
arbitrage trading for the electrolyser. The results of the sensitivity are shown in Figure 16. In all
considered countries, net margins increase. The sensitivities show that markets with high shares
of RES are a chance for electrolysers to enable a profitable operation when electricity prices are
low, zero or negative in times of high RES feed-in.
0
20
40
60
80
100
120
140
160
180
200
DE NL PT ES
Net
Mar
gin
2024 2024 Base Case
k€MW
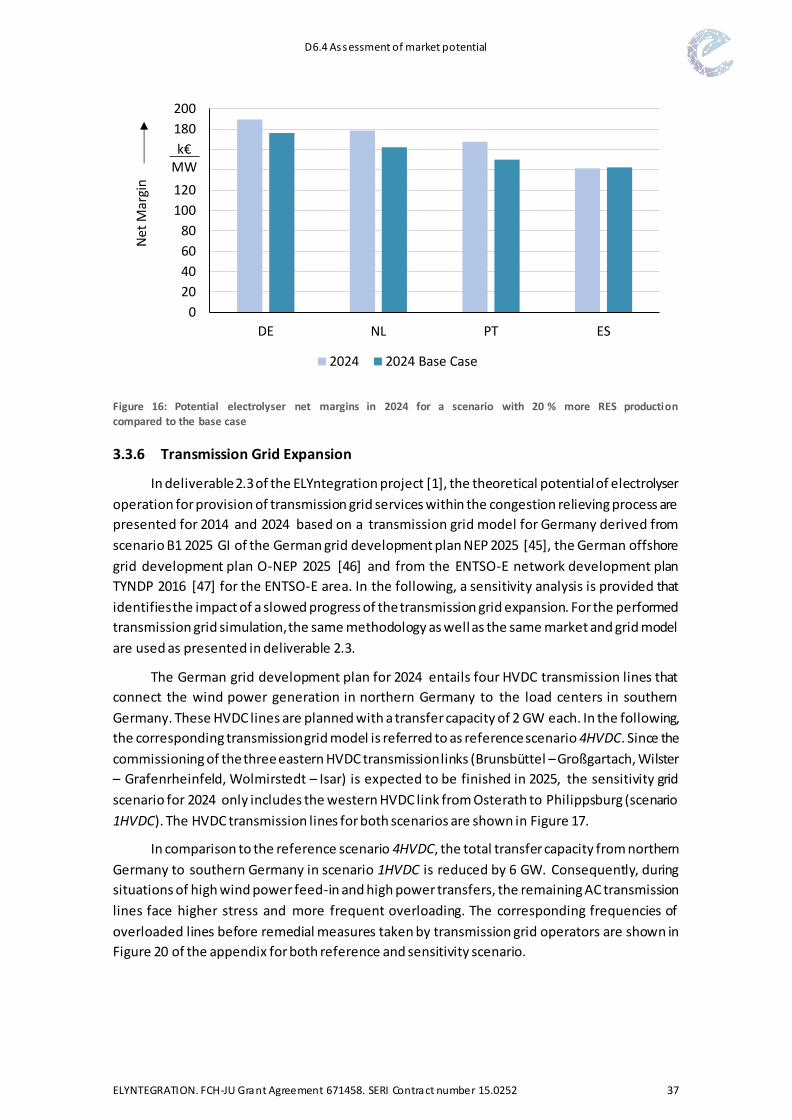
D6.4 Assessment of market potential
ELYNTEGRATION. FCH-JU Grant Agreement 671458. SERI Contract number 15.0252 37
Figure 16: Potential electrolyser net margins in 2024 for a scenario with 20 % more RES production compared to the base case
3.3.6 Transmission Grid Expansion
In deliverable 2.3 of the ELYntegration project [1], the theoretical potential of electrolyser
operation for provision of transmission grid services within the congestion relieving process are
presented for 2014 and 2024 based on a transmission grid model for Germany derived from
scenario B1 2025 GI of the German grid development plan NEP 2025 [45], the German offshore
grid development plan O-NEP 2025 [46] and from the ENTSO-E network development plan
TYNDP 2016 [47] for the ENTSO-E area. In the following, a sensitivity analysis is provided that
identifies the impact of a slowed progress of the transmission grid expansion. For the performed
transmission grid simulation, the same methodology as well as the same market and grid model
are used as presented in deliverable 2.3.
The German grid development plan for 2024 entails four HVDC transmission lines that
connect the wind power generation in northern Germany to the load centers in southern
Germany. These HVDC lines are planned with a transfer capacity of 2 GW each. In the following,
the corresponding transmission grid model is referred to as reference scenario 4HVDC. Since the
commissioning of the three eastern HVDC transmission links (Brunsbüttel – Großgartach, Wilster
– Grafenrheinfeld, Wolmirstedt – Isar) is expected to be finished in 2025, the sensitivity grid
scenario for 2024 only includes the western HVDC link from Osterath to Philippsburg (scenario
1HVDC). The HVDC transmission lines for both scenarios are shown in Figure 17.
In comparison to the reference scenario 4HVDC, the total transfer capacity from northern
Germany to southern Germany in scenario 1HVDC is reduced by 6 GW. Consequently, during
situations of high wind power feed-in and high power transfers, the remaining AC transmission
lines face higher stress and more frequent overloading. The corresponding frequencies of
overloaded lines before remedial measures taken by transmission grid operators are shown in
Figure 20 of the appendix for both reference and sensitivity scenario.
0
20
40
60
80
100
120
140
160
180
200
DE NL PT ES
Net
Mar
gin
2024 2024 Base Case
k€MW
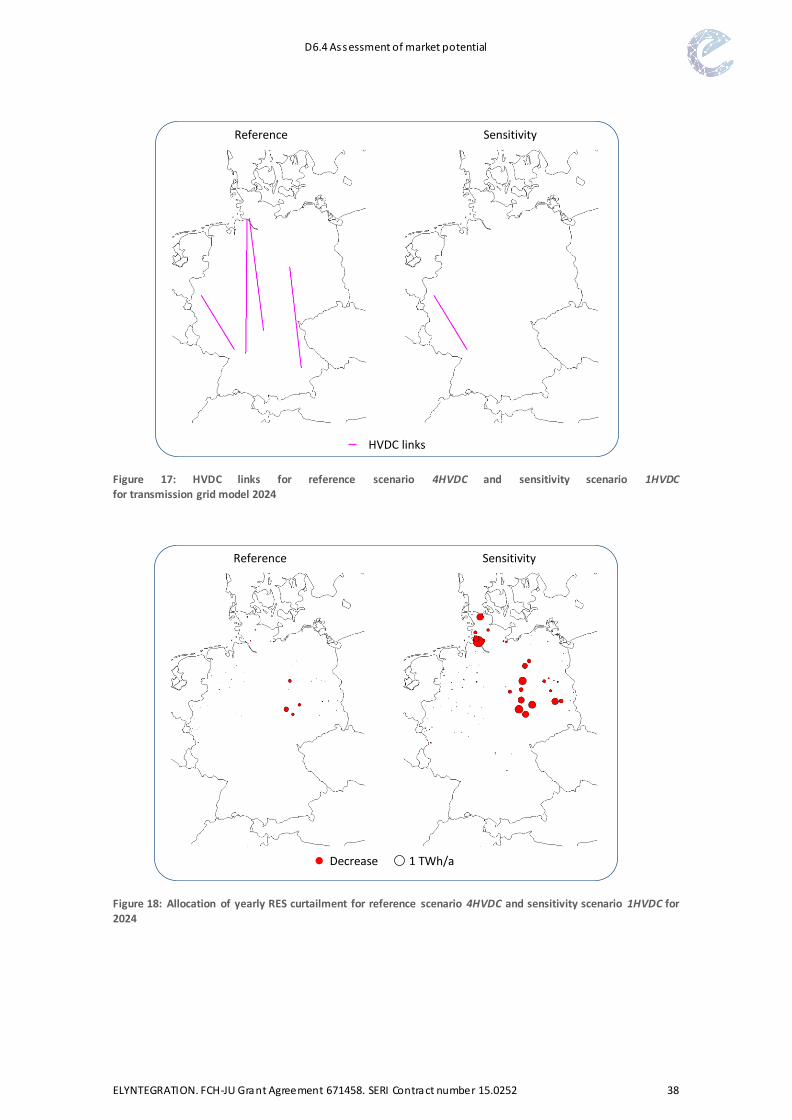
D6.4 Assessment of market potential
ELYNTEGRATION. FCH-JU Grant Agreement 671458. SERI Contract number 15.0252 38
Figure 17: HVDC links for reference scenario 4HVDC and sensitivity scenario 1HVDC for transmission grid model 2024
Figure 18: Allocation of yearly RES curtailment for reference scenario 4HVDC and sensitivity scenario 1HVDC for
2024
SensitivityReference
HVDC links
Decrease 1 TWh/a
SensitivityReference
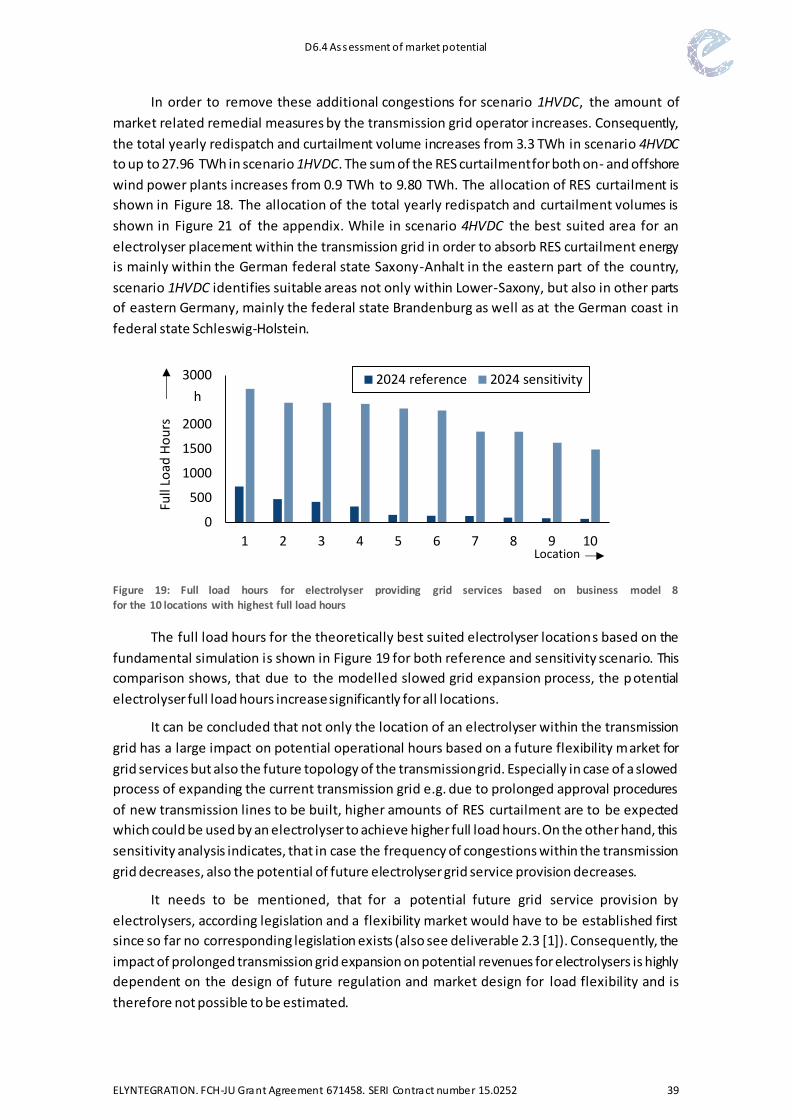
D6.4 Assessment of market potential
ELYNTEGRATION. FCH-JU Grant Agreement 671458. SERI Contract number 15.0252 39
In order to remove these additional congestions for scenario 1HVDC, the amount of
market related remedial measures by the transmission grid operator increases. Consequently,
the total yearly redispatch and curtailment volume increases from 3.3 TWh in scenario 4HVDC
to up to 27.96 TWh in scenario 1HVDC. The sum of the RES curtailment for both on- and offshore
wind power plants increases from 0.9 TWh to 9.80 TWh. The allocation of RES curtailment is
shown in Figure 18. The allocation of the total yearly redispatch and curtailment volumes is
shown in Figure 21 of the appendix. While in scenario 4HVDC the best suited area for an
electrolyser placement within the transmission grid in order to absorb RES curtailment energy
is mainly within the German federal state Saxony-Anhalt in the eastern part of the country,
scenario 1HVDC identifies suitable areas not only within Lower-Saxony, but also in other parts
of eastern Germany, mainly the federal state Brandenburg as well as at the German coast in
federal state Schleswig-Holstein.
Figure 19: Full load hours for electrolyser providing grid services based on business model 8 for the 10 locations with highest full load hours
The full load hours for the theoretically best suited electrolyser locations based on the
fundamental simulation is shown in Figure 19 for both reference and sensitivity scenario. This
comparison shows, that due to the modelled slowed grid expansion process, the p otential
electrolyser full load hours increase significantly for all locations.
It can be concluded that not only the location of an electrolyser within the transmission
grid has a large impact on potential operational hours based on a future flexibility market for
grid services but also the future topology of the transmission grid. Especially in case of a slowed
process of expanding the current transmission grid e.g. due to prolonged approval procedures
of new transmission lines to be built, higher amounts of RES curtailment are to be expected
which could be used by an electrolyser to achieve higher full load hours. On the other hand, this
sensitivity analysis indicates, that in case the frequency of congestions within the transmission
grid decreases, also the potential of future electrolyser grid service provision decreases.
It needs to be mentioned, that for a potential future grid service provision by
electrolysers, according legislation and a flexibility market would have to be established first
since so far no corresponding legislation exists (also see deliverable 2.3 [1]). Consequently, the
impact of prolonged transmission grid expansion on potential revenues for electrolysers is highly
dependent on the design of future regulation and market design for load flexibility and is
therefore not possible to be estimated.
0
500
1000
1500
2000
2500
3000
1 2 3 4 5 6 7 8 9 10
2024 reference 2024 sensitivityh
Full
Load
Ho
urs
Location
D6.4 Assessment of market potential
ELYNTEGRATION. FCH-JU Grant Agreement 671458. SERI Contract number 15.0252 40
4 CONCLUSIONS
Based on the business models of electrolysers developed and evaluated in deliverable 2.3
of the ELYntegration project, within this study a market potential assessment for these business
models was conducted. In terms of the sales of electrolyser hydrogen, most promising target
sectors for hydrogen demand were identified. It could be shown, that especially within the
European industry sectors large amounts of hydrogen demand occur. Within the industry sector,
ammonia production facilities, crude refineries and methanol production facilities show the
largest net demand of hydrogen. Consequently, these sectors show the largest potential for
electrolyser and green hydrogen applications within the industry sector. The second major
promising market for the sales of hydrogen is the mobility sector by using hydrogen as a fuel. So
far, hydrogen mobility has not yet seen its breakthrough due to higher investment costs of these
vehicles as well as the lack of a substantial hydrogen refuelling infrastructure. Within Europe
however, there are multiple initiatives for the promotion of hydrogen mobility and a significant
increase of hydrogen mobility is expected in future. Due to lower hydrogen prices, the use of
hydrogen within the natural gas system represents lower business potential for electrolyser
applications than industry and mobility sector. Consequently, in terms of hydrogen demand,
countries that show large amount of potential industry customers, especially within ammonia
production and crude refining industry are most promising. These include Germany, the
Netherlands, France, the UK and Poland. Countries for which a significant increase of hydrogen
mobility is estimated in future, especially show highly promising business potential not only
because of the additional hydrogen demand but also because for these applications the
hydrogen price is expected to be significantly higher than for industry applications.
Within this study main drivers and risks were identified that impact the market potential
of electrolyser business models. Besides the development of the hydrogen market and potential
future hydrogen prices itself, these drivers and risks include
the end-user price of electricity,
the development of the power generation system in Europe,
the price of emission certificates,
policies towards energy storage systems,
the development of flexibility provision by alternative new technologies for
electrolyser business models directed towards provision of control reserve and
the design of future flexibility markets.
In order to quantify the impact of the identified main drivers and risks for future
electrolyser applications, sensitivity analyses were conducted. It could be shown, that the
consideration of end-user prices for electricity for electrolyser business models incorporating
taxes, levies and network charges has a significant impact on the net margins of electrolyser
business models. It can be concluded, that especially those countries that not only show low
spot market prices for electricity but also show low additional end-user charges for electricity
show promising market potential for future electrolyser applications. Additionally, potential
exemptions from end-user charges for electricity favour electrolyser market potential.
The sensitivity analysis also shows that the sales price for hydrogen has an essential
impact on the business models for electrolysers. Already a small decrease of hydrogen sales
D6.4 Assessment of market potential
ELYNTEGRATION. FCH-JU Grant Agreement 671458. SERI Contract number 15.0252 41
prices results in a significant decrease of net margins. Consequently, the market potential of
electrolyser is especially high in case the generated hydrogen is sold to hydrogen customers
in the mobility sector.
The results of this study indicate that the composition of the future generation fleet has
a significant impact on potential net margins for electrolyser market potential as well. With
higher shares of RES, spot market prices of electricity decrease resulting in an increase of the
spread for cross-commodity arbitrage trading for the electrolyser. Consequently, a reduction of
RES production within the European generation system leads to a decline in electrolyser net
margins. It can be concluded, that countries for which future scenarios are dominated by RES
have promising market potential for electrolysers.
In terms of the provision of transmission grid services, the sensitivity analysis shows, that
not only the location of an electrolyser within the transmission grid has a large impact on
potential full load hours but also the future topology of the transmission grid. For a delayed grid
expansion, higher amounts of RES curtailment can be expected leading to higher full load hours
for the corresponding electrolyser business model. It can be concluded, that countries for which
high amounts of RES curtailment is expected in future have a high market potential in terms
of grid service provision by electrolyser.
D6.4 Assessment of market potential
ELYNTEGRATION. FCH-JU Grant Agreement 671458. SERI Contract number 15.0252 42
REFERENCES
[1] P. Larscheid and L. Lück, ELYntegration Deliverable 2.3 - Description of new
potential business models, ELYntegration, 2017.
[2] D. Fraile, J.-C. Lanoix, P. Maio, A. Rangel and A. Torres, CertifHy - Overview of the
market segmentation for hydrogen across potential customer groups, based on
key application areas, CertifHy Project, 2015.
[3] The Linde Group, “Production and Utilization of Green Hydrogen,” 2013.
[4] Centre for European Policiy Studies, Final report for a study on composition and
drivers of energy prices and costs in energy intensive industries: the case of the
chemical industry - ammonia, Brussels: Centre for European Studies, 2014.
[5] M. Stork and C. Bourgault, Fertilizers and Climate Change, Ecofys, 2015.
[6] European Commission, Energy infrastructure priorities for 2020 and beyond - A
Blueprint for an integrated European energy network, Brussels, 2010.
[7] W. Vanhoudt, F. Barth, J.-C. Lanoix, J. Neave, P. R. Schmidt, W. Weindorf, T. Raksha,
J. Zerhusen and J. Michalski, Power-to-gas - Short term and long term
opportunities to leverage synergies between the electricity and transport sectors
through power-to-hydrogen, Brussels/Munich: Hinicio, Ludwig-Bölkow-
Systemtechnik, 2016.
[8] IEA, Technology Roadmap Energy storage, Paris: International Energy Agency,
2014.
[9] Hydrogen for refineries is increasingly provided by industrial suppliers, “EIA.gov,”
20 01 2016. [Online]. Available:
http://www.eia.gov/todayinenergy/detail.php?id=24612#. [Accessed 2017].
[10] eni, “Green refinery: reinventing petroleum refineries,”
https://www.eni.com/docs/en_IT/enicom/publications-
archive/company/operations-strategies/refining-marketing/eni_Green-
Refinery_esecutivo.pdf, 2014.
[11] Methanol Institute, [En línea]. Available:
http://www.methanol.org/feedstocksupply/. [Último acceso: 20 1 2017].
D6.4 Assessment of market potential
ELYNTEGRATION. FCH-JU Grant Agreement 671458. SERI Contract number 15.0252 43
[12] JRC science for policy report, “Techno-economic and environmental evaluation of
CO2 utilisation for fuel production,” 2016.
[13] bse engineering, “Power to methanol in German and European context. e-
metthanol as a carbon product,” in Methanol policy forum, Brussels, 2015.
[14] MITSUI CHEMICALS, [Online]. Available:
http://www.mitsuichem.com/csr/report/pdf/csr2014web_e.pdf.
[15] MEFCO2, “Synthesis of methanol from captured carbon dioxide using surplus
electricity,” [Online]. Available: http://www.mefco2.eu/.
[16] E. &. Y. GmbH, Ludwig-Bölkow-Systemtechnik, S. Deutschland, T. S. Rail, B. B. Held
and IFOK, Ergebnisbericht zur Studie Wasserstoff-Infrastruktur für die Schiene,
2015.
[17] T. Brinkmann, F. Schorcht, S. Roudier, L. Delgado Sanches and G. Giner Santonja,
Best Available Techniques (BAT) Reference Document for the Production of Chlor-
alkali, 2014.
[18] McKinsey, A portfolio of power-trains for Europe: a fact-based analysis, 2010.
[19] E. E. R.-A. Cambridge Econometrics, “Fuelling Euorpe´s Future,” 2013.
[20] European Parliament, “Directive 2008/92/EC of the European Parliament and of
the Council of 22 October 2008 concerning a Community procedure to improve
the transparency of gas and electricity prices charged to industrial end-users,”
Strasbourg, 2008.
[21] M. Amsterdam Round Tables, “Evolution Electric vehicles in Europe: gearing up for
a new phase?,” 2014.
[22] I. -. T. I. C. o. C. Transportation, “European Vehicles Market Statistics,” 2013.
[23] T. -. M. Datasheet, “www.toyota-europe.com,” [Online]. Available: www.toyota-
europe.com. [Accessed March 2017].
[24] Mercedes-Benz, “Mercedes-Benz F-Cell DataSheet”.
[25] Hyundai, “Hyundai ix35 DataSheet,” 2017.
[26] Honda, “http://www.honda.es/,” [Online]. [Accessed March 2017].
D6.4 Assessment of market potential
ELYNTEGRATION. FCH-JU Grant Agreement 671458. SERI Contract number 15.0252 44
[27] NOW - National Organisation Hydrogen and Fuel Cell Technology, Annual Report,
2013.
[28] UK H2 Mobility, Phase 1 Results, 2013.
[29] Mobilité Hydrogène France, H2 Mobilité France - Study for a Fuel Cell Electric
Vehicle national deployment plan, 2014.
[30] K. Moirangthem, Alternative Fuels for Marine and Inland Waterways, European
Commission JRC Technical Reports, 2016.
[31] Royal Academy of Engineering, Future Ship Powering Options - Exploring
alternative methods of ship propulsion, London, 2013.
[32] S. Schiebahn, T. Grube, M. Robinius, V. Tietze, B. Kumar and D. Stolten, “Power to
gas: Technological overview, systems analysis and economic assessment for a case
study in Germany,” International Journal of Hydrogen Energy, vol. 40, 2015.
[33] C. Baumann, R. Schuster and A. Moser, Economic Potential of Power-to-Gas Energy
Storages, 10th International Converence on the European Energy Market (EEM):
IEEE, 2013.
[34] Hinicio y Tractebel, «Study on Early Business Cases for H2 in Energy Storage and
More Broadly Power to H2 Applications,» Fuel Cells and Hydrogen Joint
Undertaking (FCH 2 JU), Brussels, Belgium, 2017.
[35] K. Münch, P. Larscheid, L. Lück, J. Simón y A. Arnedo, «ELYntegration Deliverable
2.1 - Assessment of the regulatory framework and end-user/customer
requirements,» ELYntegration, 2016.
[36] P. L. Spath and M. K. Mann, Life Cycle Assessment of Hydrogen Production via
Natural Gas Steam Reforming, Colorado: National Renewable Energy Laboratory,
2001.
[37] European Commission, Guidelines on State aid for environmental protection and
energy 2014-2020 (2014/C 200/01), Brussels, 2014.
[38] European Commission, DIRECTIVE 2009/28/EC OF THE EUROPEAN PARLIAMENT
AND OF THE COUNCIL of 23 April 2009 on the promotion of the use of energy from
renewable sources and amending and subsequently repealing Directives
2001/77/EC and 2003/30/EC, Brussels, 2009.
[39] M. Sterner, F. Eckert, M. Thema and F. Bauer, Der positive Beitrag dezentraler
Batteriespeicher für eine stabile Stromversorgung, Regensburg, Berlin, Hannover:
D6.4 Assessment of market potential
ELYNTEGRATION. FCH-JU Grant Agreement 671458. SERI Contract number 15.0252 45
Forschungsstelle Energienetze und Energiespeicher (FENES) OTH Regensburg,
Kurzstudie im Auftrag von BEE e.V. und Hannover Messe, 2015.
[40] M. Jansen, C. Richts, N. Gerhardt, T. Lenck and M.-L. Heddrich, Strommarkt-
Flexibilisierung: Hemmnisse und Lösungskonzepte, Bochum: BEE e.V., 2015.
[41] Fraunhofer IWES, Stiftung Umwerltenergierecht, Fraunhofer IFAM, Power-to-Heat
zur Integration von ansonsten abgeregeltem Strom aus Erneuerbaren Energien,
Kasse, Würzburg, Bremen: Agora Energiewende, 2014.
[42] Deutsche Energie-Agentur (dena), dena-Studie Systemdienstleistungen 2030.
Sicherheit und Zuverlässigkeit einer Stromversorgung mit hohem Anteil
erneuerbarer Energien, Berlin, 2014.
[43] B. Biegel, L. H. Hansen, P. Andersen and J. Stoustrup, Primary Control by ON/OFF
Demand-Side Devices, Transactions on smart grid: IEEE, 2013.
[44] E4tech and Element Energy, Development of Water Electrolysis in the European
Union, Lausanne, Campridge: Fuel Cells and Hydrogen Joint Undertaking (FCHJU),
2014.
[45] 50Hertz, Amprion, TenneT, TransnetBW, Netzentwicklungsplan Strom 2025,
Version 2015, 2016.
[46] 50Hertz, Amprion, TenneT, TransnetBW, Offshore-Netzentwicklungsplan 2025,
Version 2015, 2016.
[47] ENTSO-E, Ten-Year Network Development Plan 2016, Brussels, 2016.
[48] AIR PRODUCTS, “Atmosphere solutions for metal processing”.
[49] U.S refinery and blender net input of hydrogen, “EAI.gov,” [Online]. Available:
http://www.eia.gov/dnav/pet/hist/LeafHandler.ashx?n=pet&s=m_epoooh_yir_n
us_mbbl&f=a.
[50] Bundesrepublik Deutschland, Energiewirtschaftsgesetz (Gesetz über die
Elektrizitäts- und Gasversorgung), Bundesgesetzblatt, 2005 (last modification in
2017).
[51] Statistical Office of the European Union, “Eurostat,” [Online]. Available:
http://ec.europa.eu/eurostat/data/database. [Accessed 14 01 2016].
[52] Bundesnetzagentur (BNetzA), “Genehmigung des Szenariorahmens für die
Entwicklungsplanung und Offshore-Netzentwicklungsplanung 2025,” Berlin, 2014.
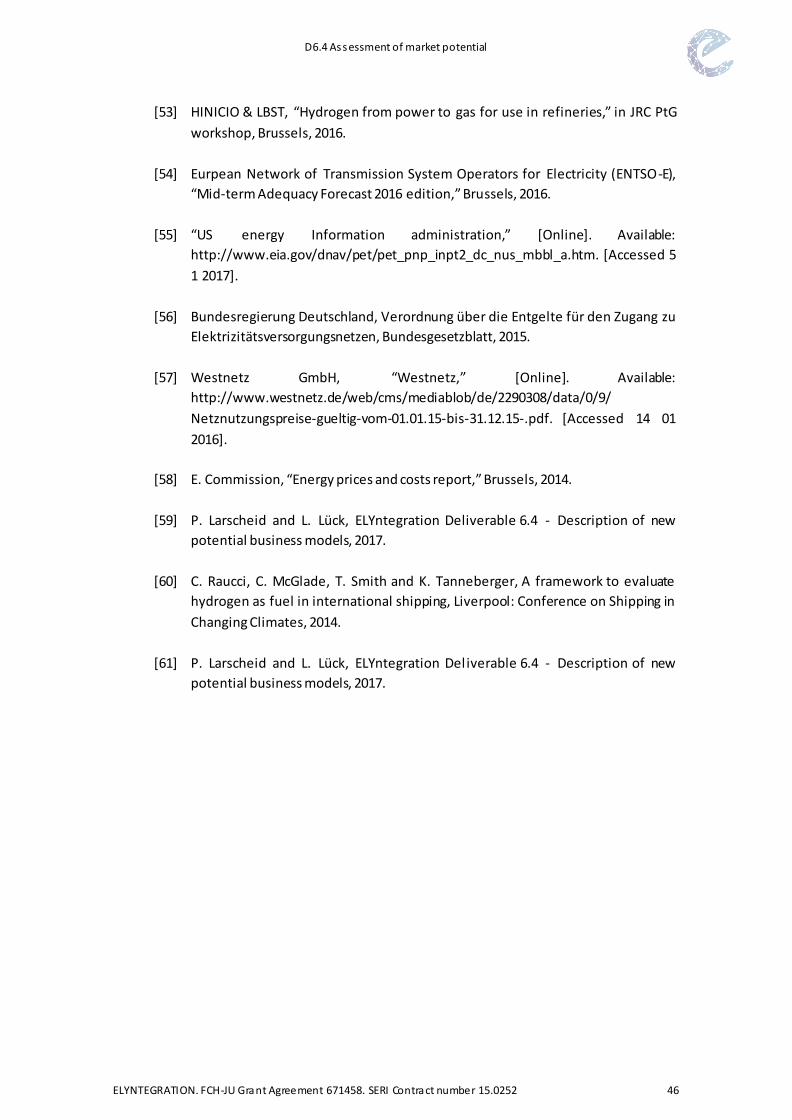
D6.4 Assessment of market potential
ELYNTEGRATION. FCH-JU Grant Agreement 671458. SERI Contract number 15.0252 46
[53] HINICIO & LBST, “Hydrogen from power to gas for use in refineries,” in JRC PtG
workshop, Brussels, 2016.
[54] Eurpean Network of Transmission System Operators for Electricity (ENTSO-E),
“Mid-term Adequacy Forecast 2016 edition,” Brussels, 2016.
[55] “US energy Information administration,” [Online]. Available:
http://www.eia.gov/dnav/pet/pet_pnp_inpt2_dc_nus_mbbl_a.htm. [Accessed 5
1 2017].
[56] Bundesregierung Deutschland, Verordnung über die Entgelte für den Zugang zu
Elektrizitätsversorgungsnetzen, Bundesgesetzblatt, 2015.
[57] Westnetz GmbH, “Westnetz,” [Online]. Available:
http://www.westnetz.de/web/cms/mediablob/de/2290308/data/0/9/
Netznutzungspreise-gueltig-vom-01.01.15-bis-31.12.15-.pdf. [Accessed 14 01
2016].
[58] E. Commission, “Energy prices and costs report,” Brussels, 2014.
[59] P. Larscheid and L. Lück, ELYntegration Deliverable 6.4 - Description of new
potential business models, 2017.
[60] C. Raucci, C. McGlade, T. Smith and K. Tanneberger, A framework to evaluate
hydrogen as fuel in international shipping, Liverpool: Conference on Shipping in
Changing Climates, 2014.
[61] P. Larscheid and L. Lück, ELYntegration Deliverable 6.4 - Description of new
potential business models, 2017.
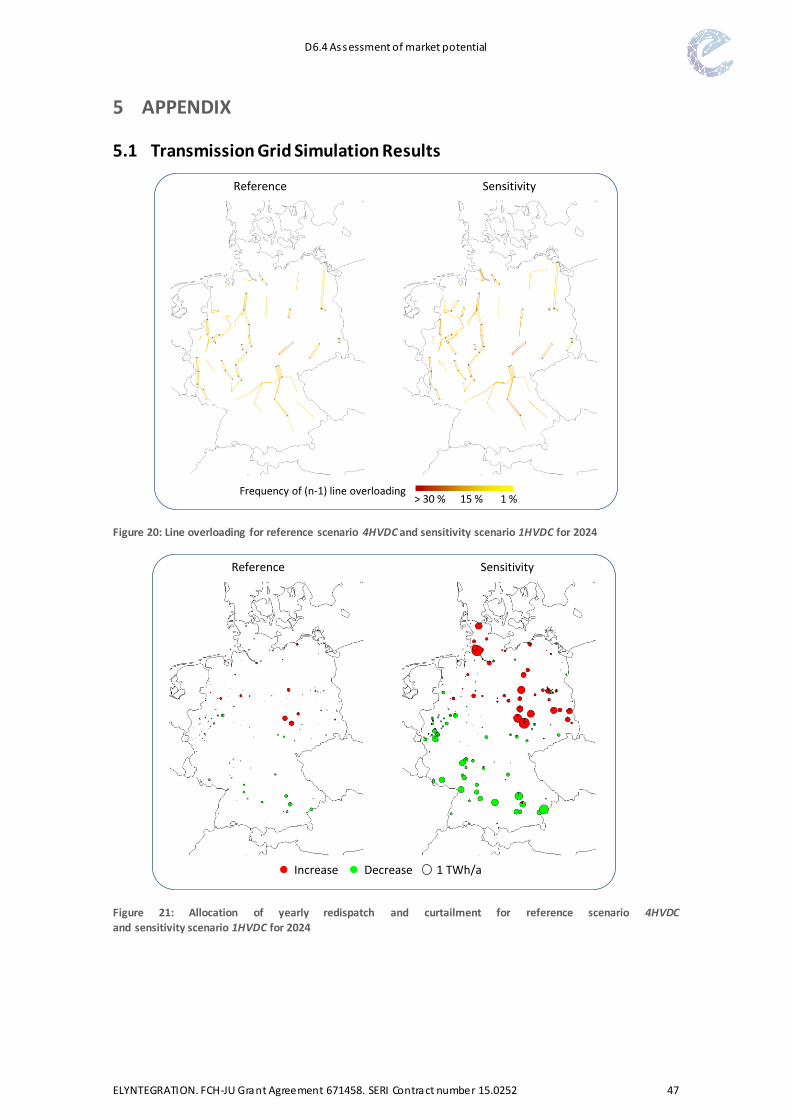
D6.4 Assessment of market potential
ELYNTEGRATION. FCH-JU Grant Agreement 671458. SERI Contract number 15.0252 47
5 APPENDIX
5.1 Transmission Grid Simulation Results
Figure 20: Line overloading for reference scenario 4HVDC and sensitivity scenario 1HVDC for 2024
Figure 21: Allocation of yearly redispatch and curtailment for reference scenario 4HVDC
and sensitivity scenario 1HVDC for 2024
1 %15 %> 30 %Frequency of (n-1) line overloading
SensitivityReference
SensitivityReference
Increase Decrease 1 TWh/a
Related Documents