This project has received funding from the European Union’s Horizon 2020 research and innovation programme under grant agreement No 723650. D4.6–Initial Multi-scale Model based Development Environment Deliverable ID D4.6 Deliverable Title Initial Multi-scale Model based Development Environment Work Package WP4 – Cross-sectorial Data Lab Dissemination Level PUBLIC Version 1.0 Date 30/11/2017 Status Final Lead Editor CAP Main Contributors Jean Gaschler (CAP) Peter Bednar (TUK) Martin Sarnovsky (TUK) ShreekanthaDevasya (FIT) Rosaria Rossini (ISMB) Published by the MONSOON Consortium

Welcome message from author
This document is posted to help you gain knowledge. Please leave a comment to let me know what you think about it! Share it to your friends and learn new things together.
Transcript
This project has received funding from the European Union’s Horizon 2020 research and innovation
programme under grant agreement No 723650.
D4.6–Initial Multi-scale Model based Development Environment
Deliverable ID D4.6
Deliverable Title Initial Multi-scale Model based Development Environment
Work Package WP4 – Cross-sectorial Data Lab
Dissemination Level PUBLIC
Version 1.0
Date 30/11/2017
Status Final
Lead Editor CAP
Main Contributors Jean Gaschler (CAP)
Peter Bednar (TUK)
Martin Sarnovsky (TUK)
ShreekanthaDevasya (FIT)
Rosaria Rossini (ISMB)
Published by the MONSOON Consortium
Model based control framework for Site-wide Optimization of data-intensive processes
Deliverable nr.
Deliverable Title
Version
D4.6
Initial Multi-scale Model based Development Environment
1.030/11/2017
Page 2 of 21
Document History
Version Date Author(s) Description
0.1 2017/08/22 Jean Gaschler (CAP) First Draft with TOC
0.2 2017/10/24 Martin Sarnovsky (TUK) Architecture of the development environment
chapter, input to Model generation tools section
0.3 2017/10/30 ShreekanthaDevasya (FIT) PF packaging and relation to Runtime Container
0.4 2017/10/30 Jean Gaschler (CAP) Merge of versions 0.2 and 0.3 and TUK-ISMB
contribution
0.6 2017/11/27 Jean Gaschler (CAP) Merge of version 0.5 from TUK
1.0 2017/11/30 Jean Gaschler (CAP) Final version
Internal Review History
Version Review Date Reviewed by Summary of comments
0.6 27-11-2017 Marco Dias (GLN) Accepted with minor comments
0.6 27-11-2017 Ameline Bernard (AP) Accepted with minor comments

Model based control framework for Site-wide Optimization of data-intensive processes
Deliverable nr.
Deliverable Title
Version
D4.6
Initial Multi-scale Model based Development Environment
1.030/11/2017
Page 3 of 21
Table of Contents
1 Introduction ........................................................................................................................................................................................ 4
2 Architecture of the development environment .................................................................................................................... 5
2.1 Zeppelin architecture ............................................................................................................................................................ 6
3 Models generation tools ............................................................................................................................................................. 10
3.1 Context and objectives ...................................................................................................................................................... 10
4 Predictive function packaging and relation with the Runtime Container ................................................................ 13
4.1 Packaging ................................................................................................................................................................................ 13
4.2 Relations with Runtime Container ................................................................................................................................. 14
5 Simulation and Validation tools ............................................................................................................................................... 15
5.1 Context and objectives ...................................................................................................................................................... 15
5.2 Validation methodology.................................................................................................................................................... 15
5.3 MONSOON Simulation Framework .............................................................................................................................. 17
6 Conclusion ......................................................................................................................................................................................... 20
Acronyms ..................................................................................................................................................................................................... 21
List of Figures ............................................................................................................................................................................................. 21
List of Tables ............................................................................................................................................................................................... 21

Model based control framework for Site-wide Optimization of data-intensive processes
Deliverable nr.
Deliverable Title
Version
D4.6
Initial Multi-scale Model based Development Environment
1.030/11/2017
Page 4 of 21
1 Introduction
In the context of MONSOON work package structure, Task 4.3 (Multi-scale Model based Development
Environment) deals with the tools and interfaces that will cover the whole life cycle of the planning,
implementation and deployment of data analytics functions developed using the algorithms provided by
WP5 (Site-wide Scheduling and Optimization Toolkit) into the plant production supporting
simulation/co-simulation features.
The described environment integrates:
- Tools for creation of the site models specified using the semantic framework developed in Task 4.1
(Semantic framework for dynamic multi-scale industry modelling), wizard-like interfaces, which will
guide users in identification of which functional blocks can be optimized by the data analytics
methods, identify input/output data and data fusion and pre-processing steps required for statistical
modelling, validation and deployment,
- Simulation tools for leverage semantic framework developed in Task 4.1 in order to simulate how the
overall production process is influenced when some functional block is replaced or extended with the
predictive function, and which integration and configuration steps are required in order to deploy
function into the operation conditions,
- Validation tools for support quantitative evaluation of the predictive functions on the validation
datasets using the various metrics (e.g. approximation/prediction error, rate of false positive alerts,
etc.) and the methods for sensitivity analysis how the function outputs are influenced by the changes
in the inputs and how robust is the prediction when the input data are influenced by the noise or
during monitoring failures,
- Planning and scheduling methods for overall site optimization of specified KPIs based on the
constraint satisfaction algorithms.
Besides the planning, validation and deployment, the toolkit will also support training of human operators to
changes in the production processes after the site optimization. Besides the training on operational scenarios
generated from the historical cases collected in the Site data analytics knowledge base, training module will
also support simulation of “what-if” scenarios allowing to test reaction to unexpected situations or new
optimized procedures. All interfaces and tools will be integrated with the existing information systems for
control and monitoring.
The development approach in MONSOON is iterative and incremental, including three prototyping cycles
(ramp-up phase, period 1, and period 2). The current document describes the situation for the period 1.

Model based control framework for Site-wide Optimization of data-intensive processes
Deliverable nr.
Deliverable Title
Version
D4.6
Initial Multi-scale Model based Development Environment
1.030/11/2017
Page 5 of 21
2 Architecture of the development environment
Figure 1 describes overall high-level architecture of the model development environment of the Monsoon
platform. The environment is based on the Apache Zeppelin. Data used to build the models are stored in the
Distributed Storage component of the Data Lab platform (Hadoop Distributed File System, HDFS). Apache
Zeppelin then provides web-based model development interface, which enables the data scientists to build
the predictive functions using several supported languages and environments such as Python (and supported
packages) or Apache Spark. Access to the development environment is secured by Apache Knox component
and is available here: https://monsoon.ekf.tuke.sk:8443/gateway/ui/zeppelin/.
Figure 1 - High-level architecture of the Model development tools
Apache Zeppelin is an open-source web-browser based tool aimed for interactive data analytics, modelling
and visualization. Zeppelin provides web-based UI for the data scientists to write the interactive scripts and is
able to connect to multiple data-processing back-ends plugged into the Zeppelin (such as R, Python, Spark,
etc.). It is especially useful in typical data analytics tasks which are often iterative and interactive and requires
development and running of the analytic code as well as visualization of theoutputs and results. Zeppelin can
be installed, configured and maintained using Apache Ambari.
Zeppelin is a notebook-based tool. Each Notebook consists of notes - one or more paragraphs of code,
which data scientists can define and run in directly in a browser window. Notebooks contains two main
sections – a box used by data scientists to write their code and a box used to display the results. Code then
can be executed using the commands. User can invoke specific interpreter for particular language or
environment by starting a paragraph of code with % symbol following the name of the interpreter, e.g.
%spark.pyspark invokes the Spark environment in python and following code paragraph will be executed in
pyspark interpreter. Notes can be also imported either from a URL, or from a JSON file (also exported to
JSON). The user interface of the Zeppelin notebook is depicted on theFigure 2.

Model based control framework for Site-wide Optimization of data-intensive processes
Deliverable nr.
Deliverable Title
Version
D4.6
Initial Multi-scale Model based Development Environment
1.030/11/2017
Page 6 of 21
Figure 2 - Zeppelin notebook layout
2.1 Zeppelin architecture
Zeppelin architecture (as depicted in Figure 3) in general consists of 3 layers:Zeppelin server
Interpreters
Front-end
Zeppelin server stores the interpreter directories and initializes the interpreters. An interpreter is a plug-in
which enables a language or data-processing back-end to be plugged into the Zeppelin (e.g. to use Python
code in Zeppelin environment, Python interpreter has to be plugged in and invoked). Interpreters enable the
Zeppelin to access the processing engines and data sources. Each interpreter is the Java Virtual Machine
(JVM) process running on the same node as the Zeppelin server and communicates with Zeppelin through
the Thrift1. Thrift is an interface definition language and communication protocol used as RPC framework. It
uses IDL (Interface Definition Language) to define the functions and its parameters and Thrift compiler to
generate corresponding code for any of the supported languages. Thrift also enables Zeppelin to run remote
interpreters running outside Zeppelin’s JVM.
Interpreters can run in three different modes, which specifies how the variables in the code can be accessed
within the notes in notebooks:
shared – one JVM process and one Interpreter Group serves is shared for all notes
scoped – single JVM process, but separate Interpreter Groups for each particular note
isolated – separate processes for each note
1https://thrift.apache.org

Model based control framework for Site-wide Optimization of data-intensive processes
Deliverable nr.
Deliverable Title
Version
D4.6
Initial Multi-scale Model based Development Environment
1.030/11/2017
Page 7 of 21
Figure 3 - Zeppelin architecture
Interpreters can be organized into the Interpreter Groups -the unitsthat are used to start and stop a specific
set of interpreters (e.g. Spark interpreter group can include Spark, pySpark and Spark SQL as well as other
dependencies). Zeppelin also enables to connect to the interpreter deployed on the remote host.
The list of currently available interpreters is listed in Table 1.
Table 1 - List of available Zeppelin interpreters
Alluxio Beam BigQuery Cassandra
ElastiSearch Flink Geode HBase
HDFS Hive Ignite JDBC
Kylin Lens Livy Markdown
Pig Python Postgresql R
Scalding Scio Shell Spark
Zeppelin Front end serves as a web-based interface for the users. Interpreters receive input commands and
data as a raw text from form data. Then it processes the input commands and data by the external back-end.
The response is then formatted using Zeppelin display system and sent back to the Zeppelin engine.
Interpreter response is by default printed as a plain text using Text display system. Zeppelin support
formatting of the output as the HTML and for the tabular data, users can use Table display system and
Model based control framework for Site-wide Optimization of data-intensive processes
Deliverable nr.
Deliverable Title
Version
D4.6
Initial Multi-scale Model based Development Environment
1.030/11/2017
Page 8 of 21
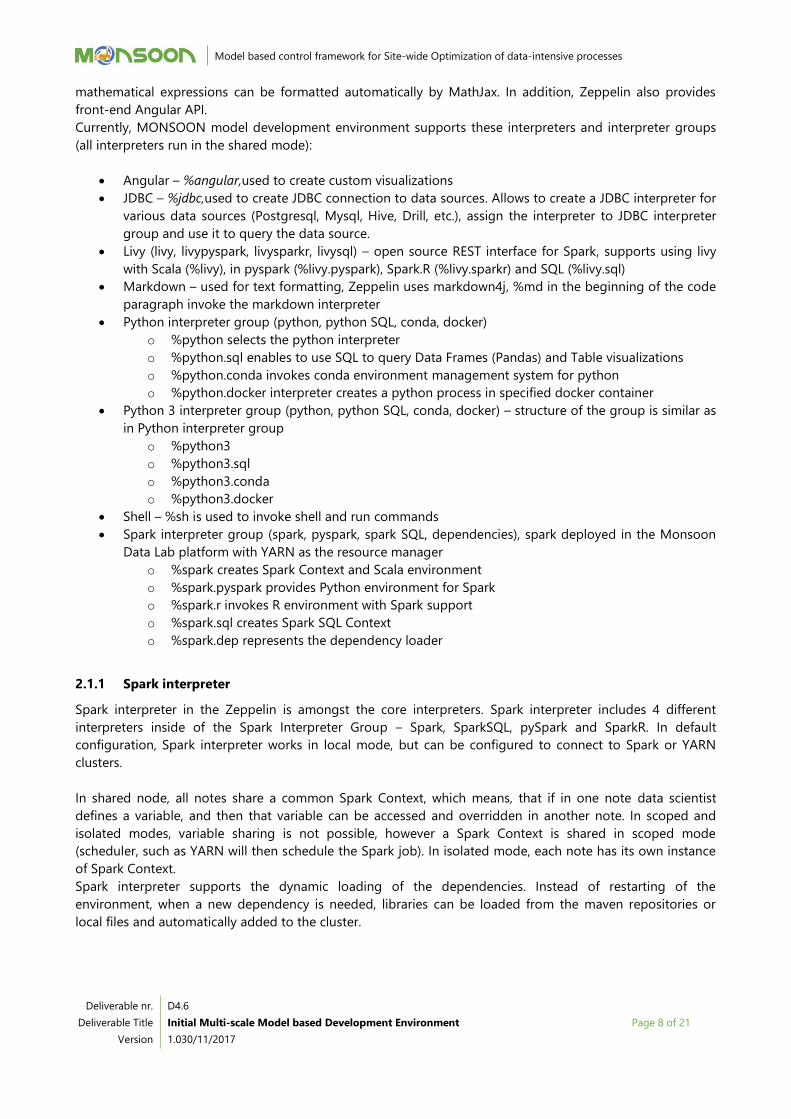
mathematical expressions can be formatted automatically by MathJax. In addition, Zeppelin also provides
front-end Angular API.
Currently, MONSOON model development environment supports these interpreters and interpreter groups
(all interpreters run in the shared mode):
Angular – %angular,used to create custom visualizations
JDBC – %jdbc,used to create JDBC connection to data sources. Allows to create a JDBC interpreter for
various data sources (Postgresql, Mysql, Hive, Drill, etc.), assign the interpreter to JDBC interpreter
group and use it to query the data source.
Livy (livy, livypyspark, livysparkr, livysql) – open source REST interface for Spark, supports using livy
with Scala (%livy), in pyspark (%livy.pyspark), Spark.R (%livy.sparkr) and SQL (%livy.sql)
Markdown – used for text formatting, Zeppelin uses markdown4j, %md in the beginning of the code
paragraph invoke the markdown interpreter
Python interpreter group (python, python SQL, conda, docker)
o %python selects the python interpreter
o %python.sql enables to use SQL to query Data Frames (Pandas) and Table visualizations
o %python.conda invokes conda environment management system for python
o %python.docker interpreter creates a python process in specified docker container
Python 3 interpreter group (python, python SQL, conda, docker) – structure of the group is similar as
in Python interpreter group
o %python3
o %python3.sql
o %python3.conda
o %python3.docker
Shell – %sh is used to invoke shell and run commands
Spark interpreter group (spark, pyspark, spark SQL, dependencies), spark deployed in the Monsoon
Data Lab platform with YARN as the resource manager
o %spark creates Spark Context and Scala environment
o %spark.pyspark provides Python environment for Spark
o %spark.r invokes R environment with Spark support
o %spark.sql creates Spark SQL Context
o %spark.dep represents the dependency loader
2.1.1 Spark interpreter
Spark interpreter in the Zeppelin is amongst the core interpreters. Spark interpreter includes 4 different
interpreters inside of the Spark Interpreter Group – Spark, SparkSQL, pySpark and SparkR. In default
configuration, Spark interpreter works in local mode, but can be configured to connect to Spark or YARN
clusters.
In shared node, all notes share a common Spark Context, which means, that if in one note data scientist
defines a variable, and then that variable can be accessed and overridden in another note. In scoped and
isolated modes, variable sharing is not possible, however a Spark Context is shared in scoped mode
(scheduler, such as YARN will then schedule the Spark job). In isolated mode, each note has its own instance
of Spark Context.
Spark interpreter supports the dynamic loading of the dependencies. Instead of restarting of the
environment, when a new dependency is needed, libraries can be loaded from the maven repositories or
local files and automatically added to the cluster.
Model based control framework for Site-wide Optimization of data-intensive processes
Deliverable nr.
Deliverable Title
Version
D4.6
Initial Multi-scale Model based Development Environment
1.030/11/2017
Page 9 of 21
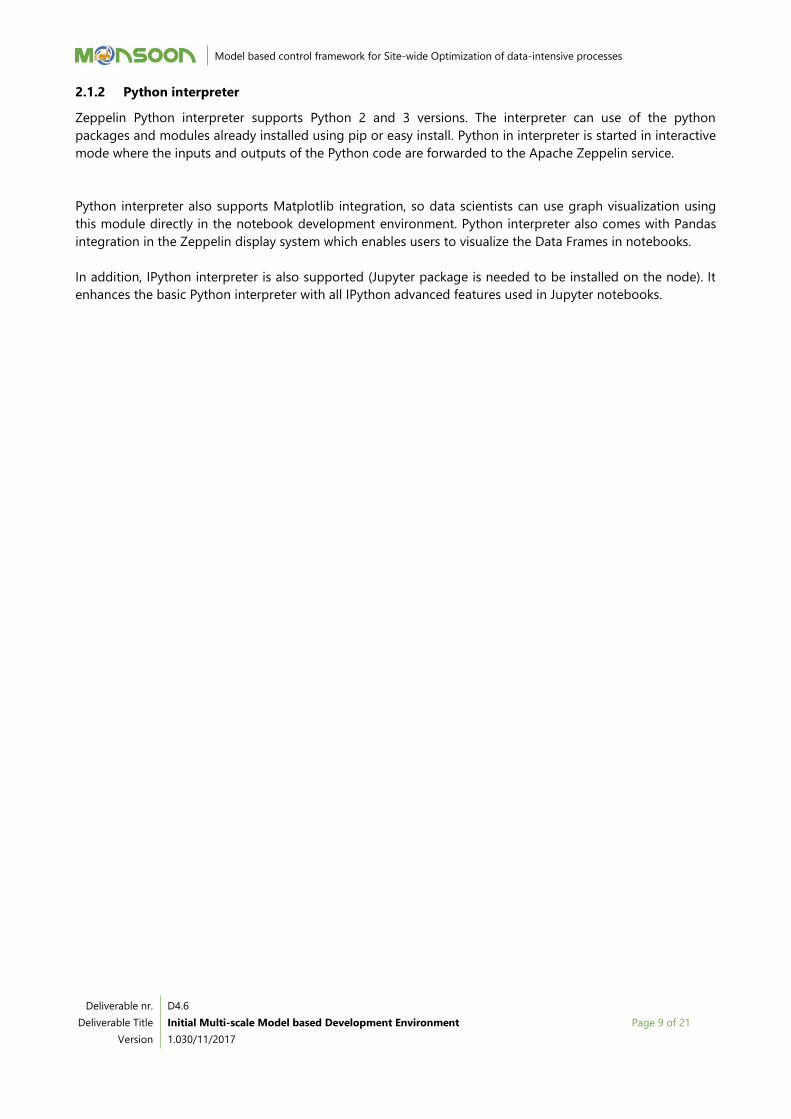
2.1.2 Python interpreter
Zeppelin Python interpreter supports Python 2 and 3 versions. The interpreter can use of the python
packages and modules already installed using pip or easy install. Python in interpreter is started in interactive
mode where the inputs and outputs of the Python code are forwarded to the Apache Zeppelin service.
Python interpreter also supports Matplotlib integration, so data scientists can use graph visualization using
this module directly in the notebook development environment. Python interpreter also comes with Pandas
integration in the Zeppelin display system which enables users to visualize the Data Frames in notebooks.
In addition, IPython interpreter is also supported (Jupyter package is needed to be installed on the node). It
enhances the basic Python interpreter with all IPython advanced features used in Jupyter notebooks.

Model based control framework for Site-wide Optimization of data-intensive processes
Deliverable nr.
Deliverable Title
Version
D4.6
Initial Multi-scale Model based Development Environment
1.030/11/2017
Page 10 of 21
3 Models generation tools
3.1 Context and objectives
The purpose of this section is to describe the tools that will be used by the data scientists in the model
development environment to build the predictive functions. Main idea is to describe the particular tools from
the perspective relevant to the process of dockerization of the predictive function for deployment in the
Runtime Container. Predictive functions created in model development environment will be packaged and
dockerizer into the separatecontainers that will include all dependencies (e.g. python modules in case of
python scripts) and will expose several folders to the outside environment (e.g. input data directory, output
and results directory, log files directory, etc.). More detailed description is provided in the deliverable D3.7 –
Initial Runtime Container.
3.1.1 MLlib and ML Pipelines
MLlib is a distributed machine learning library on Spark platform providing learning algorithms for
classification, regression and clustering as well as tools for data preparation and pre-processing. ML Pipelines
provides high-level API for creation of machine learning pipelines. Spark and MLlib are described in more
detail in deliverable D4.3 – Initial Big Data Storage and Analytics Platform. Sections above describe how MLlib
and ML Pipelines are able to import data and describe the structure and format of the saved output (models
or pipelines).
Data preparation:
Spark can read input data from the text files and sequence files using built in operations
Spark Python API supports reading multiple text files from a directory
SparkSQL supports reading also these formats: CSV, parquet, JSON
MLlib when used with Spark can access data in any storage supported by Hadoop: HDFS, local
filesystem and HBase
Data must be converted from RDD or Data Frames into the LabeledPoint type in order to be used by
MLlib algorithms
Predictive Functions:
Models created in MLlib can be saved/loaded to and from HDFS using save() and load() operations,
models are saved in parquet format. MLlib saves the model (e.g. decision tree) in specified location,
e.g. modelPath/ and creates two directories, e.g. modelPath/data and modelPath/metadata:
Example of the directory structure:
sample-model/
-- data
-- _SUCCESS
-- part-r-0000012345.snappy.parquet
-- metadata
-- _SUCCESS
-- part-00000
- data directory stores files containing Apache Parquet files – the actual modeland metadata
directory contains metadata

Model based control framework for Site-wide Optimization of data-intensive processes
Deliverable nr.
Deliverable Title
Version
D4.6
Initial Multi-scale Model based Development Environment
1.030/11/2017
Page 11 of 21
Models can be exported in PMML format starting from MLlib 1.4.0 version, so far saving of the
models is available only in Scala environment and only several models are supported (KMeans, Linear
Regression, Ridge Regression, Lasso Model, SVM) using toPMML() function
Spark ML (high-level API for building machine learning pipelines), enables also to save the whole ML
pipelines in similar way as to save the MLlib models using write() and save() operations. Metadata are
saved in JSON format and corresponding model parameters are saved as parquet files
o sample-model/metadata/part-* files contains metadata about pipeline stages (e.g. pre-
processing steps and models)
o sample-models/stages contains models and related metadata for particular stages of the
pipeline in the same structure and format as the MLlib models
Example:
Pipeline metadata file of the ML pipeline consisting of Regex Tokenizer, Hashing TF transformer and
Logistic regression model is stored in a file with structure as follows:
File: sample-model/metadata/part-00000
{
"class": "org.apache.spark.ml.PipelineModel",
"timestamp": XYZ,
"sparkVersion": "2.1.0-SNAPSHOT",
"uid": "pipeline_123",
"paramMap": {
"stageUids": [
"regexTok_abc123",
"hashingTF_abc234",
"logreg_abc345"
]
}
}
Models and metadata related to particular stages of the pipeline are then stored as follows:
Directory: sample-model/stages/
-- 0_regexTok_abc123
-- metadata
-- _SUCCESS
-- part-00000
-- 1_hashingTF_abc234
-- metadata
-- _SUCCESS
-- part-00000
-- 2_logreg_abc345
-- data
-- _SUCCESS
-- part-r-0000012345.snappy.parquet
-- metadata
-- _SUCCESS
-- part-00000

Model based control framework for Site-wide Optimization of data-intensive processes
Deliverable nr.
Deliverable Title
Version
D4.6
Initial Multi-scale Model based Development Environment
1.030/11/2017
Page 12 of 21
Spark ML pipelines can be saved to and loaded from PMML using JPMML-SparkML2 using
toPMMLBytes() function. The tool supports Spark 1.5.X – 2.2.X and PMML 4.2 and 4.3 versions.
2https://github.com/jpmml/jpmml-sparkml
Model based control framework for Site-wide Optimization of data-intensive processes
Deliverable nr.
Deliverable Title
Version
D4.6
Initial Multi-scale Model based Development Environment
1.030/11/2017
Page 13 of 21
4 Predictive function packaging and relation with the Runtime Container
4.1 Packaging
Predictive functions are packaged in the developer containers as Docker images3. The rationale behind the
usage of predictive functions is described in the following:
1. Package dependencies of prediction algorithms can be easily managed within a Docker container
2. Easy rollback to previous models or predictive algorithms by using different versions of Docker
containers.
3. Easy installation and replacement of containers
4. Entire Predictive Function pipeline (including pre-processing and task specific evaluation) can be
implemented within a Docker container
5. Multiple containers can work together to achieve a bigger goal, hence, achieving component re-use.
Docker image is created by the development container by a data scientist. The data scientist,with the help of
the developer container, trains one or more machine learning modelsusing the historical data available in
data lab and evaluates the same for better accuracy. Once the model performs well, the data scientist decides
it to export it to the Runtime container. This decision can also be automatically taken based on accuracy
measures. For example, whenever the accuracy is better than a certain threshold. This model will be packaged
as a Docker image.
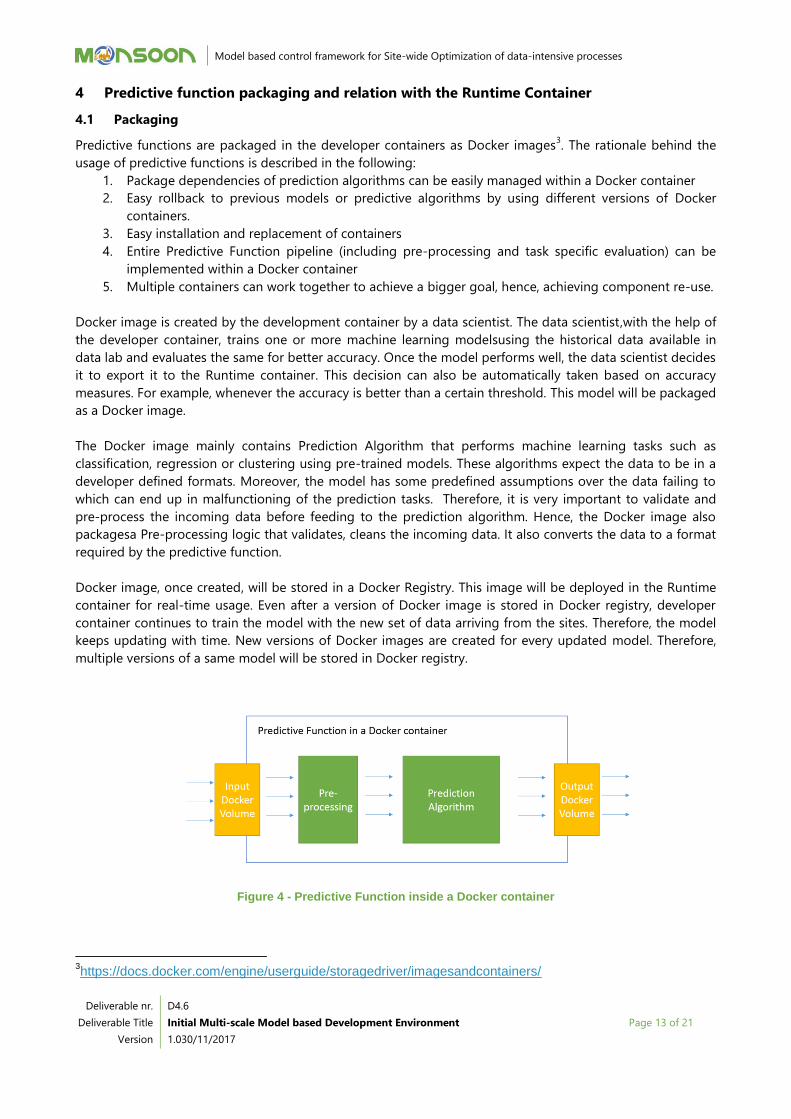
The Docker image mainly contains Prediction Algorithm that performs machine learning tasks such as
classification, regression or clustering using pre-trained models. These algorithms expect the data to be in a
developer defined formats. Moreover, the model has some predefined assumptions over the data failing to
which can end up in malfunctioning of the prediction tasks. Therefore, it is very important to validate and
pre-process the incoming data before feeding to the prediction algorithm. Hence, the Docker image also
packagesa Pre-processing logic that validates, cleans the incoming data. It also converts the data to a format
required by the predictive function.
Docker image, once created, will be stored in a Docker Registry. This image will be deployed in the Runtime
container for real-time usage. Even after a version of Docker image is stored in Docker registry, developer
container continues to train the model with the new set of data arriving from the sites. Therefore, the model
keeps updating with time. New versions of Docker images are created for every updated model. Therefore,
multiple versions of a same model will be stored in Docker registry.
Figure 4 - Predictive Function inside a Docker container
3https://docs.docker.com/engine/userguide/storagedriver/imagesandcontainers/

Model based control framework for Site-wide Optimization of data-intensive processes
Deliverable nr.
Deliverable Title
Version
D4.6
Initial Multi-scale Model based Development Environment
1.030/11/2017
Page 14 of 21
4.2 Relations with Runtime Container
Latest version of predictive functions packaged as Docker images are pulled from the Docker registry of
development container and executed in the Runtime container.
In addition to the pre-processing logics of predictive functions, the data ingestion module (eg: Apache NIFI)
of Runtime container will provide initial set of pre-processing logic which filters the data before it is fed to
the predictive functions. These filters is be used by multiple predictive functions and hence saves logic
duplication among multiple predictive functions running in the Runtime Container. The behaviour of filtering
logics in the data ingestion module is governed by a configuration file exposed by the predictive functions.
For example, the configuration file of a predictive function might contain the subset of attributes it is
interested in for further processing.
The predictive functions use JSON files as input and outputs. Docker container can share filesystem volumes
with the host machine. This feature of Docker is used in Runtime container and predictive functions. The
predictive functions share two volumes with the host machine in order to share input and output files. The
ingestion module puts the input JSON files in the shared location reserved for inputs (input/left orange block
on the schema). The predictive function reads the files and uses it for further processing. The output of the
predictive function is stored in the form of JSON files in the shared location reserved for outputs
(output/right orange block on the schema). The output files can be further stored in a database and/or used
for further visualization in Runtime Container.
Figure 5 - Position of predictive function in Runtime container

Model based control framework for Site-wide Optimization of data-intensive processes
Deliverable nr.
Deliverable Title
Version
D4.6
Initial Multi-scale Model based Development Environment
1.030/11/2017
Page 15 of 21
5 Simulation and Validation tools
5.1 Context and objectives
The multi-scale model development environment will provide tools and interfaces that will cover the whole
life cycle of the planning, implementation and deployment of data analytics functions developed using the
algorithms provided by data scientists into the plant production supporting simulation/co-simulation
features.
However, the validity of the models created needs to be verified and tested.
Validation is a procedure used to check whether predictive function meets predefined requirements and
specifications and fulfils its intended purpose. In other words, validation checks whether the specification
captures the end user needs and helps to fill the gaps between the expectations and the current results.
Specifications can be mapped in Key Performance Indicators (KPIs). KPIs define a set of values against which
to measure performance. Some typical key performance indicators for manufacturing, also considered here,
include operating cost, asset availability, number of environmental incidents, use of resources, waste
production, and energy consumption.
For predictive functions, Key Performance Indicators cannot be usually evaluated directly. The objectives of
the predictive maintenance and control are expressed as the tasks of the data analytics such as regression or
classification tasks. Common methodology for validation of the quality of predictive function is to use
independent validation set of historical data to estimate evaluation statistics such as accuracy, recall,
precision or ROC curve. Based on these statistics, Key Performance Indicators can be evaluated using the
cost-matrices which relate quality of the predictive function to the performance of the underlying production
process.
In MONSOON project, the validation will be focus on the functions created to will support:
quantitative evaluation of the predictive functions on the validation datasets using the various
metrics identified with the data scientists (e.g. approximation/prediction error, rate of false positive
alerts, etc.)
methods for sensitivity analysis how the function outputs are influenced by the changes in the inputs
and how robust is the prediction when the input data are influenced by the noise or during
monitoring failures.
In both cases the requirements needed for the validation are identified by the data scientist based on the
KPIs defined with the end-user.
5.2 Validation methodology
A validation method can be mapped into a generic procedure that requires the definition of three main
steps: input, elaboration and output. A high-level overview is shown in Figure 6.
Figure 6 - Validation Steps
In particular, we can say that:
Input Elaboration Output
Model based control framework for Site-wide Optimization of data-intensive processes
Deliverable nr.
Deliverable Title
Version
D4.6
Initial Multi-scale Model based Development Environment
1.030/11/2017
Page 16 of 21
Input: this step contains all necessary objects needed for the elaboration phase;
Elaboration: in this step there is a module for processing the input according to the output;
Output: these are the expected results given the input objects.
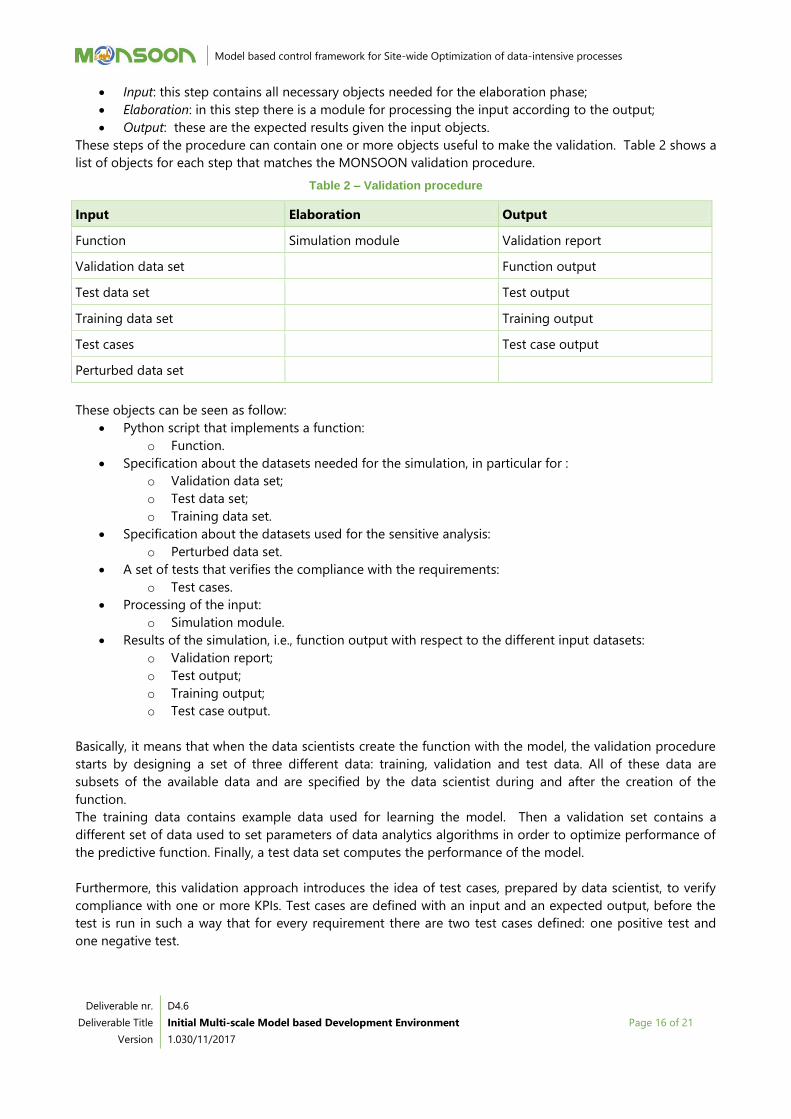
These steps of the procedure can contain one or more objects useful to make the validation. Table 2 shows a
list of objects for each step that matches the MONSOON validation procedure.
Table 2 – Validation procedure
Input Elaboration Output
Function Simulation module Validation report
Validation data set Function output
Test data set Test output
Training data set Training output
Test cases Test case output
Perturbed data set
These objects can be seen as follow:
Python script that implements a function:
o Function.
Specification about the datasets needed for the simulation, in particular for :
o Validation data set;
o Test data set;
o Training data set.
Specification about the datasets used for the sensitive analysis:
o Perturbed data set.
A set of tests that verifies the compliance with the requirements:
o Test cases.
Processing of the input:
o Simulation module.
Results of the simulation, i.e., function output with respect to the different input datasets:
o Validation report;
o Test output;
o Training output;
o Test case output.
Basically, it means that when the data scientists create the function with the model, the validation procedure
starts by designing a set of three different data: training, validation and test data. All of these data are
subsets of the available data and are specified by the data scientist during and after the creation of the
function.
The training data contains example data used for learning the model. Then a validation set contains a
different set of data used to set parameters of data analytics algorithms in order to optimize performance of
the predictive function. Finally, a test data set computes the performance of the model.
Furthermore, this validation approach introduces the idea of test cases, prepared by data scientist, to verify
compliance with one or more KPIs. Test cases are defined with an input and an expected output, before the
test is run in such a way that for every requirement there are two test cases defined: one positive test and
one negative test.

Model based control framework for Site-wide Optimization of data-intensive processes
Deliverable nr.
Deliverable Title
Version
D4.6
Initial Multi-scale Model based Development Environment
1.030/11/2017
Page 17 of 21
To perform the sensitivity analysis and check the robustness of the function, a list of possible perturbation
has been provided in the system in order to generate noisy data from the dataset set provided (validation
data) and observe the function behaviour.
In this section we focus on the validation report. Figure 7 shows a possible validation approach that can be
introduced in the MONSOON Platform.
Figure 7 – High level overview for a possible validation approach
While the validation procedure aims to describe the steps used to gain information about whether the
predictive function will pass or fail the test, running the test is a task dedicated to the Simulation framework.
5.3 MONSOON Simulation Framework
The Simulation framework is in charge to run the predictive function using the data specified by data
scientist. It is the component that allows the validation approach proposed above.
The first draft of the architecture is depicted in Figure 8.
Model based control framework for Site-wide Optimization of data-intensive processes
Deliverable nr.
Deliverable Title
Version
D4.6
Initial Multi-scale Model based Development Environment
1.030/11/2017
Page 18 of 21
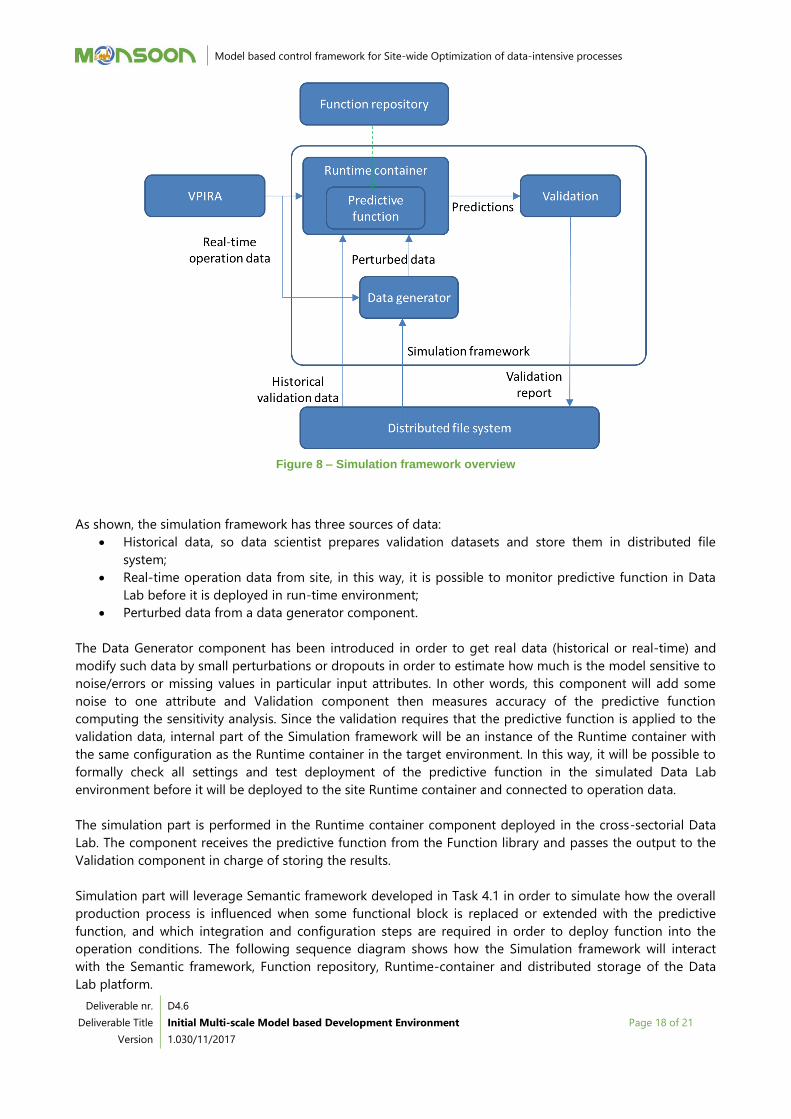
Figure 8 – Simulation framework overview
As shown, the simulation framework has three sources of data:
Historical data, so data scientist prepares validation datasets and store them in distributed file
system;
Real-time operation data from site, in this way, it is possible to monitor predictive function in Data
Lab before it is deployed in run-time environment;
Perturbed data from a data generator component.
The Data Generator component has been introduced in order to get real data (historical or real-time) and
modify such data by small perturbations or dropouts in order to estimate how much is the model sensitive to
noise/errors or missing values in particular input attributes. In other words, this component will add some
noise to one attribute and Validation component then measures accuracy of the predictive function
computing the sensitivity analysis. Since the validation requires that the predictive function is applied to the
validation data, internal part of the Simulation framework will be an instance of the Runtime container with
the same configuration as the Runtime container in the target environment. In this way, it will be possible to
formally check all settings and test deployment of the predictive function in the simulated Data Lab
environment before it will be deployed to the site Runtime container and connected to operation data.
The simulation part is performed in the Runtime container component deployed in the cross-sectorial Data
Lab. The component receives the predictive function from the Function library and passes the output to the
Validation component in charge of storing the results.
Simulation part will leverage Semantic framework developed in Task 4.1 in order to simulate how the overall
production process is influenced when some functional block is replaced or extended with the predictive
function, and which integration and configuration steps are required in order to deploy function into the
operation conditions. The following sequence diagram shows how the Simulation framework will interact
with the Semantic framework, Function repository, Runtime-container and distributed storage of the Data
Lab platform.

Model based control framework for Site-wide Optimization of data-intensive processes
Deliverable nr.
Deliverable Title
Version
D4.6
Initial Multi-scale Model based Development Environment
1.030/11/2017
Page 19 of 21
Figure 9 – Validation process component interactions.
1. Simulation framework will load selected predictive function from the Function repository and create
a new instance of the function in the Run-time container running in the Data lab environment
2. Simulation framework will stream selected validation data set to Run-time container and get the
function’s predicted values.
3. Simulation framework (Validation component) will compute selected evaluation statistics such as
error, precision, recall, ROC curve, etc. and store the statistics in the validation report.
4. Semantic framework will load validation report and compute Key-Performance Indicators using the
parametrized cost matrices. Semantic framework will allow visualizing KPIs in the context of the
production process in order to compare multiple predictive functions applied to the same
production step.
Function repository
Run-time container
Semantic framework
Simulation framework
Data Scientists/
Stakeholders Predictive function
Validation data
Validation report
KPI visualization

Model based control framework for Site-wide Optimization of data-intensive processes
Deliverable nr.
Deliverable Title
Version
D4.6
Initial Multi-scale Model based Development Environment
1.030/11/2017
Page 20 of 21
6 Conclusion
In this document, the initial views of the Multi-scale Model Based Development Environment have been
described.
The final version of the Multi-scale Model Based Development Environmentspecifications is planned to be
released in document D4.7 (in the third year of the MONSOON project).

This project has received funding from the European Union’s Horizon 2020 research and innovation
programme under grant agreement No 723650.
Acronyms
Acronym Explanation
JVM Java virtual machine
PMML Predictive Model Markup Language
ROC Receiver Operating Characteristic (curve)
List of Figures
Figure 1 - High-level architecture of the Model development tools ............................................................................................................... 5
Figure 2 - Zeppelin notebook layout ............................................................................................................................................................................ 6
Figure 3 - Zeppelin architecture ...................................................................................................................................................................................... 7
Figure 4 - Predictive Function inside a Docker container ................................................................................................................................... 13
Figure 5 - Position of predictive function in Runtime container ..................................................................................................................... 14
Figure 6 - Validation Steps .............................................................................................................................................................................................. 15
Figure 7 – High level overview for a possible validation approach ................................................................................................................ 17
Figure 8 – Simulation framework overview .............................................................................................................................................................. 18
Figure 9 – Validation process component interactions. ...................................................................................................................................... 19
List of Tables
Table 1 - List of available Zeppelin interpreters ....................................................................................................................................................... 7
Table 2 – Validation procedure ...................................................................................................................................................................................... 16
Related Documents