© EU-VRi European Virtual Institute for Integrated Risk Management, Willi-Bleicher-Str. 19, 70174 Stuttgart, Germany D3.5 Guide on prevention & mitigation, and integration for aging management Customer: European Commission Project title: SafeLife-X Safe Life Extension management of aged infrastructures networks and industrial plants Costumer order Nr.: Grant Agreement: 608813 Internal project Nr.: 12049 Project start: 01/09/2013 Project end: 31/08/2015 Subproject: Applicable codes/standards: Work package: WP3 Date of order acceptance: 28/06/2013 Task: T3.5 Date of completion: Additional contract info: Project website: www.safelife-x.eu-vri.eu Participants / Distribution: Participants in the activity: Distribution (list): Internal Document data: Author(s): Aleksandar Jovanovic, Bastien Caillard, Stefan Husta File name: D3.5-AgingPreventionMitigation_v27sh05022015.docx Pages: 174 Nr. of annexes: 0 Status: Final Confidentiality: PU Keywords: Stuttgart, February 12, 2015

Welcome message from author
This document is posted to help you gain knowledge. Please leave a comment to let me know what you think about it! Share it to your friends and learn new things together.
Transcript

© EU-VRi European Virtual Institute for Integrated Risk Management, Willi-Bleicher-Str. 19, 70174 Stuttgart, Germany
D3.5 Guide on prevention & mitigation, and integration for aging management
Customer: European Commission
Project title:
SafeLife-X Safe Life Extension management of
aged infrastructures networks and
industrial plants
Costumer order Nr.: Grant Agreement: 608813
Internal project Nr.: 12049
Project start: 01/09/2013
Project end: 31/08/2015
Subproject: Applicable codes/standards:
Work package: WP3 Date of order acceptance: 28/06/2013
Task: T3.5 Date of completion:
Additional
contract info: Project website: www.safelife-x.eu-vri.eu
Participants / Distribution:
Participants in the activity: Distribution (list):
Internal
Document data:
Author(s): Aleksandar Jovanovic, Bastien Caillard, Stefan Husta
File name: D3.5-AgingPreventionMitigation_v27sh05022015.docx
Pages: 174 Nr. of annexes: 0
Status: Final Confidentiality: PU
Keywords:
Stuttgart, February 12, 2015

SafeLife-X
page ii
Table of Contents
List of Figures .................................................... vi
List of Tables ..................................................... ix
List of Acronyms ............................................... 10
1 Introduction............................................. 12
2 Knowing the state: Monitoring Systems ...... 14
Increasing importance of monitoring .......... 14
Monitoring operation vs. monitoring of damage .................................................. 14
Global vs. local monitoring ........................ 14
Modular targeted monitoring ..................... 16
Direct application of ALIAS for targeted monitoring in a German power plant .......... 16
Conclusions drawn from the selected
application case ....................................... 21
3 Knowing the problem causes: RCFA and the
Logic of Aging Damage Identification .......... 23
General Analysis Techniques ..................... 24
Failure Mode and Effects Analysis (FMEA) ....................................... 27
Fault-Tree Analysis ...................... 28
Cause-and-Effect Analysis ............ 28
SEQUENCE-OF-EVENTS ANALYSIS . 32
Common causes of failures ........... 34
RC(F)A Decision making ........................... 35
Logic of aging damage identification ........... 38
Damage systematics .................... 38
WHERE to look for (inspect / monitor) for which type of damage 41
HOW to look for (inspect / monitor)
for which type of damage ............. 44
How to analyze and predict
development of given types of
damage ...................................... 46
4 Managing aging by reliability and risk-based methods: RCM and RBI ............................. 49
Reliability-Centered Maintenance (RCM) ..... 49
Risk Based Inspection and Maintenance (RBI) ...................................................... 51
5 Optimizing aging management: Aging
Indicators, Risk Factors and KPIs ............... 54
Aging-related Key Performance Indicators .. 54
Risk Factors and Indicators of aging ........... 55
6 Conclusion ............................................... 59
7 References .............................................. 60

SafeLife-X
page iii
Annex 1 Reliability Centered Maintenance (RCM) 61
A.1.1 Definitions – What is RCM? ........... 61
A.1.2 RCM Benefits .............................. 64
A.1.3 RCM Process overview.................. 64
A.1.4 Information needed for RCM
Analysis ...................................... 65
A.1.5 Operating context ........................ 65
A.1.6 Primary functions ........................ 66
A.1.7 Performance standards ................ 66
A.1.8 Secondary functions (“ESCAPES”) . 67
A.1.9 Functional failure ......................... 69
A.1.10 Failure modes ............................. 70
A.1.11 Failure classification ..................... 70
A.1.12 Failure Characteristic Analyses ...... 72
A.1.13 Failure Consequences .................. 73
A.1.14 Maintenance Strategy Selection (MMS) ........................................ 73
A.1.15 Preventive Tasks ......................... 75
A.1.16 No scheduled maintenance (run to failure) ....................................... 76
A.1.17 Redesign .................................... 77
A.1.18 Application of a tool for RCM analysis in the process industry..... 77
Annex 2 Managing aging by risk-based methods
and inspection optimization: RBI – CEN CWA
15740 ..................................................... 80
Introduction ............................................ 80
A.2.1 Scope ......................................... 81
A.2.2 Normative References .................. 82
A.2.3 Definitions, symbols and
abbreviations .............................. 83
A.2.3.1 Definitions .................................. 83
A.2.3.2 Symbols ..................................... 83
A.2.3.3 Abbreviations .............................. 83
A.2.4 RIMAP Framework ....................... 85
A.2.4.1 RIMAP vs RBIM ........................... 85
A.2.4.2 RIMAP Principles .......................... 85
A.2.4.3 RIMAP Requirements ................... 85
A.2.4.3.1 General requirements ...................... 85
A.2.4.3.2 Personnel requirements .................... 86
A.2.4.3.3 Requirements for performing PoF
analysis ......................................... 86
A.2.4.3.4 Requirements for performing CoF
analysis ......................................... 87
A.2.4.3.5 Risk assessment Requirement ........... 88
A.2.4.4 RIMAP within the overall
management system ................... 88

SafeLife-X
page iv
A.2.4.5 Limitations .................................. 89
A.2.4.6 Compatibility with other known
approaches ................................. 89
A.2.5 RIMAP Procedure ......................... 90
A.2.5.1 Initial analysis and planning.......... 92
A.2.5.1.1 General description and scope ........... 92
A.2.5.1.2 Requirements ................................. 94
A.2.5.1.3 Inputs ........................................... 94
A.2.5.1.4 Procedure ...................................... 95
A.2.5.1.5 Output .......................................... 95
A.2.5.1.6 Warnings and applicability limits ........ 95
A.2.5.2 Data collection and validation ....... 95
A.2.5.2.1 General description and scope ........... 95
A.2.5.2.2 Requirements ................................. 96
A.2.5.2.3 Input ............................................ 96
A.2.5.2.4 Procedure ...................................... 98
A.2.5.2.5 Output .......................................... 98
A.2.5.2.6 Warnings and applicability limits ........ 98
A.2.5.3 Multilevel risk analysis (ranging from screening to detailed) ........... 99
A.2.5.3.1 General description and scope ........... 99
A.2.5.3.2 Risk analysis - screening level ......... 104
A.2.5.3.3 Risk analysis – detailed assessment .. 105
A.2.5.4 Decision making / action plan ..... 119
A.2.5.4.1 General description and scope ......... 119
A.2.5.4.2 Requirements ............................... 119
A.2.5.4.3 Inputs ......................................... 119
A.2.5.4.4 Procedure .................................... 119
A.2.5.4.5 Output ........................................ 120
A.2.5.4.6 Warnings and applicability limits ...... 120
A.2.5.5 Execution and reporting ............. 120
A.2.5.5.1 General ....................................... 120
A.2.5.5.2 Input .......................................... 121
A.2.5.5.3 Procedure .................................... 121
A.2.5.5.4 Output ........................................ 122
A.2.5.5.5 Warning/application limits ............... 122
A.2.5.6 Performance review / Evergreen
phase ....................................... 123
A.2.5.6.1 General description and scope ......... 123
A.2.5.6.2 Requirements ............................... 123
A.2.5.6.3 Inputs ......................................... 124
A.2.5.6.4 Procedure .................................... 124
A.2.5.6.5 Output ........................................ 126
A.2.5.6.6 Warnings and applicability limits ...... 126
Bibliography .......................................... 128

SafeLife-X
page v
A.2.6 RBI example: Multilevel risk
analysis in the power industry ..... 130
A.2.6.1 Sample case ............................. 133
A.2.6.2 Screening level .......................... 134
A.2.6.3 Intermediate level ..................... 139
A.2.6.4 Detailed level ............................ 140
Annex 3 Aging Related KPIs .......................... 143

SafeLife-X
page vi
List of Figures
Figure 1: Example of displacement monitoring (Roos,
Kessler,Eckel, Ausfelder 1996, see also Kaum
and Reiners 1996) ...................................... 15
Figure 2: Piping system in a German power plant used as
example for targeted monitoring: here as
"stored" in ALIAS ....................................... 16
Figure 3: Analyses linked to the objects ....................... 17
Figure 4: Data from the monitoring system: time series
of temperature, pressure, displacement and strain measurements .................................. 18
Figure 5: Displacements in z-direction as calculated by
different tools for the same piping system in
the selected example .................................. 18
Figure 6: Displacement monitoring (monitoring in z-
direction, position 32 as in Figure 8, straight
lines displacements for design conditions, triangles displacements calculated for the
measured operating conditions): overall result
showing that measured displacements are within design limits..................................... 19
Figure 7: Measured strains using high-temperature
capacitive strain gauges (position 36 in Figure 8, out- and inside, hoop, elastic strain)......... 19
Figure 8: Positions of strain and displacement
transducers on the piping (here: the finite element model used for non-linear analysis
creep analysis in ANSYS) ............................ 20
Figure 9: Influence of system stresses onto life
exhaustion (Ez - creep) –according to TRD, ANSYS with and without system stresses ...... 20
Figure 10: From monitoring data (Figure 4), over single
RLA calculations, to the overview of damage development – 60% TRD-limit indicated ....... 21
Figure 11: Linking NDT-data (replica) to RLA-calculations
in ALIAS .................................................... 22
Figure 12: Bow-Tie model ........................................... 30
Figure 13: Fishbone diagram ....................................... 31
Figure 14: Sequence of events diagram ....................... 33
Figure 15: Damage types appearing as failure or root
failure causes in RIMAP ............................... 36
Figure 16: Maintenance strategy decision making.......... 37
Figure 20: Possible way of considering damage ............. 38
Figure 17: Evolution of maintenance strategies ............. 49
Figure 18: The components of an RCM program ............ 50
Figure 19: Contribution of overall risk in the plant vs. number of components ............................... 51
Figure 21: RCM Review Team ...................................... 64
Figure 22: Different levels of performance .................... 66
Figure 23: Failure Classification Decision Tree ............... 71
Figure 24: Failure Characteristic Patterns ..................... 72

SafeLife-X
page vii
Figure 25: RCM Strategy Decision Logic ....................... 74
Figure 26: Maintenance Strategies ............................... 74
Figure 27: Frequency of Condition Based Tasks ............. 75
Figure 28: Restoration & Discard Age for age related
failures...................................................... 76
Figure 29: RCM Interactions........................................ 77
Figure 30: RCM Analysis in the iRIS-Petro tool .............. 78
Figure 31: RCM Analysis Calculation Report .................. 78
Figure 32: RCM Statistic Calculation Report .................. 79
Figure 33: RCM MTBF Calculation ................................ 79
Figure 34 - Framework of RIMAP procedure within the
overall management system ........................ 91
Figure 35 - Multilevel risk analysis: Complexity of
analysis..................................................... 99
Figure 36 - Multilevel risk analysis: Plant hierarchy
level ....................................................... 100
Figure 37 - Work flow for risk screening ..................... 104
Figure 38 - Screening risk matrix .............................. 105
Figure 39 - Damage types appearing as failure or root failure causes in RIMAP ............................. 108
Figure 40 - Types of damage and their specifics in
relation to hierarchical structure of the plant according to KKS ...................................... 110
Figure 41 - Elements of PoF determination in the RIMAP
concept ................................................... 113
Figure 42 - Example of estimation of CoF for safety in
RIMAP ..................................................... 115
Figure 43 - Example of decision logic for CoFEnvironment in RIMAP ..................................................... 117
Figure 44 - Example of decision / action criteria for
various risk levels in risk matrix ................. 117
Figure 45 - An example of the risk matrix for detailed assessment, involving HSE and economic
risks with four risk limit categories ............. 118
Figure 46 - The main level of the decision-making framework ............................................... 120
Figure 47 - Detailed planning .................................... 123
Figure 48 - Example of validation feature list in RIMAP [9].......................................................... 127
Figure 49 Creep exhaustion calculation based on TRD
(now EN 12952) ....................................... 130
Figure 50 TRD Fatigue curve (with derived mean value
curve) at 400°C ....................................... 131
Figure 51: Component geometry data ........................ 131
Figure 52: Design and operating temperature and pressure .................................................. 132
Figure 53: Service time of the component .................. 132
Figure 54 Example of distribution for creep rupture strength at 520°C .................................... 133

SafeLife-X
page viii
Figure 55 Example of distribution for fatigue strength at
400°C ..................................................... 133
Figure 56 Screening level PoF analysis in ALIAS-Risk .. 136
Figure 57 Defining PoF classes using ALIAS-Risk ........ 136
Figure 58 Defining CoF classes using ALIAS-Risk ........ 137
Figure 59 Building failure scenarios using ALIAS-Risk . 138
Figure 60 “Bow Tie” for supeheater component .......... 138
Figure 61 Imported calculated PoF values.................. 139
Figure 62 Input of CoF values .................................. 139
Figure 63 Risk map after screening level ................... 139
Figure 64 Risk map after intermediate analysis .......... 140
Figure 65 Creep crack growth with C* (form factor 2.5) (Jovanovic, Maile, 2001)) .......................... 141
Figure 66 Superheater component on a risk map after
detailed analysis ...................................... 141
Figure 67 Example of calculating PoF for the sample case considered ............................................... 142

SafeLife-X
page ix
List of Tables
Table 1 – List of acronyms .......................................... 10
Table 2 – Applicability of tools used for risk assessment
according to ISO 31010 .............................. 24
Table 3 – Attributes of (RCFA-specific) risk assessment
tools according to ISO 31010 ...................... 26
Table 2: Common causes of failures .......................... 34
Table 5 - Types of damage and their specifics
mechanisms .............................................. 39
Table 6: Classification of type of damage vs. systems/components in different types of
plants (FPP – fossil power plants, NPP –
nuclear power plants, PrP – process plants;
weld critical in all components) .................... 42
Table 7: Suggested measures for pre-symptom
appearance measures leading to early
discovery of damage in plants ..................... 45
Table 8: Suggested methods for the analysis
depending on damage types ........................ 47
Table 3: Examples of aging-related risk factors ......... 55
Table 4: Examples of aging indicators ...................... 57
Table 9 - Input source for Screening & Detailed risk
assessment ............................................. 101
Table 10 - Types of damage and their specifics
mechanisms ............................................ 109
Table 11 - Example of classification of type of damage vs. prioritized methods of inspection .......... 111
Table 12 - Sources of CoF for detailed assessment ...... 114
Table 13 - Explanation of the numerical criteria given in
the flowchart ........................................... 115
Table 14 - Values of the numerical criteria in the 3
categories model in “The Netherlands rules for
pressure vessels” the estimate criteria for the 5 categories model ................................... 116
Table 15 - Example of class definition of boundaries for
damage distance class .............................. 116
Table 16 - Principal categories of maintenance ............ 121
Table 17 - Activities in execution & reporting .............. 121
Table 18 - Examples of KPI's and objectives for selecting them....................................................... 124
Table 19: Overview of TRD documents and their EN
designation .............................................. 130
Table 20: Components considered in this example ..... 134
Table 21: Component design data ............................ 134
Table 22: Calculated component exhaustion values .... 135
Table 23: The following table shows new calculated values of PoF: .......................................... 140
SafeLife-X
page 10
List of Acronyms
A list of acronyms used throughout this document, with the corresponding definitions is given
in the table below.
Table 1 – List of acronyms
Acronym Definition
TRD Technische Regeln für Dampfkessel [Technical Regulations for Boilers]
MPA Materialprüfungsanstalt Universität Stuttgart [Materials Testing
Institute University of Stuttgart]
ALIAS Advanced modular intelligent Life Assessment Software System
RL / RLA Remnant Life / Remnant Life Assessment
ANSYS Engineering simulation software package
ALGOR General purpose multiphysics finite element analysis software package
ROHR 2 Pipeline stress analysis computer aided engineering system
RIMAP Risk based Inspection and Maintenance Procedures
RCM Reliability Centered Maintenance
O&M Operation and Maintenance
P&ID Piping and Instrumentation Diagram
FCA Failure Characteristic Analysis
MSS Maintenance and Strategy Selection
HS(S)E Health, Safety (Security) and Environment
MTBF Mean Time Between Failure
CBM Condition Based Maintenance
OREDA Offshore Reliability Data
iRIS-Petro Integrated Risk Management System for Petrochemical plants
RBI Risk Based Inspection
CWA CEN Workshop Agreement
CEN Comité Europeén de Normatisation [European Committee for
Standardization]
RBIM Risk Based Inspection and Maintenance

SafeLife-X
page 11
Acronym Definition
RBLM Risk Based Life Management
VGB Vereinigung der Großkesselbesitzer [Association of Large Boiler Owners]
ECCC European Creep Collaborative Commitee
ALARP As low as reasonably possible / practicable
API American Petroleum Institute
ASME American Society of Mechanical Engineers
CMMS Computerized Maintenance Management System
CoF Consequence of Failure
FME(C)A Failure mode, effects (criticality) and analysis
HAZOP Hazard and operability (study/analysis)
HCF / LCF High Cycle Fatigue / Low Cycle Fatigue
HFF / LFF High Fluid Flow / Low Fluid Flow
HSE Health, Safety & Environment
HT High Temperature
KPI Key Performance Indicators
LoF Likelihood of Failure
NDT Non-destructive testing/inspection
P&ID Process and Instrumentation Diagram
POD Probability of Detection
PoF Probability of Failure
QA Quality Assurance
QRA Quantitative Risk Analysis
RBI Risk Based Inspection: methods to plan, implement and evaluate inspections using risk based approach
RBIM Risk Based Inspection and Maintenance: methods to plan, implement and evaluate inspections and maintenance using a risk based
approach
RBM, RBLM Risk-Based Maintenance, Risk-Based Life Management
RBWS Risk Based Work Selection
RC(F)A Root Cause (Failure) Analysis

SafeLife-X
page 12
1 Introduction
The objective of D3.5 is to provide a guide on prevention and mitigation, and integration for
aging management. Mitigation and prevention of aging-related risks requires an integrated
approach, combining operating and condition monitoring, and the application of the appropriate analyses and maintenance concepts. This document attempts is to provide
guidelines, descriptions and application examples, selected from the list of points given in the
description of T 3.5, covering some of these areas.
Operational and monitoring data – in Chapter 2, current monitoring trends are
presented. The importance of monitoring critical components in power plants is
stressed, and the various types of monitoring (operational vs. damage, global vs.
local) are differentiated and described. The difficulty of selecting the correct
monitoring locations for local monitoring, where damage is most likely to appear, is
identified as a major issue in the field, and the chapter proposes a solution through
the application of Modular Targeted Monitoring, and provides an application example
through the use of a software tool at a German power plant. In the conclusions, the
importance of monitoring, and specifically targeted local monitoring, is emphasized.
It is also noted that monitoring is just one aspect of life management, and that
integration with other life management techniques and processes is necessary for the
overall management of aging structures.
Root Cause Failure Analysis (RCFA), as an essential element of Asset Integrity
Management and Reliability Centered Maintenance procedures, is briefly described in
Chapter 3. Some general steps for performing, documenting and following-up RCFA
corrective actions are laid out. Four RCFA investigation techniques:
o Failure Mode and Effect Analysis (FMEA)
o Fault Tree Analysis (FTA)
o Cause and Effect Analysis
o Sequence of Events Analysis
are presented, with some advantages and disadvantages of each technique given.
A logic of aging damage identification is provided, as defined in RIMAP, addressing
the point laid out in the description of T 3.5. A flowchart describes a possible way of
considering damage in power (and process) plants. For the main types of damage
mechanisms defined in RIMAP, tables describe how to look for the damage, with
probability of detection (POD) figures for the respective techniques, locations where
to look for the damage by component type and analysis methods which can be used
to predict the development of a given type of damage.
Managing Aging by Reliability and Risk Based Methods – in Chapter 3.3, a historical
evolution of maintenance strategy is briefly given. Reliability and Risk-Based
inspection and maintenance concepts are introduced. These maintenance concepts
integrate information obtained from condition monitoring, industry experience with
equipment, inspection histories, etc. and provide an optimized maintenance program
with an adequate mix of maintenance actions and policies, to safely extend the life of
aging structures within the constraints of time, budget and any other considerations.
More detailed documents related to Reliability Centered Maintenance (RCM) and Risk
Based Inspection (RBI) are provided in Annex 1 and Annex 2, including examples of
application cases. The document concerning RBI, CEN CWA 15740 – RIMAP,
represents a complete guideline for implementing risk based inspection and
maintenance methodologies.
Chapter 5 briefly describes aging-related KPIs, which can be used to monitor the
effectiveness of implemented aging risk controls. A short list of aging related KPIs,
with definitions and formulas is provided in Annex 3. In addition, a list of risk factors
and indicators of aging is provided.
For additional information on operational, design or monitoring data gathering, please refer
to D3.2 – Report on the data collection, where data gathering templates have been provided
for process and power industries.
For a comprehensive list of process and power plant related damage mechanisms, containing
information such as: units or equipment affected, appearance or morphology of damage,
prevention/mitigation measures, inspection and monitoring recommendations… please refer

SafeLife-X
page 13
to D3.3 - Report on the analysis of the degradation laws and kinetics (Review of failure
mechanisms in industrial processes).
SafeLife-X
page 14
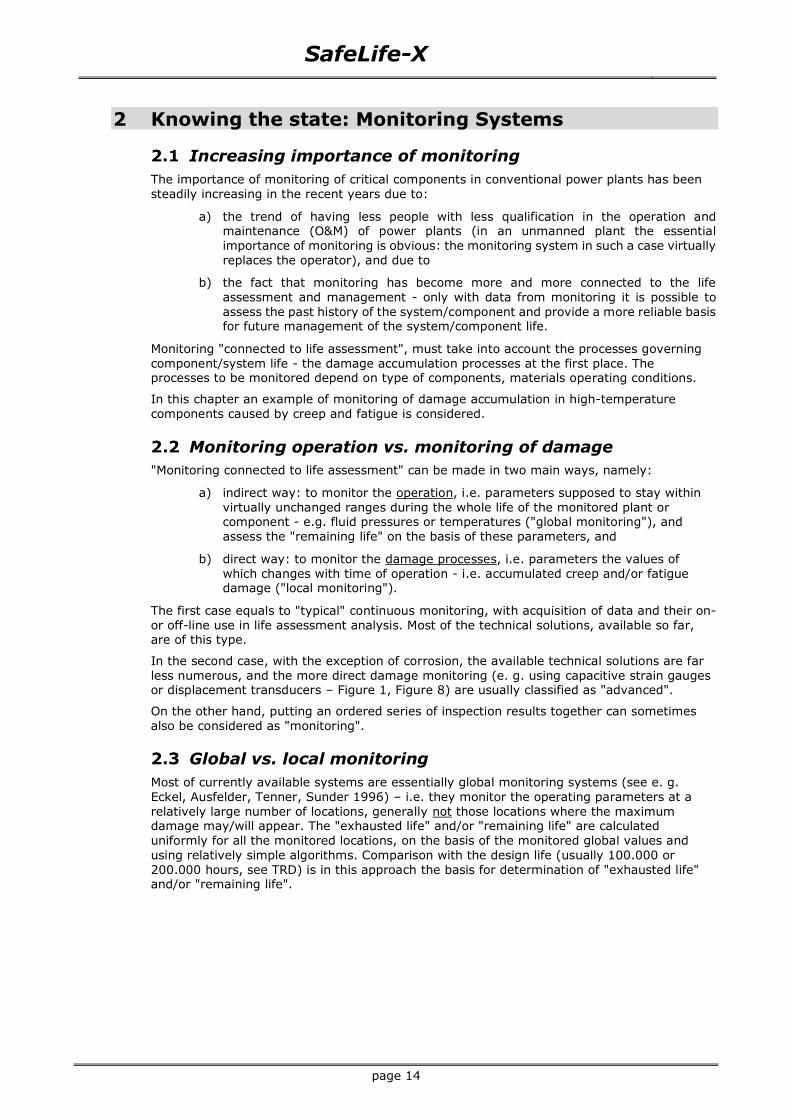
2 Knowing the state: Monitoring Systems
Increasing importance of monitoring
The importance of monitoring of critical components in conventional power plants has been
steadily increasing in the recent years due to:
a) the trend of having less people with less qualification in the operation and maintenance (O&M) of power plants (in an unmanned plant the essential
importance of monitoring is obvious: the monitoring system in such a case virtually
replaces the operator), and due to
b) the fact that monitoring has become more and more connected to the life
assessment and management - only with data from monitoring it is possible to
assess the past history of the system/component and provide a more reliable basis for future management of the system/component life.
Monitoring "connected to life assessment", must take into account the processes governing
component/system life - the damage accumulation processes at the first place. The processes to be monitored depend on type of components, materials operating conditions.
In this chapter an example of monitoring of damage accumulation in high-temperature
components caused by creep and fatigue is considered.
Monitoring operation vs. monitoring of damage
"Monitoring connected to life assessment" can be made in two main ways, namely:
a) indirect way: to monitor the operation, i.e. parameters supposed to stay within
virtually unchanged ranges during the whole life of the monitored plant or component - e.g. fluid pressures or temperatures ("global monitoring"), and
assess the "remaining life" on the basis of these parameters, and
b) direct way: to monitor the damage processes, i.e. parameters the values of
which changes with time of operation - i.e. accumulated creep and/or fatigue damage ("local monitoring").
The first case equals to "typical" continuous monitoring, with acquisition of data and their on-
or off-line use in life assessment analysis. Most of the technical solutions, available so far, are of this type.
In the second case, with the exception of corrosion, the available technical solutions are far
less numerous, and the more direct damage monitoring (e. g. using capacitive strain gauges or displacement transducers – Figure 1, Figure 8) are usually classified as "advanced".
On the other hand, putting an ordered series of inspection results together can sometimes
also be considered as "monitoring".
Global vs. local monitoring
Most of currently available systems are essentially global monitoring systems (see e. g.
Eckel, Ausfelder, Tenner, Sunder 1996) – i.e. they monitor the operating parameters at a
relatively large number of locations, generally not those locations where the maximum damage may/will appear. The "exhausted life" and/or "remaining life" are calculated
uniformly for all the monitored locations, on the basis of the monitored global values and
using relatively simple algorithms. Comparison with the design life (usually 100.000 or
200.000 hours, see TRD) is in this approach the basis for determination of "exhausted life" and/or "remaining life".

SafeLife-X
page 15
Figure 1: Example of displacement monitoring (Roos, Kessler,Eckel, Ausfelder 1996, see also Kaum and Reiners 1996)
Performing this type of calculation for a large number (say 200+ measurement points), with
tight time steps (say 30 sec) over years of plant operation obviously creates a huge amount of data: in itself something that can easily lead to "computerized data cemeteries". Piles of
magnetic tapes, printouts, files and similar, in which the important and significant data, if
present at all, might easily get lost and/or remain hidden from the user. Furthermore, calculated damage, e.g. creep or fatigue exhaustion in these outputs is often just the
repetition of pure inverse design (e.g. TRD), not involving the "real life conditions" like wrong
heat treatment, external moments and forces, misalignment, etc. The final result - a huge
amount dubious, often useless and/or, in the terms of damage really appearing, "false" results, calculated with "high precision", however, and real damage appearing at locations
never spotted as critical by global monitoring.
The wish to improve the situation is therefore understandable and searching for solutions by monitoring the location where damage is more likely to appear. Typically, the goal of this
type of monitoring is to catch the "peaks of damage" that may arise on some very particular
locations and not, like in the case monitoring of operating parameters, to monitor the "average situation". Damage caused by creep and fatigue in high-temperature components is
usually limited to particular zones: e.g. header ligaments, pipe elbow intrados/extrados,
crotch or saddle points in T-pieces, safe-ends, transition welds and similar. Monitoring exactly these is very desirable, but, unfortunately, often difficult.
The main difficulty is the choice of monitored locations. The choice is usually a multi-criteria
decision problem (Jovanovic, Auerkari, Brear 1996), with many possible outcomes. The
rightfulness of the decision can be usually proven only years later. Even if issue of choice is settled, further difficulties arise due to other reasons like:
a) Monitoring instrumentation (transducers) to be used is still labeled as
"experimental" or "early commercial version".
b) It is often complicated or even impossible to place the monitoring instrumentation
(e. g. temperature or strain) exactly on the most critical/solicited location, even if
the locations are known.
c) Even if these locations are instrumented it might be difficult or expensive to
calculate stresses and remaining life for them (especially on-line: e.g. in the case
of complex geometry a new finite element analysis might be needed for each type of transient, etc.).
d) Even if all the critical locations are known and instrumented, and it is possible to
calculate stresses and remaining life on-line, it is often too expensive and time
consuming to do it.

SafeLife-X
page 16
Modular targeted monitoring
Searching the way to connect
a) the technical easiness and applicability of the indirect and global monitoring (as defined above) and
b) meaningfulness of the direct damage monitoring
an approach designated here as "modular targeted monitoring", is proposed here. It
essentially means that one should
a) use the indirect monitoring for
- checking the overall "health" of the monitored system/component
- (one of the factors) defining where to go for direct damage monitoring, see Jovanovic, Auerkari, Brear 1996
b) use the direct damage monitoring at the places indicated as "critical" by
- global monitoring
- previous experience
- other factors (e. g. safety, economical risk, etc.)
c) combine the two approaches above smoothly and in an optimized way for each particular situation (type and level of actions being part of monitoring should be
optimized).
The approach has been developed at MPA and embedded into the MPA System ALIAS
(Jovanovic 1997). The chapter presents results from an application of the approach and the system in a German power plant. The emphasis is on the optimization, showing that a lot of
knowledge, data, models, software tools and people who can understand are needed for
optimized monitoring. Therein, the emphasis is on software tools and practical application of the system in a German power plant
Direct application of ALIAS for targeted monitoring in a
German power plant
The concept of modular targeted monitoring is built into ALIAS as an essential part of the overall remaining life assessment concept. The functionality of ALIAS is illustrated here using
as the example the piping system in a German power plant (Figure 2).
Hierarchy of ALIAS objects: Power
plants, Systems, Components…
Figure 2: Piping system in a German power plant used as example for targeted monitoring:
here as "stored" in ALIAS

SafeLife-X
page 17
Apart from the operational and design data about the objects themselves (Figure 2) – e.g.
dimensions, materials used, operating history) analyses performed for these objects (e. g.
TRD-analyses) and their results (Figure 3) are linked in a hierarchical model.
Figure 3: Analyses linked to the objects
Summary of actions
Action 1: All available data about the power plant, systems and components (Figure 2),
including geometry materials, fabrications, as well as available calculations (Figure 3,
including also the isometry of the piping system), etc. is collected and structured in a hierarchical tree.
Action 2: Monitoring data collected and made available for further analysis (Figure 4)
Action 3: TRD calculations for different nominal, operational and assumed combinations of parameters influencing stress and RL. For different assumed values of pressure, average
temperature, wall thickness, diameter and material properties (within standard limits)
various "what-if" scenario are analyzed (Figure 3).
Action 4: TRD calculations performed with standard monitoring data (Figure 4) assuming no
influence of system stresses.
Action 5: TRD calculations performed with standard monitoring data (Figure 4) assuming
influence of system stresses.
Using a finite element model of the piping isometry it is possible to calculate system stresses
due to external forces and moments. The analysis was a linear one and before using ALGOR
as a tool for parametric analysis its results were compared to those of other codes (ANSYS and ROHR2). The comparison shows nearly identical results in all load cases (Figure 5).
Action 6: Monitoring displacements
The piping system was equipped with the displacement monitoring transducers as shown in Figure 8. Measured displacements deliver, an indication about real system stresses and
about the correction to be introduced into the RLA-calculations. Furthermore, comparing the
displacements directly to those obtained for the limit design conditions the monitoring delivers an additional indication "is the piping still in the design limits" (Figure 6).
In a similar way as displacements, monitoring of strains was performed on a selected
position on the piping (Figure 8) using high-temperature capacitive strain gauges (Figure 7).
However, a pre-condition for implementation of strain monitoring is availability of non-linear analysis. In this case it was done by ANSYS finite element code. The analysis enables to (a)
reiterate in calculation the stress-strain situation corresponding to the measured one and (b)
to perform the component remaining life analysis based on realistic time-dependent creep-fatigue behavior.

SafeLife-X
page 18
Datum: 24.02.1995ZEIT Meßgröße 1
z.B."FD-Druck Z-R."
Meßgröße 2z.B.
"X-R."
...z.B.
"Kesselh".
...z.B.
"Y-R."
...z.B.
Masch.h.
Meßgröße nz.B.
"FD-Temp."
00:00:00 1 58.129 -0.708 -1.105 464.609 451.859 449.406
00:00:30 1 58.129 -0.684 -1.111 464.609 452.297 449.297
00:01:00 1 58.129 -0.702 -1.111 464.609 452.047 449.328
00:01:30 1 58.129 -0.714 -1.111 464.609 452.266 449.406
00:02:00 1 58.129 -0.708 -1.105 464.609 452.344 449.406
00:02:30 1 58.129 -0.708 -1.111 464.609 452.562 449.625
00:03:00 1 58.129 -0.708 -1.111 464.609 452.562 449.625
00:03:30 1 58.129 -0.708 -1.111 464.609 452.406 449.766
00:04:00 1 58.129 -0.708 -1.117 464.609 452.625 449.516
00:04:30 1 58.129 -0.708 -1.111 464.609 452.625 449.625
00:05:00 1 58.129 -0.708 -1.111 464.609 452.625 449.656
00:05:30 1 58.129 -0.708 -1.105 464.609 452.562 449.812
00:06:00 1 58.129 -0.702 -1.099 464.609 452.453 449.656
00:06:30 1 58.129 -0.690 -1.111 464.609 452.484 449.547
00:07:00 1 58.129 -0.708 -1.105 464.609 452.266 449.438
00:07:30 1 58.129 -0.708 -1.099 464.609 452.000 449.406
Figure 4: Data from the monitoring system: time series of temperature, pressure,
displacement and strain measurements
Figure 5: Displacements in z-direction as calculated by different tools for the same piping
system in the selected example
-40
-30
-20
-10
0
10
20
30
40
Z-d
isp
lac
em
en
t [
mm
]
Nodes along the piping system M3
Revision 3 - normal operation + friction
ALGOR PipePlus
ANSYS
ROHR 2

SafeLife-X
page 19
Figure 6: Displacement monitoring (monitoring in z-direction, position 32 as in Figure 8,
straight lines displacements for design conditions, triangles displacements
calculated for the measured operating conditions): overall result showing that measured displacements are within design limits
Measured strains
-0.2
0
0.2
0.4
0.6
0.8
1
1.2
Ju
ly-9
5
Ju
ly-9
6
Ju
ly-9
7
(%)
Außen längs
Innen längs
Innen Umfang def
BerechneteElastische Dehnung(Mittelwert)
Figure 7: Measured strains using high-temperature capacitive strain gauges (position 36 in
Figure 8, out- and inside, hoop, elastic strain)
Action 7: Monitoring strains
Action 8: TRD and RLA calculations performed with advanced monitoring data
(displacements and strains)
Comparing the results of damage accumulation and remaining life consumption for the limited time of strain monitoring (approx. 2 years) one can see that in the given example a
difference of over 100% was registered (Figure 9).
-25
-20
-15
-10
-5
0
5
(mm
)Z-R. Kesselhaus
Z - ROHR2 / Algor (alte Geom.) -Ausleg.
Z - Algor (neue Geom.) - Ausleg.
Z - Algor (neue Geom.) - real

SafeLife-X
page 20
Monitoring of:displacements
and
strains
"Maschinenhaus"
"Kesselhaus"
Figure 8: Positions of strain and displacement transducers on the piping (here: the finite
element model used for non-linear analysis creep analysis in ANSYS)
Figure 9: Influence of system stresses onto life exhaustion (Ez - creep) –according to TRD,
ANSYS with and without system stresses
0 %0,05 %
0,1 %0,15 %
0,2 %0,25 %
0,3 %0,35 %
0,4 %0,45 %
0,5 %
Pos. 19(RB36)
Ez

SafeLife-X
page 21
Conclusions drawn from the selected application case 1. Life monitoring is essential for the overall life management.
2. Besides the conventional monitoring based on global operational parameters, concentrated "targeted" monitoring should be made.
3. Selection of locations can be made according to experience (e. g. case histories)
and results of global monitoring.
4. Monitoring of displacements and strains is essential for the better assessment of actual stress states and, consequently, life assessment.
5. Monitoring of displacements and strains can achieve its goal only if supported by
powerful analysis tools, including the non-linear finite element analysis.
6. Monitoring as such just one of the elements of the comprehensive life assessment
and management – only a system like ALIAS integrating parallel analyses and
enabling permanent cross-checking and linking of monitoring results with other elements (e.g. NDT results and/or case histories and/or detailed off-line analyses),
can assure the confidence needed: (a) that no "false alarms" are triggered, and
(b) that no real damage location is overseen. Consequences of both can obviously be very serious.
7. Due to many uncertainties involved and the exponential character of the damage
development processes it is essential to include risk assessment into the overall
evaluation.
8. Virtually every monitoring solution is specific. It is, therefore, difficult to look for a
monitoring system that would "fit all". Flexible and modular solutions are required
instead (like ALIAS), provided that the corresponding configuration management is available.
Pos. 19
(RB36)
0 %
10 %
20 %
30 %
40 %
50 %
60 %
70 %
80 %
TRD 1 fiktiv
(23 Feb - 19 Apr 1
995)
TRD 2 fiktiv
(19 Apr - 24 Jul 1995)
TRD 3 fiktiv
(25 Jul - 31 Dec 1995)
TRD 4 fiktiv
(01 Jan - 30 Jun 1996)
TRD 5 fiktiv
(01 Jul - 31 Dec 1996)
TRD 6 fiktiv
(01 Jan - 30 Jun 1997)
Exhaustion creep
Exhaustionfatigue
Total cumulative
exhaustion
Figure 10: From monitoring data (Figure 4), over single RLA calculations, to the overview of damage development – 60% TRD-limit indicated

SafeLife-X
page 22
Figure 11: Linking NDT-data (replica) to RLA-calculations in ALIAS

SafeLife-X
page 23
3 Knowing the problem causes: RCFA and the Logic of Aging Damage Identification
Root Cause Failure Analysis (RCFA) is an important part of proactive maintenance strategies,
Reliability Centered Maintenance procedures and Asset Integrity Management. It is a
structured process which can aid in resolving problems that affect plant performance, by uncovering the causes of undesirable events. It should not be an attempt to apportion blame
for the incident. This must be clearly understood by the investigating team and those
involved in the process.
RCFA applies advanced investigative techniques to discover the root causes of incidents, and
allows us to apply the required correctives. By applying RCFA, we can reduce or eliminate
early life failures in components, extend the lifetime of equipment and minimize
maintenance. A properly performed analysis should yield the following information:
Why the incident or failure occurred
How any future failures can be prevented by:
o Design modifications
o Changes to procedures
o Changes to operating parameters
o Training of operators/staff
o Verification that repaired or replaced equipment is free of defects which may
cause a shorter service life, which can include adherence to acceptance
procedures and identification of additional factors which can adversely affect
service life
o Implementation of mitigating actions for the point above
Effective use of RCFA requires discipline and consistency. Each investigation must be
thorough and each of the steps defined must be followed. The general steps for performing
and documenting an RCFA based corrective action include the following:
A definition of the problem or a description of the event to be prevented in the
future. The qualitative and quantitative properties of the consequences of failure
should be included. In addition, reasonable targets should be set for the action, i.e.
reducing the risk of future failure to an acceptable level, as opposed to preventing all
future failures.
Gathering and preserving data related to the problem, and ordering it according to a
timeline of events leading to the ultimate failure event. For every behavior,
condition, action, and inaction in the timeline that deviates from regular operating
parameters or procedures, it should be specified what should have been done, and
how it differs from what was done.
Identification of the causes associated with each step in the sequence towards the
defined problem or event, by asking “Why” questions. In this case, "Why" means
"What were the factors that directly resulted in the effect?"
Divide the causes into factors that relate to an event in the sequence and root
causes. Root causes are those, which if eliminated, can be agreed to have
interrupted that step of the sequence chain.
Identification of all other factors which can be designated as "root causes." In the
case of multiple root causes, all root causes should be discovered for later optimum
selection.
Identification of the corrective action(s) that would prevent the recurrence of each
harmful effect. Check whether the pre-implementation of said corrective actions
would have reduced or prevented the specific harmful effects.
Identification of solutions that would prevent recurrence of undesirable events with
reasonable certainty. The proposed solutions must be within the institution's control,
meet its goals and not introduce other new, unforeseen problems.
Implementation of the recommended corrections.
Monitoring the implemented solutions to ensure effectiveness.
A number of named analysis techniques are commonly used within RCFA, including:
Step Method

SafeLife-X
page 24
Fault Tree Analysis
Cause and Effect Analysis (Fish Bone)
Bow-tie
Event Tree
Interview
Why-why
Each of the techniques has its own strengths and weaknesses, depending on the situation in
which it is applied. In the following section, four of these techniques are shortly described.
General Analysis Techniques
According to ISO 31010, a number of analysis tools and techniques, including some RCFA techniques are listed according to their overall applicability for risk assessment. This table is
provided below, with the importance of the respective techniques rated from most important
(***) to least important (*). The analysis techniques belonging to RCFA are shaded in this table.
Table 2 – Applicability of tools used for risk assessment according to ISO 31010
Tools and techniques
Risk assessment process
Importance Risk
Identification
Risk analysis
Risk
evaluation Consequence Probability Level of
risk
Brainstorming SA1) NA2) NA NA NA ***
Structured or semi-structured
interviews
SA NA NA NA NA **
Delphi SA NA NA NA NA *
Check-lists SA NA NA NA NA ***
Primary hazard analysis SA NA NA NA NA ***
Hazard and operability
studies
(HAZOP)
SA SA 3) A A *
Hazard Analysis and
Critical Control
Points (HACCP)
SA SA NA NA SA *
Environmental risk
assessment SA SA SA SA SA *
Structure « What if? »
(SWIFT) SA SA SA SA SA *
Scenario analysis SA SA A A A ***
Business impact
analysis A SA A A A ***

SafeLife-X
page 25
Root cause analysis NA SA SA SA SA ***
Failure mode effect analysis
SA SA SA SA SA ***
Fault tree analysis A NA SA A A ***
Event tree analysis A SA A A NA **
Cause and consequence
analysis A SA SA A A ***
Cause-and-effect
analysis SA SA NA NA NA **
Layer protection
analysis (LOPA) A SA A A NA **
Decision tree NA SA SA A A **
Human reliability
analysis SA SA SA SA A **
Bow tie analysis NA A SA SA A ***
Reliability centered
maintenance SA SA SA SA SA ***
Sneak circuit analysis A NA NA NA NA *
Markov analysis A SA NA NA NA *
Monte Carlo simulation NA NA NA NA SA **
Bayesian statistics and
Bayes Nets NA SA NA NA SA **
FN curves A SA SA A SA *
Risk indices A SA SA A SA ***
Consequence/probability matrix
SA SA SA SA A ***
Cost/benefit analysis A SA A A A ***
Multi-criteria decision
analysis
(MCDA)
A SA A SA A ***
1) Strongly applicable.
2) Not applicable.
3) Applicable.

SafeLife-X
page 26
ISO 31010 also provides a list of attributes for the above listed risk assessment tools,
including the RCFA techniques. In the following table, the attributes of the RCFA-specific
techniques are given:
Table 3 – Attributes of (RCFA-specific) risk assessment tools according to ISO 31010
Type of risk
assessment
technique
Description
Relevance of influencing factors
Can provide
Quantitative
output Resources
and capability
Nature and
degree of uncertainty
Complexity
SCENARIO ANALYSIS
Root cause
analysis (single
loss analysis)
A single loss that has occurred is
analyzed in order to understand
contributory causes and how the system or process can be
improved to avoid such future
losses. The analysis shall consider what controls were in place at the
time the loss occurred and how controls might be improved
Medium Low Medium No
Fault tree
analysis
A technique which starts with the
undesired event (top event) and determines all the ways in which it
could occur. These are displayed graphically in a logical tree
diagram. Once the fault tree has
been developed, consideration should be given to ways of
reducing or eliminating potential causes / sources
High High Medium Yes
Event tree
analysis
Using inductive reasoning to
translate probabilities of different initiating events into possible
outcomes
Medium Medium Medium Yes
Cause/ consequence
analysis
A combination of fault and event tree analysis that allows inclusion
of time delays. Both causes and consequences of an initiating
event are considered
High Medium High Yes
Cause-and effect analysis
An effect can have a number of contributory factors which may be
grouped into different categories. Contributory factors are identified
often through brainstorming and
displayed in a tree structure or fishbone diagram
Low Low Medium No
FUNCTIONAL ANALYSIS
FMEA and FMECA
FMEA (Failure Mode and Effect Analysis) is a technique which
identifies failure modes and mechanisms, and their effects.
There are several types of FMEA:
Design (or product) FMEA which is used for components and
products, System FMEA which is used for systems, Process FMEA
which is used for manufacturing

SafeLife-X
page 27
and assembly processes, Service
FMEA and Software FMEA. FMEA may be followed by a criticality
analysis which defines the significance of each failure mode,
qualitatively, semi-qualitatively, or
quantitatively (FMECA). The criticality analysis may be based
on the probability that the failure mode will result in system failure,
or the level of risk associated with
the failure mode, or a risk priority number
In this section, four general analysis techniques are shortly presented:
Failure Mode and Effect Analysis (FMEA)
Fault Tree Analysis (FTA)
Cause and Effect Analysis
Sequence of Events Analysis
Failure Mode and Effects Analysis (FMEA) was one of the first systematic techniques for
failure analysis. It was developed by reliability engineers in the 1950s to study problems that might arise from malfunctions of military systems. An FMEA is often the first step of a
system reliability study. It involves reviewing as many components, assemblies, and
subsystems as possible to identify failure modes, and their causes and effects. For each
component, the failure modes and their resulting effects on the rest of the system are recorded in a specific FMEA worksheet. There are numerous variations of such worksheets.
An FMEA is mainly a qualitative analysis.
Fault tree analysis (FTA) is a top down, deductive failure analysis in which an undesired state of a system is analyzed using Boolean logic to combine a series of lower-level events. This
analysis method is mainly used in the fields of safety engineering and reliability engineering
to understand how systems can fail, to identify the best ways to reduce risk or to determine (or get a feeling for) event rates of a safety accident or a particular system level (functional)
failure. FTA is used in the aerospace, nuclear power, chemical and process, pharmaceutical,
petrochemical and other high-hazard industries; but is also used in fields as diverse as risk factor identification relating to social service system failure.
Cause-and-effect analysis is a graphical approach to failure analysis. This also is referred to
as fishbone analysis, a name derived from the fish-shaped pattern used to plot the
relationship between various factors that contribute to a specific event. Typically, fishbone analysis plots four major classifications of potential causes (i.e. human, machine, material,
and method) but can include any combination of categories.
Sequence of events analysis uses a sequence of events diagram (Figure 14) from the start of an investigation and helps the investigator organize the information collected, identify
missing or conflicting information, improve his or her understanding by showing the
relationship between events and the incident, and highlight potential causes of the incident.
Failure Mode and Effects Analysis (FMEA)
A failure mode and effects analysis (FMEA) is a design-evaluation procedure used to identify
potential failure modes and determine the effect of each on system performance. This
procedure formally documents standard practice, generates a historical record, and serves as a basis for future improvements. The FMEA procedure is a sequence of logical steps, starting
with the analysis of lower-level subsystems or components.
Main steps in FMEA are:
1. Identification of failure modes
2. Isolate failure cases
3. Predict failure effects
4. Determine corrective actions
5. Optimize the corrective action decision based on other factors (technical feasibility)

SafeLife-X
page 28
6. Select one of the options:
a. Eliminate failure effects
b. Reduce failure effects
c. Accept failure effects
Some of the advantages that FMEA provides are:
Improving the quality, reliability and safety of a product/process
Improving company image and competitiveness
Reducing system development time and cost
Collecting information to reduce future failures, capturing engineering knowledge
Early identification and elimination of potential failure modes
Reducing the possibility of same kind of failure in future
Reducing impact on company profit margin
While FMEA identifies important hazards in a system, its results may not be comprehensive and the approach has limitations. If used as a top-down tool, FMEA may only identify major
failure modes in a system. Fault tree analysis (FTA) is better suited for "top-down" analysis.
When used as a "bottom-up" tool FMEA can augment or complement FTA and identify many
more causes and failure modes resulting in top-level symptoms. It is not able to discover complex failure modes involving multiple failures within a subsystem, or to report expected
failure intervals of particular failure modes up to the upper level subsystem or system.
Additionally, the multiplication of the severity, occurrence and detection rankings may result in rank reversals, where a less serious failure mode receives a higher Risk Priority Number
than a more serious failure mode. The reason for this is that the rankings are ordinal scale
numbers, and multiplication is not defined for ordinal numbers. The ordinal rankings only say that one ranking is better or worse than another, but not by how much. For instance, a
ranking of "2" may not be twice as severe as a ranking of "1," or an "8" may not be twice as
severe as a "4," but multiplication treats them as though they are.
Fault-Tree Analysis
Fault-tree analysis is a method of analyzing system reliability and safety. It provides an
objective basis for analyzing system design, justifying system changes, performing trade-off
studies, analyzing common failure modes, and demonstrating compliance with safety and environment requirements. It is different from a failure mode and effect analysis in that it is
restricted to identifying system elements and events that lead to one particular undesired
event. FTA is a deductive, top-down method aimed at analyzing the effects of initiating faults and events on a complex system. This contrasts with failure mode and effects analysis
(FMEA), which is an inductive, bottom-up analysis method aimed at analyzing the effects of
single component or function failures on equipment or subsystems.
This technique is often combined with building of consequence tree on the other side, thus
allowing the creation of “bow-tie” model (Figure 12), where an adverse event is put in the
middle.
Some of the advantages/disadvantages of FTA are given below:
FTA is very good at showing how resistant a system is to single or multiple initiating
faults.
FTA considers external events, FMEA does not.
FTA is not good at finding all possible initiating faults. FMEA is good at exhaustively
cataloging initiating faults, and identifying their local effects.
FTA is not good at examining multiple failures or their effects at a system level.
Cause-and-Effect Analysis
Ishikawa diagrams (also called fishbone diagrams, herringbone diagrams, cause-and-effect
diagrams) are causal diagrams created by Kaoru Ishikawa (1968) that show the causes of a
specific event. Causes are usually grouped into major categories to identify the sources of variation. The categories typically include:
People: Anyone involved with the process
Methods: How the process is performed and the specific requirements for doing it,
such as policies, procedures, rules, regulations and laws

SafeLife-X
page 29
Machines: Any equipment, computers, tools, etc. required to accomplish the job
Materials: Raw materials, parts, pens, paper, etc. used to produce the final product
Measurements: Data generated from the process that are used to evaluate its quality
Environment: The conditions, such as location, time, temperature, and culture in
which the process operates
The advantages and disadvantages of this type of analysis are given below:
This technique of diagramming the potential causes of a specific event provides the structure
and order needed to quickly and methodically resolve problems.
This approach has one serious limitation. The fishbone graph (Figure 13) provides no clear
sequence of events that leads to failure. Instead, it displays all the possible causes that may
have contributed to the event. However, it does not isolate the specific factors that caused the event.

SafeLife-X
page 30
Figure 12: Bow-Tie model
Wrong chemical
composition
Defective manufacturing /
repairs e.g. heat treatment
Long term
service
(overheating
excursions)
In-service
degradation
and/or
embrittlement
Manufacturing /
repair defects
High number of
start-ups
Fast/severe
operational cycles
Low material
strength /
toughness
In-service creep
– fatigue damage
(cracking)
Low safety factors
Excessive original
allowable stress (change
in standards)
Stress raising, local
geometry
High stresses
Failure cause #1 / damage type IC (material weakening /
embrittlement)
Failure cause #2 / damage type II.B (micro-cracking /
cracking)
Failure cause #3
In-service creep-
fatigue cracking of
the header, loss of
pressure (steam),
containment
Explosive shell
failure
End cap failure
Steam leakage
Lost function: ALL
Lost function: ALL
Lost function: ALL
P1
P2
P3
- plant shutdown (loss of
production)
- repair cost (header +
consequential damage)
Personal injury
P11
P12
- plant shutdown (loss of
production)
- repair cost (header +
consequential damage)
Personal injury
P21
P22
- plant shutdown (loss of
production)
- repair cost (header +
consequential damage)
Personal injury
P31
P32
Damage mechanism Failure cause / type of damage
CAUSE TREE Problem/issue,
resulting failure, main
event
EVENT / CONSEQUENCE TREE
Failure modes Consequences

SafeLife-X
page 31
Figure 13: Fishbone diagram

SafeLife-X
page 32
SEQUENCE-OF-EVENTS ANALYSIS
Sequence of events analysis is useful for:
straightforward problems that have a known sequence of events leading to the
failure event.
complex problems where combinations of root causes exist and the approach is to
determine which cause(s) must be eliminated to break the chain.
establishing timelines and identifying which events require some other analysis tool
such as a logic tree.
It requires an understanding of what is controllable, and the resulting outcome of the
control, action, or response.
In the case of occurrence of an adverse event, the following steps have to be taken:
1. Identify WHAT happened – clearly define the specific event, failure or incident,
interview/talk to all personnel directly or indirectly involved in the incident
2. Identify WHERE it did happen – the specific machine, location, system, and try to
find out whether such an event has already occurred in the past on the same or
similar unit in the plant/company
3. Identify WHEN it did happen – the time and sequence of the events that were bound
to the event (before AND after)
4. Identify WHAT CHANGED – whether there was any change in the process, product, procedures, etc.
5. WHO was involved – directly linked to the point 1
6. What is the IMPACT – quantify the damage, injuries, fatalities, reliability, financial
7. Will it happen AGAIN – Determine the probability of recurrence of the similar event
8. Can the recurrence be PREVENTED – determine if the measures exist that might
prevent the event from happening again in the future; alternatively try to investigate
if the effects might be eliminated or kept under control

SafeLife-X
page 33
Figure 14: Sequence of events diagram

SafeLife-X
page 34
Common causes of failures
The table below gives a list of some typical causes of failures. Some of the information in this
table can be used during the construction of a cause and effect diagram.
Table 4: Common causes of failures
1. External causes
a. Earthquake
b. Harsh weather
c. Terrorist attack
d. Incident staring outside the
plant/unit boundary
e. Other environmental influences
2. Equipment failure
a. Misapplication
Operation outside design condition
Poor design practices
Poor procurement practices
b. Operating practices
Procedures inadequate
No adherence to procedures
Inadequate training
No enforcement
c. Maintenance practices
Procedures inadequate
No adherence to procedures
Frequency inadequate
Lack of skills
d. Age
Normal wear
Reached useful life
Accelerated wear
3. Procedures
a. Not used
No procedure
Difficult to use
Not available
Not enforced
b. Inadequate
Facts or methods wrong
Poor organization
Wrong revision used
Situation not covered
c. Followed incorrectly
Format confusing
Excessive references
Too technical
4. Training
a. No training
Task not analyzed
Decided not to train
No learning objective
Training not enforced
b. Inadequate
No learning objectives
No lesson plan
Poor instruction
No practical application
c. Not learned
Retention lacking
Too technical
Did not attend the course
Mastery not verified
5. Supervision
a. Preparation
No preparation
No work packages
Lack of pre-job training
Inadequate scheduling
b. Selection of workers
Not qualified
Fatigued
Upset/personal problems
Substance abuse
Poor team selection
c. Supervision during work
No supervision
Poor crew teamwork
Too many other duties
6. Communication
a. No communication
No method available
Late communication
7. Human engineering
a. Worker interface
Arrangement/ placement
Excessive lifting/twisting

SafeLife-X
page 35
Lack of report format
b. Turnover
No standard process
Turnover process not used
Turnover process inadequate
c. Misunderstanding
No standard terms
Repeat back not used
Long messages
Noisy environment
Tool/instruments
Controls/displays
b. Work environment
Housekeeping
Ambient environment
Cramped spaces
c. Complex systems
Knowledge-based decisions required
Monitoring too many parameters
Inadequate feedback
8. Management system
a. Policies and procedures
No standards
Not strict enough
Confusing or incomplete
Technical errors
No drawings or prints
b. Standards not used
No communication
Recently changed
No enforcement
No way to implement
No accountability
c. Employee relations
No audits/evaluations
Lack of audit depth
No employee communication
No employee feedback
9. Quality Control
a. No inspection
No inspection required
No hold point
Hold point ignored
b. Inadequate quality control
Poor instructions
Poor techniques
Inadequate training/skills
RC(F)A Decision making
In most of the cases the equipment failures might be the result of any combination of the factors listed above.
Some of the issues are to be solved on the higher/managerial levels, such as
environmental/external, managerial or human related. Nevertheless, the appropriate source
of the problem should be identified and recommendations given.

SafeLife-X
page 36
Figure 15: Damage types appearing as failure or root failure causes in RIMAP
For the technical/equipment related issues, it is important to perform the maintenance strategy decision making process, illustrated in Figure 16 below:
Failure cause or Root cause
Material damage related
problems
I. Corrosion, erosion, environment related damage
I.A Volumetric loss of
material on surface
I.B Cracking (on surface
mainly)
…
II. Mechanical or thermo-mechanical loads related
to:
II.A Volumetric loss of material on surface
II.B Cracking (on surface mainly)
…
III. Other structural damage mechanisms
IV. Fouling / Deposits
IV.A Deposits, Fouling with out fluid disturbances
…
V. Fluid flow disturbances
VI. Vibration
VII. Improper dimensioning, improper clearances
VIII. Man made disturbances
X.B Failed to start (FTS)
X.C Failed while running (FWR)
Disturbances, deviations, function related problems
IX. Fires, explosions, similar
X. Damage and/or loss of function due to other cause
X.A External leakage (EXL)
X.D Overheated (OHE)
X.E Other (OTH)

SafeLife-X
page 37
Can failure cause be
identified and is
elimination clearly
cost effective?
Is failure risk
low for safety (incl.
environment)?
Is failure risk
low for production or
follow cost?
Is PM more cost-
effective than corrective
maintenance?
Is operational
maintenance applicable
and effective?
Does operational
maintenance alone
fulfill requirements for
preventive maintenance?
Is failure mechanism/
cause known and
detectable to
Operator Technician/
Responsible Person?
Is development of
failure mechanism
detectable by
a. NDT?
b. Installed condition
monitoring methods?
c. Analysis of process
data
Can hidden failure
be detected by
scheduled tests or
inspections?
Has component
predictable age?
Implement:
- procedures
- modification
- oper. conditions
Implement:
- modification
- oper. procedure
- task combination
Condition Based
Maintenance, NDT
Routine
Maintenance
Corrective
Maintenance
Cause, Criticality
and Cost
Efficiency
Operational
Maintenance
Failure
Detectability
Failure
Characteristic Strategy
N
Y
Y
N
Y
Y
N
Y
Y
N
Y
Y
NY
N
Predetermined
Maintenance
Regular functional
testing/inspection
1
2
3
4
5
6
7
8
9
10
11
12
13
14
15
16
17
N
N
N
N
Y
Figure 16: Maintenance strategy decision making

SafeLife-X
page 38
Logic of aging damage identification
This chapter considers the systematics, detection and analysis of damage in power plant
systems and components subject to RBI/RBLM analysis. The chapter is adapted from the RIMAP Application Workbook for Power Plants and references to the CEN CWA 15740
Guideline provided in this deliverable, in Annex 2.
The consideration of damage follows the flowchart shown in Figure 17.
Components
Considered
Damage appeared
(symptoms)
Decision which inspection
methods according to
symptoms
Apply the inspection
methods and assess their
appropriateness/reliability
for the needs of
RBI/RBLM
Analyze damage and its
possible propagation
Det
erm
ine
mea
sure
s in
monit
ori
ng/i
nsp
ecti
ons/
anal
ysi
s
for
init
ial,
pre
-sym
pto
m
appea
rance
mea
sure
s Operating loads
Figure 17: Possible way of considering damage
Damage systematics
Based on the different damage mechanisms considered in the approaches of others (e.g.
VDI, API) a new approach was proposed in RIMAP. The damage systematics in RIMAP are
shown in Table 5.

SafeLife-X
page 39
Table 5 - Types of damage and their specifics mechanisms
What type of damage How to look for it Measure of uncertainty/risk for selected/preferred method1
Identifier and Type of damage
Damage specifics, damage mechanism best POD2 most cost effective
selected method
POD for defect size of or size for FCP6;
comments,
examples 1 mm 3 mm 90% POD
I. Corrosion/erosion/environment related damage, equating or leading to:
I.A Volumetric loss of material on
surface (e.g.
thinning)
I.A1 General corrosion, oxidation, erosion, wear solid particle
erosion
DiM, VT, ET,
UT3
UT, (VT),
DiM UT 30÷70% 50÷90% 2 mm
I.A2 Localized (pitting, crevice or
galvanic) corrosion UT, DiM, ET VT, UT UT 30÷70% 40÷90% 2 mm see 4
I.B Cracking (on surface, mainly)
I.B1 Stress corrosion (chloride, caustic, etc.)
MT, PT, ET MT, PT, ET ET max 85% 40÷90% 42 mm <5% 5
I.B2 Hydrogen induced damage (incl. blistering and HT hydrogen attack)
UT, MT, PT, ET
MT, PT6, MT7 UT na na na na
I.B3 Corrosion fatigue MT, PT, ET, VT
MT, PT, UT UT 80÷96%8 86÷98%9
50÷99%12,10 95÷99%,14
31 mm12,11
0.80.4 mm,12
I.C Material
weakening and/or embrittlement
I.C1 Thermal degradation (spheroidization, graphitization,
etc. incl. incipient melting)
MeT MeT MeT (microscopy) ~100% POD for cracks > 1 mm, 90% POD crack
ca. 0.05 mm; main "reliability related problems" linked to wrong sampling, wrong preparation and wrong interpretation
of replicas (all numbers are very rough “guesstimates”) I.C2 Carburization, decarburization,
dealloying MeT MeT MeT
1 if not mentioned otherwise all based on re-assessment of data [27] 2 see Abbreviations in the main list of abbreviations 3 AE - acoustic emission; PT - penetrant testing; DiM - dimensional measurements; VbM - vibration monitoring; DsM – on-line displacement monitoring; StM - on-line strain monitoring; VT - visual
testing; ET – Eddy current testing; UT- ultrasonic testing; VTE - visual testing by endoscope; MeT - metallography, including RpT (replica technique); MST - material sample testing; na - not applicable 4 the estimate can be affected significantly by local effects (e. g. small-scale pits can remain completely undetected) 5 ET for non-ferromagnetic materials, sample results in [27] 6 surface, also 7 subsurface 8 crack length 9 crack depth 10 for welds as low as 20% 11 usually more than 5 mm for welds or steels 12 can be more than 5 mm for welds

SafeLife-X
page 40
What type of damage How to look for it Measure of uncertainty/risk for selected/preferred method1
Identifier and Type of
damage Damage specifics, damage mechanism best POD2
most cost
effective
selected
method
POD for defect size of or size for FCP6; comments,
examples 1 mm 3 mm 90% POD
I.C3 Embrittlement (incl. hardening,
strain aging, temper embrittlement, liquid metal embrittlement, etc.)
MST MST MST na na na
II. Mechanical or thermomechanical loads related, leading to:
II.A Wear II.A1 Sliding wear VT, DiM, ET VT, UT
II.A2 Cavitational wear
II.B Strain /
dimensional
changes / instability /
collapse
II.B1 Overloading, creep,
DiM DiM DiM na na na
required
resolution
0.1 mm or
0.5 %
II.B2 Handling damage
II.C Microvoid
formation
II.C1 Creep MeT (UT), MeT
II.C2 Creep-fatigue
II.D Microcracking,
cracking
II.D1 Fatigue (HCF, LCF), thermal
fatigue, (corrosion fatigue) UT, (MT/PT),
ET, VT MT/PT
PT max 90% 20÷90% 1.5÷6.5 mm 13
II.D2 thermal shock, creep, creep-fatigue
MT 5÷90% 50÷90% 2.5÷10 mm 14
II.E Fracture II.E1 Overloading VT, DiM VT VT
na na na analysis of
causes II.E2 Brittle fracture
13 typical range; in extreme cases 0.5÷12 mm or more; more uncertainties for welds – but cracks transverse to welds detected easier than the longitudinal ones 14 typical range; in extreme cases 1÷18 mm or more; applicable for ferromagnetic materials (steels)

SafeLife-X
page 41
WHERE to look for (inspect / monitor) for which type of
damage
Generally, types of damage defined RIMAP can be found on a very large number of places in
a plant depending on its construction, applied materials, operating conditions, etc. For the purpose of a general overview, data on typical locations in different types of plants are given
in Table 6.

SafeLife-X
page 42
Table 6: Classification of type of damage vs. systems/components in different types of plants (FPP – fossil power plants, NPP – nuclear power plants, PrP –
process plants; weld critical in all components)
Type of damage Where to look for it
(typical sample components/materials)
Iden-
tifier Type of damage
Damage specifics,
damage mechanism
FPP - steam
turbine
FPP - gas
turbine NPP PrP
I. Corrosion/erosion/environment related damage, equating or leading to:
I.A1
Volumetric loss of material
on surface (e.g. thinning)
General corrosion, oxidation, erosion, wear
solid particle erosion
boiler and superheater tubing, LP blading, and
shaft pumps, valves
blading, com-pressor,
combustor
pump casings, LP turbine casings,
condensers, and
shaft
Heat exchangers, pipes, bends,
pumps, reactor
vessels
I.A2 Localized (pitting, crevice or
galvanic) corrosion
Boiler tubing, heat
exchangers, condensers, LP-blades,
IP-/ LP-shaft
blading Heat exchangers,
steam generators
Heat exchangers,
reactor vessels, pipes
I.B1
Cracking (on surface, mainly)
Stress corrosion (chloride,
caustic, etc.)
steam drums, LP
turbines (disks, blade
attachments and blades), bolts
stainless piping,
LP turbines
(disks, blade attachments and
blades), bolts
stainless piping,
reactor vessels
I.B2 Hydrogen induced damage
(incl. blistering and HT
hydrogen attack)
waterwalls pressurizer crackers,
columns,
reformers
I.B3 Corrosion fatigue waterwalls, drums, dissimilar welds, LP-
blading
blading nozzles, safe-end, sleeves,
LP-blading
dissimilar welds
I.C1
Material weakening and/or
embrittlement
Thermal degradation
(spheroidization,
graphitization, etc. incl. incipient melting)
superheaters, hot
headers, steam lines,
casings, bolts
combustors,
hot blading,
transition ducts
heat exchangers,
reformers,
crackers, pipes, reactor vessels

SafeLife-X
page 43
Type of damage Where to look for it
(typical sample components/materials)
Iden-
tifier Type of damage
Damage specifics,
damage mechanism
FPP - steam
turbine
FPP - gas
turbine NPP PrP
I.C2 Carburization,
decarburization, dealloying
reformers,
crackers
I.C3 Embrittlement (incl. hardening, strain aging,
temper embrittlement,
liquid metal embrittlement,
etc.)
forgings, bolts, shafts disks, cladding reactor pressure vessel
forgings, hot vessels and
piping
II. Mechanical or thermomechanical loads related, leading to:
II.A Wear Sliding wear, cavitational
wear
pumps, valves, con-
densers, sealing, blading, bearings
blade tips,
seals, duct connections
pumps, valves,
condensers, bearings
pumps, valves,
condensers
II.B Strain / dimensional changes Overloading, creep, handling damage
hot steam lines, piping, T-Y pieces, bored
rotors, casings (casing
joint plane)
blading fuel rod cladding hot piping, nozzles, T-Y
pieces
II.C Microvoid formation Creep, creep-fatigue hot steam lines (all, incl. welding), headers,
bored rotors,
hot blading, combustors,
transition ducts
hot piping, reformer tubes,
reactor vessels
II.D Microcracking, cracking Fatigue (HCF, LCF), thermal
fatigue, (corrosion fatigue),
thermal shock, creep, creep-fatigue
rotors, bolts, welds in
heavy-section pipes,
valve internals, turbine shaft and blading,
casings
disks, blading,
combustors,
burner rings
thermal sleeves,
safe-end. valve
internals, valves, turbine shafts
and casings
rotating ma-
chinery
II.E Fracture Overloading, brittle fracture,
foreign object damage
rotors, retaining rings,
blading, superheater
tubes, gears, disks
blading
(foreign-object
damage), gears
rotors, disks vessel failures,
pipe bursts,
reformer tubes

SafeLife-X
page 44
HOW to look for (inspect / monitor) for which type of damage
For the decision which method to apply and for inspection and what kind of result with witch
level of confidence can be expected, the data in Table 13 (CEN CWA 15740) can be used.
For early discovery of damage, or decision making on where to look for possible damage
Table 7 can be used.

SafeLife-X
page 45
Table 7: Suggested measures for pre-symptom appearance measures leading to early discovery of damage in plants
Indicators coming from: Typical (specific)
indicators:
Suggested approach to
monitoring
Suggested approach to
intermittent inspections
Suggested approach to
engineering analysis
Manufacturing, assembly
and quality control (e.g. acceptance records)
deviations from
specifications regarding design / dimensions
review of design and QC
documents
consider additional
engineering analysis
deviations from
specifications regarding integrity (e.g. broken parts),
excessive defects
review QC documents consider additional
engineering analysis
deviations from
specifications regarding
materials (e.g. incorrect or
defective material)
review design and QC
documents
chemical analysis
other deviations from
specifications regarding
review design and QC
documents
Operation / condition
monitoring
temperature: too high / too
low, too high/low rate of increase/decrease
consider additional
monitoring measures
consider additional
inspections
consider additional
engineering analysis
pressure/loading: too high,
too high/low rate of increase/decrease
consider additional
monitoring measures
consider additional
inspections
consider additional
engineering analysis
vibrations: too high amplitude, noise, other
abnormal states
consider additional monitoring measures
consider additional engineering analysis
flow: leakage, blockage, slagging, etc.
consider additional monitoring measures
consider additional inspections
other operational alarms consider additional monitoring measures
consider additional inspections
consider additional engineering analysis

SafeLife-X
page 46
How to analyze and predict development of given types of
damage
Once when a given type of damage has been detected and/or supposed, the analysis of the
damage consists of:
• Quantification
• Component life consumption (remaining and consumed life), and
• Damage propagation
For the purpose of RBI/RBLM it is desirable that this analysis is done in a probabilistic way.
The methods suggested for the damage types are given in Table 8.

SafeLife-X
page 47
Table 8: Suggested methods for the analysis depending on damage types
Iden-tifier
Type of damage Damage specifics, damage mechanism
Methods of
analysis,
prediction
Precision of life assessment/prediction, comments
I. Corrosion/erosion/environment related damage, equating or leading to:
I.A1 Volumetric loss of
material on
surface (e.g. thinning)
General corrosion, erosion, wear GB, CoB, CbC
very low, guideline based solutions often very
conservative, prediction considered very satisfactory when in range minus 50%÷ plus 100%, often worse
results
I.A2 Pitting GB, CbC
I.A3 Localized (crevice, galvanic) CbC
I.B1
Cracking (on surface, mainly)
Stress corrosion DA, CbC
I.B2 Hydrogen induced (incl. blistering) GB
I.B3 Corrosion fatigue DA, CbC
I.C1
Material
weakening and/or
embrittlement
Thermal degradation (spheroidization,
graphitization, etc. incl. incipient melting)
MetC, RP
very low, guidelines and recommendations available
only for testing and, partly, interpretation, predictions
more qualitative than quantitative
I.C2 carburization, decarburization, dealloying MetC
I.C3 embrittlement (incl. hardening, strain
aging, temper embrittlement, etc.)
DA, CbC
II. Mechanical or thermomechanical loads related, leading to:
II.A Mechanical wear sliding wear, cavitational wear CbC as for I.C
II.B Strain /
dimensional
changes
overloading, creep
St, CoB, CbC
low, guideline/code based solutions often very conservative, prediction considered very satisfactory
when in range minus 15%÷ plus 30%, often worse
results, depending on e.g. temperature range and material properties

SafeLife-X
page 48
Iden-
tifier Type of damage Damage specifics, damage mechanism
Methods of analysis,
prediction
Precision of life assessment/prediction, comments
II.C
Microvoid
formation
creep, creep-fatigue
RP, AP, CD, HD,
CoB, MTh, XYZ, MetC
low, guideline/code based solutions often very
conservative, prediction considered very satisfactory
when in range minus 15%÷ plus 30%, often worse results, depending on e.g. temperature range and
material properties
II.D
Cracking fatigue (HCF, LCF), thermal fatigue,
(corrosion fatigue), thermal shock, creep DA, CoB, CbC
as for II.A, worse for complex loading mechanisms and (often) poorly known material properties
II.E Fracture Overloading, brittle fracture CoB, DA, CbC
AP – A-Parameter CD - Cavity-Density CoB - Code based (e.g. TRD) CbC - case-by-case
DA – Defect assessment HD - Hardness based MTh - Magnetite thickness MstC - based on metallographic classification/characterization
RP - Replica class based St - Strain-based analysis XYZ - other GB – guideline-based (e.g. EPRI, VGB, Nordtest)

SafeLife-X
page 49
4 Managing aging by reliability and risk-based methods: RCM and RBI
Maintenance strategies and concepts have evolved over the decades, as knowledge is
increased and technologies advance (Figure 18). The perception of the “right” type of
maintenance action has significantly changed over the previous decades. In the 1950s most maintenance actions were Event-based – the maintenance actions were of a corrective
nature, when equipment and machinery broke down. Maintenance was viewed as an
unavoidable cost which could not be managed.
Figure 18: Evolution of maintenance strategies
The 1960s saw a large number of operators of machinery and equipment switch over to
preventive maintenance programs. It was believed that some failures of mechanical
components were in direct relation to time in use, and this was based on physical wear or age-related fatigue characteristics. The idea was that preventive action could prevent some
breakdowns, and lead to cost savings over a long period of time. The biggest challenge was
determining the correct time to perform the maintenance, as little was still known about failure patterns and history.
In the 1970s and 1980s equipment was becoming increasingly more complex, and with no
clear dominant age-related failure mode. Under these conditions, the effectiveness of preventive maintenance actions was questions and the concerns of over-maintaining grew.
At this time, new predictive maintenance techniques emerged, and the emphasis gradually
shifted over to inspection and condition-based maintenance actions.
In the 1980s and 1990s, the train of thought evolved again, with the emergence of life-cycle engineering, with maintenance requirements already being taken into consideration during
the design and commissioning stages of equipment. Maintenance took an active role in
setting design requirements for installations, instead of just having to deal with built in characteristics. This again led to a new type of maintenance strategy – proactive
maintenance – where the underlying principle was to be proactive at earlier stages in order
to avoid later consequences.
Reliability- and risk-based maintenance concepts are centered around providing an optimized
maintenance program with an adequate mix of maintenance actions and policies selected to
increase uptime, extend the life cycle of the assets and ensure safe working conditions, while taking into consideration constrictions of time, budget and any other concerns (e.g.
Environmental legislation).
Reliability-Centered Maintenance (RCM)
Reliability-centered maintenance represents an optimum mix of reactive, time-based, condition-based and proactive maintenance practices. The basic application for each type of
strategy is shown in Figure 19 on the following page, where the respective strengths of each
individual approach are taken in order to increase facility reliability while minimizing costs.
RCM is an ongoing process that gathers data from operating systems’ performance and uses this data to improve and design future maintenance.
Event
based
Time
based
Condition
based
Reliability
basedRisk
based
1950 1960 1980 1990 1995

SafeLife-X
page 50
Reliability Centred Maintenance
Reactive Time Based (PM)Condition Based
(CBM)Proactive
Redundant Non-critical Small items Unlikely to fail
Failure pattern known
Subject to wear-out
Consumable replacement
Not subject to wear
PM induced failures
Random failure patterns
FMEA Acceptance
Testing RCFA Age exploration
RCFA – Root Cause Failure AnalysisFMEA – Failure Mode and Effects Analysis
Figure 19: The components of an RCM program
Several ways of implementing an RCM program exist. The program can be based on rigorous
Failure Modes and Effects Analysis (FMEA), with mathematically calculated likelihoods of
failure based on design or historical data, intuition, expert judgment or common sense, and/or experimental data and modelling. The approaches can be called Classical, Rigorous,
Intuitive, Streamlined or Abbreviated. The decision on the type of technique implemented is
left to the end user and should be based on:
Consequences of failure
Probability of failure
Availability of historical data
Risk tolerances
Availability of resources
Classical/Rigorous RCM
The benefits of classical or rigorous RCM are that it provides the most knowledge and data
regarding:
system functions
failure modes
maintenance actions addressing functional failures
of all RCM approaches. The Rigorous method should produce the most complete documentation.
The drawbacks of this approach are that it is based primarily on FMEA with little, if any,
analysis of historical performance data. This RCM approach is extremely labor intensive and often postpones the implementation of obvious condition monitoring tasks.
Classical/Rigorous RCM should be applied in the following situations:
When the consequences of failure can result in catastrophic risk in terms of health,
safety, environment and/or complete economic failure of the plant
The resultant reliability and associated maintenance cost is unacceptable after
performing a streamlined type FMEA
The equipment/systems are new to the organization and there is a lack of corporate
maintenance and operational knowledge on function and functional failures.
Streamlined/Intuitive/Abbreviated RCM
The benefits of the Streamlined approach are that it quickly identifies and implements, with minimal analysis, the most obvious, usually condition-based, tasks. This approach eliminates
the low value maintenance tasks based on historical data and input from Maintenance and

SafeLife-X
page 51
Operations (M&O) personnel. The idea is to minimize the initial analysis time in order to help
offset the costs of FMEA and condition monitoring development.
The drawbacks of this approach stem from the reliance on historical records and personnel knowledge, which can introduce errors into the process that may lead to missing hidden
failures with low probabilities of occurrence. This process also requires that at least one
individual possesses a thorough understanding of the various condition monitoring technologies – a heavier reliance on expert knowledge/judgment.
The Streamlined approach should be applied in the following situations:
The function of the equipment/systems is well understood
A functional failure of the equipment/system(s) will not result in a loss of life or
catastrophic impact on the environment or business of the plant
A more in depth description of RCM is given in Annex 1.
Risk Based Inspection and Maintenance (RBI)
Risk Based Inspection (RBI) represents an optimal maintenance concept, using risk as a
basis for prioritizing and managing the efforts of an inspection program. RBI can be applied
to examine equipment such as pressure vessels, piping and heat exchangers in industrial facilities.
In an operating plant, a large portion of the risk is associated with a relatively small number
of components, as shown in a figure obtained from an analysis of a large industrial boiler below (Figure 20). Using RBI, a prioritized inspection plan can be developed, which increases
the coverage of the high risk components while providing an appropriate effort on lower risk
equipment. This strategy allows for a more rational investment of inspection resources.
Inspections typically employ non-destructive testing (NDT).
Figure 20: Contribution of overall risk in the plant vs. number of components
RBI assists owners and operators to select appropriate and cost-effective maintenance tasks,
increase safety while potentially minimizing effort and cost, produce an auditable system, provide an agreed operating window and implement a risk management tool. The purposes
of RBI include:
Screen operating units of plants to identify areas of high risk
Provide a holistic approach to managing risks
Estimate a risk value associated with the operation of each equipment item in a
plant, based on a consistent methodology
Apply a strategy of performing the tasks needed for safeguarding integrity and
improving the availability and reliability of the plant by planning and executing the
needed inspections
Systematically manage and reduce the risk of failures

SafeLife-X
page 52
Provide a flexible technique able to continuously improve and adapt to changing risks
Provide an appropriate inspection program, ensuring that the inspection techniques
and methods consider the potential failure mechanisms
Prioritize the equipment in a plant based on the measured risk.
In RBI, the risk of the operating equipment is defined as a combination of two separate
terms: the likelihood or probability of failure and the consequence of failure.
𝑹𝒊𝒔𝒌 = 𝑷𝒓𝒐𝒃𝒂𝒃𝒊𝒍𝒊𝒕𝒚 𝒐𝒇 𝑭𝒂𝒊𝒍𝒖𝒓𝒆 × 𝑪𝒐𝒏𝒔𝒆𝒒𝒖𝒆𝒏𝒄𝒆 𝒐𝒇 𝑭𝒂𝒊𝒍𝒖𝒓𝒆
The probability of failure can be determined using applicable damage factors, a generic
failure frequency (GFF) and a management system factor.
𝑷𝑶𝑭(𝒕) = 𝒈𝒇𝒇 × 𝑫𝒇(𝒕) × 𝑭𝑴𝑺 *
Where:
gff represents the generic failure frequency, based on industry averages of
equipment failure.
FMS represents the management system factor which measures how well the
management and labor force of the plant is trained to handle the day to day
activities, as well as any emergencies that may arise due to an accident.
Df(t) represents the overall damage factor, which is a combination of the various
damage factors that are applicable to the particular piece of equipment being
analyzed.
The consequence of failure can include both a financial consequence (FC) and an area safety
consequence (CA). The consequence of failure, expressed in financial terms, is calculated as the combined values of the consequences for damage to the failed equipment, damage to
the surrounding equipment, loss of production, costs due to personnel injuries and damage
to the environment.
𝑪𝑨 = 𝐦𝐚𝐱(𝑪𝑨𝒆𝒒𝒖𝒊𝒑, 𝑪𝑨𝒑𝒆𝒓𝒔𝒐𝒏𝒏𝒆𝒍)*
𝑭𝑪 = 𝑭𝑪𝒄𝒎𝒅 + 𝑭𝑪𝒂𝒇𝒇𝒂 + 𝑭𝑪𝒑𝒓𝒐𝒅 + 𝑭𝑪𝒊𝒏𝒋 + 𝑭𝑪𝒆𝒏𝒗𝒊𝒓𝒐𝒏*
Where:
CAequip is the area consequence to surrounding equipment
CApersonnel is the area consequence to nearby personnel
FCcmd is the financial consequence to the failed equipment
FCaffa is the financial consequence to surrounding equipment
FCprod is the financial consequence due to production downtime
FCinj is the financial consequence due to personnel injury
FCenviron is the financial consequence due to environmental damage/cleanup
Risk analysis can range from qualitative, semi-quantitative to quantitative, with increasing
levels of detail and complexity. Qualitative risk analysis methods use broad categorizations
for probabilities and consequences of failure, and are based primarily on engineering judgment and experience. It is a fast approach which may be used to screen large numbers
of components quickly, but provides less detailed (and more conservative) results and relies
more heavily on expert judgment. Quantitative risk analysis is a detailed approach that quantifies the probabilities and consequences of probable damage mechanisms and identifies
and identifies and delineates the combinations of events that may lead to a severe event or
other undesired consequence, should they occur. Semi-quantitative risk analysis is, in terms of level of detail and complexity, between the qualitative and quantitative approaches.
When the owner/operator makes a decision to implement RBI, he can justify this decision to
regulators based on the work done by several industry committees and experts. Some examples of recognized international guidelines and standards for implementing and applying
RBI are listed below:
CEN CWA 15740:2008 Risk Based Inspection and Maintenance Procedures for
European Industry (RIMAP). This is a CEN Workshop Agreement document (CWA),
* Source: API581:2008

SafeLife-X
page 53
applicable to the entire European Union. The document is currently in the process of
transition to a PrEN, and thereafter to a full European Norm.
API RP 580:2009 Risk Based Inspection. This recommended practice, produced by
the American Petroleum Institute, represents a guideline for implementing RBI
program.
API RP 581:2008 Risk Based Inspection Technology. This recommended practice
provides detailed step by step instructions for performing RBI on a qualitative, semi-
quantitative and quantitative level.
DNV-RP-G101:2010 Risk Based Inspection of Offshore Topsides Static Mechanical
Equipment. This recommended practice describes a method for establishing and
maintaining a RBI plan for offshore pressure systems.
DNV-RP-G103:2011 Non-Intrusive Inspection. This recommended practice provides
guidance to operators for planning and justifying non-intrusive or non-destructive
inspection.
ASME-PCC3-2007 Inspection Planning Using Risk-Based Methods. This standard
presents risk analysis principles, guidance and implementation strategies applicable
to fixed pressure containing equipment and components.
A complete guideline for implementing RBI (CEN CWA 15740:2008 – RIMAP), including an example case is given in Annex 2.

SafeLife-X
page 54
5 Optimizing aging management: Aging Indicators, Risk Factors and KPIs
Aging-related Key Performance Indicators
In order to better manage the issues of aging, owners and operators can identify key
performance indicators (KPIs) associated with aging. These KPIs can be monitored to identify
how effectively the risks related to aging are being controlled.
The approaches for different types of plants and different industries may vary, and the
number and focus of the KPIs will therefore be different depending on the type of plant being
considered. A single universally fitting solution does not exist, and it is the responsibility of management to identify the KPIs which they wish to monitor in relation to aging issues at
their particular plant(s). Some example leading and lagging indicators are given below:
Leading Indicators
Number and frequency of planned inspections
Effectiveness (of scope/techniques) of planned inspections (with regards to POD of
damage/defects)
Number and frequency of reviews
Planned replacement schedules for components and systems
Planned number of tests done on safety critical equipment i.e. PSVs
…
Lagging indicators
Number of major failures of components and equipment.
Number of unplanned outages.
Number of uncontrolled inventory releases.
Number of revisions of maintenance activities
Number of outstanding inspection action items.
Number of alarms/operation outside of defined normal boundaries
…
For a more extensive and detailed overview of aging related leading and lagging KPIs, please
refer to Annex 3. A number of indicators related to aging, collected and compiled during the
iNTeg-Risk project are presented, with definitions and formulas.
A number of safety management and risk control systems can be modified an implemented
in order to better manage the aging of plants. The examples of these systems, and some
considerations related to each system, are given below:
Plant design and modification
An Asset Integrity Management Policy is communicated and understood at all levels.
Design standards and codes of practice are monitored, updated and understood to
recognize the potential effect of ageing.
Performance of assets are monitored and discussed at senior level (Improvements,
failures, anomalies etc.) to recognize a potential ageing issue.
Contractor and third party standards clearly defined and tested
Responsibilities and Communication
A clear organizational structure in place, with identified roles and responsibilities.
Clear internal and external routes of communication through regular
Engineering/Operational meetings, Contractor/Third Party Management meetings etc.
Procedures
Technical Safety Reviews on critical equipment.
Operational procedures that interface with Maintenance Management to avoid repeat
maintenance and inspection work.
Clear leading/lagging KPIs monitored on a regular basis to track performance.
Proactive approach to identifying potential incidents and near misses which may
identify ageing issues.

SafeLife-X
page 55
Risk Assessment/Management processes
Risk Assessment program related to the impact of failure and the effect of process
change
Hazard identification and fitness for service reviews to identify the effect of ageing
mechanisms.
Risk based inspection program identifying ownership and rational for change.
Accident/incident investigation procedures with clear action tracking and close out
procedures.
Management of Change procedures
A clearly defined Management of Change procedure.
Clear lines of responsibility and communication to agree and implement change.
Consideration of organizational change and its influence on systems and human
factors.
Maintenance Management Systems
A well-structured and understood Maintenance Management and Inspection System
that interfaces with operations.
Replacement policy in place for safety critical equipment.
Asset Integrity Management Systems
AIMS plan and procedures in place to identify safety critical equipment.
Clearly identified and accessible Asset Register documentation to ensure action is
taken at the correct intervals.
Reviews at clearly defined intervals to ensure correct data is maintained.
Training and Competence development
A competency development program for critical staff containing the ability to
recognize ageing mechanisms.
A structured training plan in place.
Job continuity plans to retain job knowledge and operational skills.
Audit, Review and Operational Inspection regimes
An audit program is in place to ensure all elements of a management system related
to the controlling of ageing plant and equipment issues are maintained.
An operational inspection regime which highlights the need to identify ageing
mechanisms.
Clearly developed corrective action plans.
Risk Factors and Indicators of aging
Various risk factors can contribute to the promotion or acceleration of degradation of plants and equipment, but by themselves, they are not sufficient for ageing to occur. These risk
factors can be specific scenarios, events or occurrences which can suggest that deterioration
is occurring or could occur in the future. Some aging-related risk factors are given in Table 9.
Table 9: Examples of aging-related risk factors
Risk factor Details
Equipment age The symptoms of ageing normally become more apparent with time, and older equipment may be expected to have more damage and
deterioration This is especially true with time-dependent damage
mechanisms, such as Creep.
Equipment age may not necessarily constitute a risk factor in some
cases. Older equipment that contained large design margins,
operated outside of regimes which promote certain types of damage or has simply been well maintained may be still in an early Stage of
life compared with newer equipment that has not been as well

SafeLife-X
page 56
managed or operates under more difficult regimes (regarding
damage initiation and propagation).
Old or outdated
materials of
construction
Modern steels are cleaner than steels produced prior to the 1970s.
The carbon level has dropped over time as a result of the use of
more modern production techniques. Older steels have a higher tendency of cracking as a result of welding. Sulphur and phosphorus
residuals in older steels can be up to 0.05%, whereas levels of
0.01% can now be obtained.
Low
temperature
operation
Depending on materials of construction, equipment operated at low
temperatures may face an increased risk of embrittlement and
brittle fracture, and needs to be assessed against this risk. Lack of
low temperature justification is a risk factor for such equipment.
Equipment designed
and manufactured to
old codes
Equipment designed and manufactured to superseded standards and
codes, may be more susceptible to ageing than more modern
equipment.
Design creep/fatigue
life or corrosion allowance utilized
Once the design creep or fatigue life or corrosion allowance is used
up, a thorough inspection and fitness-for-service assessment is normally required to extend life. These inspections may have to
include destructive testing.
Welding quality,
welding defects and
repairs
Poor quality of welding and joint design are key factors promoting the onset of ageing damage. Welding has improved markedly during
the last 40 years with better design, improved process control and
quality standards. Modern welding consumables can also reduce the potential for hydrogen cracking of arc welds. More effective
ultrasonic NDT methods have improved the ability to detect and size
weld flaws.
Unplanned shutdowns and recurring service
problems
Recurring problems during service can be an indication that conditions in the equipment are not optimized and may make it
prone to degradation. Good inventory control is important for
detecting these small but recurring faults.
Operation in corrosive
environments
A corrosive environment has the potential to cause corrosion to
exposed surfaces, if they are not properly protected. Attention
should be paid to crevices and stagnant areas and to regions of composition differences, such as at welds.
Some materials are susceptible to stress corrosion cracking in
specific environments.
Predictable
deterioration
Monitoring the extent of predictable deterioration (e.g. thinning
rate) through review of inspection reports and service history is
important for the determination of the rate of ageing of the
equipment.
Change of operating
conditions/service
A change of operating conditions of equipment can carry an
increased risk of ageing until service history or experience shows
otherwise.

SafeLife-X
page 57
External damage Surface impacts due to collisions with moving equipment or falling
debris can result in small defects. These defects can then act as initiators for mechanisms such as fatigue or corrosion.
Thermal and fire damage can have an impact on the crystal
structure of a material, causing it to lose strength, toughness or corrosion resistance.
Poor condition of
paint and surface coatings
Paint or coating failure can be the result of poor maintenance or the
use of an incorrect coating. Risk of corrosion is increased.
Prior Repairs If repairs have been performed on the equipment, the integrity and
necessity of repair will indicate the potential for further problems.
Indicators of aging are signs or evidence that damage has already occurred, or is about to
occur. Table 10 below provides some example aging indicators.
Table 10: Examples of aging indicators
Indicator Details
Paint blistering or surface damage
Paint blistering or other surface damage indicates that some degradation may be occurring.
Leakage Leakage may be due to lack of maintenance/functional malfunction
(e.g. replacement of seals or gaskets) or it may indicate more
serious integrity-related damage such as a through-wall crack.
Common breakdowns Repeat breakdowns and need for repair suggests that the equipment
is approaching the end of its useful service life. It is good practice to
establish the underlying reasons for breakdowns and repairs.
Inspection results Inspection results can give the actual equipment condition and any
damage present. Repeat inspection results can be used to establish
degradation trends.
Reduction of plant
efficiency
Reduction in efficiency (e.g. heat up rates) can be due to factors
such as product fouling or scaling.
Process instability Excursions from the normal process operating envelope may be an indication that the equipment has deteriorated.
Product quality Impurities detected in the product, composed of plant/equipment
materials can indicate corrosion or erosion. An on-going product
quality review can detect variations in product quality.
Instrumentation Anomalies and lack of consistency in the behavior of process
instrumentation can indicate a fault with the instrumentation, but
can also be an indicator that the equipment has deteriorated.
Industry/operator
experience of ageing
of similar equipment
Unless active measures have been used to prevent ageing of similar
equipment it will be likely that the same problems can occur again.

SafeLife-X
page 58
Poor condition of
paint and surface coatings
Poor condition of the coating surface can be an indication of
corrosion.
Repairs May indicate that ageing problems are already occurring.

SafeLife-X
page 59
6 Conclusion
Management of aging structures is a complex issue requiring the integrated application of
results obtained through the use of different techniques, so that the risks related to
equipment aging and deterioration are successfully mitigated and prevented. The condition of equipment has to be monitored, in the right places and the correct way. If knowledge
about the state of equipment is inadequate or incomplete, operators are forced to remain
conservative in their assessment of risks and remaining life. When in depth information about the state of the equipment is known, the right kind of inspection and maintenance
techniques can be applied, in order to safely maximize equipment life and minimize costs.
The objective of this document was to provide an overview of some of the techniques to be applied in an integrated manner, when facing the issue of aging management of process and
power plants. Where possible, detailed descriptions and guidelines for application have been
provided.
The gathering of operational and monitoring data is shown in Chapter 2. Current monitoring trends and a real application of modular targeted monitoring at a power plant is given. The
importance of striking the right balance between global and local monitoring is stressed in
this chapter. The monitoring of strains and displacements needs to be supported by the application of computer-based analysis tools. Due to the uncertainties present and the non-
linear nature of some damage mechanisms present in high-temperature components (e.g.
creep), a risk assessment should be performed with every condition assessment.
In many cases, problems in plants, related to aging or otherwise, are chronic in nature,
meaning that they occur more than once and for the same reasons. Root Cause Failure
Analysis is an essential element of Reliability Centered Maintenance methods and can help us determine the root causes of these problems. RCFA is shortly introduced in Chapter 3, and
four of the analysis techniques are described: Failure Mode and Effects Analysis (FMEA),
Fault Tree Analysis (FTA), Cause and Effect Analysis and Sequence of Events Analysis.
The logic of aging damage identification, addresses one of the key points laid out in T3.5.
The systematics, detection and analysis of damage mechanisms in power (and process)
plants, based on RIMAP and its accompanying documents, are dealt with, with guidelines on
where and how to look for the respective damage mechanisms (through inspections or monitoring techniques, as well as how to analyze and predict the further development of a
given type of damage.
The principles of reliability centered and risk based inspection and maintenance concepts are covered in Chapter 3.3. A brief overview of the evolution of maintenance strategies is given,
from the era of reactive maintenance to the modern concepts of proactive maintenance, such
as Reliability Centered Maintenance and Risk-Based Inspection and Maintenance. These concepts are covered in more depth in Annex 1 and Annex 2. In particular, a recognized
European guideline for implementing and maintaining a Risk-Based Inspection program, the
CWA 15740:2008/2011 RIMAP is provided. This guideline is currently in the process of transition to a European Norm, the CWA EN. The review of this guideline in CEN will be
completed in June 2015.
Applying RBI can allow infrastructure owners/operators to make risk-informed decisions
regarding the maintenance of aging plants and provide optimized inspection plans. In order to successfully implement RBI methods and methodologies, an integration of many factors is
essential, in order to obtain the most accurate (and least conservative) results. These factors
include:
Gathering and documenting design, operational and monitoring data and inspection
records, in order to have a good overview of the operational history of the plant.
Reviewing and appraising the management system in place, in order to get an idea
of how and to which extent it directly or indirectly influences the mechanical integrity
of the plant and its systems.
Conducting regular, appropriate quality non-destructive examinations on a well-defined set
of components and systems can give operators insight into the true state and rate of aging
of a plant, and extend the useful life of many components, when compared to a traditional prescribed replacement program. The modern optimized maintenance concepts, such as RBI
and RCM, can provide inspections plans which serve as a basis for regular, quality
inspections, which minimize risk and maximize savings by targeting the right components in
the right locations.

SafeLife-X
page 60
7 References
Eckel, M., Ausfelder, U., Tenner, J., Sunder, R. (1996). Diagnosesysteme für Kraftwerke in
der Übersicht, Monitoring und Diagnose in Energietechnischen Anlagen, VDI Berichte 1359,
VDI Verlag GmbH, Düsseldorf 1997
EVT (1989). FACOS - Ein System zur Erfassung des rechnerischen Lebensdauerverbrauchs
druckführender Bauteile, EVT Stuttgart, 1989
Farwick, V. (1997). Verbindung von Monitoring, Diagnose und Betriebs-führungs¬system”, Monitoring und Diagnose in Energietechnischen Anlagen, VDI Berichte 1359, VDI Verlag
GmbH, Düsseldorf 1997
Jovanovic A., Auerkari P., Brear J. M. (1996). A Multi Criteria Decision Making System for Damage Assessment of Critical Components In Power Plants, Revue Francaise de Mecanique
No 1996-4, ISSN 0373-6601, pp. 259- 267
Jovanovic, A. (1997). Remaining life management systems: from stand-alone to corporate
memory systems and Internet (ALIAS System of MPA Stuttgart). Proceedings of SMiRT Post Conference Seminar No. 13, Paris, France, August 25-27, 1997, ed. A. Jovanovic, MPA
Stuttgart, 1997.
Kaum, M., Reiners, U. (1996). Rohrleitungsüberwachung mittels Kraft- und Wegmessungen, Monitoring und Diagnose in Energietechnischen Anlagen, VDI Berichte 1359, VDI Verlag
GmbH, Düsseldorf 1997
Lefton, Besuner and Grimsrud (1997). Understand what it really costs to cycle fossil-fired units, Power, March/April 1997
Roos, E., Kessler, A., Eckel, M., Ausfelder, U. (1996). Lebensdauerüberwachung von
Kraftwerksbauteilen unter Berücksichtigung von Zusatzbelastungen, VGB Kraftwerkstechnik 76 (1996) Heft 5
TRD – Technische Regeln für Dampfkessel:
TRD 300, Ausgabe April 1975, TRD 301 (incl. Annexes), Ausgabe April 1979,
TRD 508 (incl. Annexes), Ausgabe Oktober 1978,
Vulkan-Verlag, Essen
CEN CWA 15740:2008 Risk-Based Inspection and Maintenance Procedures for European Industry, CEN EU 2008 (Chair A. Jovanovic)
A. S. Jovanovic, P. Auerkari, R. Giribone (2003). RIMAP Application Workbook for Power
Plants, MPA Stuttgart, 2003
M. Rousand, A. Hoylan (2004). System Reliability Theory: Models, Statistical Methods, and
Applications, Wiley Series in probability and statistics - second edition 2004
Kmenta, Steven; Ishii, Koshuke (2004). "Scenario-Based Failure Modes and Effects Analysis Using Expected Cost". Journal of Mechanical Design 126 (6): 1027. doi:10.1115/1.1799614
Center for Chemical Process Safety (2008). Guidelines for Hazard Evaluation Procedures, 3rd
edition ed., Wiley, ISBN 978-0-471-97815-2
Center for Chemical Process Safety (1999), Guidelines for Chemical Process Quantitative Risk
Analysis, 2nd edition ed., American Institute of Chemical Engineers, ISBN 978-0-8169-0720-
5
U.S. Department of Labor Occupational Safety and Health Administration (1994), Process Safety Management Guidelines for Compliance, U.S. Government Printing Office, OSHA 3133

SafeLife-X
page 61
Annex 1 Reliability Centered Maintenance (RCM)
A.1.1 Definitions – What is RCM?
Reliability-Centered Maintenance (RCM) is a logical, systematic decision making process for
defining optimum maintenance tasks.
RCM is a process used to determine the maintenance requirements of any physical asset in its present operating context.
RCM is the detailed analysis of the functional failures and the failure modes for the
development of a maintenance strategy to realize the inherent reliability capabilities of equipment.
RCM is based around answering seven key questions about a system
What are the functions and associated performance standards of the system/asset? Function
In what ways does it fail to fulfill its functions?
Functional Failure
What causes each functional failure?
Failure Mode
What happens when each failure occurs?
Failure Effect
In what way does each failure matter?
Consequence
What can be done to predict or prevent each failure? Proactive Tasks
What should be done if a suitable proactive task cannot be found?
Default Actions, Maintenance strategies
Functions
The operating context of the asset shall be defined.
All the functions of the asset/system shall be identified (all primary and secondary functions, including the functions of all protective devices).
All function statements shall contain a verb, an object, and a performance standard
(quantified in every case where this can be done).
Performance standards incorporated in function statements shall be the level of performance
desired by the owner or user of the asset/system in its operating context.
Function — what the owner or user of a physical asset or system wants it to do.
Secondary Functions— functions which a physical asset or system has to fulfill apart from its primary function(s), such as those needed to fulfill regulatory requirements and those which
concern issues such as protection, control, containment, comfort, appearance, energy
efficiency, and structural integrity.
Functional failures
All the failed states associated with each function shall be identified.
Failure modes
All failure modes reasonably likely to cause each functional failure shall be identified.
The method used to decide what constitutes a “reasonably likely” failure mode shall be
acceptable to the owner or user of the asset.
Failure modes shall be identified at a level of causation that makes it possible to identify an
appropriate failure management policy.
Lists of failure modes shall include failure modes that have happened before, failure modes
that are currently being prevented by existing maintenance programs and failure modes that have not yet happened but that are thought to be reasonably likely (credible) in the
operating context.

SafeLife-X
page 62
Lists of failure modes should include any event or process that is likely to cause a functional
failure, including deterioration, design defects, and human error whether caused by
operators or maintainers (unless human error is being actively addressed by analytical processes apart from RCM).
Failure Effects
Failure effects shall describe what would happen if no specific task is done to anticipate, prevent, or detect the failure.
Failure effects shall include all the information needed to support the evaluation of the
consequences of the failure, such as:
a. What is the evidence (if any) that the failure has occurred (in the case of hidden
functions, what would happen if a multiple failure occurred)
b. What it does (if anything) to kill or injure someone, or to have an adverse effect on the environment
c. What it does (if anything) to have an adverse effect on production or operations
d. What physical damage (if any) is caused by the failure
e. What (if anything) must be done to restore the function of the system after the failure
Failure Consequence Categories
The consequences of every failure mode shall be formally categorized as follows:
the consequence categorization process shall separate hidden failure modes from
evident failure modes
the consequence categorization process shall clearly distinguish events (failure modes and multiple failures) that have safety and/or environmental consequences
from those that only have economic consequences (operational and non-operational
consequences)
The assessment of failure consequences shall be carried out as if no specific task is currently
being done to anticipate, prevent, or detect the failure.
Failure Management Policy Selection
The failure management selection process shall take account of the fact that the conditional
probability of some failure modes will increase with age (or exposure to stress), that the
conditional probability of others will not change with age, and the conditional probability of
yet others will decrease with age.
All scheduled tasks shall be technically feasible and worth doing (applicable and effective),
and the means by which this requirement will be satisfied as defined under failure
management policies.
If two or more proposed failure management policies are technically feasible and worth doing
(applicable and effective), the policy that is most cost-effective shall be selected.
The selection of failure management policies shall be carried out as if no specific task is currently being done to anticipate, prevent or detect the failure.
Failure Management Policies— Scheduled Tasks
All scheduled tasks shall comply with the following criteria:
In the case of a hidden failure mode where the associated multiple failure has safety or
environmental consequences, the task shall reduce the probability of the hidden failure
mode to an extent which reduces the probability of the associated multiple failure to a level
that is tolerable to the owner or user of the asset.
In the case of an evident failure mode that does not have safety or environmental
consequences, the direct and indirect costs of doing the task shall be less than the direct and
indirect costs of the failure mode when measured over comparable periods.
In the case of a hidden failure mode where the associated multiple failure does not have
safety or environmental consequences, the direct and indirect costs of doing the task
shall be less than the direct and indirect costs of the multiple failure plus the cost of repairing the hidden failure mode when measured over comparable periods of time. In the case of an
evident failure mode that has safety or environmental consequences, the task shall reduce

SafeLife-X
page 63
the probability of the failure mode to a level that is tolerable to the owner or user of the
asset.
ON-CONDITION TASKS — any on-condition task (or predictive or condition-based or condition monitoring task) that is selected shall satisfy the following additional criteria:
there shall exist a clearly defined potential failure
there shall exist an identifiable P-F interval (or failure development period)
the task interval shall be less than the shortest likely P-F interval
it shall be physically possible to do the task at intervals less than the P-F interval
the shortest time between the discovery of a potential failure and the occurrence of the functional failure (the P-F interval minus the task interval) shall be long enough
for predetermined action to be taken to avoid, eliminate, or minimize the
consequences of the failure mode.
SCHEDULED DISCARD TASKS — any scheduled discard task that is selected shall satisfy the
following additional criteria:
There shall be a clearly defined (preferably a demonstrable) age at which there is an
increase in the conditional probability of the failure mode under consideration.
A sufficiently large proportion of the occurrences of this failure mode shall occur after
this age to reduce the probability of premature failure to a level that is tolerable to
the owner or user of the asset.
SCHEDULED RESTORATION TASKS — any scheduled restoration task that is selected shall
satisfy the following additional criteria:
There shall be a clearly defined (preferably a demonstrable) age at which there is an increase in the conditional probability of the failure mode under consideration.
A sufficiently large proportion of the occurrences of this failure mode shall occur after
this age to reduce the probability of premature failure to a level that is tolerable to the owner or user of the asset.
The task shall restore the resistance to failure (condition) of the component to a level
that is tolerable to the owner or user of the asset.
FAILURE-FINDING TASKS — any failure-finding task that is selected shall satisfy the
following additional criteria (failure-finding does not apply to evident failure modes):
The basis upon which the task interval is selected shall take into account the need to
reduce the probability of the multiple failure of the associated protected system to a level that is tolerable to the owner or user of the asset.
The task shall confirm that all components covered by the failure mode description
are functional.
The failure-finding task and associated interval selection process should take into
account any probability that the task itself might leave the hidden function in a failed
state.
It shall be physically possible to do the task at the specified intervals.
Failure Management Policies— One-Time Changes and Run-to-Failure
ONE-TIME CHANGES
The RCM process shall endeavor to extract the desired performance of the system as it is
currently configured and operated by applying appropriate scheduled tasks.
In cases where such tasks cannot be found, one-time changes to the asset or system may be
necessary, subject to the following criteria.
In cases where the failure is hidden, and the associated multiple failure has safety or
environmental consequences, a one-time change that reduces the probability of the
multiple failure to a level tolerable to the owner or user of the asset is compulsory.
In cases where the failure mode is evident and has safety or environmental
consequences, a one-time change that reduces the probability of the failure mode to
a level tolerable to the owner or user of the asset is compulsory.

SafeLife-X
page 64
In cases where the failure mode is hidden, and the associated multiple failure does
not have safety or environmental consequences, any one-time change must be cost-
effective in the opinion of the owner or user of the asset.
In cases where the failure mode is evident and does not have safety or
environmental consequences, any one-time change must be cost-effective in the
opinion of the owner or user of the asset.
RUN-TO-FAILURE
Any run-to-failure policy that is selected shall satisfy the appropriate criterion as follows:
In cases where the failure is hidden and there is no appropriate scheduled task, the associated multiple failure shall not have safety or environmental consequences.
In cases where the failure is evident and there is no appropriate scheduled task, the
associated failure mode shall not have safety or environmental consequences.
A.1.2 RCM Benefits
Implementation of RCM usually is followed by the benefits such as:
Safety & environmental integrity improvement
Improved operating performance
Improved maintenance cost effectiveness
Maximised useful life of assets
Maintenance strategy information & decisions fully documented
Clearly identifies manpower & spares resource requirements
Helps to build good teamwork
A.1.3 RCM Process overview
Define The RCM Boundaries and Operating Context
FMEA – Failure Mode and Effect Analyses
FCA – Failure Characteristic Analyses
MSS – Maintenance Strategy Selection
Task Alignment of Maintenance Tasks
Task Description & Detail
Monitor & Update Implementation
Figure 21: RCM Review Team
Customers
Production
Maintainers
Specialists
Facilitator

SafeLife-X
page 65
A.1.4 Information needed for RCM Analysis
Typical Information Needed for RCM Reviews …
P&ID’s
O&M Manuals
Flow Diagrams
Maintenance History Records … If Available
Previous Maintenance Strategies & Frequencies
The operating context is a definition of the operating parameters within which the system is
required to perform.
Process or product applicable/effected
Standby or alternative processes available
Safety/Environmental regulations or standards
Availability requirements
Business risk & reliability
Production downtime economics
A.1.5 Operating context
An operating context statement for a physical asset typically includes a brief overall description of how it is to be used, where it is to be used, overall performance criteria
governing issues such as output, throughput, safety, environmental integrity, and so on.
Specific issues that should be documented in the operating context statement include:
a. Batch versus flow processes: whether the asset is operating in a batch (or
intermittent) process or a flow (or continuous) process.
b. Quality standards: overall quality or customer service expectations, in terms of issues such as overall scrap rates, customer satisfaction measurements (such as on-
time performance expectations in transportation systems, or rates of warranty claims
for manufactured goods), or military preparedness.
c. Environmental standards: what organizational, regional, national, and international environmental standards (if any) apply to the asset.
d. Safety standards: whether any predetermined safety expectations (in terms of
overall injury and/or fatality rates) apply to the asset.
e. Theater of operations: characteristics of the location in which equipment is to be
operated (arctic versus tropical, desert vs. jungle, onshore vs. offshore, proximity to
sources of supply of parts and/or labor, etc.).
f. Intensity of operations: in the case of manufacturing and mining, whether the
process of which the equipment forms a part is to operate 24 hours per day, seven
days per week, or at lower intensity. In the case of utilities, whether the equipment operates under peak load or base load conditions.
g. Redundancy: whether any redundant or standby capability exists, and if so what
form it takes.
h. Work-in-process: the extent to which work-in-process stocks (if any) allow the equipment to stop without affecting total output or throughput.
i. Spares: whether any decisions have been made about the stocking of key spares
that might impinge on the subsequent selection of failure management policies.
j. Market demand/raw material supply: whether cyclic fluctuations in market demand
and/or the supply of raw materials are likely to impinge on the subsequent selection
of failure management policies. (Such fluctuations may occur over the course of a day in the case of an urban transport business, or over the course of a year in the
case of a power station, an amusement park, or a food processing business.)

SafeLife-X
page 66
In the case of very large or very complex systems, it might be sensible to structure the
operating context in a hierarchical fashion, if necessary starting with the mission statement
of the entire organization that is using the asset.
A.1.6 Primary functions
RCM Question 1 “What are the functions…”
Define the Primary Function “What It Is Required To Do” - not the Design
Define the Performance Standards “Quantitative rather than Qualitative”
Define the Tolerances on the Performance Standard “Minimum, Maximum, Nominal,
etc.”
PRIMARY FUNCTIONS are the reason why any organization acquires any asset or system is to fulfill a specific function or functions. These are known as primary functions of the asset.
Functional descriptions
Function description - “to be capable of safely transporting people and luggage from A to B”
Protective function statements need special handling. For example, the function of a pressure
safety valve may be described as follows: “To be capable of relieving the pressure in the
boiler if it exceeds 25 bar.”
A.1.7 Performance standards
Owners are satisfied if their assets generate a satisfactory return on the investment made to
acquire them (usually financial return for commercial operations, or other measures for non-
commercial operations). Users are satisfied if each asset continues to do whatever they want it to do to a standard of performance that they—the users—consider satisfactory. Finally,
society as a whole is satisfied if assets do not fail in ways that threaten public safety and the
environment.
This means that if we are seeking to cause an asset to continue to function to a level that is
satisfactory to the user, then the objective of maintenance is to ensure that assets continue
to perform above the minimum level that is acceptable to those users. If it were possible to
build an asset that could deliver the minimum performance without deteriorating in any way, then it would be able to run continuously, with no need for maintenance.
However, deterioration is inevitable, so it must be allowed for. This means that when any
asset is put into service, it must be able to deliver more than the minimum standard of performance desired by the user. What the asset is able to deliver at this point in time is
known as its initial capability. This means that performance can be defined in two ways:
a. Desired performance (what the user wants the asset to do)
b. Built-in capability (what it can do).
Figure 22: Different levels of performance
The margin for deterioration must be large enough to allow for a reasonable amount of use
before the component degrades to functional failure, but not so large that the system is
“over-designed” and hence too expensive. In practice, the margin is adequate in the case of most components, so it is usually possible to develop maintenance programs accordingly.

SafeLife-X
page 67
However if the desired performance is higher than built-in capability, no amount of
maintenance can deliver the desired performance, in which case the asset is not
maintainable.
All this means that, in order to ascertain whether an asset can be maintained, we need to
know both kinds of performance: the built-in capability of the asset, and the minimum
performance that the user is prepared to accept in the context in which the asset is being used. This minimum performance is the performance standard that must be incorporated in
the function statement.
Some examples are performance standards:
• at speeds between 0 and 120 km/h
• maximum weight limit of 500kg
• minimum fuel consumption of 15 km/l
Note that users and maintainers often have significantly different views about what
constitutes acceptable performance. As a result, in order to avoid misunderstandings about
what constitutes “functional failure,” the minimum standards of acceptable performance
must be clearly understood and accepted by the users and maintainers of the asset, together with anyone else who has a legitimate interest in the behavior of the asset.
Performance standards must be quantified where possible, because quantitative standards
are clearer and more precise than qualitative standards. Occasionally it is only possible to use qualitative standards, for example when dealing with functions relating to appearance. In
such cases, special care must be taken to ensure that the qualitative standard is understood
and accepted by users and maintainers of the asset.
A.1.8 Secondary functions (“ESCAPES”)
Environmental integrity
Safety, structural integrity
Control, containment, comfort
Appearance
Protection
Economy, efficiency
Superfluous
Environmental integrity
These functions define the extent to which the asset must comply with the corporate, municipal, regional, national, and international environmental standards or regulations that
apply to that asset. These standards govern such things as the release of hazardous
materials into the environment, and noise.
Some examples are i.e. compliance with regulations covering:
noise
working temperatures
pollution discharges to the atmosphere
effluent discharges
international, national, local or company standards and regulations
Structural / Safety Functions
It is sometimes necessary to write function statements that deal with specific threats to
safety that are inherent in the design or operation of the process (as opposed to safety
threats that are a result of a functional failure). For example, the function of electrical insulation on a domestic appliance is “to prevent users from touching electrically live
components.”
Safety integrity examples
Pressure Regulations
HSE

SafeLife-X
page 68
Many assets have a secondary function of providing support for or a secure mount for
another item. For example, while the primary function of a wall may be to protect people and
equipment from the weather, it might also be expected to support the roof, or to bear the weight of shelves and pictures.
Integrity of structures examples:
corrosion protection, etc.
safe working loads
fixings and mountings
Control Functions
In many cases, users not only want assets to fulfil functions to a given standard of
performance, but they also want to be able to regulate the performance. This expectation is
summarized in separate function statements. For example, a function of a cooling system may be to regulate temperature at will between one specific temperature and another.
Indication and feedback form an important subset of the control category of functions.
Examples of control functions:
Temperature
Pressure, flows
Chemical dosing
Variable speed
To provide information
Gauges, dials
Control panels
Containment Functions
Containment— Systems whose primary function is to store materials must also contain them.
Similarly, systems that transfer materials—especially fluids—also have a containment function. These functions must be specified as well.
Some examples of containment functions:
Storage Containment
Tanks
Vessels
Thermal Insulation
Some examples of transfer containment (fluid, gas, air)
Pipes
Joints
Seals
Comfort Functions
Owners and users generally expect that their assets or systems will not cause pain or anxiety
to operators or maintainers. These problems should of course be dealt with at the design stage. However deterioration or changing expectations can lead to unacceptable levels of
pain or anxiety. The best way to ensure that this does not happen is ensure that the
associated function statements are described precisely and that they fully reflect current standards
Human Discomfort (Ergonomics)
Adjustable Height
Glazing Visibility
Lighting Levels
Equipment Operability
Quick Release Mechanism

SafeLife-X
page 69
Swinging Control Panels
Appearance Functions
Appearance often constitutes an important secondary function. For example, the primary reason for painting most industrial equipment is to protect it from corrosion. However a
bright color may be chosen to enhance its visibility for safety's sake, and this function should
also be documented
Protection Functions
Protective functions avoid, eliminate, or minimize the consequences of the failure of some
other function. These functions are associated with devices or systems that:
Warn people of abnormal conditions
o sensors, switches, alarms, etc.
Trip or stop equipment when fault occurs
o high priority alarms
Relieve abnormal conditions
o safety or relief valves, bursting discs, etc.
Take over the duty role
o standby equipment or systems
Prevent dangerous situations from arising in the first place
o warning signs, protective covers
A protective function ensures that the failure of the function being protected is much less
serious than it would be without the protection. The associated devices are incorporated into
systems to reduce risk, so their functions should be documented with special care.
Efficiency / Economy Functions
In most organizations, overall cost expectations are expressed in the form of expenditure
budgets. However for specific assets, cost expectations can be addressed directly by secondary function statements concerning such things as energy consumption rates and the
rate of attrition of process materials.
Some examples are:
dosing levels
heating efficiency
motor drawn current
fuel economy
water usage
recovery, etc.
Superfluous functions
Some systems incorporate items or components that are found to be completely superfluous.
This usually happens when equipment or the way in which it is used has been modified over
a period of years, or when new equipment has been over-specified.
Although such items have no positive function and are often costly to remove, they can in
fact fail and thus reduce overall system reliability. To avoid this, some may require
maintenance and so consume resources.
If they are removed, the associated failure modes and costs will also be removed. However,
before their removal can be recommended with confidence, their functions need to be clearly
identified and understood.
A.1.9 Functional failure
RCM Question 2 “In what ways can it fail”?
A functional failure is defined as the inability of an asset to fulfill a function to a standard of
performance which is acceptable to the user

SafeLife-X
page 70
This definition covers complete loss of function and situations where the asset still functions
but performs outside acceptable limits (performance standard)
Functional failures can be classified into one of three groups:
when capability drops below user desired performance after the asset enters service
when desired user performance rises above capability after the asset enters service
when the asset is not capable of doing what is wanted from the outset.
The majority of ‘maintenance significant’ failure modes are associated with the first category.
Functional failures are described as “fails to be capable of …”
Partial failures need to be identified separately because they are nearly always caused by different failure modes from total failures, and because the consequences are also nearly
always different.
A.1.10 Failure modes
RCM question 3 “What causes it to fail”?
Zero based – no any maintenance is done
A failure mode is any event which could cause a functional failure - past, future &
currently prevented
All failure modes which are reasonably likely to cause a functional failure should be
identified
The root cause of failure modes should be identified
Failure effects
Failure effects should describe the following:
Evidence (if any) that the functional failure has occurred (alarms, indication etc)
The effects on safety or the environment
The effect on production/operation (economic or service level)
Potential secondary damage to other equipment
Downtime or repair actions with estimated time (loss of function to the restoration of function)
Sources of Information about Failure Modes
Failure modes that have occurred before on the same or similar assets are the most obvious candidates for inclusion in the list of failure modes, unless something has been changed in
such a way that the failure mode cannot occur again. Sources of information about these
failure modes include people who know the asset well (operators, maintainers, equipment vendors, or other users of the same equipment), technical history records, and data banks.
Failure modes that are the subject of existing proactive maintenance routines should also be
incorporated in the list of failure modes. One way to ensure that none of these failure modes
has been overlooked is to study existing maintenance schedules for identical or very similar assets and ask, “what failure mode would occur if this task was not performed?” However
existing schedules should only be reviewed as a final check after the rest of the RCM analysis
has been completed, in order to reduce the possibility of perpetuating the status quo.
Finally, the list of failure modes should include failure modes that have not yet occurred but
that are considered to be real possibilities in the context under consideration. Identifying and
deciding how to deal with failure modes that have not happened yet is an essential feature of proactive management in general, and of risk management in particular. It is also one of the
most challenging aspects of the RCM prospect, because it calls for a high degree of judgment
applied by skilled and knowledgeable people.
A.1.11 Failure classification
RCM Question 5: “In what way does each failure matter?”
Failure classification specifies the impact of failures (i.e. the consequence or extent to which
each failure matters).

SafeLife-X
page 71
Hidden or evident under normal conditions
Safety or environmental
Operational (economic or service level)
Non-operational
Figure 23: Failure Classification Decision Tree
Hidden & Evident Failures
Hidden failures: a hidden failure is one, which will not become evident to the operating
crew under normal circumstances if it occurs on its own, for example protective devices.
Evident failures: an evident failure is one which will on its own eventually become evident to the operating crew under normal circumstances, for example, alarms activate, flow stops.
Safety / Environmental Failures
A failure has safety consequences if it causes a loss of function or damage which could hurt or kill someone.
A failure has environmental consequences if it causes a loss of function or damage which
could lead to a breach of any known environmental standard or regulation.
For failure modes which have safety or environmental consequences, a proactive task is only worth doing if it reduces the probability of the failure to a tolerably low level.
A selected list of examples includes:
a. Increased risk of fire or explosion
b. The escape of hazardous chemicals
c. Electrocution
d. Vehicle accidents or derailments
e. Ingress of dirt into food or pharmaceutical products
f. Exposure to sharp edges or moving machinery
Operational Failures
Failure has operational consequences if it has a direct adverse effect on operational
capability.
For failure modes with operational consequences, a proactive task is worth doing if, over a period of time, it costs less than the cost of the operational consequences plus the cost of
repairing the failure which it is meant to prevent.
Non-Operational Failures
A failure has non-operational consequences if it has no direct adverse effect on safety, the environment or operational capability.
Will The Failure On Its Own Become Evident To
The Operating Crew During Normal Operation ?
Will A Combination Of The Failure Plus An
Additional Failure Have Adverse Effect On Safety Or The Environment ?
Will The Failure Effect
Operational Capabilities ?
Yes No
Yes Yes
Yes
No No
No
Operational Non-Operational Hidden
(S&E)
Hidden
(Not S&E)

SafeLife-X
page 72
For failure modes with non-operational consequences, a proactive task is worth doing if, over
a period of time, it costs less than the cost of repairing the failure which it is meant to
prevent.
A.1.12 Failure Characteristic Analyses
Information of the asset conditions that give prior warning of the failure mode
time intervals between the onset of failure and catastrophic failure (for age-related
failure)
time intervals before the onset of failure (indicates periods when failures will be
unlikely)
useful and safe life (for random failure)
estimates can be used if no other data is available
Figure 24: Failure Characteristic Patterns
Relationship between age and failure—The failure management selection process shall
take account of the fact that the conditional probability of some failure modes will increase with age (or exposure to stress), that the conditional probability of others will not change
with age, and the conditional probability of yet others will decrease with age.
Patterns A and B both display a point at which there is a rapid increase in the conditional probability of failure (sometimes called a “wear-out zone”). Pattern C shows a steady
increase in the probability of failure, but no distinct wear-out zone. Pattern D shows low
conditional probability of failure when the item is new or just out of the shop, then a rapid increase to a constant or very slowly increasing level, while pattern E shows a constant
conditional probability of failure at all ages (random failure). Pattern F starts with high
infant mortality, dropping to a constant or very slowly decreasing conditional probability of
failure.
In general, age-related failure patterns apply to items that are very simple, or to complex
items that suffer from a dominant failure mode. In practice, they are commonly associated
with direct wear (most often where equipment comes into direct contact with the product), fatigue, corrosion, oxidation and evaporation.
MTBF – is main characteristics of random failures, and represents mean time between
failures.
Hidden and evident failures
Some failure modes occur in such a way that nobody knows that the item is in a failed state
unless, or until, some other failure (or abnormal event) also occurs. These are known as hidden failures. A hidden failure is a failure mode whose effects do not become apparent to
the operating crew under normal circumstances if the failure mode occurs on its own.
Conversely, an evident failure is a failure mode whose effects become apparent to the operating crew under normal circumstances if the failure mode occurs on its own.
The RCM approach to the evaluation of failure consequences begins by separating hidden
failures from evident failures. Hidden failures can account for up to half the failure modes
that could affect modern, complex equipment, so they need to be handled with special care.
DOMINANT FAILURE MODES
(moving equipment) – age related
- WEAR
FATIGUE
CORROSION
A
B
C
D
E
F
A B C
D E F
COMPLEX EQUIPMENT - random
- ELECTRONICS
HYDRAULICS
PNEUMATICS
BALL BEARINGS (PATTERN E)

SafeLife-X
page 73
Hidden Failures and Protection: the function of any protection is to ensure that the
consequences of the failure of the protected function are much less serious than they would
be if there was no protection. So any protective function is in fact part of a system with at least two components:
a. The protective function
b. The protected function
The existence of such systems creates two sets of failure possibilities, depending on whether
the failure of the protection is evident or not. The implications of each set are considered in
the following paragraphs, starting with devices whose failure is evident.
A.1.13 Failure Consequences
The consequence categorization process shall clearly distinguish events (failure modes and
multiple failures) that have safety and/or environmental consequences from those that only
have economic consequences (operational and non-operational consequences).
Safety consequences—a failure has safety consequences if there is an intolerable
probability that it could kill or injure a human being. The distinction between a “tolerable”
and an “intolerable” probability is very subjective and has to be defined a-priori for the whole evaluation process.
Beliefs about what is a tolerable level of risk of death or injury vary widely from individual to
individual and from group to group. Many factors influence these beliefs. The two most
dominant are the degree of control that any individual thinks he or she has over the situation and the benefit that people believe they will derive from exposing themselves to the risk.
This in turn influences the extent to which they might choose to expose themselves to the
risk. This view then has to be translated into a degree of risk that might be tolerated by the whole population (all the workers on a site, all the citizens of a town or even the entire
population of a country).
Environmental Consequences—at another level, “safety” refers to the safety or well-being of society in general. Such failures tend to be classed as “environmental” issues. Society's
expectations take the form of municipal, regional and national environmental standards.
Some organizations also have their own even more stringent corporate standards. As a result, a failure has environmental consequences if there is an intolerable probability that it
could breach any known environmental standard or regulation.
Operational Consequences—the primary function of most equipment in commerce and industry is usually connected with the need to earn revenue or to support revenue-earning
activities. Failures that affect the primary functions of these assets affect the revenue-
earning capability of the organization. The magnitude of these effects depends on how
heavily the equipment is utilized and the availability of alternatives. However, in nearly all cases the costs of these effects are greater—often much greater—than the cost of repairing
the failures, and these costs need to be taken into account when assessing the cost
effectiveness of any failure management policy. In general, failures affect operations in four ways:
a. they affect total output or throughput
b. they affect product quality
c. they affect customer service (and may incur financial penalties)
d. they increase operating costs in addition to the direct cost of repair.
Non-Operational Consequences—the consequences of an evident failure that has no direct adverse effect on safety, the environment or operational capability are classified as
non-operational. The only consequences associated with these failures are the direct costs of
repairing the failure itself and any secondary damage, so these consequences are also
economic.
A.1.14 Maintenance Strategy Selection (MMS)
The RCM decision making process provides a strategic framework for classifying all failures
on the basis of their consequences.
The RCM decision diagram is used to:

SafeLife-X
page 74
evaluate if proactive maintenance is technically feasible and worth doing.
or what action should be taken if a suitable proactive task cannot be found.
Figure 25: RCM Strategy Decision Logic
Figure 26: Maintenance Strategies
Proactive Tasks
Proactive maintenance tasks are tasks undertaken before a failure occurs, in order to prevent
the item from getting into a failed state.
Proactive tasks include both:
predictive tasks and
preventive tasks.
Task selection depends upon the following criteria:
whether the task is technically feasible?
whether the task is worth doing economically?
Predictive Tasks
Will the FAILURE on its own
become apparent to the operating
crew in normal conditions?
Does this FAILURE or resulting
damage from thei CAUSE directly
harm production?
Will the FAILURE or damage from
this CAUSE directly harm worker
safety or the environment?
Can you easily detect the
onset of failure?
Can you easily detect the
onset of failure?
Can you easily detect the
onset of failure?
Can you easily detect the
onset of failure?
Yes No
Yes No
Yes
No
Can you restore the
performance of the item to as
now, & will this reduce
FAILURE rates?
Can you restore the
performance of the item to as
now, & will this reduce
FAILURE rates?
Can you restore the
performance of the item to as
now, & will this reduce
FAILURE rates?
Can you restore the
performance of the item to as
now, & will this reduce
FAILURE rates?
Can you easily replace the
item, and will this reduce the
FAILURE rates?
Can you easily replace the
item, and will this reduce the
FAILURE rates?
Can you easily replace the
item, and will this reduce the
FAILURE rates?
Can you easily replace the
item, and will this reduce the
FAILURE rates?
Can you easily apply a
combination of strategies, &
will this reduce the FAILURE
rates?
Can you easily test the item to see if it has
failed, & will this reduce the
FAILURE risk?
NoYes
Time-based
maintenance NoYes
Time-based
maintenance NoYes
Time-based
maintenance NoYes
Time-based
maintenance
NoYes
Condition
based
maintenanceNoYes
Condition
based
maintenance NoYes
Condition
based
maintenanceNo
YesCondition
based
maintenance
NoYes
Scheduled
replacement NoYes
Scheduled
replacementYes No Yes No
Yes No Yes No
Scheduled
replacement
Scheduled
replacement
On failure maint. Or
redisign if critical
On failure
maintenance
Evident functions Hidden functions
Safety/
Environmental
consequences
Productions
consequences
Maintenance
consequences
Hidden-failure
consequences
Combination
of strategiesRedesign
Failure finding
task
Redesign if
critical
RCM strategy – decision tree

SafeLife-X
page 75
Predictive or on-condition tasks are designed to detect potential failures.
A potential failure as an identifiable condition which indicates that a functional failure is
either about to occur or is in the process of occurring
On-condition tasks entail checking for potential failures, so that action may be taken to
prevent the functional failure or to avoid the consequences.
Figure 27: Frequency of Condition Based Tasks
Condition Based Maintenance (CBM)
Condition monitoring does not always mean expensive monitoring equipment
Human senses (look, feel, hear, smell, taste)
CM is a rapidly developing technology
Trend graphs give warning
Alarms, indicators should be set before the failure point
Condition maintenance techniques
Dynamic - rotating equipment vibration & acoustics
Particle - size, shape property changes
Chemical - elements in fluids
Physical - ultrasonic, coupon testing
Temperature - thermograph
Electrical - potential, impedance tests
CM Technical Feasibility
do we have any prior warning of the failure?
what is it?
how long will it take to fail from the prior warning?
is it consistent in time?
will it give us enough time to respond appropriately?
If ‘yes’ to all the above then the condition monitoring task is technically feasible
Assessment of condition monitoring techniques
For operational & non-operational - over a period of time will the cost of doing the maintenance task be less than letting it fail ?
For safety & environmental - does this task reduce the risk ?
A.1.15 Preventive Tasks
Preventative tasks consist of two categories:
P
F
1st Sign
Failure
Interval = 1/2 PF
Potential
Failure
(Incipient)
Resistance to
Failure P-F interval

SafeLife-X
page 76
Scheduled restoration tasks entail re-manufacturing a single component or overhauling an
entire assembly at or before a specified age limit, regardless of its condition at the time.
Scheduled discard tasks entail discarding an item or component at or before a specified age limit, regardless of its condition at the time.
Figure 28: Restoration & Discard Age for age related failures
Restoration/discard technical feasibility
do we have a reliable age projection ?
what is the age ?
will most items reach this age ? (if safety or environmental they must!)
will we bring it back to as new (restoration) ?
if ‘yes’ to all the above then the restoration or discard task is technically feasible
Default actions – Evident failure
Redesign is mandatory for safety or environmental consequences
Redesign is optional for operational & non-operational consequences.
If the failure mode can be eliminated by a simple design change this should be considered -
e.g. with training personnel, painting etc
Default actions - Hidden failure
The objective of a maintenance program for a hidden failure is to prevent - or at least to
reduce the probability of - the associated multiple failure (A multiple failure is when the
protected function fails and the protective device is also in a failed state)
If condition monitoring, scheduled replacement or scheduled discarding are not applicable
then a failure finding task should be considered
Failure Finding Tasks
Scheduled failure finding tasks entail checking a hidden function at regular intervals to find out whether it has failed.
Failure finding tasks should avoid dismantling protective devices or otherwise disturbing
them. It should be possible to carry out a failure-finding task without significantly increasing the risk of the associated multiple failures.
Failure Finding Intervals
To determine the failure finding interval for a single protective device the following information is needed:
MTBF of protective device:
desired availability of the device
Generic database MTBF (e.g. OREDA) or failure rate can sometimes be used if no other
information is available.
A.1.16 No scheduled maintenance (run to failure)
No scheduled maintenance is only valid if:
AGE –
useful life
WORN
SAFE AGE 10%

SafeLife-X
page 77
a suitable proactive or failure-finding task cannot be found for a hidden failure, and
the associated multiple failure does not have safety or environmental consequences
a cost-effective proactive task cannot be found for evident failures which have operational or non-operational consequences
A.1.17 Redesign
If a suitable failure-finding task cannot be found:
redesign is compulsory if the multiple failure could affect safety or the environment
redesign must be justified on economic grounds if the multiple failure does not affect
safety or the environment
Redesign means:
a change in the physical configuration of an asset or system
a change to a process or operating procedure
a change to the capability of a person, usually by training
Figure 29: RCM Interactions
RCM and Safety Legislation/Regulations
A question often arises concerning the relationship between RCM and tasks specified by regulatory authorities (environmental legislation is dealt with directly).
Most regulations governing safety merely demand that users are able to demonstrate that
they are doing whatever is prudent to ensure that their assets are safe. This has led to
rapidly increasing emphasis on the concept of an audit trail, which basically requires users of assets to be able to produce documentary evidence that there is a rational, defensible basis
for their maintenance programs. In the vast majority of cases, RCM wholly satisfies this type
of requirement.
However, some regulations demand that specific tasks should be done on specific types of
equipment at specific intervals. It quite often happens that the RCM process suggests a
different task and/or a different interval, and in most of these cases, the RCM-derived task is a superior failure management policy.
However, in such cases, it is wise to continue doing the task specified by the regulations and
to discuss the suggested change with the appropriate regulatory authority.
A.1.18 Application of a tool for RCM analysis in the process
industry
The iRIS-Petro tool includes an RCM analysis module. The application of this module (Figure
30) in the process industry (Refinery) is shown in the example below. The components for
which the RCM analysis is available are organized in a hierarchical tree.
RCM
HSE
Risk Assessment
UtilitiesTechnical library
Simulation
Design ReviewQuality standards
ProceduresCriticality
TPM
Job Plans
MMS
Auditing
Critical SparesAlarms
Contracts
Fault Diagnostics
COSHH
Training
CBM
Job instructions

SafeLife-X
page 78
Information such as component design and operational data is provided. Interventions
carried out on the component for a specific failure type are indicated by checked boxes in the
interventions grid.
Figure 30: RCM Analysis in the iRIS-Petro tool
Reporting
RCM Analysis Calculation Report – Shown in Figure 31 below displays the current number
of failures per month for the selected component type.
Figure 31: RCM Analysis Calculation Report
RCM Statistic Calculation Report – displays the number of failures regarding a specific
component type and failure type, during a selected time period.

SafeLife-X
page 79
Figure 32: RCM Statistic Calculation Report
RCM MTBF Calculation – component reliability is defined as the probability that a
component will be able to perform its function for a specific period of time. This reliability is defined by MTBF (Mean Time Between Failures).
Figure 33: RCM MTBF Calculation

SafeLife-X
page 80
Annex 2 Managing aging by risk-based methods and inspection optimization: RBI – CEN CWA 15740
Introduction
This particular CWA provides the essential elements of risk based assessment of industrial
assets according to the RIMAP approach which has been developed and demonstrated in and
by the European R&D project RIMAP (GIRD-CT-2001-03008 and the corresponding RIMAP Network: “Risk-Based Inspection and Maintenance Procedures for European Industry”). One
of the main goals of the project, as well as of this CWA, has been to contribute to the
harmonization of the EU national regulatory requirements related to the inspection and maintenance programs in the industrial plants and make them more cost-efficient while, at
the same time, safety, health, and environmental performance is maintained or improved.
The document is intended for the managers and engineers establishing the RBIM (Risk-based Inspection and Maintenance) policies in the companies in power, process, steel and other
relevant industries. It is supposed to be used in conjunction with the relevant internationally
accepted practices, national regulations and/or company policies. The document is supposed
to provide a common reference for formulating the above policies and developing the corresponding inspection and maintenance programs within different industrial sectors, such
as oil refineries, chemical and petrochemical plants, steel production and power plants. Each
part of this Agreement can be used as a stand-alone document.
The positive impact and transfer of industry practices resulting from the use of this document
and from the approach promoted by/in it are expected to be of benefit for the European
industry and strengthening of its competitiveness through better inspection and maintenance practices.
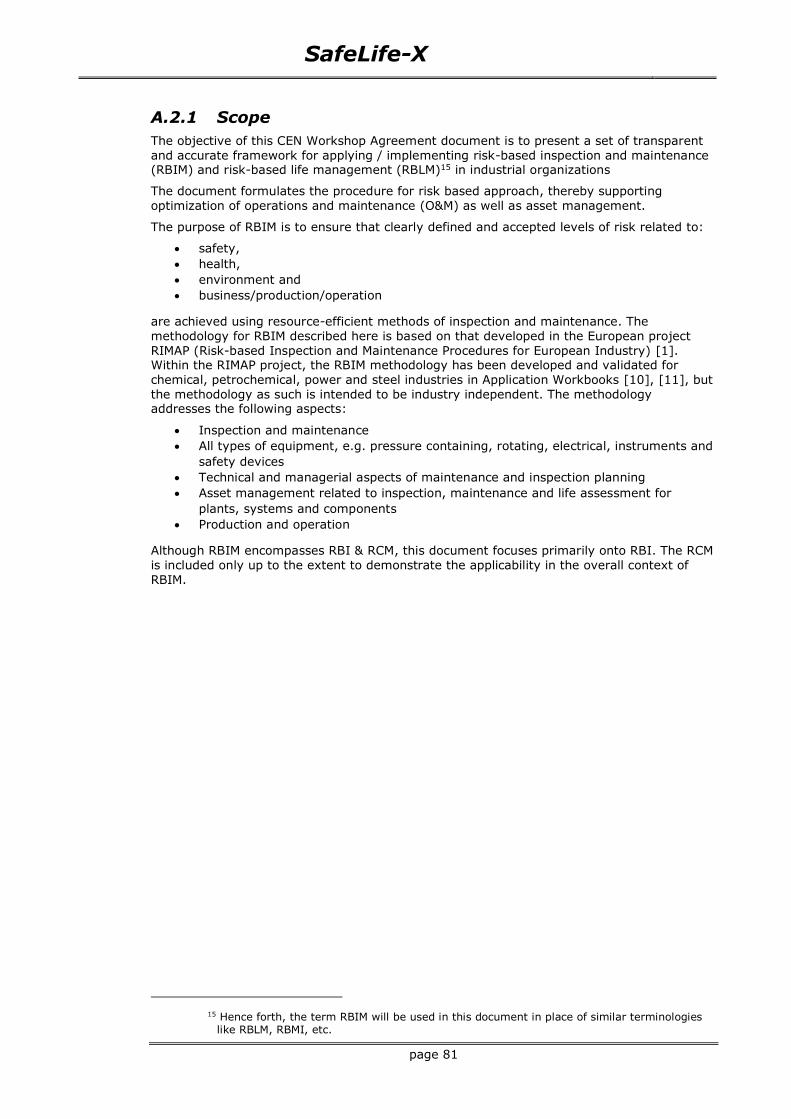
SafeLife-X
page 81
A.2.1 Scope
The objective of this CEN Workshop Agreement document is to present a set of transparent
and accurate framework for applying / implementing risk-based inspection and maintenance (RBIM) and risk-based life management (RBLM)15 in industrial organizations
The document formulates the procedure for risk based approach, thereby supporting
optimization of operations and maintenance (O&M) as well as asset management.
The purpose of RBIM is to ensure that clearly defined and accepted levels of risk related to:
safety,
health,
environment and
business/production/operation
are achieved using resource-efficient methods of inspection and maintenance. The
methodology for RBIM described here is based on that developed in the European project
RIMAP (Risk-based Inspection and Maintenance Procedures for European Industry) [1]. Within the RIMAP project, the RBIM methodology has been developed and validated for
chemical, petrochemical, power and steel industries in Application Workbooks [10], [11], but
the methodology as such is intended to be industry independent. The methodology addresses the following aspects:
Inspection and maintenance
All types of equipment, e.g. pressure containing, rotating, electrical, instruments and
safety devices
Technical and managerial aspects of maintenance and inspection planning
Asset management related to inspection, maintenance and life assessment for
plants, systems and components
Production and operation
Although RBIM encompasses RBI & RCM, this document focuses primarily onto RBI. The RCM
is included only up to the extent to demonstrate the applicability in the overall context of
RBIM.
15 Hence forth, the term RBIM will be used in this document in place of similar terminologies like RBLM, RBMI, etc.

SafeLife-X
page 82
A.2.2 Normative References
The following referenced documents are indispensable for the application of this document.
For dated references, only cited applies. For undated references, the latest edition of the referenced document (including amendments) applies
[1] “Best practice for Risk Based Inspection as a part of Plant Integrity Management” by
J.B. Wintle, B.W. Kenzie, G.J. Amphlett and others, ISBN 0717620905, Health and
Safety Executive (HSE Books), (CRR 363/2001); www.hsebooks.com/Books/
[2] EN473 – “Non destructive testing - Qualification and Certification of NDT personnel –
General principles”, European Committee for Standaradization (CEN)
[3] CEN/TR 14748 Non-destructive testing – Methodology for qualification of non-destructive tests, European Committee for Standaradization (CEN),
[4] IEC 812 – “Analysis techniques for system reliability – Procedure for failure mode and
effects analysis (FMEA)”, International Electrotechnical Commission (IEC),
[5] EN ISO 14224 –”Petroleum and natural gas industries – Collection and exchange of
reliability and maintenance data for equipment”, European Committee for
Standaradization (CEN),
[6] NACE TM0248 – “Evaluation of pipeline and pressure vessel steels for resistance to
hydrogen induced cracking”, NACE Int. (USA)
[7] SAE JA 1011 – “Evaluation Criteria for Guide to the Reliability Centered Maintenance
(RCM) Processes” (1998) – SAE International G-11 Supportability Committee; www.sae.org/technical/standards/JA1011 199908
[8] SAE JA 1012A – “Guide to the Reliability - Centered Maintenance (RCM) Standard”
(2002), SAE International G-11 Supportability Committee; www.sae.org/technical/standards/JA1012 200201
[9] EN ISO/IEC 17020 (ISO/IEC 17020) – “General criteria for the operation of various
types of bodies performing inspection”, European Committee for Standaradization (CEN)
[10] EN ISO/IEC 17025 (ISO/IEC 17025) – “General requirements for the competence of
testing and calibration laboratories”, European Committee for Standaradization (CEN)
NOTE: Other cited references in the text of this document are presented as reference
documents in Bibliography.

SafeLife-X
page 83
A.2.3 Definitions, symbols and abbreviations
A.2.3.1 Definitions
Risk is the combination of the probability of an event and its consequences (ISO/IEC Guide
73:2002 definition 3.1.1 “Risk management – Vocabulary – Guidelines for use in standards”)
Risk Management is the systematic application of management policies, procedures, and
practices to the tasks of analyzing, evaluating and controlling risk. (ISO 14971:2000)
A.2.3.2 Symbols
The symbols used in this CEN Workshop Agreement and corresponding designations are explained below.
Symbol Designation Unit
Nm flammability index
Nh health index
ke enclosure penalty
k temperature penalty
kv vacuum penalty
kp pressure penalty
kc cold penalty
kq quantity penalty
Cf combustibility number
Ch toxicity number
Pw working pressure bar
V volume of the quantity of vapour or gas m3
M mass of the liquid heated above the boiling point kg
T superheating above atmospheric boiling point (Tw -
Θ b,a)
°C
mh mass of toxic substance kg
CLP Cost of Lost Production €
CPC Cost of restoring Primary failure (faulty item
required for original function)
€
CSC Cost of restoring Secondary failure/ faulty items €
CId Indirect costs €
A.2.3.3 Abbreviations
Abbreviations referred in the document are given below.
Acronym Definition
ALARP As low as reasonably possible/ practicable

SafeLife-X
page 84
Acronym Definition
API American Petroleum Institute
ASME American Society of Mechanical Engineers
CMMS Computerized Maintenance Management System
CoF Consequence of Failure
FME(C)A Failure mode, effects (criticality) and analysis
HAZOP Hazard and operability (study/analysis)
HCF / LCF High Cycle Fatigue / Low Cycle Fatigue
HFF / LFF High Fluid Flow / Low Fluid Flow
HS(S)E Health, Safety (Security) and Environment
HSE Health, Safety & Environment
HT High Temperature
KPI Key Performance Indicators
LoF Likelihood of Failure
MTBF Mean Time Between Failure
NDT Non-destructive testing/inspection
O&M Operation and maintenance
P&ID Process and Instrumentation Diagram
POD Probability of Detection
PoF Probability of Failure
QA Quality Assurance
QRA Quantitative Risk Analysis
RBI Risk Based Inspection: methods to plan, implement and evaluate inspections using risk based approach
RBIM Risk Based Inspection and Maintenance: methods to plan, implement and evaluate inspections and maintenance using a risk based
approach
RBM, RBLM Risk-Based Maintenance, Risk-Based Life Management
RBWS Risk Based Work Selection
RC(F)A Root Cause (Failure) Analysis
RCM Reliability Centered Maintenance: methods to plan, implement and
evaluate maintenance using reliability to rank the importance of
targets and measures
RIMAP Risk based Inspection and Maintenance Procedures

SafeLife-X
page 85
A.2.4 RIMAP Framework
A.2.4.1 RIMAP vs RBIM
The collection of reports on Risk Based Maintenance and Inspection (RBIM) is the deliverable
from the European Commission funded project RIMAP - Risk Based Maintenance Procedures for European Industry [1]. The documentation provides guidance for risk-
based planning and execution of maintenance and inspection. Hence forth the term “RIMAP”
used in this document will be synonymous to the RBIM methods as applied in the RIMAP project.
The RIMAP documentation provides also the guidance for quality assurance and follow-up of
activities, tasks and work processes within an organisation that is used for risk-based asset management. The need for quality of all the elements in the work process elements and the
need for continuous improvement shall be emphasised. Also, it is important to ensure that
the link between the engineering planning and the actual execution of RBIM is maintained.
RBIM should not be considered as a 'quick fix' methodology for reducing costs but as a comprehensive philosophy for managing asset integrity. The procedure therefore needs to be
endorsed and supported by management and its use encouraged accordingly.
A.2.4.2 RIMAP Principles
Since the late 1990’s the maintenance approaches in industry have been globally moving
from prescriptive/time-based towards risk-based inspection decision making. This trend is
driven by the clear objective to increase the on-stream production time to reduce
unscheduled downtime due to breakdown maintenance or unknown equipment condition which may ultimately cause a shut down.
In general terms, if a company wants to apply a simple prescriptive maintenance/inspection
approach then it is necessary to apply strictly conservative criteria for the decision making process.
A risk-based approach on the contrary needs a detailed multi-discipline engineering analysis
to ensure that safety issues are not sacrificed by implementing a maintenance/inspection planning process. An appropriate risk-based methodology covers following principles:
Plan the primary work products of RBIM assessments and management approach in
such a way that risks at system and/or equipment level are managed, highlighting
risks from both safety/health/environment (HSE) perspective and/or from the
economic standpoint
Define the RBIM methodology in a framework which meets common sense (such as
good engineering practices or industrial reference standards) in handling hazardous
materials and situations in industrial equipment
Address a generic work flow and competencies needed to handle projects in an
appropriate manner
Define minimum requirements for performing and documenting RBIM assessments in order
to comply with legal or normative regulations and guidelines
A.2.4.3 RIMAP Requirements
A.2.4.3.1 General requirements
The general requirements of RIMAP as applied to RBIM are:
a) The objectives and risk criteria should be clearly defined for the assessment.
b) The assessment and the applied detailed procedure should comply with the locally
applicable legal and regulatory framework
c) The required level of input information should be available for the assessment.
d) The assessment should be performed in a multidisciplinary team by personnel with the required competence, and using procedures and tools that can provide the required
results on the selected level of assessment.
e) The assessment and the applied procedure should be able to provide results, which are
safe
conservative

SafeLife-X
page 86
representable in risk matrix, auditable and consistent with both the objectives and
applied risk criteria
supporting RBIM planning and decision making on the target system or
component.
f) RBIM should be based on a team approach
g) RBIM should reflect the prevailing conditions in the plant, i.e. RBIM needs to reach the
“evergreen” status.
A.2.4.3.2 Personnel requirements
Risk based inspection and maintenance management requires experienced personnel at all
levels as well as appropriate routines for the execution of the work. Current relevant standards do not set fully comprehensive formal requirements for the qualifications of people
that perform inspection and maintenance planning, even if the execution of inspection and
maintenance activities is partly regulated through qualification schemes, such as e.g., ISO standards such as 17020 [9], 17025 [10], and European standard EN 473 requirements [2].
RBIM planning requires a multidisciplinary team with engineering competency within:
Inspection and maintenance
Specific equipment disciplines (e.g. materials, corrosion, electrical, fixed and rotating
equipment)
Safety and health issues
Plant operation and process
Reliability and risk assessment
NOTE: Particular cases may require special competencies. In addition, local rules and
legislation, and the type of industry may set detailed requirements to competencies involved. Due consideration should be given to the width of background skills and expertise collated in
the team. One or more of the skills may be possessed by one person, but it is emphasized
that RBIM planning is a team effort.
A.2.4.3.3 Requirements for performing PoF analysis
General RIMAP requirements for PoF analysis as given in [5] are:
1. General acceptability 2. Conservatism of simplified approaches
3. Audiability of results
4. Performance
5. Multi-level approaches (qualitative-quantitative, in depth of plant) 6. Procedural character
7. No averaging
8. Additional aspects to be considered 9. These requirements is explained in detail below.
General Acceptability
RIMAP describes a methodology for PoF assessment, which can be either used alone, or alternatively combined with established methods. PoF assessment method should be verified
/ benchmarked against a recognized (established) methodology, which is generally being
used, accepted and referred to in the open literature.
Conservatism of simplified approaches
The results from the risk screening may be on average conservative compared to the results
from a detailed analysis. Available methods for determining Probability of Failure may vary in
the level of detail. Method with less detail (e.g. qualitative analysis) can be conservative, in other words it may yield higher or equal average score of probability of failure compared to a
more detailed approach.
Auditability of results
The results should be auditable to similar experts (peer view); therefore the methodology,
the input data, the decision criteria and the results may be documented (the results may be
recorded in an approved document).
Qualification

SafeLife-X
page 87
The RBIM team may include with written evidence the following areas of expertise:
inspection, maintenance, materials technology, process technology, operations and
facilitation. For each area of expertise a certain requirement should be defined related to education and experience. The facilitator should have expertise on the methodology and lead
the analysis process. Some of the expertise may be combined in one person. An expert
should back up the RBIM team on process fluid characteristics and the possible modes for loss of containment.
Multi-level approaches
(qualitative-quantitative, in depth of plant)
Both qualitative and quantitative approaches (ranging from screening to detailed) may be
used. The use of descriptive terms, such as “very high” to “very low” or similar can be used
only if the meaning (explanation) of these terms is provided. The approach can be multi-level both in terms of “qualitative/quantitative” and in terms of going “in-depth” into plant
equipment hierarchy.
Procedural character
The PoF assessment shall be structured as a procedure with well defined boundary conditions (e.g. as provided within the RIMAP procedure).
No averaging
The PoF rating should be such that the highest rating for one of the individual aspects of different damage mechanisms and trigger events should control the final rating score in
order to prevent averaging of the ratings for various aspects. Alternatively, probability tree
diagrams can be used to model the causes leading to single PoF’s. In such a case, the probability of each branch in the reliability diagram can be combined (parallel/serial –
OR/AND) in order to define the final PoF. The same applies to single PoF’s: they can be
combined in the same way to avoid averaging and producing consequent unrealistic values of PoF.
Additional aspects to be considered
PoF analysis shall be done in such a way that the following aspects are covered to screen the operation to identify the active damage mechanisms
identify susceptible damage mechanisms
establish realistic (“best estimate”) damage rates
link PoF to the effectiveness of the inspection program in the past as well as in the
one planned for the future.
determine the confidence level in the damage rate
assess the effect of the inspection program on improving the confidence level in the
damage rate
assess the probability that a given level of damage will exceed the damage tolerance
of the equipment and result in failure
analyze possible interaction or synergy effects for all damage mechanisms.
determine PoF with respect to the planned interval for the next inspection
determine PoF with respect to risk acceptance criteria
A.2.4.3.4 Requirements for performing CoF analysis
RIMAP requirements for CoF analysis addresses various types of consequences as [4]:
1. General requirements for CoF assessment 2. Requirements on CoFsafety
3. Requirements on CoFhealth
4. Requirements on CoFenviornment
5. Requirements on CoFbusiness
Each of these requirements is explained in detail below.
General requirements for CoF assessment
In order to assess the CoF, at least the aspects Health, Safety and Environment should be included. There are two possible ways to deal with CoF (a) real consequences related and (b)
potential consequences related (e.g. the RIMAP CoF). If the RBIM process is used for
assuring Health, Safety and Environment rather than a financial optimisation, averaging of

SafeLife-X
page 88
individual aspects (Health, Safety and Environment and/or business consequences) is not
allowed.
Requirements on CoFsafety
The CoFsafety assessment shall be documented and approved by the responsible authorities
recognized by the national regulations, if necessary.
The methods can be based on at least one or more of the following aspects (depending on the type of equipment and fluid):
released mass flow rate of fluid
type of release (instantaneous discharge of total contained quantity or by leakage at
a specified rate)
flammability
toxicity
energy release (pressure or heat)
kinetic energy of projectiles
Requirements on CoFhealth
6. The CoFhealth assessment shall be documented and approved by the responsible
authorities recognized as per the national regulations, if necessary. 7. The methods can be based on at least one or more of the following aspects
(depending on the type of equipment and fluid):
properties of the fluid that effect health
released mass of fluid
effect on people in the long term
Requirements on CoF environment
1. The CoFenvironment assessment shall be documented and approved by the responsible
authorities recognized as per the national regulations, if necessary.
2. Environmental impact shall include effects on soil, air, surface water and ground water.
3. The methods can be based on at least one or more of the following aspects
(depending on the type of equipment and fluid:
properties of the fluid that effect the environment
released mass of fluid
direct and indirect effect on flora and fauna
remediation effort
Requirements on CoF business
The CoFbusiness assessment shall be documented, if necessary.
A.2.4.3.5 Risk assessment Requirement
All requirements specified for personnel, PoF assessment and CoF assessment are also applicable to Risk assessment requirements [2]. In addition, the following requirements shall
also be satisfied for conducting risk assessment:
1. Development of a scenario for each failure mode is a critical step. Even though various techniques are available such as fault tree analysis, event tree cause-effect methods,
etc., bow-tie modelling is recommended due to the simplicity of charting different
scenarios and the ease with which the result can be understood. When the bow tie model is constructed (the fault and event tree established) different scenarios for the failure
modes can be developed by following different paths from root cause/damage
mechanism to potential final consequence.
2. It is not allowed to combine PoF’s and CoF’s related to different scenarios (e.g. different failure modes) even if they refer to the same equipment.
3. Efficiency of the risk mitigating activities shall be connected to identified failure modes
and the projected risk reduction shall be quantified.
A.2.4.4 RIMAP within the overall management system

SafeLife-X
page 89
The development and implementation of a RBIM plan requires resources such as personnel,
budget, spare parts and documentation. Management should assess the effectiveness of the
RBIM by monitoring performance indicators like reliability, costs and risks.
RBIM planning requires a multidisciplinary team with a range of engineering competency.
Management should identify and define the objectives related to acceptable levels of risk in
inspection and maintenance activities. The objectives should be transparent and support the company’s overall objectives, with respect to health, safety, environment, production,
quality, etc. The objectives should also be in line with national and other normative
requirements, and possible contractual requirements.
The RBIM strategy should ensure that risk mitigating actions are identified and implemented
before the health, safety or environmental (HSE) risks associated with an equipment failure
become unacceptable. If the HSE risks are ‘tolerable’/acceptable, actions to reduce economic and other business risks may still be needed.
RIMAP framework shall be seen as a part of the overall “Working process” consisting of
Definition of objectives, goals and requirements
Establishing of inspection and maintenance program
Plan for tasks and activities in inspection and maintenance
Execution of the work orders
Reporting about failures and status
Evaluation of the technical conditions
Preparing for the improvement tasks
Performing of corrective action
Active management
Management of change
Operating procedures
Safe work practices
Pre-start-up reviews
Emergency response and controls
Investigation of incidents
Training
Quality assurance
A.2.4.5 Limitations
The RIMAP framework is also applicable to industries other than those directly addressed
(petrochemical, chemical, power, and steel), however it is limited to non-nuclear applications. The RBIM framework only applies to systems and equipment in the in-service
phase of the operation. For the design or fabrication phase, the relevant legislation and
engineering standards shall be followed. If RIMAP principles or procedures are used, it shall be ensured that all measures are in compliance with local and national legislation. While
applying RBIM following aspects should be kept in mind
1. An RBIM assessment is only as good as input data provided
2. RBIM is not a replacement for good engineering practices / judgement
A.2.4.6 Compatibility with other known approaches
The overall RIMAP approach is in general compatible with most other major risk-based
approaches such as those designed by API [16], VGB [23] or ASME [12] and intended broadly for similar purposes. However, while the principles are largely similar, the user is
warned against expecting identical results. There are differences in detail that may result in
significant differences when using different approaches on the same plant, case or system.
For example, unlike most other known approaches, RIMAP was originally designed to be in principle industry independent and providing seamless transfer between different levels of
analysis (ranging from screening to detailed).
SafeLife-X
page 90
A.2.5 RIMAP Procedure
The RIMAP procedure provides guidance for developing and maintaining a risk-based
inspection and maintenance program, preferably embedded into a higher level quality or risk management environment. The procedure is applicable to many industries and to different
types of equipment (for example static equipment, rotating equipment, safety systems, and
electrical/instrument equipment). The steps in the procedure are the same for all cases, even
if the models and tools for assessing probability or consequence of failure may vary from one application to another.
The procedure includes the following main steps:
1. Initial analysis and planning
2. Data collection and validation
3. Multilevel risk analysis
4. Decision making and action planning
5. Execution and reporting
6. Performance review / evergreen phase
For each of the above steps the following elements are defined such as:
1. General description and scope
2. Requirements
3. Input
4. Procedure
5. Output
6. Warnings and applicability limits
An overview of the RIMAP procedure is shown in Figure 34.

SafeLife-X
page 91
Figure 34 - Framework of RIMAP procedure within the overall management system
INITIAL ANALYSIS AND PLANNING
Objectives, system, criteria Acceptance
Hazard identification
DATA COLLECTION AND VALIDATION
RISK SCREENING
Selection of systems, equipments, and components Determination of possible failure modes and consequences
RBI activities
EXECUTION AND REPORTING
DECISION MAKING / ACTION PLAN Operation review Inspection planning Monitoring Maintenance planning
Risk acceptable? No
Yes
PERFORMANCE REVIEW / EVERGREEN PHASE KPI Assessment Evaluation reporting Update periodically
RCM activities Safety system related
Mitigation measures
Integrity related Functionality related
Safety system related
Redefinition of the scope of analysis
Integrity related, Safety system related or
Functionality related?
Continuous improvement and
management change
Feedback
MULTILEVEL RISK ANALYSIS Scenario (Structural failures)
Probability of Failure (PoF) Consequences of Failure (CoF) Risk
Detailed Analysis
(Intermediate Levels)
Screening Analysis
MULTILEVEL RISK ANALYSIS Scenario (Functional failures)
MTBF Assessment Probability of Failure (PoF) Consequences of Failure (CoF) Risk
Detailed Analysis
(Intermediate Levels)
Screening Analysis

SafeLife-X
page 92
A.2.5.1 Initial analysis and planning
After having initiated the decision to establish RBIM using RIMAP procedure, the first step is
to start with the initial analysis and planning.
A.2.5.1.1 General description and scope
This stage consists of the following steps:
1. Definition of objectives (e.g.:company Health and Safety objectives, optimise timing
and extent of next inspection)
2. Definition of the systems and components to be considered as well as the respective
boundaries (example: preheating system from inlet x to outlet y (P&ID No. xyz)
including pressure vessels xyz, heat-exchangers xyz, and pumps xyz)
3. Definition of the scope of analysis, including operating conditions and exceptional
situations to be covered (e.g. disturbances, accidents etc.), as well as the operating
period covered.
4. Definition of data sources available (e.g. design data, equipment history)
5. Definition of regulatory requirements to be considered
6. Setup of the multi-disciplinary team
7. Tools (software) to be used
8. Assurance of the acceptance of the methodology and objectives with relevant
institutions concerned (internal e.g.: management and external e.g. approved bodies
and authorities)
In the following subsections, these steps will be described in more detail.
Definition of objectives
At this stage the management should clearly define measurable objectives of the assessment
and confirm the applied procedure suggested by the assessment team. These objectives are
largely defined in terms of health, safety, environment and business impact. In particular,
risk based inspection and maintenance when applied to a plant should address one or more of the following objectives:
meeting the requirements on health, safety and environmental regulations by
reducing the corresponding risks to ALARP
improving the safety and reliability of the plant
optimising inspection and maintenance (possibly also production and quality) cost
extending the useful service life of plant, e.g. beyond its design life, and
implementing an appropriate end of life strategy.
The final objectives and targets of the implementation project to be initiated shall be fixed in
writing.
Definition of systems and components to be considered
A risk-based analysis can focus on a network of plants, a single plant, certain systems (unit
operations) of a plant, a certain component or even a part of it. The input step of the preparatory work serves the purpose of defining the systems and/or subsystems of interest.
Systems are generally defined based on the functions they perform. There are many ways to
divide a system into sub-systems, i.e. to create a system-component hierarchy. The sub-
systems should be easily manageable and meaningful to allow for assessment of specific issues related to them, e.g. according to particular damage mechanisms, a certain fluid, a
process function or the same level of inventory. The level of detail on systems, equipment
and its components, and their hierarchy may differ on the chosen methodology (RBI/ RCM).
Every system and sub-system should be clearly defined in terms of its boundaries, for
example when considering a pump, whether only the impeller and housing or also the drive
mechanism, the power source etc. are included. Establishment of boundaries is based on criteria specific to particular needs, such as safety aspects, operational requirements,
process interactions, jurisdictional constraints, available data, etc.16
16 For the establishment of boundaries in petroleum and natural gas industries, ISO 14224 [5] recommends rules for the definition of boundaries and also gives further guidance in the

SafeLife-X
page 93
As a general rule, one should remember that there is also a risk in defining the system to be
assessed too widely. The complete picture of safety and integrity can be clouded by
complexity or too much information, resulting in confusion and misinterpretation. On the other hand, too narrow a definition may lose sight of the impact a failure or process upset in
one subsystem may have on another [25].
To establish the system/component hierarchy, every sub-system is further divided into components and/or locations that might relate to a system failure. This ‘decomposition’
should continue until the smallest components for which sufficient data from inspections,
maintenance, and failure history are available or may be collected, are examined.
Definition of the scope
For all defined systems (from the input) the scope of the analysis should be determined
including operating conditions, loads and exceptional situations e.g. upsets and the operating period to be covered.
Definition of data sources available
The data sources available shall be identified. It should be ensured that a minimum of
information is available, as
Design data
Operating data
Historical data (maintenance and inspection records)
Before collecting the data, the RBIM team should estimate the quality and quantity of the
data that are needed to fulfil the requirements stated in the objectives of the assessment.
The data should be balanced for the needs of the application (system or component), scope of the assessment, expected level of detail (or acceptable uncertainty) in the results, and
foreseen future service.
Definition of regulatory requirements to be considered
Regulatory requirements which apply shall be carefully identified. Requirements may be on
the qualification of some team members, software tools to be used (see 5.1.1.6 and 5.1.1.7
below), etc.
Setup of the multi-disciplinary team
Successful risk based assessment, in general, can only be conducted if competent technical
input and perspectives from different disciplines are available. This can be achieved only by
team effort. To setup the procedure, the required expertise of the team should be defined. Usually a RBIM team should have competencies within
Inspection and maintenance
Specific equipment disciplines (e.g. materials, corrosion, electrical, instrumentation &
control, fixed and rotating equipment)
Health, safety and environment issues
Plant operation and processes
Reliability and/or risk assessment
Much attention should be paid in the beginning to the selection of the competent team,
which is a key element in successful risk based assessment. No sophisticated details in the procedure or other tools can compensate for possible deficiencies in the team, because this
would very much affect the quality of input information, foreseen failure scenarios and
conclusion of the assessment.
Managing risk based inspection and maintenance requires experienced personnel at all
levels, as well as appropriate routines for implementation (See section 4.3.2 on personnel
requirements).
Where the needed expertise is not covered by in-house resources, appropriate external experts shall be consulted. This can apply to expertise in reliability and risk analysis, but
particular cases may also require special competencies, e.g. in deterioration mechanisms or,
statistics.
form of examples. In the case of power plants the most common criteria are plant availability and safety [12].

SafeLife-X
page 94
In addition, local rules and legislation, and the type of industry may set detailed
requirements to competencies involved. Due consideration should be given to the depth of
background skills and expertise collected in the team. One or more of the skills may be possessed by one person, but it is emphasised that RBIM is a team effort.
Tools to be used
In general it is impractical to perform risk assessment without the support of dedicated computer tools (software) for the purpose. Such tools are used for managing the input data
and for performing the operations of risk assessment and related decision making.
Computerised systems are also used to store the data, analyse results and other related information for the next time the need for analysis arises. Dedicated software tools are widely
used to manage the large amount of input data that will be collected from the systems to be
assessed. In such a case, it is convenient if the tool can be integrated with existing data collection systems, such as those used for inspection and maintenance.
The user shall make sure that the software to be used is able to comply with the targets
given and that the basic calculation methodologies (if there are any) comply with local legal
requirements.
Accuracy of the acceptance
At this stage the assessment team and the management should also have a general idea
about the level of commitment and resources required for a successful implementation of the procedure, and about the time available to produce the results.
The responsible team should take all necessary actions to ensure the acceptance of the
procedure and its objectives by the essential stakeholders, such as the owner, management, and the authorities/notified bodies.
HSE risk (Health / Safety / Environment)
The metric for risk based decisions should be defined via company standards and/or national legislation. For the process industry in general, three different risk criteria are used:
Plant worker safety
3rd party safety (people outside the plant border)
Environmental damage, long and short term
The risk acceptance criteria are used to derive the required maintenance activities within the
given time frame. For degradation mechanisms developing with time, the degradation rate
and acceptance limit provides an upper bound on the time to preventive maintenance or time to inspection. Also the effectiveness of an inspection method for detecting degradation and
coverage shall be considered.
Other criteria: Business risk
In case of business impact, no similar absolute limits are provided by the regulatory
framework or comparable practices. Instead, the business impact associated with the
assessed risk is to be compared with the competing alternatives in monetary terms. To achieve reduction in the allocated resources e.g. through lower cost of inspection and
maintenance, may require lower volume but improved targeting of inspections and
component repair/replacement, rescheduling of such actions when possible, or changes in the process or operational practices. If necessary, also other quantities such as product
quality may be used as additional risk criteria.
Combined criteria
For combined criteria, the HSE criteria should be used to define the limit of unacceptability (between intolerable and ALARP regions), when the HSE criteria arise from mandatory
regulatory limits. This may leave other quantities such as economic criteria to define the limit
of acceptability towards negligible risk (i.e. ‘tolerable if ALARP’ to ‘broadly acceptable’). Also other quantities such as product quality may enter into the combined criteria, often using
quality cost as common monetary basis for the combination.
A.2.5.1.2 Requirements
The responsible team should take all necessary actions to ensure the acceptance of the
RIMAP procedure and its objectives by the owner and/or management of the plant and by
the responsible authorities.
A.2.5.1.3 Inputs

SafeLife-X
page 95
From an applicability point of view, it may be more useful to perform a relatively thorough
analysis of a smaller but well defined sub-system than a very approximate assessment of a
much wider system. However, a rough screening level analysis can also be useful to pinpoint the sub-systems for more detailed assessment. There is also a risk in defining the system to
be assessed too widely, as the complete picture could be clouded by complexity or a very
large amount of information. On the other hand, too narrow a definition may lose sight of the impact that a failure or process upset in one subsystem may have on another [1]. The
functional boundaries of a system may depend on the mode of plant operation.
A.2.5.1.4 Procedure
Lacking stakeholder support or even indifference to the objectives and procedure of the
assessment can seriously limit the applicability of the effort taken. Such support should be
seen as mandatory for meaningful assessment.
For defining credible failure scenarios, the team responsible for the implementation of the
procedure should agree what within the context of their industry is considered a failure of an
item of equipment. This activity should be a company issue. Moreover, the function of a
component may depend on the mode of operation of the plant. For example, a feed water pump system comprising three units (pumps) is fully operational at full power (all three
pumps are needed). The same system at less than full power contains one redundant unit
(two pumps are needed; the third is a standby unit available on demand).
Therefore, whenever a plant may have more than one mode of operation, it is necessary to
define failure criteria that take into account the specifics of each operational mode.
A.2.5.1.5 Output
The expected output from the preparatory work is the following:
selection of the applied procedure, competent assessment team and supporting tools
defined system of interest, system/component hierarchy and boundaries for the
assessment
objectives, scope and methods of the effort, as well as confirmation of stakeholder
support for these
collected regulatory requirements to set boundaries to the assessment and decisions
affected by the results
collected risk assessment criteria from foreseen health, safety, environmental,
business and other impacts.
A.2.5.1.6 Warnings and applicability limits
The essential parts of planning, including the requirements, inputs, procedure and output all
involve items of caution and applicability limits. Some of the most common ones are outlined below, with some specific issues related to static, active and safety equipment.
Specific issues related to static equipment
Many static components are subject to mandatory regulations, e.g. pressure equipment and storage vessels containing fluids with potential hazard of toxic release, fire or other
environmental impact. In such a case the competent team should include or have otherwise
available sufficient expertise on this regulations. These regulations will often require consideration of HSE criteria in assessment. The underlying potential hazards will frequently
set the scenarios to be dealt with in the risk assessment.
Specific issues related to active components
Most active components are not subject to normative regulation, which therefore will not set
the criteria of assessment. However, active components such as turbines, pumps, motors,
compressors, generators, fans, valves and gears are often subjected to significant loading in
service, and form important parts of the critical systems or subsystems to be considered from the risk point of view.
Active components in particular may have more than one mode of operation, and then it is
necessary to define failure criteria that take each mode into account.
A.2.5.2 Data collection and validation
A.2.5.2.1 General description and scope

SafeLife-X
page 96
The collection and organization of relevant data and information are mandatory prerequisites
to any form of risk based analysis. Much of this data is probably related to design, operation
and failure information. The data are used to assess both the probability and consequence (and thus the risk) of a failure scenario with analysis method(s) that meet the requirements
of the generic RIMAP procedure.
Information for risk-based analysis may be available or obtainable from many sources. However, the quality of the data can be very case-dependent. Where the data are sparse or
of poor quality, the uncertainty associated with the risk assessment will be greater.
Before collecting data, the RBIM team should estimate the data that will actually be needed. This is partly to match the data collection with the analysis, and partly to assess the effort
needed considering the data and information that are already available and data that require
additional work. The collected data are best stored in a well-structured database, which will not only facilitate the assessment process but also updating and auditing the processes that
are an essential part of the RIMAP procedure.
A.2.5.2.2 Requirements
Data should be collected from many different areas including:
Plant level data
Design Manufacturing and Construction
Operational
Maintenance and Inspection
Safety systems
Cost
Generic or equivalent industry databases
In addition to reviewing documents, such as electrical diagrams, process and instrument
drawings, process flow diagrams, maintenance and operating records and procedures, etc.
the team should ensure that relevant non documented data are collected.
The team should have access to plant personnel who can provide an understanding of the
actual plant configuration and operating conditions, the effectiveness of the plant inspection
and maintenance programs, the identification of problems particular to the investigated plant. Involvement of plant personnel will contribute to their acceptance of the outcome of
the risk based analysis and its success.
A.2.5.2.3 Input
It is recommended that the established RBIM team follows the data collection and validation procedure outlined below. It should be noted that before this step the team should have
initially estimated the rough quality and quantity of data that is needed for the analysis. The
collected data should be verified and stored, when used for RBIM analysis and documentation.
1. Collect and validate documented relevant data, which typically includes at least some
elements of the following:
Technical data on design, manufacturing and construction
These data are largely plant and component specific, and in the form of numerical
data and e.g. diagrams and drawings of the process and systems, components,
controls and instruments, as well as safety systems. These background data also
describe the functional requirements and intended loadings, and may indicate
potential locations of failures. Data validation can be performed by internal cross-
comparisons, comparison to physical and technical limits of the process and by cross-
comparison to expert opinion (see below on non-documented data).
Inspection and maintenance history (including failure analysis)
These data are plant and component specific, and typically include records of
inspection results and of possible corrective actions such as repairs or modifications
to the original system or component. The records may also include experience on the
mode and causes of failures or other process disturbance. Most recent data updates
preceding information, and it may be possible to construct time series from these
data. Records of previous engineering and failure analysis, as well as data and
results from other procedures (e.g. RCM, QRA, PHA, and HAZOP) can be considered

SafeLife-X
page 97
as input to the RBIM analysis. Data validation can be performed as above for other
documented data.
Operational history
These data are plant and component specific, and may include at least some records
of operator logs to identify operating periods, transients, starts, trips and other shut-
downs, and load levels during different phases of operation. These records also
indicate to what extent the actual operation may have deviated from that intended in
design. For predicting the future performance it can also be important to consider the
future mode of operation, if it is foreseen to be different from that in the past. Data
validation can be performed as above for other documented data.
Generic failure and operational data for similar cases or components
Generic data on failures for similar cases and components is available from various
sources [10], [11]. Generic data on operational experience are partly included in
these sources, although the available information can vary widely depending on case
and component. Data validation can be mainly performed by comparison of such
sources and by expert opinion, but also in validation the options may be limited by
the availability of information depending on the case or component.
Cost information on the facility
These data can in principle be plant and component specific, but are also often taken
as generic for each component type and class, and type of action on it. Data
validation can be performed by cross-comparisons or by asking for quotations from
suppliers. The required information can also include cost of lost production and
indirect losses.
2. Collect relevant non-documented data Relevant, non-documented data are generally available from most if not all of the
sources (listed above) from which documented data should be collected. Non-
documented data typically exists as personnel knowledge and opinions, which can be a very important source of information for RBIM analysis. Therefore, the team should have
access to the personnel that can provide an understanding of the actual system and
component configuration and operating conditions, the effectiveness of the inspection and maintenance programs, and identification of specific problem issues. The
recommended interview process of the personnel (e.g. operator, maintenance engineer,
instrument technician etc., called "expert" below) to estimate failure probabilities is as
follows:
a) Expert opinion on his/her general experience with the component or system
In this initial stage of the interview the expert is given the opportunity to describe
his/her own experience or feelings about the target component (or multi-component
system) and its history.
b) Expert opinion on the perceived consequences (also personal) of unforeseen
component failure
This opinion can indicate the expected consequences but also potential personal bias
when compared with opinions on other issues.
c) Expert opinion on the earliest possible time of failure
This question serves as an introduction to opinion-based life assessment of the
component or system, first for the short-term end of the perceived scale.
d) Expert opinion on the longest possible life (for a single component), or (for multi-
element components) on a time when it is no more worth repairing
This question is for the long-term end of the opinion-based life assessment. In case
of multi-element component, an opinion on the number of failures per year (or other
time period) after which the component is not worth repairing can also be helpful .
e) Expert opinion on the reasons for the earliest and latest possible failure times.
This question aims to encourage reasoning and forgetting possible previously
memorised numbers and it is suggested that at least two reasons are given for both
ends of the timescale.
f) Expert opinion on reasonable time intervals between shortest and longest failure
times
Agreement on the intervals is important, because too coarse a scale will not reveal
uncertainty, and too fine a scale may require excessively detailed thinking. Often 4-5

SafeLife-X
page 98
time increments are sufficient, and for many systems the increments are expressed
in whole years. This allows for the establishment of a time scale from earliest to
latest possible perceived failure time, with time increments in between.
g) Expert opinion on the likelihood or frequency distribution of failure in time
The expert is given e.g. 50 similar coins or comparable objects, and asked to place
them on the above defined time scale intervals, at least one in each interval but
otherwise in proportion of his/her feeling on when the failure is going to take place.
In the end, the expert is re-queried to confirm or modify the distribution.
h) Recording of the resulting lifetime distributions
The resulting distribution can be normalised by multiplying the number of objects in
each category (interval) by 2 and dividing the result by 100. The results are
documented and provided for RBIM analysis.
A.2.5.2.4 Procedure
The collected data should be validated and stored, when used for RBIM analysis and
documentation. Validation may not always be easy for one-off analyses or measurements, but cross-comparisons, checks for compatibility with physical and technical limits, compliance with
calibration requirements or standards/guidelines can be often used for this purpose.
Comparison to externally available information may also help, for example data on technical
details and cost from the equipment suppliers.
Data and results from other procedures (e.g. RCM, Quantitative Risk Analysis, Process Hazard
Analysis (PHA), and HAZOP, previous risk based assessments if available) can be considered
too as input to the RBIM analysis.
Documented background data are often available as e.g. diagrams and drawings of the process
and systems, components, controls and instruments, safety systems, and maintenance and
operating records and procedures. Useful operational and other plant specific data can include severity, mode and causes of failures, and operator records to identify operating periods,
transients, starts, trips and other shut-downs, and load levels during different phases of
operation.
Relevant non-documented data and information are typically available as personnel knowledge
and opinions. For these sources the RBIM team should have access to the plant personnel that
can provide an understanding of the actual plant configuration, operational history,
maintenance effort, and current/future condition.
A.2.5.2.5 Output
The output of the data collection and validation should be an assessment of all relevant and
representative data, which are needed for the risk calculation of the components of interest. This data should be collated in an appropriate way, e.g. by storage in a database.
Depending on the availability of data, a change in the system/component boundaries
identified during the initial analysis and planning may be needed. Also, insufficient data may require additional effort to produce new data through engineering analysis or by other
means. In such a case, data validation and re-assessment is also needed.
The output of data collation and validation mainly consists of raw technical data and information related (or processed) to failure probabilities and consequences. The defined
objectives and the system to be assessed can largely dictate the depth and extent of the
output of data collection serving these higher purposes.
Support of the management and involvement of the plant personnel are important and will
contribute to their acceptance of the outcome of the risk based analysis, and may also
positively influence the quality of the data.
A.2.5.2.6 Warnings and applicability limits
The data related to design, manufacturing and construction (assembly) may not be always
updated according to later modifications. This is particularly likely for older equipment that
has been used for many decades and originates from the time before modern CAD/CAM documentation. The same may also apply to controls and instrumentation, and to operational
and maintenance history records for similar reasons. Expert opinion of the plant personnel
about these issues may be essential.
One problem in the data collection is the quality of generic databases – and particularly their
failure frequencies to include information related to inspections, maintenance and operating

SafeLife-X
page 99
conditions of a component. Thus, these databases should be used with care, and qualified for
use in each case. Their applicability depends greatly on several parameters
Type of plant/component (size and fuel type)
Manufacturer
Process fluid (including chemical control, corrosion, erosion)
Operation parameters (process pressure and temperature, vibration etc.)
Operating environment (moisture, temperature, etc.)
Operating constraints (load following vs. steady state)
Inspection system/program/techniques
Geographic area (environment and external influences)
This means that in order to obtain a reasonable probability (or likelihood) one has to modify the generic data (i.e. to calculate equivalent data) by taking into account all conditions
prevailing to the specific problem of interest (for more information, refer [5]).
Another potential problem is that the method of development of a generic database often screens out specific component failures. For example, the NERC-GADS [19] system is only
concerned with derating and forced plant outages; component failures not associated with
derating or forced plant outages go unreported [12].
A.2.5.3 Multilevel risk analysis (ranging from screening to detailed)
A.2.5.3.1 General description and scope
Risk analysis consists of the following steps:
a) Identify hazards
b) Identify relevant damage mechanisms and failure modes
c) Determine probability of failure (PoF)
d) Determine consequence of failure (CoF)
e) Determine risk and classify equipment
Multilevel risk analysis defines the risk assessment in terms of (i) complexity of the analysis
(e.g. from the simplified/screening analysis to the detailed one), and in terms of and (ii) plant hierarchy level (depth). It can be seen in Figure 35, that complexity of analysis or in
other words, the number of components for analysis decreases steadily from screening to
detailed analysis in RIMAP approach, whereas it decreases step wise in a conventional approach It can be seen in Figure 36, that depth of analysis increases steadily from
screening to detailed analysis in RIMAP approach, whereas it increases step wise in
conventional approach
Figure 35 - Multilevel risk analysis: Complexity of analysis
Screening level Intermediate Detailed
Nu
mb
er o
f co
mp
on
en
ts
Conventional approach RIMAP approach
“gain”: reduced number of
components analysed

SafeLife-X
page 100
Figure 36 - Multilevel risk analysis: Plant hierarchy level
The inputs usually required for each step of screening and detailed phases of risk assessment are given in Table 11. It can be seen from the table that some inputs are common for both
the phases, whereas the detailed phase calls for much more elaborate data for analysis.
Screening level Intermediate Detailed
Dep
th o
f an
aly
sis
Conventional approach RIMAP approach
“gain”: reduced effort for analysis

SafeLife-X
page 101
Table 11 - Input source for Screening & Detailed risk assessment
Topic Activities involved in Screening
Risk Assessment
Common for both Screening &
Detailed Risk Assessment
Activities
involved in
Detailed Risk Assessment
Specific for Detailed Risk Assessment17
A. Identify hazards
Identify the relevant hazards for each system within the boundaries of the
scope of work.
Input from initial analysis and planning
Identify the relevant hazards for
each system within the boundaries of the scope of work
See chapter 7.5.3.3.A
B. Identify
relevant
damage mechanisms
and failure
modes
Determine the operating conditions,
upsets, likely excursions, as well as
future process conditions should be taken into account to identify the
possible degradation and/or failure likely to occur.
Review the applicability of
Damage mechanism classification
(e.g. RIMAP I 3.1[3], OREDA [20], API [15]) and exclude those
mechanism which do not apply
See chapter
7.5.3.3.B
Determine Operating and design conditions,
Upset conditions
Determine susceptibility windows of degradation mechanisms.
Characteristics of potential degradation
mechanisms, e.g. local or overall degradation, possibility of cracking, detectability (in early or
final stage).
Mechanical loading conditions
Geometry and structure of each piece of
equipment from the point of view of susceptibility to damage mechanisms
C.
Determine
probability of failure
(PoF)
For each hazard identified in each
system, the PoF should be assessed.
PoF should be determined for the pre-defined time frame.
The estimate should be conservative and
based on the available information and expert judgment.
When the PoF has been determined, it
should be assessed whether the PoF is high or low. This amounts to
determining whether the PoF is higher or lower than a predefined limit.
If this is difficult one may set the PoF
equal to 1 and perform a consequence screening
Predefined time frame (from
initial analysis and planning)
Maintenance and inspection history of the item of equipment
under consideration.
Specification of the operating window including factors which
can be influenced by the operation of the process (e.g.
temperature, pressure) as well as
factors which cannot be influenced by the operation (e.g.
composition of the process
medium).
Experience with similar
equipment, e.g. average
See chapter
7.5.3.3.C
Value of expected residual lifetime
Weighing system/factor to take account of the
uncertainty of prediction
prediction of lifetime based on measured
inspection data, a calculation making use of
operating conditions, or expert opinion. Specific analysis tools may be used, e.g. probabilistic
(safety) analysis and/or fitness for purpose analysis.
For non-trendable degradation mechanisms for
which progress cannot be properly monitored or predicted (e.g. stress corrosion cracking), it
should be demonstrated that degradation is
prevented or detected early by means of sufficient measures to be taken (inspection,
maintenance, operation). A methodology should be available in which the relation between the
17 Eventhought the methodology is similar to all type of equipments, examples are explained based on static equipments.

SafeLife-X
page 102
Topic Activities involved in Screening Risk Assessment
Common for both Screening & Detailed Risk Assessment
Activities involved in
Detailed Risk
Assessment
Specific for Detailed Risk Assessment17
probability data from a relevant
database.
Plant specific experience (data or
soft knowledge).
effectiveness of measures (type, scope and
frequency) and probability of failure is given.
Handling of unknown damage mechanisms.
D.
Determine consequence
of failure
(CoF)
The worst possible outcome of a failure
should be established. The safety, health, environment, and business
consequences shall be considered. Other consequences as quality of production
and business impact may also be
included.
When the CoF has been assessed it
should be decided whether it is high or
low, depending on whether the CoF is above or below a predefined limit.
Possible limits are
Safety consequences: Any failure which
may lead to injury of personnel.
Environmental consequence: Release of toxic substances.
Business consequence: any failure
leading to loss of production or assets
Composition of the contained fluid
and its physical/chemical properties
Pressure, temperature and total amount of fluid available of
release
Depending on national regulations more data, e.g. the final phase of
the fluid on release into the
atmosphere, the dispersal characteristics of the fluid at the
site, mitigation systems such as water curtains, measures for
detection of the leak/break.
If it is desired to include the potential leak/break area then the
failure mode and the pipe/vessel
size should be entered.
If it is desired to include business
impact then the financial effect of production loss as well as
repair/replacement costs should
be entered.
If it is desired to include publicity
damage then a financial value
should be entered expressing the negative effect on future
business.
For hazards with consequences
other than fluid release,
appropriate information on the nature and extent of the
consequence is required
See chapter 7.5.3.3.D
Characteristics of the relevant degradation
mechanisms, e.g. local or overall degradation, possibility of cracking, detectability (in early or
final stage).
If containment is considered, the composition of
the contained fluid and its physical/chemical
properties, the pressure, temperature and total amount of fluid available of release shall be
available. To obtain satisfactory CoF
assessments may in this case often require to defining a number of scenarios, e.g., small
leakage, large leakage, and full rupture.
Credit may be taken for passive mitigating
systems.
Consequences should also be assessed for hidden failures and test independent failures
Identify barriers.

SafeLife-X
page 103
Topic Activities involved in Screening Risk Assessment
Common for both Screening & Detailed Risk Assessment
Activities involved in
Detailed Risk
Assessment
Specific for Detailed Risk Assessment17
E.
Determine risk and
classify
equipment
Determine the categories in which PoF
and CoF are classified using the risk matrix shown in Figure 38.
Determine the risk category of the equipment
Based on the screening results the
systems or groups of equipment should be given a low, medium or high risk.
Systems or groups of equipment with a
high risk should be considered in a detailed assessment.
Systems of groups of equipment that
have medium risk should be considered for maintenance.
Finally, for the low risk systems or groups of equipment the assumptions
should be periodically checked. This may
amount to verifying that the basic assumptions are satisfied, e.g. coating is
satisfactory or that the operating
conditions remain unchanged. For low risk systems minimum surveillance is
required.
High risk systems should be considered
in the detailed analysis. In any case,
regulatory requirements should be considered.
Risk acceptance criteria (input
from initial analysis and planning)
See chapter 7.5.3.3.E
Determine risk to people (second and third
parts)

SafeLife-X
page 104
A.2.5.3.2 Risk analysis - screening level
Description
Risk screening shall be relatively fast, simple and cost effective compared to more detailed risk analysis. Risk screening is particularly suited for broadly based problems and limited
populations of items to consider. Risk screening divides the systems and groups of
equipment into two groups: high-risk items and medium/low risk items.
The high-risk items should be analysed in detail. The medium risk items should be
considered additionally in order to decide if minimum surveillance or detailed assessment
should be followed. The low risk items should only require minimal surveillance to verify and ensure that the assumptions made during the screening process remain true. This could, for
example, amount to verifying the condition of a painting, coating, functional compliance or
the correct undistorted position of a structure.
If information is missing during the screening so that the risk associated with the equipment
cannot be determined, the equipment should be regarded as having a high risk and
reassessed using a more detailed assessment.
The work process for risk screening is detailed in Figure 37.
Figure 37 - Work flow for risk screening
Requirements
The following requirements should be fulfilled for risk analysis:
1. The rating criteria should be defined and recorded in writing.
2. The PoF should be established for a given (predefined) time frame based on a prediction of damage development for operation within a specified operating window. The specified
operating window should include factors, which can be influenced by the operation of the
process (e.g. temperature, pressure) as well as factors which cannot be influenced by the operation (e.g. composition of the process medium).
3. In order to assess the consequence, at least the aspects of health, safety and
environment should be included. In addition, the consequence rating should be such that the highest rating for one of the individual aspects (health, safety, environment and/or
business consequences) can control the final score (so no averaging of aspects).
4. The methodology should be verified / benchmarked.
5. This task should be performed by the RBIM team (see initial analysis and planning).
The results should be auditable by similar experts (peer review); therefore, the
methodology, the input data, the decision criteria and the results shall be documented (the
results shall be recorded in an authorized document).
Risk acceptable?
?
Yes No
RISK SCREENING
PoF
CoF Risk
DATA COLLECTION AND VALIDATION
Lack of key information
Systems and components in scope
of work
Plant information Degradation mechanism
DECISION MAKING
Minimum Surveillance
REDEFINITION OF THE SCOPE OF ANALYSIS

SafeLife-X
page 105
Inputs
Table 11 presents the details required for performing the steps of risk assessment in screening level.
Procedure
Screening level of analysis is often sufficient to highlight areas with highest probability/frequency of failure in the plant (units/systems). The work flow of risk screening
is given in Figure 37. The main purpose of the risk screening is to identify the low risk items
(see Figure 38) and remove them from further analysis. It is very important that not too many components are placed in category Low risk, therefore it is useful to compare the
spectra of assessed PoF, CoF and risk categories with those obtained in other similar
assessments.
Figure 38 - Screening risk matrix
Output
Typical results from these tasks are:
PoF value or category for the piece of equipment under consideration
CoF value or category for the piece of equipment under consideration
Risk value or category for the piece of equipment under consideration from screening
risk matrix shown in Figure 5.
Warnings and applicability limits
Note that PoF assessments usually require more detail and are therefore more cost intensive than CoF assessments. Therefore some prefer to screen systems and groups of components
on consequence of failure only. This is also acceptable, even if in this report other types of
screening are suggested.
A.2.5.3.3 Risk analysis – detailed assessment
General description and scope
The detailed assessment differs from screening in the depth of detail required for analysis and hence involves considerably higher work effort for the assessment. Detailed assessment
should be applied to the high risk systems and groups of equipment identified in risk
screening, and to all equipment within the scope of work if no risk screening has been
performed.
Hig
h
Medium risk High risk
Pro
bab
ilit
y/
freq
en
cy
Low
Low risk Medium risk
Low High
Consequence

SafeLife-X
page 106
For each system or group of components, the relevant degradation mechanisms shall be
identified and the extent of damage shall be estimated. Furthermore, the most likely damage
development shall be determined. Based on this information, the maximum time interval to the next inspection / maintenance activity shall be determined subject to the condition that
the health, safety and environmental risks remain acceptable (as defined in the acceptance
criteria). This should then be combined with inspection / maintenance cost and inspection / maintenance effectiveness to derive cost optimal maintenance / inspection intervals such
that the health, safety and environmental, risks are acceptable, i.e., the acceptance criteria
are satisfied
The detailed analysis consists of the following main tasks:
a) Identify hazards.
b) Identify relevant damage mechanisms and failure modes.
c) Determine probabilities of failure (unmitigated and in later runs through the cycle
mitigated).
d) Determine consequence of failure (unmitigated and in later runs through the cycle,
the mitigated ones).
e) Risk assessment.
Requirements
Rating criteria shall be defined and recorded in writing.
The requirements for identifying and considering damage mechanisms are as follows:
Identify all the damage mechanisms that can really appear in a given
system/component
The analysis should be performed by qualified personnel and in collaboration with
people who know the plant well (e.g. personnel from the plant with good knowledge
of the state of the components)
The plant breakdown, identification of damage mechanisms and the analysis process
should be duly documented
The plant management should ensure that the knowledge about service and
maintenance, history and all known degradation mechanisms in the plant, is
considered in the analysis
The responsible person(s) involved in the analysis should ensure that all knowledge
about the degradation mechanisms from the available literature is considered in the
analysis
The responsible person(s) involved in the analysis should ensure that all available
knowledge about the degradation mechanisms and experience from similar plants is
considered in the analysis.
All emerging damage mechanisms not accounted so far are considered (taken into
account) under the category “other” damage mechanisms.
The analysis of failure modes enhances the level of detail used to assess the consequence of failure. If it is not undertaken, a conservative approach shall be followed. A conservative
approach may be e.g. the assumption that the complete content of the containment may
escape instantaneously.
The likelihood/probability shall be established for a given (predefined) time frame based on a
prediction of damage development for operation within a specified operating window. The
specified operating window should include both factors which can be influenced by the operation of the process (e.g. temperature, pressure) as well as factors which cannot be
influenced by the operation (e.g. composition of the process medium).
For all trendable degradation mechanisms, the assessment of PoF in a detailed analysis shall
be based on the value of expected residual lifetime and include a weighting system/factors to take the uncertainty of prediction into account. The prediction of lifetime may result from one
of the following options: measured inspection data, a calculation making use of operating
conditions, or expert opinion. If so desired, specific analysis tools may be used, e.g. probabilistic (safety) analysis and/or fitness for service analysis.

SafeLife-X
page 107
For all non-trendable degradation mechanisms, for which progress cannot be properly
monitored or predicted (e.g. stress corrosion cracking), it should be demonstrated that they
are prevented (due to proper design issues) or detected early by means of sufficient measures to be taken (inspection, maintenance, operation). A methodology should be
available in which the relation between the effectiveness of measures (type, scope and
frequency) and likelihood / probability of failure is given.
In order to assess the consequence, at least the aspects of health, safety and environment
shall be included. In addition, the consequence rating shall be such that the highest rating
for one of the individual aspects (health, safety, environment and/or business consequences) shall control the final score (averaging of these aspects is not done).
The methodology shall be verified / benchmarked. CoFsafety can be benchmarked against
recognised methods already available.18
The task should be performed by the competent RBIM team (see Initial analysis and
planning).
The results should be auditable by similar experts (peer review); therefore, the
methodology, the input data, the decision criteria and the results shall be documented (the results shall be recorded in an authorized document).
Inputs
Table 1 presents the details required for performing the steps of risk assessment in detailed level.
Procedure
Detailed assessment is a relatively elaborate procedure involving multiple activities. Numerous activities are envisaged for carrying out the individual steps of detailed risk
assessment.
A. Identify hazards
A number of tools can be used for identifying hazards. In this case it is recommended to carry out a system level failure mode and effects (and criticality) analysis, or FME(C)A as per
the available standards [18]. There are also a number of software tools that can support
FME(C) analyses. In addition other analysis methods such as HAZOP, What-if, or Checklists
may be useful.
B. Identify relevant damage mechanisms and failure modes
The purpose of this task is to identify the relevant degradation mechanisms and failure
modes. A failure mode is any possible state where a defined function cannot meet the
desired performance standard.
The listing of failure modes is made easier if the functional breakdown is well described. All
probable failure causes for the identified failure modes should be listed for the function. That
could be failures dealt with by current maintenance program, historical failures and possible failures.
The RBIM methodology aims to foresee these and prevent them. The failure cause list should
include all events that are likely linked to the identified failure modes. This should include equipment wear/deterioration, human factor impact, asset design etc.
The root cause phase investigates the underlying causes connected to the failure modes.
Establishing the root causes increases the possibility of finding the appropriate tasks for preventing these failure modes. The hierarchical breakdown and the root cause phase in
Root Cause Failure Analysis (RCFA) can certainly provide insights into relevant damage
mechanism.
18Examples of established methods for CoFsafety are given as references [29], [30]

SafeLife-X
page 108
Figure 39 - Damage types appearing as failure or root failure causes in RIMAP
Furthermore, for each type of damage – component combination at least the following “flags”
(attributes) should/can be included
S – related to safety (“safety related”)
A – related to active components
E – related to/relevant for environment (“environment related”)
D – type of damage – component combination that requires detailed analysis per default
Table 12 presents various types of in-service damage and their specification. The hierarchy
of damage mechanisms in relation to the corresponding hierarchies of plant components and
problems is also shown in Figure 40, with an example case taken of a fatigue problem.
The approach proposed in RIMAP lists the damage mechanism systematics proposed in Table
13 with inspection methods aiming to, yielding reasonable combination of POD (Probability of
Detection), effectiveness and FCP (False Calls Probability). This is presented in Table 13.
Failure cause or Root cause
Material damage related
problems
I. Corrosion, erosion, environment related damage
I.A Volumetric loss of
material on surface
I.B Cracking (on surface
mainly)
…
II. Mechanical or thermo-mechanical loads related
to:
II.A Volumetric loss of material on surface
II.B Cracking (on surface mainly)
…
III. Other structural damage mechanisms
IV. Fouling / Deposits
IV.A Deposits, Fouling with out fluid disturbances
…
V. Fluid flow disturbances
VI. Vibration
VII. Improper dimensioning, improper clearances
VIII. Man made disturbances
X.B Failed to start (FTS)
X.C Failed while running (FWR)
Disturbances, deviations, function related problems
IX. Fires, explosions, similar
X. Damage and/or loss of function due to other cause
X.A External leakage (EXL)
X.D Overheated (OHE)
X.E Other (OTH)

SafeLife-X
page 109
Table 12 - Types of damage and their specifics mechanisms
Event,
proble
m, issue
Id. and type of damage or
disturbances /
deviations, functional problems
Subtypes / specifics / further
details / examples
MATERIA
L D
AM
AG
E R
ELATED
PRO
BLEM
S
I. Corrosion/erosion/environment related damage, leading to:
I.A Volumetric loss of material on surface (e.g. thinning)
I.A1 General corrosion, oxidation, erosion, wear, extended thinning
I.A2 Localized (pitting, crevice or
galvanic) corrosion
I.B Cracking (on surface,
mainly)
I.B1 Stress corrosion (chloride,
caustic, etc.), cracking
I.B2 Hydrogen induced damage (incl.
blistering and HT hydrogen attack)
I.B3 Corrosion fatigue
I.C Material weakening and/or embrittlement
I.C1 Thermal degradation (spheroidization, graphitization, etc.
incl. incipient melting)
I.C2 Carburization, decarburization,
dealloying
I.C3 Embrittlement (incl. hardening, strain aging, temper embrittlement,
liquid metal embrittlement, etc.)
II. Mechanical or thermo-mechanical loads related, leading to:
II.A Wear II.A1 Sliding wear
II.A2 Cavitational wear
II.B Strain / dimensional
changes / instability / collapse
II.B1 Overloading, creep
II.B2 Handling damage
II.C Microvoid formation II.C1 Creep
II.C2 Creep-fatigue
II.D Micro-cracking, cracking II.D1 Fatigue (HCF, LCF), thermal
fatigue, (corrosion fatigue)
II.D2 Thermal shock, creep, creep-fatigue
II.E Fracture II.E1 Overloading
II.E2 Brittle fracture
III. Other structural damage mechanisms
DIS
TU
RBAN
CES /
DEVIA
TIO
NS /
PRO
BLEM
S (
not
rela
ted t
o s
tructu
ral
mate
rials
)
IV. Fouling / deposits (without fluid flow disturbances)
V Fluid flow disturbances
V.A High / low fluid flow (HFF/LFF)
V.B No fluid flow (NFF)
V.C Other fluid flow problems (OFFP)
VI. Vibration (VIB)
VII. Improper dimensioning, improper clearances
VIII. Man made disturbance (deliberate and unintentional)
IX. Fires, explosions and similar
X. Damage and/or loss of function due to other causes
X.A External leakage (EXL*)
X.B Improper start or stop - failed to start/stop (FTS*)
X.C Failed while running (FWR*)
X.D Overheated (OHE*)
X.E Other (OTH*)
* - acronyms broadly corresponding to those used in OREDA [20]

SafeLife-X
page 110
Figure 40 - Types of damage and their specifics in relation to hierarchical structure of the plant according to KKS
Component: Tubing
System: Boiler
Equipment: Economiser
Component: Header
Hierarchical Structure of the plant: e.g. according to KKS
Even
t, p
rob
lem
,
issu
es
ID and type of damage or disturbances / deviations, functional
problems
Subtypes / specifics / further details / examples
Header Tubing
I. Corrosion/erosion/environment related damage, leading to:
I.A1 General corrosion, oxidation, erosion, wear, extended thinning
I.A Volumetric loss of material on surface (e.g. thinning)
I.A2 Localized (pitting, crevice or galvanic) corrosion
I.B1 Stress corrosion (chloride, caustic, etc.), cracking
I.B2 Hydrogen induced damage (incl. blistering and HT hydrogen attack)
I.B Cracking (on surface, mainly)
I.B3 Corrosion fatigue
I.C1 Thermal degradation (spheroidization, graphitization, etc. incl. incipient melting)
I.C2 Carburization, decarburization, dealloying
I.C Material weakening and/or embrittlement
I.C3 Embrittlement (incl. hardening, strain aging, temper embrittlement, liquid metal embrittlement, etc.)
II. Mechanical or thermo-mechanical loads related, leading to:
II.A1 Sliding wear II.A Wear
II.A2 Cavitational wear
II.B1 Overloading, creep II.B Strain / dimensional changes / instability / collapse
II.B2 Handling damage
II.C1 Creep II.C Microvoid formation II.C2 Creep-fatigue
II.D1 Fatigue (HCF, LCF), thermal fatigue, (corrosion fatigue)
II.D Micro-cracking, cracking
II.D2 Thermal shock, creep, creep-fatigue
II.E1 Overloading II.E Fracture
II.E2 Brittle fracture
MATERIA
L D
AM
AG
E R
ELATED
PRO
BLEM
S
III. Other structural damage mechanisms
IV. Fouling / deposits (without fluid flow disturbances)
V Fluid flow disturbances
V.A High / low fluid flow (HFF/LFF)
V.B No fluid flow (NFF)
V.C Other fluid flow problems (OFFP)
VI. Vibration (VIB)
VII. Improper dimensioning, improper clearances
VIII. Man made disturbance (deliberate and unintentional)
IX. Fires, explosions and similar
X. Damage and/or loss of function due to other causes
X.A External leakage (EXL*)
X.B Improper start or stop - failed to start/stop (FTS*)
X.C Failed while running (FWR*)
X.D Overheated (OHE*)
DIS
TU
RBAN
CES /
DEVIA
TIO
NS /
PRO
BLEM
S
(not
rela
ted t
o s
tructu
ral m
ate
rials
)
X.E Other (OTH*)
Details on fatigue problems in
component XYZ including priorities, PoF/ LoF data and references are provided in RIMAP Work books, in this particular case RIMAP Workbook Part I, section 3, page 73.
Note: Overall number of items covered in RIMAP Work book for Power plants approximates to 500, the stars () indicate presence of
corresponding damage mechanisms. Two or more stars (, )
indicate more important or more likely events, problems, issues …

SafeLife-X
page 111
Table 13 - Example of classification of type of damage vs. prioritized methods of inspection
What type of damage How to look for it Measure of uncertainty/risk for selected/preferred method19
Identifier and Type of damage
Damage specifics, damage mechanism best POD20 most cost effective
selected method
POD for defect size of or size for FCP6;
comments,
examples 1 mm 3 mm 90% POD
I. Corrosion/erosion/environment related damage, equating or leading to:
I.A Volumetric loss of material on
surface (e.g.
thinning)
I.A1 General corrosion, oxidation, erosion, wear solid particle
erosion
DiM, VT, ET,
UT21
UT, (VT),
DiM UT 30÷70% 50÷90% 2 mm
I.A2 Localized (pitting, crevice or
galvanic) corrosion UT, DiM, ET VT, UT UT 30÷70% 40÷90% 2 mm see 22
I.B Cracking (on surface, mainly)
I.B1 Stress corrosion (chloride, caustic, etc.)
MT, PT, ET MT, PT, ET ET max 85% 40÷90% 42 mm <5% 23
I.B2 Hydrogen induced damage (incl. blistering and HT hydrogen attack)
UT, MT, PT, ET
MT, PT24, MT25
UT na na na na
I.B3 Corrosion fatigue MT, PT, ET, VT
MT, PT, UT UT 80÷96%26 86÷98%27
50÷99%12,28 95÷99%,14
31 mm12,29
0.80.4 mm,30
I.C Material weakening and/or
embrittlement
I.C1 Thermal degradation (spheroidization, graphitization,
etc. incl. incipient melting)
MeT MeT MeT (microscopy) ~100% POD for cracks > 1 mm, 90% POD crack ca. 0.05 mm; main "reliability related problems" linked to
19 if not mentioned otherwise all based on re-assessment of data [27] 20 see Abbreviations in the main list of abbreviations 21 AE - acoustic emission; PT - penetrant testing; DiM - dimensional measurements; VbM - vibration monitoring; DsM – on-line displacement monitoring; StM - on-line strain monitoring; VT - visual
testing; ET – Eddy current testing; UT- ultrasonic testing; VTE - visual testing by endoscope; MeT - metallography, including RpT (replica technique); MST - material sample testing; na - not applicable 22 the estimate can be affected significantly by local effects (e. g. small-scale pits can remain completely undetected) 23 ET for non-ferromagnetic materials, sample results in [27] 24 surface, also 25 subsurface 26 crack length 27 crack depth 28 for welds as low as 20% 29 usually more than 5 mm for welds or steels 30 can be more than 5 mm for welds

SafeLife-X
page 112
What type of damage How to look for it Measure of uncertainty/risk for selected/preferred method19
Identifier and Type of
damage Damage specifics, damage mechanism best POD20
most cost
effective
selected
method
POD for defect size of or size for FCP6; comments,
examples 1 mm 3 mm 90% POD
I.C2 Carburization, decarburization,
dealloying MeT MeT MeT
wrong sampling, wrong preparation and wrong interpretation
of replicas (all numbers are very rough “guesstimates”)
I.C3 Embrittlement (incl. hardening, strain aging, temper embrittlement,
liquid metal embrittlement, etc.)
MST MST MST na na na
II. Mechanical or thermomechanical loads related, leading to:
II.A Wear II.A1 Sliding wear VT, DiM, ET VT, UT
II.A2 Cavitational wear
II.B Strain /
dimensional changes /
instability /
collapse
II.B1 Overloading, creep,
DiM DiM DiM na na na
required
resolution
0.1 mm or 0.5 %
II.B2 Handling damage
II.C Microvoid formation
II.C1 Creep MeT (UT), MeT
II.C2 Creep-fatigue
II.D Microcracking, cracking
II.D1 Fatigue (HCF, LCF), thermal fatigue, (corrosion fatigue)
UT, (MT/PT),
ET, VT MT/PT
PT max 90% 20÷90% 1.5÷6.5 mm 31
II.D2 thermal shock, creep, creep-fatigue
MT 5÷90% 50÷90% 2.5÷10 mm 32
II.E Fracture II.E1 Overloading VT, DiM VT VT
na na na analysis of
causes II.E2 Brittle fracture
31 typical range; in extreme cases 0.5÷12 mm or more; more uncertainties for welds – but cracks transverse to welds detected easier than the longitudinal ones 32 typical range; in extreme cases 1÷18 mm or more; applicable for ferromagnetic materials (steels)

SafeLife-X
page 113
C. Determine PoF
The current probability of failure and the PoF development over time should be assessed for
all relevant damage mechanisms. The development of the PoF over time is an important
parameter to consider when the maintenance/inspection strategies and intervals are determined later in the analysis. The probability of failure should also be linked to the
appropriate end event in the bow tie model [5] to ensure that each consequence is assigned
the correct probability of failure. In addition the uncertainty in the PoF assessment should be determined.
For introducing the PoF according to RIMAP procedure, three different types of source can be
used. One common reference source is taken from statistical analysis of historical data (H/S) on failures in comparable components. A second common source is based on forecasting or
modelling (F/M) of the foreseen failure mode in the component considered. The third source
is expert judgment (E/J), whereby human expertise is applied to extract the best estimate of PoF (see Figure 41). The individual sources for overall PoF determination are combined as
outlined in Figure 41. The elements from different kinds of sources can be modified according
to factors related to source reliability and application.
Figure 41 - Elements of PoF determination in the RIMAP concept
The logic involves the following steps:
1. To assess the failure scenarios the user may opt for two types of models:
Data-based models considering uncertainties in material data, NDT results,
geometry, loads, etc.
Life models calculating the remaining life of a component based on the relevant
damage mechanisms.
There are several methods that can be also used when more than one failure
scenario is considered e.g.: Monte-Carlo simulation, decision trees, fault-tree analysis, fuzzy rules, etc.
2. Assess, check, calibrate and correct basic failure frequencies by using expert
judgment.
These corrections can include factors like:
similar damage already appearing elsewhere in the same plant or in a similar
plant
any qualitative indications and/or symptoms like irregularities in observations
higher loading than planned, unexpected loads (e.g. vibrations), etc.
changes in the operating conditions (e.g. operation mode)
any known problems with design or manufacturing
This approach allows combining of different levels and methods like expert judgment and
probabilistic analysis consistently, also when applied for different or same components. The proposed approach is comparable and consistent with previously established approaches,
E/J
H/S
PoF’ Basic
PoF/LoF estimate
F/M
Expert’s correction
of basic PoF value
PoF/LoF value
for risk analysis
PoF value from
History and
Statistics
Historical data
(e.g. previous
failures, maint.)
Statistical analysis
PoF value from
Forecast and
Models
Future or Forecast
(e.g. component
behavior
Statistical analysis
PoF value based
on Expert
Judgment
Expert’s correction of
PoF value (e.g.
human expertise)
Expert’s correction of
PoF value (e.g.
human expertise)
AND/OR

SafeLife-X
page 114
extending them in several aspects. The extension is done by considering applicability in
different industries, first by implementing relations between components in a plant and
damage mechanisms, and by associating and suggesting appropriate inspection methods depending on the damage type and assessing the reliability of selected inspection method.
D. Determine CoF
The health, safety, environmental and business consequences of failure (CoF) are assessed
for the relevant degradation mechanisms. Other consequences, e.g., image loss or public disruption, may also be considered. There are many approaches for gathering data necessary
the CoF analysis. Four typical sources of information that can be used in the analysis of CoF
are shown in Table 14.
Table 14 - Sources of CoF for detailed assessment
Source Description
1. Historical data Estimates are based on historical data of CoF for different failures. The data could be generic in
databases, company statistics (from plant),
benchmarks or recommended practices. For failures
without historical data, similar failures are used for reference.
2. Forecast of future
behaviour
Forecasting of degradation and item behaviour to
future, to obtain the resulting CoF.
3. Expert judgment Assess the CoF in co-operation with experts on the
studied field (may be in-house experts or persons
outside the company).
4. Modulation of
behaviour
Modelling the CoF for different failures.
The detailed assessment for CoF for Health, Safety, Environment & Business involves calculations based on material properties, internal energy and the presence of people. Before
going into the flowchart, it is necessary to determine toxicity number and combustibility
number, which are discussed in detail in reference [4], [28], [29], [30]. The formula for
these numbers are:
Combustibility number, Cf = Nm (1+ke) × (1+ k + kv + kp + kc + kq) (1)
Toxicity number, Ch = Nh (1+ k + kv + kp + kc) (1) (2)
in which;
Nm Flammability index
Nh health index
ke enclosure penalty
k Temperature penalty
kv vacuum penalty
kp pressure penalty
kc cold penalty
kq quantity penalty
Figure 42 depicts the flowchart of a worked example for the estimation of CoF for Safety.

SafeLife-X
page 115
Figure 42 - Example of estimation of CoF for safety in RIMAP
The Safety consequence is classified according to the flowchart in Figure 42Error!
Reference source not found..
In the flow chart the following parameters and terms are used:
dangerous
substance
any substance that is combustible (Nf>1), toxic (Nh>1) or
extremely toxic (Nh>4)
Cf combustibility number
Ch toxicity number
Pw working pressure in bar
V volume van the quantity vapour or gas in m3
m mass of the liquid heated above the boiling point in kg
T superheating above atmospheric boiling point in °C (Tw - Θ b,a)
mh mass of toxic substance in kg
The flowchart uses numerical criteria as explained in Table 15.
Table 15 - Explanation of the numerical criteria given in the flowchart
criteria Explanation
F1-F4 combustibility criteria being boundary values of the combustibility
number. The exact values need to be determined (F1<F2<F3<F4)
H1-H4 toxicity criteria being boundary values of the toxicity number. The
exact values need to be determined (H1<H2<H3<H4)
M1-M3 criteria related to the mass of toxic substance. The exact values need to be determined.
P1-P4 criteria related to the stored energy. The stored energy is calculated using the pressure, volume and the mass of liquid
overheated above its atmospheric boiling point. (P1<P2<P3<P4)
Values for the criteria from Table 15 are presented in Table 16, both for a flowchart which
results into a categorisation in three classes for the 'Damage distance' (this is actually the
system included in the Netherlands rules for Pressure Vessels 0) and for a flowchart resulting
Dangerous substance?
Start
Cf>F1? Yes
Cf>F2? Yes
Cf>F3? Yes
Cf>F4? Yes
Flammability
Ch>H1? Ch>H2? Yes
Ch>H3? Yes
Ch>H4? Yes
No
No No No No Yes
Ch>H1? Ch>H2? Ch>H3?
No No No No
Yes
Yes Yes Yes
Yes
X>P1? X>P2? Yes
X>P3? Yes
X>P4? Yes
Toxicity
Pressure risk
cat. I cat. II cat. III cat. IV cat. V
32000
2mTVPX W
Damage Distance Class
Target Presence
Exposure Time
People affected
cat. A cat. B cat. C cat. D cat. E
CoFsafety
mh> M1 kg?
mh> M2 kg?
mh> M3 kg?

SafeLife-X
page 116
into five categories. The values for the latter have been derived from those in 0 but should
be considered as 'best estimates'.
Table 16 - Values of the numerical criteria in the 3 categories model in “The Netherlands rules for pressure vessels” the estimate criteria for the 5 categories model
criteri
a
3 categories, as formulated in 0 5 categories, estimated values
F F1 = 65, F2 = 95 F1 = 35, F2 = 65, F3 = 80 and F4 =
95
H H1 = 6, H2 = 9 H1 = 2, H2 = 6, H3 = 8 and H4 =
10
M M1 = M2 = M3 = M4 = 500 M1 = M2 = M3 = M4 = 500
P P1 = 900, P2 = 20000 P1 = 100, P2 = 900, P3 = 10000 P4
= 20000
Using the flowchart will result in a piece of equipment being categorised as of class I to V,
the Damage distance classes. The classes represent the following boundaries for damage
distance class is given in Table 17. The criteria of Table 15 shall be determined in such a way that a piece of equipment will be categorised correctly.
Table 17 - Example of class definition of boundaries for damage distance class
Class boundaries
I no lethality’s
II X% lethality within 10 metres
III X% lethality within 30 metres
IV X% lethality within 100 metres
V X% lethality > 100 metres <1000
metres
The Damage distance classes, combined with the target presence result in a categorisation in
the CoF classes A-E; Safety Consequence. The categories are expressed in number of fatalities. The procedure to determine the target presence may at least contain:
the numbers of persons in the area of the Damage distance class
the percentage of the day they are present in the area of the damage distance class
There is no similar model available for Health impairment and Environment. If a similar
model were to be developed for CoFhealth, the health aspects of the substance should be translated in a health index (a index for the health effectson the long term), mass released,
the time of exposure and the area affected. Similarly, environmental consequences can be
analysed by looking at the costs. The costs are compiled of fines and remediation costs. The fines could be considered as the measures of environmental damage as viewed by the
legislature. The environmental consequences of an event can have serious publicity
consequences. These can be considered in the CoFenvironment. In Figure 43, an example is
given on decision logic to determine which elements are relevant in determining the cost associated with the environmental consequence analysis.
Similarly, the model for CoFbusiness involves the costs from direct and indirect causes.
(3)
CLP = Cost of Lost Production
CPC = Cost of restoring Primary failure (faulty item required for original function)
CSC = Cost of restoring Secondary failure/ faulty items
CId = Indirect costs
The costs determine the severity of the impact which can be categorised to arrive at a rating
on the CoF scale, e.g. negligible, contained, etc. whereas the extent of damage distribution,
viz. on-site or off-site, may also determine the impact.
IdSCPCLPE CCCCCoF

SafeLife-X
page 117
Figure 43 - Example of decision logic for CoFEnvironment in RIMAP
E. Risk assessment
When the PoF and CoF have been assessed, the health, safety, environment, and business
risks are to be determined. The results can be plotted in risk matrices (see Figure 45) for
presentation and comparison. Separate matrices should be used for each risk type unless it is relevant to compare the risk types. Note that the risk matrix presents the risk for a
predefined time period.
It is generally useful to rank the evaluated components or items by risk level, because this
will provide guidance on where to concentrate the inspection/maintenance effort and where such activities can be relaxed. If risks are measured in monetary terms, the expected need
for mitigation investment as well as savings by avoided inspection and maintenance become
then apparent. This requires that a reasonable cut-off level is set by the evaluated risk criteria.
Figure 44 - Example of decision / action criteria for various risk levels in risk matrix
Output
Typical results from these tasks are:
PoF value for the piece of equipment under consideration
CoF value for the piece of equipment under consideration
Risk value or category from Figure 45
Warnings and applicability limits
Note that PoF assessments usually require more detail and are therefore more resource
intensive than CoF assessments. Therefore some prefer to screen systems and groups of
components on consequence of failure only. This is also acceptable, even if in this report other types of assessment are suggested.
Toxic substances?
Forming vapor (pressure)/Gaseous?
Fluid?
Not relevant No
Air pollution/ Health effects
Yes
Soil protecting measures?
Soil permeable on site?
Not relevant
Not relevant
Soil pollution on site
Ground water pollution
Soil pollution off site
Surface water Pollut. off site
Not relevant
Soil permeable off site?
Surface water nearby?
Ground water reachable?
Not relevant
Yes
No
Yes
No
No
No
No
Yes
Yes
Yes
No
Yes
Yes
Remediation necessary &
possible?
Penalty
Publicity
Remedy
Yes
Transport pollutants & through air
No
Risk level Decision / Action criteria
Very high Define required inspection and maintenance program to reduce risk. Otherwise, consider equipment upgrade/ modification
High
Define required inspection and maintenance program to reduce risk.
(Comment: can be acceptable if the driver is economic loss, security, image loss and public disruption)
Medium Check if it is possible to reduce the risk through inspection and maintenance at low cost. Otherwise, find the optimal cost
Low If no inspection and maintenance program plan exists, no detailed
analysis is required. Otherwise, fine-tune it to find the optimal cost

SafeLife-X
page 118
Figure 45 - An example of the risk matrix for detailed assessment, involving HSE and economic risks with four risk limit categories
Very probable < 1 year
>1×10⁻¹ 5 Very high risk
Probable 1-5
years 1×10⁻¹ to
1×10⁻² 4 High risk
Possible 5-10 years
1×10⁻² to 1×10⁻³
3 Medium risk
Unlikely 10-50 years
1×10⁻³ to 1×10⁻⁴
2 Low risk Exa
mp
les
of
Po
F s
cale
s
Very unlikely >100 years
<1×10⁻⁴ 1
Po
F c
ate
go
ry
(Very Low, negligible risk)
CoF category
Des
cri
pti
ve
MT
BF
Po
F
A B C D E
Health (Long term visibility) Warning issued
No effect Warning issued Possible impact
Temporary health problems, curable
Limited impact on public health, threat of chronical illness
Serious impact on public health, life threatening illness
Safety (Instant visibility) No aid needed
Work disruption First aid needed
No work disability Temporary work
disability Permanent work
disability Fatality(ies)
Environment Negligible impact Impact (e.g. spill)
contained Minor impact (e.g. spill)
On-site damage
Off-site damage Long term effect
Business (€) <10k€ 10-100 k€ 0.1-1 M€ 1-10 M€ >10 M€
Security None On-site (Local) On-site (General) Off site Society threat
Image Loss None Minor Bad publicity Company issue Political issue
Public disruption None Negligible Minor Small community Large community
Examples of CoF scales

SafeLife-X
page 119
A.2.5.4 Decision making / action plan
A.2.5.4.1 General description and scope
Conservative inspection and maintenance is an efficient approach when the mitigating actions are cheap compared to developing an optimized inspection and maintenance plan. In
order to manage inspection and maintenance on a daily basis, programs with predetermined
intervals are established [7], [8]. Based on the deliverables of the project so far, this section describes a proposed decision framework for the determination of an inspection and
maintenance strategy.
The need for inspection and maintenance is directly caused by several factors:
Wear and tear, and unreliability of equipment/machinery
Unreliability of humans operating, maintaining or inspecting the
equipment/machinery
Legislation and other regulatory requirements
External factors (earthquakes, harsh weather, etc.)
Severity of consequence
The action plan consists in particular,
Operation review
Condition monitoring
Inspection and maintenance programs are established in response to this unreliability and
risks as well as to the legal/regulatory requirements. Maintenance induced by human errors
and external factors is not considered as a part of the usual inspection and maintenance program.
The termination of the ability of an item to perform a required function is linked with a failure
cause, which could originate from circumstances with use, or maintenance. The inspection
and maintenance strategy is the maintenance approach chosen in order to prevent physical and environmental damage, injury and loss of life or assets.
A.2.5.4.2 Requirements
The development of the RBIM plan will be done by a team including experienced personnel with following qualifications:
Sufficient knowledge of Risk levels, PoF, consequences and inspection expertise
depending on local requirements/legislation
Qualified knowledge of the Maintainable items and experience with the facility
(systems, equipment or component) to inspect. Generally, knowledge of reliability
engineering practice or several years of familiarity with the operation and
maintenance of the facility is required.
The team should have access to all relevant data and risk Analysis. The RBIM plan will contain
all relevant details on the strategy level for execution in order to obtain the desired reduction of level of risk as set by the RBIM analysis and process.
A.2.5.4.3 Inputs
The RIMAP project has documented methods for determining and predicting damage
mechanisms as well as methods for evaluating consequence of failure (CoF) and probability of failure (PoF). Damage mechanisms identified, CoF, PoF and the related risk are used as
input for establishing inspection and maintenance methods in order to safeguard health, life,
the environment and assets.
A.2.5.4.4 Procedure
The proposed decision framework is divided into a main level and inspection and
maintenance strategy level. The main level is shown in Figure 46 and takes into account the following factors:
the opportunity to eliminate failure causes
the risk to personnel during execution of inspection and maintenance strategy
the risk for introducing new failure causes

SafeLife-X
page 120
In case substituting the inspection and maintenance strategy is not possible, technical (e.g.
robotics) or organizational (e.g. training) measures may be introduced to reduce risk for
personnel and for introducing new failures.
The decision-logic serves three important purposes:
to ensure a systematic evaluation of the need for preventive maintenance activities
to ensure consistency of the evaluation between different plant systems
to simplify the documentation of the conclusions reached.
Figure 46 - The main level of the decision-making framework
When the inspection and maintenance strategy has been determined, the method, intervals,
and extent of inspection should be determined so that risks remain acceptable and costs are
optimised. This is achieved by establishing risk reduction measures for the items that exceed the acceptance limits, and where possible by mitigating measures like inspections and
maintenance for items that remain below these limits for the period of assessment. The risk
reduction effect of alternative measures as well as the costs of these measures should be
determined.
A.2.5.4.5 Output
In principle, the decision logic gives guidance for establishment of the preferred inspection
and maintenance strategy on basis of the criticality assessment, detectability of damage and the failure characteristics. The outcomes defined from the decision logic are:
Elimination of failure cause
Regular functional testing/inspection
Time and condition based maintenance
Operational maintenance
Corrective maintenance.
A.2.5.4.6 Warnings and applicability limits
The methods of risk reduction should be chosen based on cost optimization subject to the boundary condition that the health, safety and environmental risks satisfy the HSE
acceptance criteria.
A.2.5.5 Execution and reporting
A.2.5.5.1 General
Can failure cause be identified and
is elimination clearly cost effective?
Establish new inspection and maintenance strategy
Implement / optimize:
• Procedures • Modification • Operating conditions
Inspection and maintenance strategy ensures low risk for personnel and avoidance of
new failures?
Substitution of inspection and maintenance
strategy possible? Redesign
NO
YES
YES
Apply
YES
NO
NO

SafeLife-X
page 121
The output of an RBIM plan is the input for the planning and scheduling for all involved
departments, disciplines and contractors for the inspection and maintenance work for the
facility and its maintainable items. The output of the development of the RBIM plan will be based around a maintainable item and will have a broad variety of strategies such as the
elimination of the risk through monitoring, performance testing and improvement of
procedures for process, operation and/or maintenance, inspection, modification, repair, replacement, or operation to failure. Maintenance work can be split into three main
categories shown in Table 18 below.
Table 18 - Principal categories of maintenance
Type of
maintenance
Typical procedure By whom
1. On-stream No plant shutdown required Operating/own staff/ specialists
2. Short shutdown
Shutdown up to a week to change worn equipment, or changes called
by process (catalysts, molecular
sieves, etc.)
Own staff / specialists /
contracting
companies
3. Turnaround Larger plant stops for major
upgrades, repair, inspection, process upgrades
Own staff and
contracting companies
A.2.5.5.2 Input
The main input to the planning and execution is a RBIM analysis including all equipment.
From this risk assessment the following results are expected:
1. Risk ranking of the plant(s) / equipment
2. Type of inspection and maintenance
3. Timing for activity – typically by condition based or scheduled
4. Work and skills required, and estimated time per task
5. Need for plant total or partial shutdown
6. Dependencies between work on the evaluated unit and other components
7. Tools and spare parts needed
A.2.5.5.3 Procedure
The maintenance work normally consists of work generated from 3 different sources (Figure
14) and involves activities specified in Table 19.
1. Preventive plans generated by RBIM assessments (condition based and/or scheduled
maintenance)
2. Corrective maintenance calls from observed failures, beginning problems
Failures identified via condition monitoring (RBIM recommended Run to Failure)
Table 19 - Activities in execution & reporting
Activity Description
Risk Based
Work
Selection (RBWS)
RBWS is used to prioritize the work on a daily or weekly
basis, both for the corrective and preventive tasks. Practice
has shown that about 40% of the corrective tasks that have been called for can be postponed for several weeks. Thus
the RBWS activity deals with the optimum selection and
timing of the tasks to be performed. However, RBWS should
not replace the RBIM risk analysis, nor postpone maintenance tasks for too long.
Work
execution
The work execution involves:
Issuing a work order
Availability of support documentation

SafeLife-X
page 122
HSE – tool box talk, risk assessment
control of work executed
Tools and
databases
A modern maintenance organization will use a computerized
maintenance management system (CMMS) as the key tool in
managing the maintenance function. The CMMS system will typically contain the following information/modules;
Plant equipment breakdown (hierarchy)
Key technical information
Maintenance plans
Work order management (work flow, signature)
Maintenance reporting
Reporting and analysis module
In the context of RBIM information (failure modes, failure
rates and associated consequences), a minimum
requirement for the CMMS systems is that it should contain or link to the risk information from the risk assessment.
Reporting &
documentati
on of work
The purpose of documentation of the executed maintenance
work is:
The condition of the equipment before and after the
work. Information on type of degradation, extend of
damage – information to be used for future
planning. A combination of failure coding, text,
pictures are recommended.
Cost & time control – how many man-hours were
used, spares used, tools used
Accurate reporting is a key to the analysis and
updating of the maintenance plans. Inadequate
quality of this part of the work will cause the risk
based planning to be non-optimal.
Analysis The results from the maintenance work done should be
analyzed and fed back into the RBIM on a regular basis, typically via monthly, quarterly and yearly maintenance and
inspection reports. These reports should typically contain
information on:
Backlog – work performed versus the planned work
Overdue pressurized equipment
Breakdown work (non-planned work)
Availability for the main production system, and
maintenance related losses
Reliability of the safety systems
Trending of key parameters related to availability
,integrity & reliability
A.2.5.5.4 Output
The output from the maintenance execution work is a plant where the preventive maintenance is based on RBIM analyses, and corrective maintenance is also managed using
risk-based principles. As a result, the risk for failure is under control and reduced to an
acceptable level. Furthermore, the work is documented and reported so that reports, tools and information for continuous improvement are available.
A.2.5.5.5 Warning/application limits
The quality and capability of an RBIM plan depends on the input. To achieve a successful RBIM plan it is crucial to include input data from operation, process, maintenance and other
experts. It is essential to ensure that RBIM plan should adhere to European Union

SafeLife-X
page 123
regulations, national regulations and company policies. If required second opinon from
independent experts should be sought in reviewing successful execution of plans.
Figure 47 - Detailed planning
A.2.5.6 Performance review / Evergreen phase
A.2.5.6.1 General description and scope
The purpose of the evaluation of the risk-based decision-making process is to assess its effectiveness and impact in establishing the inspection and maintenance programs. This will
allow the identification of areas where modifications and improvements are needed.
Specifically, evaluation consists of the following tasks:
Assessment of the effectiveness of the risk-based decision-making process in achieving the
intended goals (assessment of effectiveness)
Updating the risk-based decision-making process by taking into account possible plant changes and available new knowledge (reassessment of the risk). This should be done
periodically.
A.2.5.6.2 Requirements
The evaluation process involves both internal and external assessment conducted by the
operating organization and by independent experts, respectively.
The internal evaluation by the plant organization is an integral part of RBIM activity and should be considered as a living process within the overall risk decision-making process.
Internal evaluation can take place in any moment of RBIM, especially when:
discrepancy from any expectation or requirement is found
new knowledge is available or plant changes occur
In both cases, a detailed analysis of the importance of the involved item (discrepancy or new
knowledge/plant change) has to be conducted in order to assess whether it has a significant impact on the RBIM process, and some corrective action should be undertaken. In the latter
Managed Managed
Maintenance
Maintena
nce
Managed Managed
Maintenance
Maintena
nce
Corrective
Using RBWS
Schedu
led Maintena
nce
Calendar Time
Based Periodic Maintena
nce
Operational
Preventive Preventive
Maintenance Maintenance
Schedu
led Maintena
nce
Calendar Time
Based Periodic Maintena
nce
Operational
Regulatory Required
Maintenance
Non-
Regulatory Required
Maintenance
Emergency & Schedule Breaker
Maintenance
Manage Risk & Costs
Minimize
RBIM Recommended
Run-To-Failure
RBWS priority setting for work order planning (Short & long term). In the phase of generating and
assessing new requests the RBIM information (failure modes, failure rates and associated consequences)
should be available in the (Computer Maintenance Management System)CMMS.
Analysis and reporting of efficiency
- Backlog, cost, KPI, integrity status
Routine
Maintenance
Routine Priority
Maintenance
Scheduled Maintenance (Periodically
Generated)
Conditioned
Based Maintenance
Preventive Mandated by
RBIM
Exclude
Run-To-Failure
Preventive Not Mandated
by RBIM

SafeLife-X
page 124
case a thorough analysis of the causes to discrepancy or of the effects of the new
knowledge/plant changes has to be performed.
External evaluation can be executed through independent reviews by external or regulatory organizations (e.g., audits). Independent reviews provide an opportunity to complement the
internal evaluation with a different and neutral perspective. A point to note is that the value
of information provided by the independent review is directly proportional to the openness and collaboration that the external experts will find in the audited organization. The
integration of independent reviews with internal evaluation will allow the identification of
necessary actions for improvement.
A.2.5.6.3 Inputs
For assessment of effectiveness, the following can be used, e.g.:
Definition of risk decision-making process goals (risk may be expressed in one or
more of the following terms: safety, health, environment and business impact)
Definition of Performance Indicators as a measure of the RBM/RBLM process
achievements against the above goals. (Note that in order to enable a meaningful
evaluation of the performance, consideration should be given to the appropriate time
frame applied for the various performance indicators. This is especially when a
relation is identified between the performance and potential causes, it may be more
meaningful when certain quantities are assessed for a longer period of time. For
example, the cost of inspection and maintenance in year X affects the availability in a
certain period of time after year X.)
Reference to existing standards
Benchmarking with similar operating organizations.
For reassessment of risk
A. Plant information
o Changes in design
o Changes in plant operation (mission, operational regime, production rate,
capacity, internal & external environment)
o Time dependent operating conditions (e.g., fatigue, cracks)
o Changes in plant management
o Change in level of personnel training
o Feedback from industry-wide operational experience
o Inspection results (rate of relevant damage/degradation mechanisms)
o Maintenance records
B. New knowledge:
o Applicable research and development results
o Newly improved risk processes
o Advanced inspection methods
o Failure history of actual systems/components
o Newly discovered degradation mechanisms (absence / presence of unanticipated
degradation mechanisms)
o New data on inspection and testing effectiveness
A.2.5.6.4 Procedure
Assessment of efficiency is a combination of good reporting including the aspects with respect to the business targets, and external audit of the plant. This audit can be done by
internal resources (typical for large organizations), by the owner, or by an independent third
party. There are four main methods or approaches applied in such an assessment, are described below.
Reporting of Key Performance Indicators
Key Performance Indicators (KPI) are in this context used for measurement of the business
performance of a plant. The KPI's should reflect important goals for the plant, company or owner, and may change with time. For example, a plant in its post start up period may focus
on availability and at a later stage more on maintenance cost. An example of a set of KPI's
from the owner’s point of view is shown in Table 20.
Table 20 - Examples of KPI's and objectives for selecting them

SafeLife-X
page 125
Objective KPI
Improve safety and environmental
conditions
Number of overall safety and environmental incidents
Increase asset
utilization
Overall equipment effectiveness
Utilization rate by unit %
Plant utilization
Increase return on investment (ROI)
Return on capital employed (ROCE)
Increase revenue from
assets Production throughput
Minimize safety and
environmental incidents
Safety and environmental incidents
Accident by type, time of day, craft, personnel age, training
hours attended, supervisor, unit, area
Reduce production unit
cost Cost per unit
Reduction of controllable lost profit
Lost profit opportunity cost
Reduction of
maintenance expenses
Annual maintenance cost / asset replacement cost
Maintenance cost
Work order cost, bi-monthly average
Cost of Preventive Maintenance by equipment type
Maintenance costs per barrel of product produced
Cost of Predictive Maintenance by equipment type
Unplanned cost as a % total maintenance cost
Work process efficiency benchmarking
The validation/ bench making method used in RIMAP procedure uses a scorecard/ check list method. The RIMAP Methodology Feature List (Figure 48) was produced to serve as a tool for
validation of RIMAP methodology as well as validation of other methodologies. The resulting
validation results gained from this analysis can be used to compare different methodologies.
This list is based on review done by Mitsui Babcock [9] for the RIMAP project. The benchmarking/validation method suggested here provides more information to validate
methodologies (e.g. chapter/paragraph were certain information resides in the
documentation, rating of the specific feature etc.) as well as comments/suggestions for further improvement.
The rating (scoring) of individual features to the methodology or the workbook is based on a
scale 1 – 5 where:
Score1 - Low level and/or quality of data, knowledge, confidence, accuracy, control, information, and industry practice. Or a No answer
Score5 - High level of quality of data, knowledge, confidence, accuracy, control, information, industry practice. Or a Yes answer
In more detail: Score 5: excellent, exceeding the requirements; Score 4: compliant with the
requirements; Score 3: needs improvement; Score 2: partly fulfilled, not acceptable; Score
1: not fulfilled, addition needed
Internal review
The internal evaluation by the plant organization is an integral part of RBIM activity and
should be considered as a living process within the overall risk decision-making process.
External review
External evaluation can be executed through independent reviews by external or regulatory
organizations (e.g. audits). Independent reviews provide an opportunity to complement the internal evaluation with a different and neutral perspective. A point to note is that the value

SafeLife-X
page 126
of information provided by the independent review is directly proportional to the openness
and collaborative environment that external experts will find in the audited organization. The
integration of independent reviews with internal evaluation will allow the identification of necessary actions for improvement.
a) Overall management system
b) Reporting
c) Quality of work (need for rework)
d) KPI definition and reporting
Safety system status
Production
Quality
e) Efficient use of expertise
A.2.5.6.5 Output
Assessment of effectiveness
From this step of RIMAP procedure, following outputs are envisaged as a measure of
assessment of effectiveness of inspection / maintenance strategy:
1. Periodical reports from internal reviews
2. Reports from external audits
3. List of discrepancies from requirements and expectations
4. Methodical analysis of discrepancy causes, when applicable
5. Proposal for improvement actions
Reassessment of risk
From this step of RIMAP procedure, following outputs are envisaged as a measure of reassessment of risk:
1. Periodical reports from internal reviews
2. Reports from external audits
3. Monitoring and feedback from operation
4. Feedback from new knowledge
5. Proposal for improvement actions
A.2.5.6.6 Warnings and applicability limits
Modifications in the process as well as modifications and/or repairs to the installation should be designed and carried out in accordance with a written procedure reflecting appropriate
standards and agreed in advance. This procedure may include an evaluation of the possible
consequences of the change with respect to the integrity of the installation as well as the
way in which authorisation shall take place. All information should be included in the plant database and be available to the RBIM-team for review.

SafeLife-X
page 127
Feature / Subject / Aspect
Explanation Ref. to Document/
Chapter/
Paragraph
Rating (1-5)
or N/A
Justification (if <=3)
Improvement suggestions
1. REQUIREMENTS FOR RISK BASED MAINTENANCE & INSPECTION
1.1 Have references to published
information been
made?
The requirements for integrity management and risk based inspection of potentially hazardous plant can be determined by reference to Health and
Safety regulations, industry standards and guidelines, and other
literature. These can provide valuable information on hazards and control measures as well as covering compliance with Duty Holder’s statutory
obligations.
See reference [1], p.73;
See reference
[2], p.24
3 More references in D3-documents
1.2 Have
reasons/drivers for the Risk Based
Approach been explained
The main objective of risk based integrity management is to understand
and manage the risks of failure of potentially hazardous plant to a level that is acceptable to the organization and the society within which it
operates. Risk based inspection should aim to target finite inspection resources to areas where potential deterioration can lead to high risks.
All the objectives of the risk based approach need to be clearly stated at
the outset of the process. Duty Holders may wish to consider a wide range of consequences of failure, but as a minimum these should include
the Health and Safety of employees and the public, effects on the environment, and implications for their business. It is important that the
risks associated with each of these consequences are considered
separately and that measures are taken to manage the risks in each case. Duty Holders should ensure that inspection resources are adequate
to manage all the risks, and that limited resources do not compromise Health and Safety or environmental risks
All RIMAP
documents [1] - [13]
5 This is the main
aim of all the RIMAP documents
to focus on risk drivers and how to
mitigate risk
1.3 Is the availability and accuracy of
information given, sufficient
The assessment of risk depends on the availability and accuracy of the information relating to the systems and equipment to being assessed.
Good information may enable a low risk to be justified, but does not in itself guarantee that the risks are low. Where information is lacking,
unavailable, or uncertain, the risk is increased since it cannot be shown
that unfavourable circumstances are absent. The type of information required to assess the risk will vary depending on the type of plant, but
should be identified at this early stage. The essential data needed to
make a risk assessment should be available within the plant database. If it is obvious that the essential data does not exist, action to obtain this
information is required or prescriptive inspection procedures should be applied.
See reference [1]; sec.4.3
4 The need for good data is
stressed in many sections.
See in
particular Preparatory
analysis.
Figure 48 - Example of validation feature list in RIMAP [9]

SafeLife-X
page 128
Bibliography [1] RIMAP WP2/D2.1 - “Generic RIMAP Procedure”, GROWTH Project GIRD-CT-2001-03008 “RIMAP”,
RIMAP RTD Consortium, Version: Rev. 6, (2002)
[2] RIMAP D3.1 - “Risk assessment methods for use in RBMI”, by S. Angelsen,
G. Vaje, M. Johanson, J. Heerings, A. den Herder, GROWTH project GIRD-CT-2001-03008 “RIMAP”,
RIMAP RTD Consortium, Version: Rev. 0, (2003)
[3] RIMAP WP3/I3.1 - “Damage mechanisms”, by A.S. Jovanovic, P. Auerkari,
M. Perunicic,, GROWTH Project GIRD-CT-2001-03008 “RIMAP”, RIMAP RTD Consortium, Version: Rev. 8, (2003)
[4] RIMAP I3.2 - “Assessment of the Consequence of Failure”, by J. Heerings,
A. den Herder, M. Johanson, J. Reinders,, GROWTH project GIRD-CT-2001-03008 “RIMAP”, RIMAP RTD Consortium, Version: Rev. 1, (2003)
[5] RIMAP WP3/I3.3 – “Assessment of Probability/ likelihood of failure”, by A.S. Jovanovic, P. Auerkari, R. Giribone, GROWTH project GIRD-CT-2001-03008 “RIMAP”, RIMAP RTD Consortium,
Version: Rev. 10, (2004)
[6] RIMAP WP3/I3.4 – “Inspection and Monitoring Effectiveness”, by B.W.O Shepherd, N. B. Cameron,, GROWTH project GIRD-CT-2001-03008 “RIMAP”, RIMAP RTD
Consortium, Version: Rev. 2, (2003)
[7] RIMAP WP3/I3.5 – “Evaluation method & risk aggregation”, by M. Johansson, GROWTH project GIRD-CT-2001-03008 “RIMAP”, RIMAP RTD Consortium, Version: Rev. 0, (2002)
[8] RIMAP WP3/I3.6 – “Software with PoF estimation method used in RIMAP”, by A.S. Jovanovic, D. Balos, M. Perunicic,, GROWTH project GIRD-CT-2001-03008 “RIMAP”, RIMAP RTD Consortium,
Version: Rev. 4, (2003)
[9] RIMAP D4.2 - “ Benchmarking RIMAP features checklist”, by B. Shephard, G. Vage, A. Baecke, M. Perunicic, GROWTH project GIRD-CT-2001-03008 “RIMAP”, RIMAP RTD Consortium, Version: Rev.
4, (2004)
[10] RIMAP WP4/D4.3 - “RIMAP Application Work book for the Chemical Industry”, by Rino van Voren,
GROWTH project GIRD-CT-2001-03008 “RIMAP”, RIMAP RTD Consortium, Version: Rev. 0, (2003)
[11] RIMAP WP4 - “RIMAP Petrochemical workbook”, by Stefan Winnik, Andrew Herring, Rick Gregory, GROWTH project GIRD-CT-2001-03008 “RIMAP”, RIMAP RTD Consortium, Version: Rev. 1.1,
(2003)
[12] RIMAP WP4, D4 - Application Workbook for Power Plants, A. S. Jovanovic, P. Auerkari, R. Giribone
GROWTH project GIRD-CT-2001-03008 “RIMAP”, RIMAP RTD Consortium, Version 2, (2003)
[13] RIMAP WP4 / D4.3: Application workbook for the steel industry, Alasdair Pollock GROWTH project GIRD-CT-2001-03008 “RIMAP”, RIMAP RTD Consortium, Version 1, (2003)
[14] ASME CRTD - Vol. 41, “Risk-based Methods for Equipment Life Management: An Application
Handbook”, ISBN 0791835073, ASME International, New York, (2003); www.asme.org/Publications/
[15] API 581 – “Base Resource Document - Risk Based Inspection”, American Petroleum Institute (API), (2000); www.api.org/Publications/
[16] ANSI/API RP 580 – “Risk-Based Inspection”, American Petroleum Institute (API), (2002);
www.api.org/publications/
[17] EEMUA Publication 206 – “Risk Based Inspection - Guide to Effective Use of the RBI process”, ISBN
0 85931 150 3, Engineering Equipment and Materials Users Association (EEMUA), (2006); www.eemua.co.uk/publications.htm#cat
[18] MIL-STD-1629A “Military standard - Procedures for performing failure mode, effects and criticality
analysis”, Department of Defense, USA (1980)
[19] “Generating availability data system”, North American Electric Reliability Council, (NERC) USA
(2002); www.nerc.com.publications
[20] “Offshore Reliability Data” – Handbook 4rd Edition (OREDA 2002), by SINTEF Technology and Society; www.sintef.no/static/projects/oreda
[21] EEMUA Publication 159 – “Users' Guide to the Inspection, Maintenance and Repair of Above Ground Vertical Cylindrical Steel Storage Tanks” (3rd Edition), ISBN 0859311317, Engineering Equipment
and Materials Users Association (2003); www.eemua.co.uk/publications.htm#cat
[22] ANSI/API RP 530 – “Calculation of heater-tube thickness in petroleum refineries”, American Petroleum Institute (API), (2003); www.api.org/Publications/
[23] Empfehlung zur Einführung Risikobasierter Instandhaltung VGB – KRAFTWERKSTECHNIK GmbH, 2004, ArtNr.:M130, existing English version: Recommendation for the introduction of Risk based
maintenance ArtNr.:M130e
[24] KKS Kraftwerk-Kennzeichensystem Richtlinie zur Anwendung und Schlüsselteil, VGB – KRAFTWERKSTECHNIK GmbH, 2007, ArtNr:. 105E, existing in English version: KKS Power Plant
Classification System - Guidelines for Application and Key,2007, Part Art Nr.105e www.vgb.org/shop/index.php?manufacturers_id=14
[25] Recommended Practice - RP 0501 “Erosive Wear in Piping Systems”,
Det Norske Veritas 1996, (Rev. 1999)

SafeLife-X
page 129
[26] “Maintenance baseline study - A method for self-assessment of maintenance management
systems”, Rev.0 (1998), The Norwegian Petroleum Directorate, NO; www.ptil.no/English/
[27] “Nondestructive evaluation (NDE) capabalites data book”, complied by Rummel W.D. and
Matzkanin G.A. (3rd edition, 1997), Advanced Materials, Manufacturing and Testing Information
Analysis Center (AMMTIAC – formerly NTIAC), USA; www.ammtiac.alionscience.com/ammt/products (AMMITAC order No: AMMT-029CD or AMMT–
029HC)
[28] COVO study, Risk analysis of six Potentially Hazardous Industrial Objects in the Rijnmond Area, A
pilot study, Report to the Rijnmond Public Authority, Central Enviornmental Control Agency,
Schiedam, The Netherlands, 1981
[29] TNO EFFECTS: A software for Hazard Assessment, TNO Prins Mauritis Research Laboratory, The
Netherlands, 1991.
[30] PHAST Risk, Software for the risk assessment of Flammable, explosive and toxic impact, Det Norske Veritas (DNV), 2002
[31] PGS 3 (formely CPR18E) – “Guidelines for quantitative risk assessment”, Purple Book, Sdu Uitgevers, Den Haag, ISSN: 01668935/2.10.0121/8804, Committee for the Prevention of
Disasters, (1st edition 1999); vrom.nl/pagina.html?id=20725
[32] PGS 2 (formely CPR14E) – “Methods for the calculation of physical effects -due to the release of hazardous materials (liquids and gases)”, Yellow Book, Sdu Uitgevers, Den Haag, ISSN:
09219633/2.10.014/9110, Committee for the Prevention of Disasters, (3rd Edition, Second revised 2000); vrom.nl/pagina.html?id=20725
[33] PGS 1 (formely CPR16E) – “Methods for the determination of possible damage to people and
objects resulting from releases of hazardous materials” Green Book, SZW The Hague: Directorate General of Labour of the Ministry of Social Affairs and Employment, ISSN:
09219633/2.10.016/9204, Committee for the Prevention of Disasters, (1st Edition 1992); vrom.nl/pagina.html?id=20725
“The Netherlands rules for pressure vessels”, ‘Risk-based inspection’, T 0260; March 2002.

SafeLife-X
page 130
A.2.6 RBI example: Multilevel risk analysis in the power
industry
Note: German technical rules for boilers (TRD) and German standards used in this example are now European Standards (please see references). The following table shows the
correlation between the documents.
Table 21: Overview of TRD documents and their EN designation
TRD / DIN Document EU Standard – EN
TRD 300 EN 12952-1
DIN 17155 and DIN 17175 EN 12952-2
TRD 301 EN 12952-3
TRD 508 EN 12952-4
The PoF determination in this example is based on creep exhaustion (based on material
uncertainties) and fatigue exhaustion. Creep exhaustion is determined using TRD creep
curves (EN 12952-1, EN 12952-3), based on material data as shown in Figure 49. Fatigue exhaustion is based on low-bound TRD curve as shown in Figure 50.
The creep curve is usually derived from the experimental data, according to recognized
procedures, i.e. ECCC WG1 - Creep Data Validation and Assessment Procedures (ECCC WG1 1995).
Fatigue curve is derived depending on the design temperature and using min[N/20, 2a /2],
where N is the number of cycles to crack initiation, and 2a is stress amplitude.
Inputs:
Component geometry according to TRD codes 300/301 (EN 12952-1, EN 12952-3), please
see Figure 51.
Design temperature and pressure (see Figure 52)
Material data – average creep rupture strength for the component material and fatigue
strength at given temperature
Service time of the component – operational hours (see Figure 53)
Figure 49 Creep exhaustion calculation based on TRD (now EN 12952)

SafeLife-X
page 131
Figure 50 TRD Fatigue curve (with derived mean value curve) at 400°C
Figure 51: Component geometry data

SafeLife-X
page 132
Figure 52: Design and operating temperature and pressure
Figure 53: Service time of the component
Based on data inputted and TRD rules exhaustions are calculated:
ez – creep exhaustion
ew – fatigue exhaustion
It is assumed that average creep rupture strength and fatigue strength have a log-normal distribution, with 21 (about 97.5% confidence level) at the lower (TRD) curve, and mean
value on the mean curve as given by material data for creep.
where:
and values are the values in the “real” (non-log scale), whereas 1 and 1 are values
(parameters) of the normal distribution in the log scale.
Since we assume that the distribution is normal in the logarithmic space, we can calculate the parameter 1 using the above equation as:
Which gives:
21
1
2
ln
2
12
1
t
et
tf
2
22
122
2
1 ln,ln
2
lnln1
ailureTRDTimeToFFailureMeanTimeTo
FailureMeanTimeTo
1
21
e

SafeLife-X
page 133
For example, using parameters defined as described above we calculate probability of failure
based on creep, e.g.
PoF(tServiceTime=128000hours) = 4.31E-04%
PoF(ServiceTime=128000hours tServiceTime=200000hours)=
PoF(tServiceTime=200000hours) - PoF(tServiceTime=128000hours) =
5.84E-03% - 4.31E-04% = 5.41E-03%
Examples of distribution for creep and fatigue can be seen in Figure 54 and Figure 55, respectively.
Figure 54 Example of distribution for creep rupture strength at 520°C
Figure 55 Example of distribution for fatigue strength at 400°C
A.2.6.1 Sample case
For the case of this example we will consider 8 components from a power plant. General
information about the sample case plant:
gas turbine 35 MWel and 60 MW of district heating with a coal-fired steam generator (195
MWel and 150 MW of district heating)
commissioning 1982
gross output 230 MW
net output 210 MW
steam generating capacity 576 t/h
district heating 210 MW

SafeLife-X
page 134
fuel:
low-grade coal
methane gas
converter gas
operating hours: 126168
Table 22: Components considered in this example
Name Type
Mix-HEADER Header
Water Separator Separator
SUPERHEATER 4 LI Superheater
SUPERHEATER 4 RE Superheater
HP-OUTLET Header
SUPERHEATER Header
SUPERHEATER-OUTLET T-Piece
Attemperator Attemperator
From this 8 components 10 cases will considered (for 2 components additional failure mode
will be considered)
A.2.6.2 Screening level
For the screening level of the analysis only the component design data is available.
Additional the number of operating hours is also known.
The following table shows the data available for the components.
Table 23: Component design data
Component-Failure mode
Type Material Service temperature
Service pressure
Operating hours
Mix-HEADER -
Leak
Header 15NiCuMoNb5 280 238 126168
Water Separator - Leak
Separator 15NiCuMoNb5 390 225 126168
SUPERHEATER 4
LI - Leak
Superheater X20CrMoV121 483 205 126168
SUPERHEATER 4
RE - Leak
Superheater X20CrMoV121 483 205 126168
HP-OUTLET - Leak
Header X20CrMoV121 540 205 126168

SafeLife-X
page 135
Component-
Failure mode
Type Material Service
temperature
Service
pressure
Operating
hours
SUPERHEATER-
OUTLET - Leak
Header 10CrMoV910 542 44.5 126168
T-PIECE RA00 - Leak
T-Piece X20CrMoV121 540 205 126168
Attemperator -
Leak
Attemperator X20CrMoV121 540 205 126168
SUPERHEATER 4
LI - break
Header X20CrMoV121 483 205 126168
T-PIECE RA00 -
Break
T-Piece X20CrMoV121 540 205 126168
Based on available data and using TRD codes (now EN 14952), using e.g. ALIAS-TRD, service stress and exhaustion factors (ez – creep exhaustion, ew – fatigue exhaustion) were
calculated (see Table 24)
Table 24: Calculated component exhaustion values
Component-Failure
mode
Type Service
stress
Ez [%] Ew [%] Etot[%]
Mix-HEADER - Leak Header 135.796 0 11.9 11.9
Water Separator -
Leak
Separator 110.189 5.52E-08 16.98 16.98
SUPERHEATER 4 LI - Leak
Superheater 108.709 1.6 26.49 28.09
SUPERHEATER 4 RE -
Leak
Superheater 88.408 0.3 19.73 20.03
HP-OUTLET - Leak Header 65.209 20.9 22.67 43.57
SUPERHEATER-
OUTLET - Leak
Header 26.996 8.6 8.188 16.788
T-PIECE RA00 - Leak T-Piece 63.146 18 24.98 42.98
Attemperator - Leak Attemperator 92.32 53.9 24.98 78.88
SUPERHEATER 4 LI –
break
Header 108.709 1.6 26.49 28.09
T-PIECE RA00 - Break T-Piece 63.146 18 24.98 42.98

SafeLife-X
page 136
Data was then inputted into RIMAP software (ALIAS-Risk, see ref. RIMAP 2002d), like shown
in Figure 56.
The following step is to define PoF and CoF classes. Following PoF classes were defined (see also Figure 57)
PoF Ez – probability of failure based on creep exhaustion
PoF Ew – probability of failure based on fatigue exhaustion
PoF E – combined probability of failure for PoF Ez and PoF Ew
Figure 56 Screening level PoF analysis in ALIAS-Risk
Figure 57 Defining PoF classes using ALIAS-Risk

SafeLife-X
page 137
After defining PoF classes, consequence of failure classes were defined as following (see also
Figure 58):
Additional replacement cost (€)
Typical repair cost (€)
Production loss by failure (€)
Overall replacement cost (€)
CoF by leak – combined repair/production loss costs (€)
Additional damage to other equipment cost (€)
Combined replace/damage to other equipment cost (€)
Replacement value (€)
Current value (€)
Overall damage by leak costs(€)
CoF by break (€)
Figure 58 Defining CoF classes using ALIAS-Risk
When the PoF and CoF classes were defined the failure scenarios (“Bow Tie” diagrams) for
each component were made (see Figure 59). Example of a failure scenario for the
superheater component can be seen in Figure 60.

SafeLife-X
page 138
Figure 59 Building failure scenarios using ALIAS-Risk
Figure 60 “Bow Tie” for supeheater component
In the next step PoF values were calculated based on inputted data and using ALIAS-TRD.
The procedure was done like explained previously in this chapter (see Chapter A.2.6).
Afterwards the calculated PoF values were imported into ALIAS-Risk (see Figure 61) and CoF
values for each defined CoF class were inputted.
SUPERHEATER 4
LI - LeakPoF: PoF E
PoF Ez
PoFEw
CoF: CoF by Leak
Overall Damage by
leak
Lost Production by
Failure
Typical Repair Cost
Additional Damage
to other equipemen
t

SafeLife-X
page 139
Figure 61 Imported calculated PoF values
Figure 62 Input of CoF values
Based on PoF and CoF values, following the previously defined scenarios (“Bow Tie”
diagrams) for each component, risk is determined. Risk map (full report as well) are then
automatically generated by ALIAS-Risk. The risk map for this example can be seen in
Figure 63 Risk map after screening level
A.2.6.3 Intermediate level
59
6
3107
8
42
1
0.00001
0.0001
0.001
0.01
100 1000 10000 100000 1000000 10000000Consequences (Euro)
Po
F
Screening

SafeLife-X
page 140
After screening, next level of analysis is intermediate. Since monitoring data was available
for this sample case it was decided to perform intermediate analysis for all 8 components/10
cases.
Because of seamless transition between analysis levels in proposed RIMAP approach it is not
necessary to perform all steps performed already in previous (screening) level. Based on
monitoring data, new values of exhaustion based on creep and fatigue (according to TRD, now EN 14952) could be calculated. Since PoF and CoF classes, as well as the scenarios were
already done in the previous step, the only necessary step in this level is to calculate again
the PoF values based on updated values of exhaustion (the methodology is the same like in the screening level, only more data is available).
Table 25: The following table shows new calculated values of PoF:
Component-Failure mode Type PoF
Mix-HEADER - Leak Header 2.03E-11
Water Separator - Leak Separator 2.03706E-05
SUPERHEATER 4 LI - Leak Superheater 0.001345622
SUPERHEATER 4 RE - Leak Superheater 0.000587421
HP-OUTLET - Leak Header 0.000448781
SUPERHEATER-OUTLET - Leak Header 0.002393522
T-PIECE RA00 - Leak T-Piece 1.28E-04
Attemperator - Leak Attemperator 8.35896E-05
SUPERHEATER 4 LI – break Header 0.001345622
T-PIECE RA00 - Break T-Piece 1.28E-04
Newly calculated values were input into ALIAS-Risk and new risk map was generated
automatically (see Figure 64). In order not to make the risk map overcrowded, only few components are shown in the figure.
Interesting thing with Figure 64is that it clearly shows the conservatism of low-level
(screening) analysis when compared to intermediate. The arrows show how the components moved into the areas of lower risk from those determined in the screening level.
2
810
6
0.00001
0.0001
0.001
0.01
100 1000 10000 100000 1000000 10000000Consequences (Euro)
Po
F
Screening Intermediate Detailed
Figure 64 Risk map after intermediate analysis
A.2.6.4 Detailed level
For the most critical component (in our sample case, component 6 – SUPERHEATER Outlet,
Header) it was decided to perform detailed analysis.
The analysis was performed according to the schematics shown in Figure 67.

SafeLife-X
page 141
All obtainable data for the component was gathered (including geometry, properties of the
material used etc.) and the analysis was performed for several load cases (so called “worse
cases”). The detailed analysis included:
Stress calculation for the “worse cases”
Creep analysis
Fatigue analysis
Critical crack size calculation
Creep crack growth (see Figure 65)
Fatigue crack growth
Corresponding details about this analysis are given in the work of Jovanovic, Maile 2001 (see
references).
Figure 65 Creep crack growth with C* (form factor 2.5) (Jovanovic, Maile, 2001))
After performing the detailed analysis and applying the statistical models (like shown in Figure 67), new value of PoF for the component was determined and plotted on the risk map
(see Figure 66)
Again it can be seen that the conservatism was preserved and that the detailed analysis moved the component on the risk map in the region of lower risk from those after screening
and intermediate analysis.
Figure 66 Superheater component on a risk map after detailed analysis
0
5
10
15
20
25
10000 100000 1000000
t [h]
a [
mm
]
C* max C* mittel
6
6
6
0.00001
0.0001
0.001
0.01
100 1000 10000 100000 1000000 10000000
Screening Intermediate Detailed
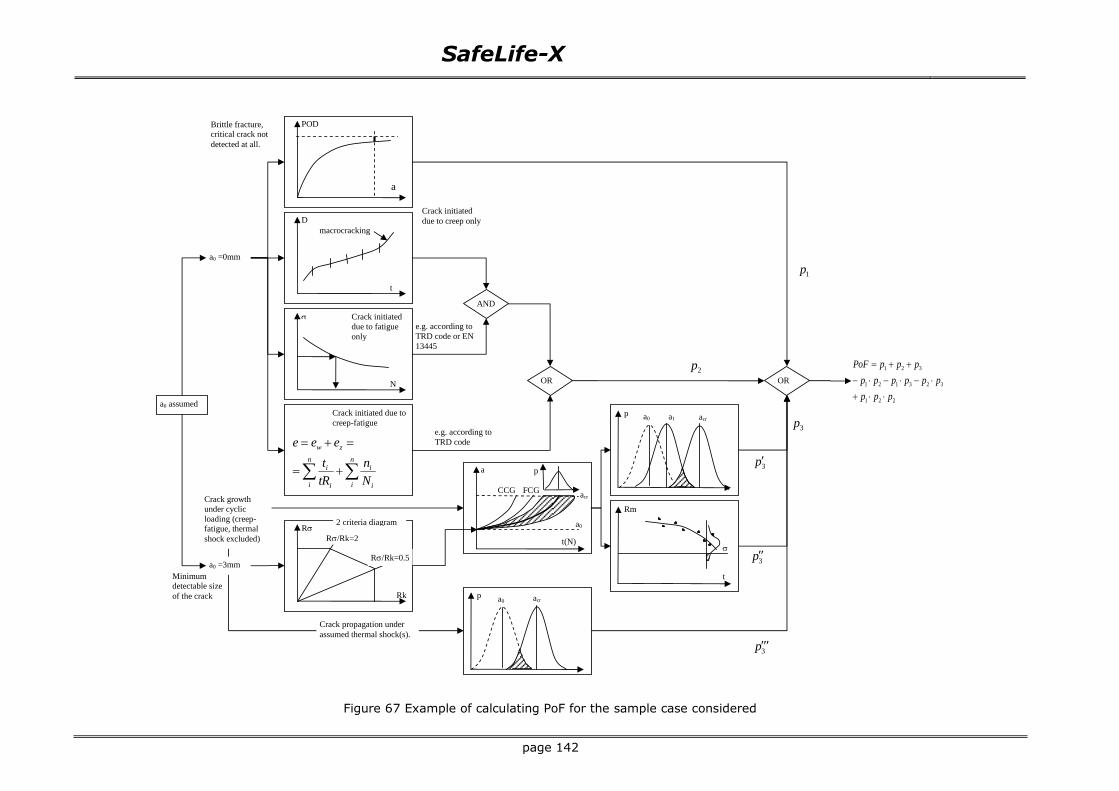
SafeLife-X
page 142
Figure 67 Example of calculating PoF for the sample case considered
a0 assumed
macrocracking
POD
a
D
t
N
n
i
n
i i
i
i
i
zw
N
n
tR
t
eee
a0 =0mm
R
Rk
R/Rk=2
R/Rk=0.5
2 criteria diagram
a
t(N)
a0 =3mm
AND
OR
acr
a0
acr a0 p
CCG FCG
p
Minimum detectable size
of the crack
acr a0 p a1
Rm
t
OR
3p
3p
3p
2p
1p
3p
221
323121
321
ppp
pppppp
pppPoF
Brittle fracture, critical crack not
detected at all.
Crack initiated
due to creep only
Crack initiated
due to fatigue
only
Crack initiated due to
creep-fatigue
e.g. according to
TRD code or EN
13445
e.g. according to
TRD code
Crack growth
under cyclic
loading (creep-fatigue, thermal
shock excluded)
Crack propagation under
assumed thermal shock(s).

SafeLife-X
page 143
Annex 3 Aging Related KPIs
ERRA Key Performance Indicators (KPIs)
Name of
indicator
Increasing/emerging internal corrosion rate factor of a UNIT- for group of
static equipment and piping
KPI classification
Leading KPI X
Organizational
Action
Other
Lagging KPI
Frequency based
X
Consequence based
Mixed
based
Local
indicators
Global indicators
X
Definition
Portion of static equipment and pipes where the probability of failure due to internal corrosion has
increased with at least one category (resulted from RBI analyses e.g. according to API 581) during the last investigated period.
Formula (e.g., mortality rate / 1000*hour work)
KPI = (Ninc
Nall ) × 100%
where:
Ninc – Number of equipment and/or pipes, where the probability of failure has increased with at least one category during the last investigated period, e.g. 6 months.
Nall – Number of equipment and/or pipes in a UNIT. Minimum 5 equipment and pipes are
necessary to be involved in the calculation in order to get realistic result.
Comment
Increasing of the internal corrosion rate can increase the probability of leakage or other
structural failure of static equipment or piping.
This is a damage mechanism related KPI at unit level.
To which system it appeals to
All static equipment and piping in a unit.
Name of
indicator
Increasing/emerging external corrosion rate factor of a UNIT- for static
equipment and piping
KPI classification

SafeLife-X
page 144
ERRA Key Performance Indicators (KPIs)
Leading KPI X Organizational
Action
Other
Lagging KPI
Frequency based X Consequence based
Mixed
based
Local
indicators
Global indicators X
Definition
Portion of static equipment and pipes where probability of failure due to external corrosion has increased with at least one category (resulted from RBI analyses e.g. according to API 581)
during the last investigated period.
Formula (e.g., mortality rate / 1000*hour work)
KPI = (Ninc
Nall ) × 100%
where:
Ninc – Number of equipment and/or pipes, where the calculated corrosion rate factor has been
increasing with at least one risk category during the last investigated period.
Nall – Number of equipment and/or pipes of the UNIT. Minimum 5 equipment and pipes are
necessary to be involved in the calculation in order to get realistic result.
Comment
Increasing of the external corrosion rate can increase the probability of leakage or other
structural failure of static equipment or piping.
This is a damage mechanism related KPI at unit level.
To which system it appeals to
All static equipment and piping in a unit.
Name of
indicator
Increasing/emerging internal cracking susceptibility factor of a UNIT- for
static equipment and piping
KPI classification
Leading KPI X Organizational
Action
Other

SafeLife-X
page 145
ERRA Key Performance Indicators (KPIs)
Lagging KPI
Frequency based X Consequence based
Mixed
based
Local
indicators
Global indicators X
Definition
Portion of static equipment and pipes where internal cracking sensitivity has increased with at
least one category (resulted from RBI analyses e.g. according to API 581) during the last investigated period.
Formula (e.g., mortality rate / 1000*hour work)
KPI = (Ninc
Nall ) × 100%
where:
Ninc – Number of equipment and pipes, where the calculated cracking sensitivity has been
increasing with at least one risk category during the last investigated period.
Nall – Number of equipment and/or pipes of the UNIT. Minimum 5 equipment and pipes are
necessary to be involved in the calculation in order to get realistic result.
Comment
Increasing of the susceptibility to internal cracking (due to e.g. stress corrosion cracking) can increase the probability of structural failure of static equipment or piping.
This is a damage mechanism related KPI at unit level.
To which system it appeals to
All static equipment and piping in a unit.
Name of
indicator
Increasing/emerging external cracking susceptibility factor of a UNIT – for
static equipment and piping
KPI classification
Leading KPI X Organizational
Action
Other
Lagging KPI
Frequency based X Consequence based
Mixed
based

SafeLife-X
page 146
ERRA Key Performance Indicators (KPIs)
Local
indicators
Global indicators X
Definition
Portion of static equipment and pipes where external cracking sensitivity has increased with at
least one category (resulted from RBI analyses e.g. according to API 581) during the last investigated period.
Formula (e.g., mortality rate / 1000*hour work)
KPI = (Ninc
Nall ) × 100%
where:
Ninc – Number of equipment and pipe, where the calculated external cracking sensitivity higher
with at least one category during the last investigated period (e.g. 6 months).
Nall – Number of equipment and/or pipes in a UNIT. Minimum 5 equipment and pipes are necessary to be involved in the calculation in order to get realistic result.
Comment
Increasing of the susceptibility to internal cracking (due to e.g. stress corrosion cracking) can increase the probability of structural failure of static equipment or piping.
This is a functional failure related KPI at unit level.
To which system it appeals to
All static equipment and piping in a unit.
Name of
indicator Failure factor of static equipment - UNIT level
KPI classification
Leading KPI Organizational
Action
Other
Lagging KPI X
Frequency based X
Consequence
based
Mixed
based
Local
indicators
Global indicators X
Definition

SafeLife-X
page 147
ERRA Key Performance Indicators (KPIs)
Ratio of actual number of failures of static equipment to average number of failures in the
previous period in a unit.
Formula (e.g., mortality rate / 1000*hour work)
Failuresfactorofstaticequipment =NumberoffailurereportsNumberoffailurereportsaverage
NumberoffailurereportsrefFailure factor = (Number of
failures - Number of failures_ref)/Number of failures_ref*100%
where:
Number of failures - actual number of failures of static equipment in the last period (e.g. last month) (e.g. that are recorded in SAP)
Number of failures_ref - number of failures of static equipment in the previous period (e.g.
previous 6 months) (e.g. that are recorded in SAP)
Comment
Increasing number of failure of static equipment and piping is an indicator of decreasing the
reliability and availability of a unit or a plant.
This is a functional failure related KPI at unit level.
To which system it appeals to
All static equipment and piping.
Name of indicator
Increasing of the number of failure cases of different parts of rotating equipment - UNIT level
KPI classification
Leading KPI Organizational
Action
Other
Lagging KPI X
Frequency based X
Consequence
based
Mixed
based
Local
indicators
Global indicators X
Definition
Ratio of the increasing of the number of the failure cases of different parts of rotating equipment in the last investigated period compared to the previous period.
Formula (e.g., mortality rate / 1000*hour work)

SafeLife-X
page 148
ERRA Key Performance Indicators (KPIs)
N% = (N – Nref)/Nref*100%
where
N - Actual number of failure cases of different parts of rotating equipment in the last investigated period (e.g. 6 months). This number can be taken e.g. from an on-line diagnostic system of
rotating equipment.
Nref - Number of failure cases of different parts of rotating equipment in the previous investigated
period (e.g. previous 6 months). This number can be taken e.g. from an on-line diagnostic system of rotating equipment.
Comment
Increasing number of failure of different parts of rotating equipment is an indicator of decreasing the reliability and availability of a unit or a plant.
This is a functional failure related KPI at unit level.
To which system it appeals to
All rotating equipment in a unit.
Name of
indicator Failure factor of rotating equipment - UNIT level
KPI classification
Leading KPI Organizational
Action
Other
Lagging KPI X
Frequency based X Consequence based
Mixed
based
Local indicators
Global indicators X
Definition
Ratio of actual number of failed rotating equipment in the last period to average number of failed
rotating equipment in the previous period in a unit.
Formula (e.g., mortality rate / 1000*hour work)
Failuresfactorofstaticequipment =NumberoffailurereportsNumberoffailurereportsaverage
NumberoffailurereportsrefFailure factor of rotating
equipment= (Number of failed rotating equipment -Number of failure rotating equipment_ref )/Number of failed rotating equipment_ref*100%

SafeLife-X
page 149
ERRA Key Performance Indicators (KPIs)
where:
Number of failure rotating equipment - actual number of failed rotating equipment in the last
period (e.g. last month), reported e.g. through an on-line diagnostic system or SAP.
Number of failed rotating equipment_ref - number of failed rotating equipment in the previous period (e.g. previous 6 months), reported e.g. through an on-line diagnostic system or SAP.
Comment
Increasing number of failed rotating equipment is an indicator of decreasing the reliability and availability of a unit or a plant.
This is a functional failure related KPI at unit level.
To which system it appeals to
All rotating equipment in a unit.
Name of
indicator
Increasing of the number of unsuccessful calibrations of instruments -
UNIT level
KPI classification
Leading KPI Organizational
Action
Other
X
Lagging KPI X
Frequency based X Consequence based
Mixed
based
Local indicators
Global indicators X
Definition
Ratio of actual number of unsuccessful calibrations of instruments in the last period to the
number of unsuccessful calibrations of instruments in the previous period in a unit.
Formula (e.g., mortality rate / 1000*hour work)
KPI = Number of unsuccessful calibration of instruments in a unit in the last period (e.g. last 6
month) /number of unsuccessful calibrations in the previous period (e.g. 6 months) *100%
Comment
The increasing number of unsuccessful instrument calibration mean that the conditions of the
instruments are getting worse, thus the probability of operational failure related to any
malfunction or failure of an instrument may increase.
This is a functional failure related KPI at unit level.

SafeLife-X
page 150
ERRA Key Performance Indicators (KPIs)
To which system it appeals to
All instruments in a unit.
Name of
indicator Decreasing of the number of calibrations of instruments - UNIT level
KPI classification
Leading KPI Organizational
Action
Other
X
Lagging KPI X
Frequency based X Consequence based
Mixed based
Local indicators
Global indicators X
Definition
Ratio of the actual number of calibrations of instruments in the last period to the number of
calibrations of instruments in the previous period in a unit.
Formula (e.g., mortality rate / 1000*hour work)
KPI = Number of calibration of instruments in a unit in the last period (e.g. last 6 month)/number
of calibrations in the previous period (e.g. 6 months) *100%
Comment
Decreasing of the number of instrument calibration can indicate the decreasing reliability of the
instruments, so the probability of instrument failure can increase.
This is a functional failure related KPI at unit level.
To which system it appeals to
All instruments in a unit.
Name of indicator
Failure factor of instruments - UNIT level
KPI classification
Leading KPI Organizational Action Other

SafeLife-X
page 151
ERRA Key Performance Indicators (KPIs)
Lagging KPI X
Frequency based X Consequence based
Mixed
based
Local
indicators
Global indicators X
Definition
Ratio of actual number of failures of instruments to average number of failures in the previous period in a unit.
Formula (e.g., mortality rate / 1000*hour work)
reffailureinstrumentofNumber
reffailureinstrumentofNumberfailuresinstrumentofNumberKPI
_
_
where:
Number of instrument failures - actual number of instrument failures in the last period (e.g. last month), e.g. that is recorded in SAP.
Number of instrument failures_ref - average number of instrument failures in the previous period
(e.g. previous 6 months), e.g. that is recorded in SAP.
Comment
Increasing number of instrument failures is an indicator of decreasing the reliability and availability of a unit or a plant.
This is a functional failure related KPI at unit level.
To which system it appeals to
All instruments in a unit.
Name of indicator
Failure factor of remote control valves - UNIT level
KPI classification
Leading KPI Organizational
Action
Other
Lagging KPI
X Frequency based X Consequence based
Mixed based

SafeLife-X
page 152
ERRA Key Performance Indicators (KPIs)
Local
indicators
Global indicators X
Definition
Ratio of actual number of failures of remote control valves in the last period to average number of
failures in the previous period in a unit.
Formula (e.g., mortality rate / 1000*hour work)
Failuresfactorofstaticequipment =NumberoffailurereportsNumberoffailurereportsaverage
NumberoffailurereportsrefFailure factor of remote
control valves= (Number of failures -Number of failures_ref )/Number of failures_ref*100%
where:
Number of failures - actual number of failures of remote control valves in the last period (e.g.
last month) that is recorded e.g. in SAP.
Number of failures_ref - average number of failures of remote control valves in the previous period (e.g. previous 6 months) that is recorded e.g. in SAP.
Comment
Increasing number of remote control valves failures is an indicator of decreasing the reliability and availability of a unit or a plant.
This is a functional failure related KPI at unit level.
To which system it appeals to
Remote control valves in a unit.
Name of
indicator Failure factor of equipment – UNIT level
KPI classification
Leading KPI Organizational
Action
Other
Lagging KPI X
Frequency based X Consequence based
Mixed
based
Local indicators
Global indicators X
Definition
Ratio of actual number of failures of all equipment to average number of failures in the previous
period in a unit.

SafeLife-X
page 153
ERRA Key Performance Indicators (KPIs)
Formula (e.g., mortality rate / 1000*hour work)
reffailuresequipmentofNumber
reffailuresequipmentofNumberfailuresequipmentofNumberKPI
_
_
where:
Number of equipment failures - actual number of failures of all equipment in the last period (e.g. last month), e.g. that is recorded in SAP.
Number of equipment failures_ref - average number of failures of all equipment in the previous
period (e.g. previous 6 months), e.g. that is recorded in SAP.
Comment
Increasing number of equipment failures is an indicator of decreasing the reliability and
availability of a unit or a plant.
This is a functional failure related KPI at unit level.
To which system it appeals to
All equipment in a unit.
Name of indicator
Decreasing of the management system factor
KPI classification
Leading KPI X Organizational X
Action
Other
Lagging KPI
Frequency based X Consequence based
Mixed
based
Local
indicators
Global indicators X
Definition
Decreasing of the management system factor that is determined according to API 581.
Formula (e.g., mortality rate / 1000*hour work)
KPI=actual calculated management system factor/last determined management system factor x
100%

SafeLife-X
page 154
ERRA Key Performance Indicators (KPIs)
Comment
The determination of management system factor is based on API581.
The decreasing of the management system factor is an indicator that the quality of the unit/plant
management has been decreased, so the safe and reliable operation of the plant could be decreased due to not proper management.
To which system it appeals to
Whole unit or plant.
Name of indicator Increasing/emerging internal corrosion rate factor - for static equipment and piping
KPI classification
Leading KPI X Organizational
Action
Other
Lagging KPI
Frequency based X Consequence based
Mixed
based
Local indicators X
Global indicators
Definition
Increasing of the average internal corrosion rate calculated or measured for the last investigated period (e.g. 6 months) compared to the corrosion rate calculated at last RBI analysis.
Formula (e.g., mortality rate / 1000*hour work)
RATE = RATEaverage-RATERef
where:
RATEaverage =∑ RATEi ∙ ∆tn
i=1
T ∙ 1440
RATERef - internal corrosion rate calculated at last RBI analysis in mm/year (API 581)
RATEaverage – calculated or measured average internal corrosion rate for the last period (T) in
mm/year
T – last investigated period in days (default value is 180 days, but it can depend on the stability of the process parameters. If the process parameters (temperature, pressure, fluid composition,
etc.) are relatively stable, this period can be longer. If the process parameters may change
relatively often (for example: frequent stock change) this period can be shorter. In each case it must be assessed individually.
t – the sampling interval of the on-line measured parameter that is used for calculation of the
corrosion rate(e.g. T, p) in minutes
n – number of samples

SafeLife-X
page 155
ERRA Key Performance Indicators (KPIs)
RATEi – calculated (API 581) or measured corrosion rate at sampling in mm/year
Comment
The corrosion rate calculation is based on API 581. The potential damage mechanism (corrosion type) can be determined using the screening questions defined in API 581, e.g. this screening
could be implemented into the on-line monitoring software code itself.
Increasing of the internal corrosion rate is an indicator that the probability of structural failure has been increased.
This is a damage mechanism related KPI at equipment level.
To which system it appeals to
Static equipment and piping, i.e.: Heat exchanger, Reactor, Absorber, Desorber, Separator,
Storage tank, Filter, Piping
Name of indicator Decreasing of the remaining life time (year) - static equipment
KPI classification
Leading KPI X Organizational
Action
Other
Lagging KPI
Frequency based X Consequence based
Mixed
based

SafeLife-X
page 156
ERRA Key Performance Indicators (KPIs)
Local indicators X
Global indicators
Definition
Decreasing of the remaining life time of equipment or piping calculated based on the actual
corrosion rate (in the last period) in % compared to the life time calculated using the corrosion rate determined at last RBI analysis.
Formula (e.g., mortality rate / 1000*hour work)
𝑇% = (𝑇𝑟 − 𝑇𝑐
𝑇𝑟) × 100%
Reference remaining life time: 𝑇𝑟 =𝑉−𝑉𝑠
𝑅𝑎𝑡𝑒𝑟𝑒𝑓
Calculated actual remaining life time: 𝑇𝑐 =𝑉−𝑉𝑠
𝑅𝑎𝑡𝑒𝑐𝑎𝑙
where: v – measured thickness of the equipment or pipe at last RBI analysis
vs – minimum required wall thickness
RATEref – corrosion rate determined at last RBI analysis (API 581)
RATEcal – calculated or measured average corrosion rate for last 6 months
Comment
Decreasing of the remaining lifetime calculated based on the corrosion rate is an indicator that
the probability of structural failure has been increased.
This is a damage mechanism related KPI at equipment level.
To which system it appeals to
Static equipment and piping
Name of indicator Increasing/emerging external corrosion rate factor-static equipment
KPI classification
Leading KPI X Organizational
Action
Other
Lagging KPI
Frequency based X Consequence based
Mixed
based
Local indicators X Global indicators

SafeLife-X
page 157
ERRA Key Performance Indicators (KPIs)
Definition
Increasing of the average external corrosion rate calculated for the last investigated period (e.g.
6 months) compared to the corrosion rate calculated at last RBI analysis.
Formula (e.g., mortality rate / 1000*hour work)
ΔRATE = RATEaverage-RATEref
where:
RATEref - corrosion rate calculated at last RBI analysis in mm/year (API 581)
RATEaverage – calculated or measured average corrosion rate for the last investigated period (T) in
mm/year
T – last investigated period in days (default value is 180 days, but it can depend on the stability of the process parameters. If the process parameters (temperature, pressure, fluid composition,
etc.) are relatively stable, this period can be longer. If the process parameters may change
relatively often (for example: frequent stock change) this period can be shorter. In each case it must be assessed individually.
Comment
The corrosion rate calculation is based on API 581.
Increasing of the external corrosion rate is an indicator that the probability of structural failure has been increased.
This is a damage mechanism related KPI at equipment level.
To which system it appeals to
Static equipment and piping in a unit.
Name of indicator Increasing/emerging internal cracking susceptibility factor-static
equipment and piping
KPI classification
Leading KPI X Organizational
Action
Other
Lagging KPI
Frequency based X Consequence based
Mixed
based
Local indicators X
Global indicators

SafeLife-X
page 158
ERRA Key Performance Indicators (KPIs)
Definition
Increasing of the average internal cracking sensitivity calculated for the last investigated period
(e.g. 6 months) compared to the cracking sensitivity calculated at last RBI analysis.
Formula (e.g., mortality rate / 1000*hour work)
ΔS = Saverage-SRef where: SRef - cracking sensitivity calculated at last RBI analysis (1: low, 2: middle, 3: high) (API 581) Saverage – calculated average cracking sensitivity for the last investigated period (T)
T – last investigated period in days (default value is 180 days, but it can depend on the stability
of the process parameters. If the process parameters (temperature, pressure, fluid composition,
etc.) are relatively stable, this period can be longer. If the process parameters may change relatively often (for example: frequent stock change) this period can be shorter. In each case it
must be assessed individually.
Comment
The susceptibility to internal cracking calculation is based on the API 581. The potential damage
mechanism (cracking type) can be determined using the screening questions defined in API 581,
e.g. this screening could be implemented into the on-line monitoring software code itself.
Increasing of the susceptibility to internal cracking is an indicator that the probability of structural failure has been increased.
This is a damage mechanism related KPI at equipment level.
To which system it appeals to
Static equipment and piping.
Name of indicator Increasing/emerging external cracking susceptibility factor – for
static equipment and piping
KPI classification
Leading KPI X Organizational
Action
Other
Lagging KPI
Frequency based X Consequence based
Mixed
based
Local indicators X
Global indicators
Definition

SafeLife-X
page 159
ERRA Key Performance Indicators (KPIs)
Increasing of the average external cracking sensitivity calculated for last investigated period
compared to the external crack sensitivity calculated at last RBI analysis.
Formula (e.g., mortality rate / 1000*hour work)
ΔS = Saverage-SRef where:
SRef - sensitivity calculated at last RBI analysis (1: low, 2: middle, 3: high) (API 581)
Saverage – calculated average sensitivity for the tested period (T)
T – last investigated period in days (default value is 180 days, but it can depend on the stability
of the process parameters. If the process parameters (temperature, pressure, fluid composition,
etc.) are relatively stable, this period can be longer. If the process parameters may change relatively often (for example: frequent stock change) this period can be shorter. In each case it
must be assessed individually.
Comment
The susceptibility to external cracking calculation is based on the API 581.
Increasing of the susceptibility to external cracking is an indicator that the probability of
structural failure has been increased.
This is a damage mechanism related KPI at equipment level.
To which system it appeals to
Static equipment and piping.
Name of indicator Increasing/emerging mechanical fatigue susceptibility – for piping
KPI classification
Leading KPI X Organizational
Action
Other
Lagging KPI
Frequency based X
Consequence based
Mixed based
Local indicators X
Global indicators
Definition
Susceptibility to mechanical fatigue of piping can be derived from the vibration of piping. Ration
of the increase of the vibration amplitude measured with on-line monitoring technique on piping connected to rotating equipment – to a reference level of vibration.
Formula (e.g., mortality rate / 1000*hour work)

SafeLife-X
page 160
ERRA Key Performance Indicators (KPIs)
KPI = (A-Aref)/Aref*100%
Aref – measured vibration amplitude after maintenance or replacement of connected rotating equipment under normal operating condition.
A – actual measured vibration amplitude
Comment
Increasing of the susceptibility to mechanical fatigue of piping is an indicator that the probability
of structural failure has been increased.
This is a damage mechanism related KPI at equipment level.
To which system it appeals to
Piping connecting to rotating equipment.
Name of
indicator
Increasing/emerging HTHA susceptibility factor changing – static
equipment
KPI classification
Leading KPI X Organizational
Action
Other
Lagging KPI
Frequency based X
Consequence
based
Mixed based
Local indicators X
Global indicators
Definition
Increasing of the average HTHA sensitivity calculated for the last investigated period (e.g. 6 months) compared to HTHA sensitivity calculated at last RBI analysis.
Formula (e.g., mortality rate / 1000*hour work)
ΔS = Saverage-SRef where:
SRef - sensitivity calculated at last RBI analysis (1: low, 2: medium, 3: high) (API 581)
Saverage – average HTHA sensitivity for the last investigated period (T)
T – last investigated period in days (default value is 180 days, but it can depend on the stability
of the process parameters. If the process parameters (temperature, pressure, fluid composition, etc.) are relatively stable, this period can be longer. If the process parameters may change
relatively often (for example: frequent stock change) this period can be shorter. In each case it
must be assessed individually.

SafeLife-X
page 161
ERRA Key Performance Indicators (KPIs)
Comment
Calculation of HTHA sensitivity is based on API 581.
Increasing of the susceptibility to HTHA is an indicator that the probability of structural failure has
been increased.
This is a damage mechanism related KPI at equipment level.
To which system it appeals to
Static equipment and piping.
Name of indicator Increasing/emerging brittle fracture susceptibility factor – for static equipment and piping
KPI classification
Leading KPI X Organizational
Action
Other
Lagging KPI
Frequency based X
Consequence
based
Mixed based
Local indicators X
Global indicators
Definition
Increasing of the average brittle fracture sensitivity calculated for the last investigated period (e.g. 6 months) comparing to the brittle fracture sensitivity calculated at last RBI analysis.
Formula (e.g., mortality rate / 1000*hour work)
ΔS = Saverage-SRef where:
SRef - sensitivity calculated at last RBI analysis (1: low, 2: medium, 3: high) (API 581)
Saverage – calculated average sensitivity for the last investigated period (T)
T – last investigated period in days (default value is 180 days, but it can depend on the stability of the process parameters. If the process parameters (temperature, pressure, fluid composition,
etc.) are relatively stable, this period can be longer. If the process parameters may change
relatively often (for example: frequent stock change) this period can be shorter. In each case it
must be assessed individually.
Comment
Calculation of brittle fracture susceptibility is based on the API 581.

SafeLife-X
page 162
ERRA Key Performance Indicators (KPIs)
Increasing of the susceptibility to brittle fracture is an indicator that the probability of structural
failure has been increased.
This is a damage mechanism related KPI at equipment level.
To which system it appeals to
Static equipment and piping.
Name of indicator Increasing/emerging erosion rate factor – for static equipment and
piping
KPI classification
Leading KPI X Organizational
Action
Other
Lagging KPI
Frequency based X
Consequence based
Mixed based
Local indicators X
Global indicators
Definition
Ratio of the increase of the measured erosion rate determined from on-line wall thickness
measurement in the last investigated period to the erosion rate considered in the last analysis.
Formula (e.g., mortality rate / 1000*hour work)
KPI=(RATE-RATEref)/RATEref * 100%
RATE = (V-V0)/T (mm/year)
T=investigated period (e.g. 6 months)
V – on-line measured wall thickness (end of the investigated period)
V0 – on-line measured wall thickness at the begening of the last investigated period
RATEref – erosion rate calculated at last RBI analysis
Comment
Increasing of the erosion rate is an indicator that the probability of structural failure has been
increased.
This is a damage mechanism related KPI at equipment level.
To which system it appeals to
Static equipment and piping.

SafeLife-X
page 163
ERRA Key Performance Indicators (KPIs)
Name of indicator Number of faults of rotating equipment parts
KPI classification
Leading KPI Organizational
Action
Other
Lagging KPI X
Frequency based X Consequence based
Mixed based
Local indicators X
Global indicators
Definition
Increasing of the number of error messages at different severity level which are provided by the
rotating equipment on-line diagnostic system, in the last investigated period compared to the previous period.
Formula (e.g., mortality rate / 1000*hour work)
N = N1 + 2*N2 + 3*N3 +4*N4-Nref
where:
N1 - Number of error messages related to low severity level deviation in the last month.
N2 - Number of error messages related to medium severity level deviation in the last month.
N3 - Number of error messages related to high severity level deviation in the last month.
N4 - Number of error messages at extreme severity level deviation in the last month.
Nref – total number of error messages in the previous period (e.g. previous 6 months)
Comment
The definition of parameters is based on the on-line diagnostic system used at MOL.
Increasing of number of error messages related to the different parts of rotating equipment is an
indicator that the probability of process or structural failure has been increased.
This is a functional failure related KPI at equipment level.
To which system it appeals to
Rotating equipment.
Name of indicator Increasing of the number of emergency stops of rotating equipment

SafeLife-X
page 164
ERRA Key Performance Indicators (KPIs)
KPI classification
Leading KPI Organizational
Action
Other
Lagging KPI X
Frequency based X
Consequence based
Mixed based
Local indicators X
Global indicators
Definition
Increasing of the number of emergency stops of rotating equipment in the last investigated
period compared to the previous period.
Formula (e.g., mortality rate / 1000*hour work)
where:
N1 - The number of emergency stops of rotating equipment in the last investigated period (e.g. 6
months). This number can be taken from the diagnostic system of rotating equipment.
N2 - The number of emergency stops of rotating equipment in the previous investigated period
(e.g. previous 6 months). This number can be taken from the diagnostic system of rotating
equipment.
Comment
Increasing of the number of emergency stops of rotating equipment is an indicator that the
reliability and availability of the equipment has been decreased.
This is a functional failure related KPI at equipment level.
To which system it appeals to
Rotating equipment.
Name of
indicator Increasing of the number of failed parts of rotating equipment
KPI classification
Leading KPI X Organizational
Action
Other
Lagging KPI
Frequency based X
Consequence
based
Mixed based

SafeLife-X
page 165
ERRA Key Performance Indicators (KPIs)
Local indicators X
Global indicators
Definition
Increasing of the number of rotating equipment failed parts of rotating equipment in the last
investigated period compared to the previous period.
Formula (e.g., mortality rate / 1000*hour work)
where:
N1 - The number of failed parts’reports of rotating equipment in the last investigated period (e.g.
6 months). This number can be taken from the diagnostic system of rotating equipment.
N2 - The number of failed parts’reports of rotating equipment in the previous investigated period
(e.g. previous 6 months). This number can be taken from the diagnostic system of rotating
equipment.
Comment
Increasing of the number of failed parts of rotating equipment is an indicator that the reliability
and availability of the equipment has been decreased.
This is a functional failure related KPI at equipment level.
To which system it appeals to
Rotating equipment.
Name of indicator Temperature increase of rotating equipment parts
KPI classification
Leading KPI X Organizational
Action
Other
Lagging KPI
Frequency based X
Consequence based
Mixed based
Local indicators X
Global indicators
Definition
Increasing of the maximum temperature of rotating equipment determined from on-line
temperature measurement.
Formula (e.g., mortality rate / 1000*hour work)

SafeLife-X
page 166
ERRA Key Performance Indicators (KPIs)
T% = (T-Tref)/Tref*100%
Tref – reference maximum temperature measured after maintenance
T – actual maximum temperature of rotating equipment
Comment
The reason for the temperature increasing of rotating equipment could be the fault (e.g. wearing)
of any part, degradation of the lubrication system or problem with the cooling system.
The temperature increase can be an indicator that the probability of failure has been increased.
This is a functional failure related KPI at equipment level.
To which system it appeals to
Rotating equipment.
Name of indicator Operating time factor of rotating equipment
KPI classification
Leading KPI X Organizational
Action
Other
Lagging KPI
Frequency based X
Consequence
based
Mixed
based
Local indicators X
Global indicators
Definition
Time elapsed from last inspection compared to the average time between failure of the rotating
equipment.
Formula (e.g., mortality rate / 1000*hour work)
KPI= Time elapsed from last inspection/Average time between failure*100%
Comment
The probability of failure of rotating equipment may increase with the time elapsed from the last
inspection.
This is a functional failure related KPI at equipment level.
To which system it appeals to
Rotating equipment.

SafeLife-X
page 167
ERRA Key Performance Indicators (KPIs)
Name of indicator Decreasing of the average mean time to instrument repair (between
failures)
KPI classification
Leading KPI Organizational
Action
Other
Lagging KPI X
Frequency based X Consequence based
Mixed
based
Local indicators
Global indicators X
Definition
Ratio of the average mean time to instrument repair in the last period compared to the average mean time to instruments repair in the previous period.
Formula (e.g., mortality rate / 1000*hour work)
KPI= average mean time to instruments repair in the last year/ average mean time to instruments repair in the previous year*100%
Comment
Decreasing of the average mean time between instrument failures is an indicator that the
reliability of operation has been decreased and the probability of instrument failure has been increased.
This is a functional failure related KPI at equipment level.
To which system it appeals to
Instruments.
Name of indicator Failure level of remote controlled valves
KPI classification
Leading
KPI Organizational
Action
Other

SafeLife-X
page 168
ERRA Key Performance Indicators (KPIs)
Lagging
KPI
X
Frequency based X Consequence based
Mixed
based
Local
indicators
X
Global indicators
Definition
Fingerprint curve deviation compared to the reference curve.
Formula (e.g., mortality rate / 1000*hour work)
Percentage average deviation (D) between the fingerprint curve recorded after inspection and the
actual curve recorded at functional test.
Comment
This curve is recorded by the Advanced Maintenance Monitoring system at MOL for remote control
valve.
Increasing of the deviation of the fingerprint curve from the reference one is an indicator that the probability of failure of remote controlled valves has been increased.
This is a functional failure related KPI at equipment level.
To which system it appeals to
Remote controlled valves.
Name of indicator
Increasing of consequence category for static equipment or piping failure based on API581 analyses
KPI classification
Leading
KPI
X
Organizational
Action
Other
Lagging
KPI
Frequency based
Consequence based
X
Mixed
based
Local
indicators
X
Global indicators
Definition
Increasing of the consequence category of static equipment or piping based on RBI analysis, e.g.
API RBI or RIMAP CEN WA.
Formula (e.g., mortality rate / 1000*hour work)

SafeLife-X
page 169
ERRA Key Performance Indicators (KPIs)
ΔCoF=CoFaverage-CoFref where:
CoFref: calculated consequence of static equipment or piping failure at last RBI analysis (1-5).
CoFaverage: calculated average consequence of static equipment or piping failure for the last
investigated period
T – last investigated period in days (default value is 180 days, but it can depend on the stability of the process parameters. If the process parameters (temperature, pressure, fluid composition,
etc.) are relatively stable, this period can be longer. If the process parameters may change
relatively often (for example: frequent stock change) this period can be shorter. In each case it
must be assessed individually.
Comment
Increasing of the consequence category of a potential failure is an indicator that the risk level has
been increased.
Consequence of failure related KPI - at equipment level.
To which system it appeals to
Static equipment and piping.
Name of indicator
Increasing of consequence of static equipment or piping failure based on criticality analysis
KPI classification
Leading
KPI X Organizational
Action
Other
Lagging
KPI
Frequency based Consequence based
X
Mixed
based
Local
indicators
X
Global indicators
Definition
Increasing of the consequence score for static equipment determined with criticality analysis.
Formula (e.g., mortality rate / 1000*hour work)
ΔCoF=CoFactual-CoFref
where:
CoFref: consequence score of static equipment failure at last criticality analysis (1-5).

SafeLife-X
page 170
ERRA Key Performance Indicators (KPIs)
CoFactual: actual consequence score determined with criticality analyses of static equipment or
piping
Comment
Criticality analysis can be based on specific qualitative method at a company.
Increasing of the consequence category of a potential failure is an indicator that the risk level has
been increased.
Consequence of failure related KPI - at equipment level.
To which system it appeals to
Static equipment and piping.
Name of
indicator
Increasing of consequence category of static equipment or piping failure
based on risk based organisational work assessment
KPI classification
Leading KPI
X Organizational
Action
Other
Lagging
KPI
Frequency based Consequence based
X
Mixed
based
Local
indicators
X
Global indicators
Definition
Increasing of the consequence category of static equipment or piping failure determined during
risk based organizational of work assessment.
Formula (e.g., mortality rate / 1000*hour work)
ΔCoF=CoFactual-CoFref where:
CoFref: minimum consequence category of static equipment or piping failure during the last investigated period (T)
CoFactual: actual consequence category of static equipment or piping failure determined during the
last analysis.
T – last investigated period in days (default value is 180 days, but it can depend on the stability of the process parameters. If the process parameters (temperature, pressure, fluid composition,
etc.) are relatively stable, this period can be longer. If the process parameters may change
relatively often (for example: frequent stock change) this period can be shorter. In each case it must be assessed individually.
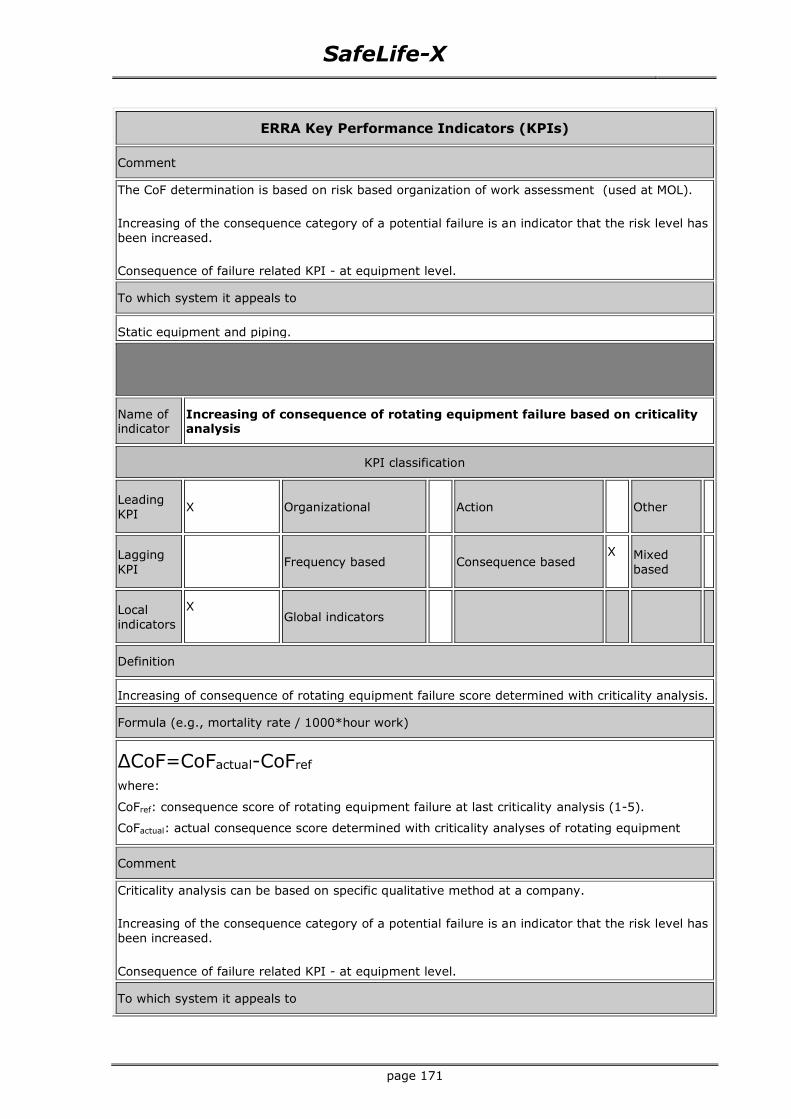
SafeLife-X
page 171
ERRA Key Performance Indicators (KPIs)
Comment
The CoF determination is based on risk based organization of work assessment (used at MOL).
Increasing of the consequence category of a potential failure is an indicator that the risk level has
been increased.
Consequence of failure related KPI - at equipment level.
To which system it appeals to
Static equipment and piping.
Name of indicator
Increasing of consequence of rotating equipment failure based on criticality analysis
KPI classification
Leading
KPI X Organizational
Action
Other
Lagging
KPI
Frequency based Consequence based
X
Mixed
based
Local
indicators
X
Global indicators
Definition
Increasing of consequence of rotating equipment failure score determined with criticality analysis.
Formula (e.g., mortality rate / 1000*hour work)
ΔCoF=CoFactual-CoFref where:
CoFref: consequence score of rotating equipment failure at last criticality analysis (1-5).
CoFactual: actual consequence score determined with criticality analyses of rotating equipment
Comment
Criticality analysis can be based on specific qualitative method at a company.
Increasing of the consequence category of a potential failure is an indicator that the risk level has
been increased.
Consequence of failure related KPI - at equipment level.
To which system it appeals to
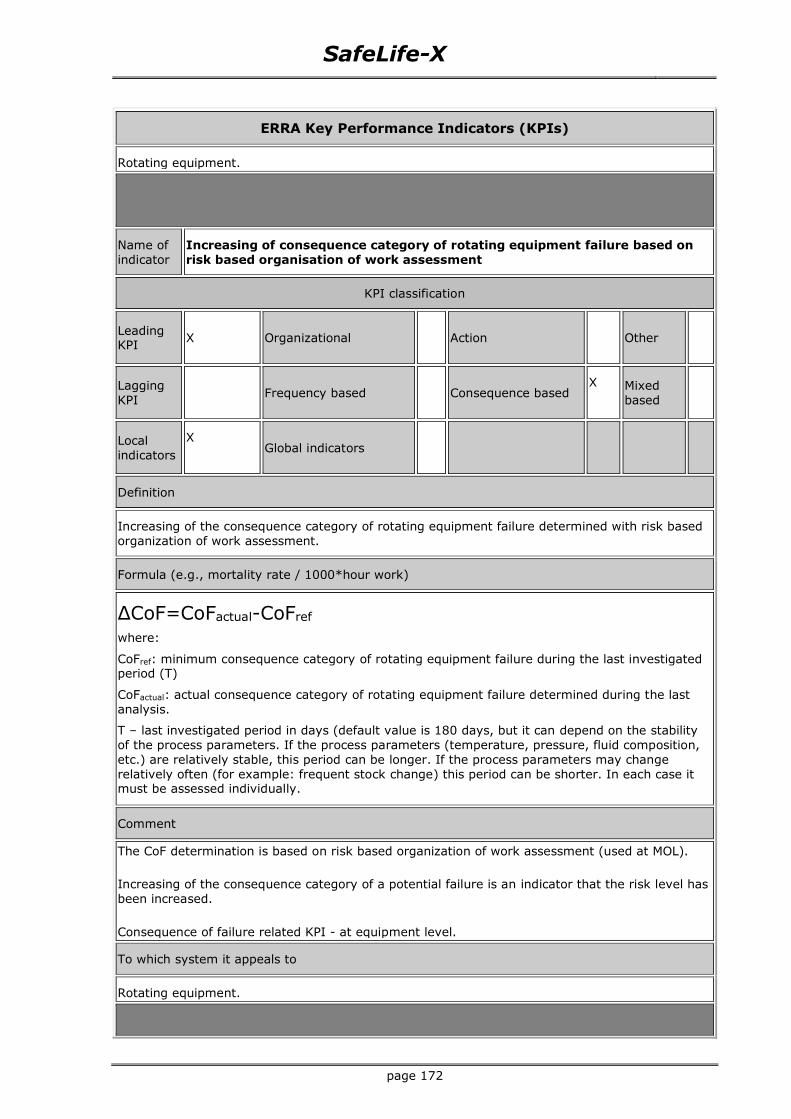
SafeLife-X
page 172
ERRA Key Performance Indicators (KPIs)
Rotating equipment.
Name of
indicator
Increasing of consequence category of rotating equipment failure based on
risk based organisation of work assessment
KPI classification
Leading KPI
X Organizational
Action
Other
Lagging
KPI
Frequency based Consequence based
X
Mixed
based
Local
indicators
X
Global indicators
Definition
Increasing of the consequence category of rotating equipment failure determined with risk based
organization of work assessment.
Formula (e.g., mortality rate / 1000*hour work)
ΔCoF=CoFactual-CoFref where:
CoFref: minimum consequence category of rotating equipment failure during the last investigated period (T)
CoFactual: actual consequence category of rotating equipment failure determined during the last
analysis.
T – last investigated period in days (default value is 180 days, but it can depend on the stability
of the process parameters. If the process parameters (temperature, pressure, fluid composition,
etc.) are relatively stable, this period can be longer. If the process parameters may change
relatively often (for example: frequent stock change) this period can be shorter. In each case it must be assessed individually.
Comment
The CoF determination is based on risk based organization of work assessment (used at MOL).
Increasing of the consequence category of a potential failure is an indicator that the risk level has
been increased.
Consequence of failure related KPI - at equipment level.
To which system it appeals to
Rotating equipment.

SafeLife-X
page 173
ERRA Key Performance Indicators (KPIs)
Name of indicator
Increasing of consequence of instrument failure based on criticality analysis
KPI classification
Leading
KPI X Organizational
Action
Other
Lagging
KPI
Frequency based Consequence based
X
Mixed
based
Local
indicators
X
Global indicators
Definition
Increasing of consequence of instrument failure depends of the connected equipment consequence of failure. This can be estimated from the criticality analysis of the equipment.
Formula (e.g., mortality rate / 1000*hour work)
ΔCoF=CoFactual-CoFref where:
CoFref: consequence score of instrument failure at last criticality analysis (1-5).
CoFactual: actual consequence score determined with criticality analyses of instrument
Comment
Criticality analysis can be based on specific qualitative method at a company.
Increasing of the consequence category of a potential failure is an indicator that the risk level has
been increased.
Consequence of failure related KPI-- at equipment level.,
To which system it appeals to
Instruments.
Name of
indicator
Increasing of consequence category for instrument failure based on risk
based organisation of work assessment
KPI classification
Leading KPI
X Organizational
Action
Other

SafeLife-X
page 174
ERRA Key Performance Indicators (KPIs)
Lagging
KPI
Frequency based Consequence based
X
Mixed
based
Local
indicators
X
Global indicators
Definition
Increasing of consequence of instrument failure depends of the connected equipment
consequence of failure. This can be estimated from the risk-based organization of work of the equipment.
Formula (e.g., mortality rate / 1000*hour work)
ΔCoF=CoFactual-CoFRef where:
CoFref: minimum consequence category of instrument failure during the last investigated period
(T)
CoFactual: actual consequence category of instrument failure determined during the last analysis.
T – last investigated period in days (default value is 180 days, but it can depend on the stability
of the process parameters. If the process parameters (temperature, pressure, fluid composition,
etc.) are relatively stable, this period can be longer. If the process parameters may change
relatively often (for example: frequent stock change) this period can be shorter. In each case it must be assessed individually.
Comment
The CoF determination is based on risk based organization of work assessment (used at MOL).
Increasing of the consequence category of a potential failure is an indicator that the risk level has
been increased.
Consequence of failure related KPI - at equipment level.
To which system it appeals to
Instruments.
Related Documents