1 Glu-C – an orthogonal and alternative enzyme for protein quantitation by LC-MS/MS Szabolcs Szarka, Senior Scientist Drug Development Services, LGC Science for a safer world EBF, 17 th November 2016

Welcome message from author
This document is posted to help you gain knowledge. Please leave a comment to let me know what you think about it! Share it to your friends and learn new things together.
Transcript

1
Glu-C – an orthogonal and alternative enzyme for protein quantitation by LC-MS/MSSzabolcs Szarka, Senior ScientistDrug Development Services, LGC
Sciencefor a safer world
EBF, 17th November 2016
2
LC-MS/MS for protein quantification
• Pros– Highly selective (metabolites, degradation products)– Improved accuracy– Multiplexing (simultaneous analysis of multiple proteins)
• Technique– Targeted “bottom-up” " sensitivity and specificity– Proteins are digested " analysis at peptide level
(signature peptide approach)– Trypsin – most commonly used

Glu-C
• Glutamyl endopeptidase• Bacterial Ser-protease (Staphylococcus aureus)• Cleaves after Glu and Asp• Favors Glu at pH8 in ammonium buffer• Product are peptides with acidic C-terminal " orthogonal
to trypsin• Price comparable to trypsin• Patented generic tryptic signature peptides (2014 March:
US, 2016 February: EU)
3

Model analyte – bispecific IgG1
• Bispecific mAbs– Different Fab regions " different
specificity " complex activity– Highly specific and complex
functions and mechanism of action
– Less adverse side effects– Complex structure– Increasing interest on bispecific
mAbs
4
0
20
40
60
80
100
1980 1990 2000 2010 2020
Num
ber o
f pub
licat
ions
Searched for “bispecific antibodies” on ScienceDirect (abstract/title)

Method Development Workflow
• In silico digestion
• Peptide mapping (HRAM-MS)
• Surrogate peptide selection
• Sample preparation and LC-MS/MS optimization
5
Selection of the appropriate digestive enzymeInitial BLAST screen
Signature peptide identification
Goal
• To set up a generic mAb quantitation method in pre-clinical matrices using Glu-C digestion
• Requirements:– Simple sample preparation– LLOQ of 1 µg/mL using 10 µL sample
6

Instrumentation
• Peptide mapping– Waters Synapt G2 Q-TOF– MSE acquisition
• Quantitation– Waters Xevo TQ-S– Waters Acquity UPLC– LC separation: Acquity HSS
T3 column (100 x 2.1 mm, 1.7 µm particles)
7
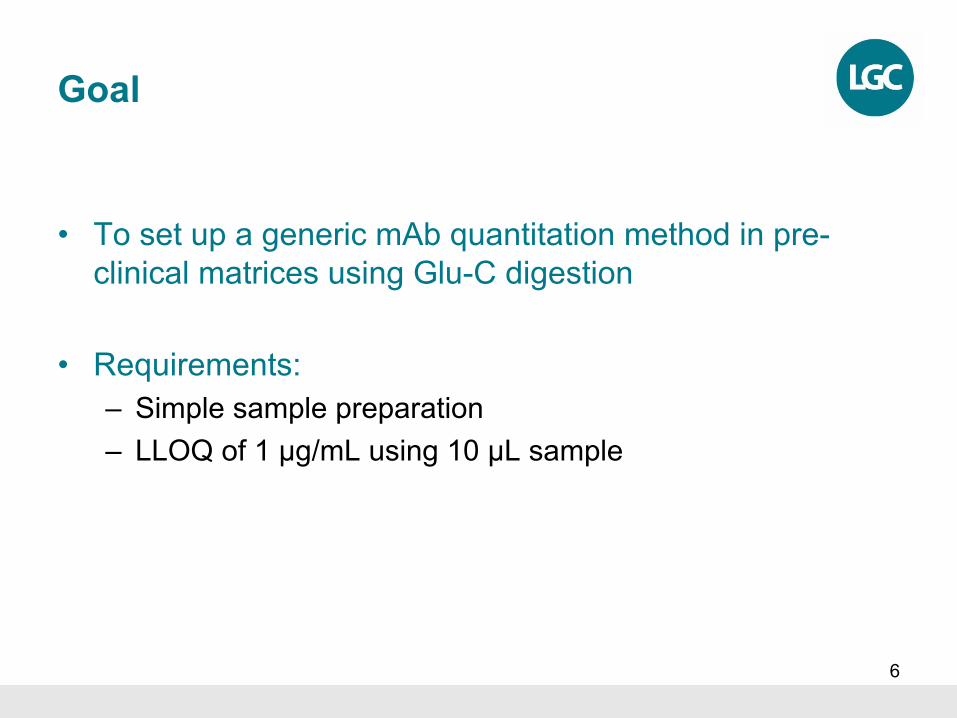
Peptide mapping
8
LLGGVKFNYKCK
• Generic signature peptides– Peptides from the heavy chain constant domain– Few are unique to human– Those that are – are not highly sensitive
not present in rodentsbut present in monkey

• Generic signature peptides– What about monkey? " Light chains come in handy– Two light chain classes: λ and κ " different constant region
Peptide mapping
9
TTTP (λ)AKVQ (κ)
LQAN (λ)
VTHQ (κ)
QDSK (κ)One assay set up for one generic signature peptide from each class

Digestion optimization
• Denaturing reagent
10
• Digestion conditionsLLGG normalised peak area
Enzyme conc.
(µg/mL)
Digestion time
2 h overnight0.3 0.50 313.0 17 9330 34 100
• Optimal conditions– overnight digestion with 3.0 µg/mL Glu-C – 6 M guanidine
*Richard Kay (2015, November). Developing LC-MS/MS methods for quantifying mAbs: Transitioning from pre-clinical to clinical matrices. Presented at EBF8th Open Meeting, Barcelona
• Sample preparation– pellet digestion*
53
100
0.10
20
40
60
80
100
3 M Guanidine 6 M Guanidine 6 M Guanidine and 20% acetonitrile
Nor
mal
ised
peak
are
a (%
)
min0.20 0.40 0.60 0.80 1.00 1.20 1.40 1.60 1.80 2.00 2.20 2.40 2.60 2.80 3.00 3.20 3.40 3.60 3.80 4.00 4.20 4.40
%
0
100
MRM of 2 channels,ES+686.1 > 839.1
160216-IgG1-PandA-rat-003 Smooth(Mn,2x3)IgG1 S1 Rat
3.966e+0051.46
1.66
2.28
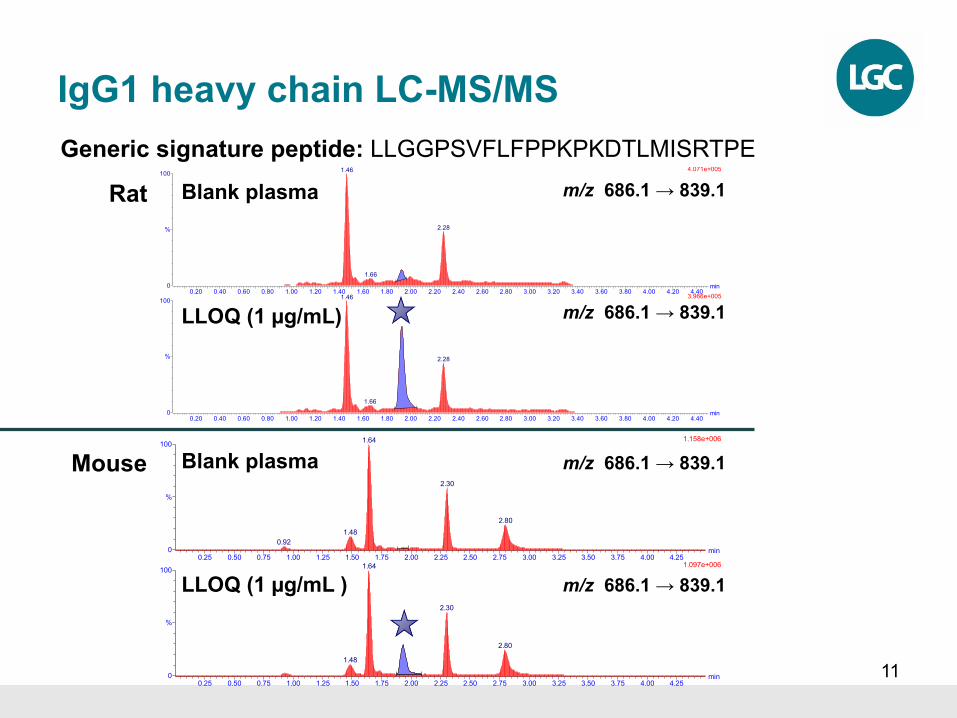
IgG1 heavy chain LC-MS/MS
11
min0.25 0.50 0.75 1.00 1.25 1.50 1.75 2.00 2.25 2.50 2.75 3.00 3.25 3.50 3.75 4.00 4.25
%
0
100
MRM of 2 channels,ES+686.1 > 839.1
160216-IgG1-PandA-rmouse-038 Smooth(Mn,2x3)IgG1 Blank Mouse
1.158e+0061.64
1.480.92
2.30
2.80
min0.25 0.50 0.75 1.00 1.25 1.50 1.75 2.00 2.25 2.50 2.75 3.00 3.25 3.50 3.75 4.00 4.25
%
0
100
MRM of 2 channels,ES+686.1 > 839.1
160216-IgG1-PandA-rmouse-039 Smooth(Mn,2x3)IgG1 S1 Mouse
1.097e+0061.64
1.48
2.30
2.80
Mouse
LLOQ (1 µg/mL )
Generic signature peptide: LLGGPSVFLFPPKPKDTLMISRTPE
min0.20 0.40 0.60 0.80 1.00 1.20 1.40 1.60 1.80 2.00 2.20 2.40 2.60 2.80 3.00 3.20 3.40 3.60 3.80 4.00 4.20 4.40
%
0
100
MRM of 2 channels,ES+686.1 > 839.1
160216-IgG1-PandA-rat-002 Smooth(Mn,2x3)IgG1 Blank Rat
4.071e+0051.46
2.28
1.66
Rat
LLOQ (1 µg/mL)
m/z 686.1 → 839.1
m/z 686.1 → 839.1
m/z 686.1 → 839.1
m/z 686.1 → 839.1
Blank plasma
Blank plasma

Compound name: IgG1 LLGGCorrelation coefficient: r = 0.997250, r 2̂ = 0.994507Calibration curve: 13129.7 * x + 1448.46Response type: External Std, AreaCurve type: Linear, Origin: Exclude, Weighting: 1/x 2̂, Axis trans: None
Conc-0 20 40 60 80 100 120 140 160 180 200 220 240 260 280 300 320 340 360 380 400 420 440 460 480 500
Res
pons
e
-0
2000000
4000000
6000001
IgG1 heavy chain LC-MS/MS precision and accuracy
12
RatCompound name: IgG1 LLGGCorrelation coefficient: r = 0.998248, r 2̂ = 0.996500Calibration curve: 16254.9 * x + 2172.87Response type: External Std, AreaCurve type: Linear, Origin: Exclude, Weighting: 1/x 2̂, Axis trans: None
Conc-0 20 40 60 80 100 120 140 160 180 200 220 240 260 280 300 320 340 360 380 400 420 440 460 480 500
Res
pons
e
-0
2000000
4000000
6000001
IgG1 heavy chain peptide in mouseQC level Conc.
(µg/mL)Mean
(µg/mL)%CV %RE
LLOQ 1 0.9 3.2 -4.9
Low 3 2.7 6.7 -8.2
Medium 40 40.5 3.3 1.2
High 400 398.0 3.2 -0.5
IgG1 heavy chain peptide in ratQC level Conc.
(µg/mL)Mean
(µg/mL)%CV %RE
LLOQ 1 1.0 4.2 -2.1
Low 3 2.9 3.4 -5.1
Medium 40 38.8 7.0 -3.0
High 400 364.6 6.7 -8.9
Mouse

min0.25 0.50 0.75 1.00 1.25 1.50 1.75 2.00 2.25 2.50 2.75 3.00 3.25 3.50 3.75 4.00 4.25
%
0
100
MRM of 4 channels,ES+668.3 > 928.5
160319-CynoPandA-0042 Smooth(Mn,1x1)S1
1.838e+0043.13
2.562.452.34IgG1 Kappa1.672.26
2.742.91
3.393.33
3.24 3.50
IgG1 light chain LC-MS/MS
13
Generic light chain signature peptides in monkey serum
Blank serum
LLOQ (1 µg/mL)
min0.25 0.50 0.75 1.00 1.25 1.50 1.75 2.00 2.25 2.50 2.75 3.00 3.25 3.50 3.75 4.00 4.25
%
0
100
MRM of 4 channels,ES+668.3 > 928.5
160319-CynoPandA-0041 Smooth(Mn,1x1)B
1.919e+0043.13
2.451.67 2.352.29
2.56
2.74 2.98
3.403.333.47
LLOQ (1 µg/mL)
λ: TTTPSKQSNNKYAASSYLSLTPE
Κ: AKVQWKVDNALQSGNSQE
m/z 668.3 → 928.5
m/z 668.3 → 928.5
m/z 830.4 → 1123.0
m/z 830.4 → 1123.0
Blank serum

14
IgG1 light chain LC-MS/MS precision and accuracy
IgG1 light chain λ peptide in monkeyQC level Conc.
(µg/mL)Mean
(µg/mL)%CV %RE
LLOQ 1 1.00 10.9 0.0
Low 3 2.78 4.8 -7.2
Medium 40 37.63 1.7 -5.9
High 400 385.93 3.9 -3.5
Compound name: IgG1 LambdaCorrelation coefficient: r = 0.999045, r 2̂ = 0.998092Calibration curve: 202.723 * x + -14.7536Response type: External Std, AreaCurve type: Linear, Origin: Exclude, Weighting: 1/x 2̂, Axis trans: None
ug/mL-0 20 40 60 80 100 120 140 160 180 200 220 240 260 280 300 320 340 360 380 400 420 440 460 480 500
Res
pons
e
-0
25000
50000
75000
IgG1 light chain κ peptide in monkeyQC level Conc.
(µg/mL)Mean
(µg/mL)%CV %RE
LLOQ 1 0.93 14.6 -6.7
Low 3 3.18 17.1 6.1
Medium 40 40.43 4.5 1.1
High 400 408.75 3.6 2.2
Compound name: IgG1 KappaCorrelation coefficient: r = 0.992673, r 2̂ = 0.985399Calibration curve: 49.5946 * x + 1.43749Response type: External Std, AreaCurve type: Linear, Origin: Exclude, Weighting: 1/x 2̂, Axis trans: None
ug/mL-0 20 40 60 80 100 120 140 160 180 200 220 240 260 280 300 320 340 360 380 400 420 440 460 480 500
Res
pons
e
-0
10000
20000κ
λ

Conclusions
• Glu-C digestion provides an efficient alternative means for quantification of biopharmaceuticals in biological samples– Two assays have been developed
1. Heavy chain generic peptide " rodents2. Two light chain generic peptides (κ and λ) " monkey samples
– Satisfactory assay performance, even with no IS– Sensitivity (LLOQ) is comparable to a trypsin digestion approach– Work around current patent
• in the pipeline– Cross validation against ligand binding assay data
Acknowledgements
16
Colleagues at LGC• Kjetil Hansen*• Mark Hows• Richard Kay@
Novimmune• Emilie Escoffier• Robert Nelson
*present affiliation: King’s College London@present affiliation: Cambridge University

17
Thank you
Szabolcs Szarka, Senior ScientistDrug Development Services, LGC
Sciencefor a safer world
Related Documents