N°. 528005-LLP-1-2012-1-GR-COMENIUS- CMP - TRANSIt TRANSIt - TRANSversal key competences for lifelong learning: TraIning teachers in competency based education D2.1 “Needs Analysis Report” Project: N°. 528005-LLP-1-2012-1-GR-COMENIUS-CMP - TRANSIt Work package: User Needs Analysis and State of the art Lead Participant: NHL Authors: Wouter Vollenbroek, Sjoerd de Vries, Nico van Loo, Katerina Riviou Document Type: Document Distribution: Public Status: Final Document file: TRANSIt_WP2_NeedsAnalysisReport_V1.0_30Aug2013_NHL Version: 1.0 Date: 30 August 2013 Number of pages: 119

Welcome message from author
This document is posted to help you gain knowledge. Please leave a comment to let me know what you think about it! Share it to your friends and learn new things together.
Transcript

N°. 528005-LLP-1-2012-1-GR-COMENIUS-
CMP - TRANSIt
TRANSIt - TRANSversal key competences for lifelong
learning: TraIning teachers in competency based
education
D2.1 “Needs Analysis Report”
Project: N°. 528005-LLP-1-2012-1-GR-COMENIUS-CMP - TRANSIt
Work package: User Needs Analysis and State of the art
Lead Participant: NHL
Authors: Wouter Vollenbroek, Sjoerd de Vries, Nico van Loo, Katerina
Riviou
Document Type: Document
Distribution: Public
Status: Final
Document file: TRANSIt_WP2_NeedsAnalysisReport_V1.0_30Aug2013_NHL
Version: 1.0
Date: 30 August 2013
Number of pages: 119

N°. 528005-LLP-1-2012-1-GR-COMENIUS-CMP - TRANSIt
D2.1 Needs Analysis Report 2/119

N°. 528005-LLP-1-2012-1-GR-COMENIUS-CMP - TRANSIt
D2.1 Needs Analysis Report 3/119
0.1 About this document
This document concerns the needs analysis of educational stakeholders in Europe with regard to
competence based learning and teaching. The report will serve as a basis for the training framework
developed in WP3.
0.2 Version
Version Date / Contributor Summary of Changes
0.1 Wouter Vollenbroek First draft version
0.2 Partners Feedback
0.3 Wouter Vollenbroek First version
0.4 Partners Input from partners
1.0 Wouter Vollenbroek, Sjoerd de Vries,
Nico van Loo, Katerina Riviou Final version

N°. 528005-LLP-1-2012-1-GR-COMENIUS-CMP - TRANSIt
D2.1 Needs Analysis Report 4/119
0.3 Table of Contents
0.1 About this document .............................................................................................................................................. 3 0.2 Version .................................................................................................................................................................. 3 0.3 Table of Contents................................................................................................................................................... 4 0.4 List of Figures ........................................................................................................................................................ 6 Executive Summary .......................................................................................................................................................... 12 1 Introduction .............................................................................................................................................................. 13
1.1 Scope ............................................................................................................................................................... 13 1.2 Audience ......................................................................................................................................................... 13 1.3 Definition ........................................................................................................................................................ 13 1.4 Structure .......................................................................................................................................................... 13
2 TRANSIt: User Needs Analysis Goals and Methodology ........................................................................................ 15 2.1 Questionnaire .................................................................................................................................................. 15 2.2 Delphi-study .................................................................................................................................................... 16 2.3 Workshops ...................................................................................................................................................... 17 2.4 SWOT-analysis ............................................................................................................................................... 18
3 Description of Target Groups and Potential Participants in TRANSIt Project Research and Training Activities .... 19 4 Report on the Questionnaire Results ......................................................................................................................... 21
4.1 Greece ............................................................................................................................................................. 21 4.1.1 User profile ................................................................................................................................................. 21 4.1.2 Current implementation of didactic and assessment of key competences .................................................. 22 4.1.3 Training needs............................................................................................................................................. 28 4.1.4 Availability to participate in the project...................................................................................................... 31
4.2 The Netherlands .............................................................................................................................................. 33 4.2.1 User profile ................................................................................................................................................. 33 4.2.2 Current implementation of didactic and assessment of key competencies ................................................. 33 4.2.3 Training needs............................................................................................................................................. 39 4.2.4 Availability to participate in the project...................................................................................................... 42
4.3 Ireland ............................................................................................................................................................. 43 4.3.1 User profile ................................................................................................................................................. 43 4.3.2 Current implementation of didactic and assessment of key competencies ................................................. 44 4.3.3 Training needs............................................................................................................................................. 50 4.3.4 Availability to participate in the project...................................................................................................... 53
4.4 Spain................................................................................................................................................................ 54 4.4.1 User profile ................................................................................................................................................. 54 4.4.2 Current implementation of didactic and assessment of key competencies ................................................. 55 4.4.3 Training needs............................................................................................................................................. 61 4.4.4 Availability to participate in the project...................................................................................................... 63
4.5 France .............................................................................................................................................................. 64 4.5.1 User profile ................................................................................................................................................. 64 4.5.2 Current implementation of didactic and assessment of key competencies ................................................. 64 4.5.3 Training needs............................................................................................................................................. 70 4.5.4 Availability to participate in the project...................................................................................................... 73
4.6 Austria ............................................................................................................................................................. 74 4.6.1 User profile ................................................................................................................................................. 74 4.6.2 Current implementation of didactic and assessment of key competencies ................................................. 75 4.6.3 Training needs............................................................................................................................................. 81 4.6.4 Availability to participate in the project...................................................................................................... 83
4.7 Summary ......................................................................................................................................................... 85 4.7.1 User profile ................................................................................................................................................. 86 4.7.2 Current implementation of didactic and assessment of key competencies ................................................. 86 4.7.3 Training needs............................................................................................................................................. 92 4.7.4 Availability to participate in the project...................................................................................................... 94
5 Report on the Workshops conducted ........................................................................................................................ 96 5.1 Spain................................................................................................................................................................ 96 5.2 Austria ............................................................................................................................................................. 97
6 Report on the Delphi-study results ......................................................................................................................... 101 6.1 The Netherlands ............................................................................................................................................ 101

N°. 528005-LLP-1-2012-1-GR-COMENIUS-CMP - TRANSIt
D2.1 Needs Analysis Report 5/119
6.2 Austria ........................................................................................................................................................... 101 7 SWOT analysis ....................................................................................................................................................... 102 8 Conclusions/Contributions to the TRANSIt Training Framework ......................................................................... 103
8.1 Findings from the needs analysis survey ....................................................................................................... 103 8.2 Conclusions ................................................................................................................................................... 104
9 References .............................................................................................................................................................. 106 Annex A: Questionnaire Form ........................................................................................................................................ 107 Annex B: Delphi Study questions ................................................................................................................................... 115 Annex C: Delphi Interviews conducted .......................................................................................................................... 116

N°. 528005-LLP-1-2012-1-GR-COMENIUS-CMP - TRANSIt
D2.1 Needs Analysis Report 6/119
0.4 List of Figures
Fig. 1 User Needs Operating Framework ......................................................................................................................... 15
Fig. 2 Age distribution of Greek respondents ................................................................................................................... 21
Fig. 3 Distribution of the answers to the question 2.2 of Greek participants .................................................................... 22
Fig. 4 Distribution of the answers to the question 2.3 of Greek participants .................................................................... 23
Fig. 5: Distribution of the answers to the question 2.4 of Greek participants ................................................................... 24
Fig. 6: Distribution of the answers to the question 2.6 of Greek participants ................................................................... 24
Fig. 7: Distribution of the answers to the question 2.7 of Greek participants ................................................................... 25
Fig. 8: Distribution of the answers to the question 2.8 of Greek participants ................................................................... 25
Fig. 9: Distribution of the answers to the question 2.9 of Greek participants ................................................................... 26
Fig. 10: Distribution of the answers to the question 2.10 of Greek participants ............................................................... 26
Fig. 11. Distribution of the answers to the question 2.11 of Greek participants ............................................................... 27
Fig. 12: Distribution of the answers to the question 2.12 of Greek participants ............................................................... 27
Fig. 13: Distribution of the answers to the question 3.1 of Greek participants ................................................................. 28
Fig. 14: Distribution of the answers to the question 3.2 of Greek participants ................................................................. 29
Fig. 15: Distribution of the answers to the question 3.3 of Greek participants ................................................................. 29
Fig. 16: Distribution of the answers to the question 3.4 of Greek participants ................................................................. 30
Fig. 17: Distribution of the answers to the question 5.1 of Greek participants ................................................................. 31
Fig. 18: Distribution of the answers to the question 5.2 of Greek participants ................................................................. 31
Fig. 19: Distribution of the answers to the question 5.3 of Greek participants ................................................................. 32
Fig. 20: Distribution of the answers to the question 5.4 of Greek participants ................................................................. 32
Fig. 21: Age distribution of Dutch respondents. ............................................................................................................... 33
Fig. 22: Distribution of the answers to the question 2.1 of Dutch participants ................................................................. 34
Fig. 23: Distribution of the answers to the question 2.3 of Dutch participants ................................................................. 34
Fig. 24: Distribution of the answers to the question 2.4 of Dutch participants ................................................................. 35
Fig. 25: Distribution of the answers to the question 2.6 of Dutch participants ................................................................. 35
Fig. 26: Distribution of the answers to the question 2.7 of Dutch participants ................................................................. 36
Fig. 27: Distribution of the answers to the question 2.8 of Dutch participants ................................................................. 36
Fig. 28: Distribution of the answers to the question 2.9 of Dutch participants ................................................................. 37
N°. 528005-LLP-1-2012-1-GR-COMENIUS-CMP - TRANSIt
D2.1 Needs Analysis Report 7/119
Fig. 29: Distribution of the answers to the question 2.10 of Dutch participants ............................................................... 37
Fig. 30: Distribution of the answers to the question 2.11 of Dutch participants ............................................................... 38
Fig. 31: Distribution of the answers to the question 2.12 of Dutch participants ............................................................... 38
Fig. 32: Distribution of the answers to the question 3.1 of Dutch participants ................................................................. 39
Fig. 33: Distribution of the answers to the question 3.2 of Dutch participants ................................................................. 40
Fig. 34: Distribution of the answers to the question 3.3 of Dutch participants ................................................................. 40
Fig. 35: Distribution of the answers to the question 3.4 of Dutch participants ................................................................. 41
Fig. 36: Distribution of the answers to the question 5.1 of Dutch participants ................................................................. 42
Fig. 37: Distribution of the answers to the question 5.2 of Dutch participants ................................................................. 42
Fig. 38: Distribution of the answers to the question 5.3 of Dutch participants ................................................................. 43
Fig. 39: Distribution of the answers to the question 5.4 of Dutch participants ................................................................. 43
Fig. 40: Age distribution of respondents ........................................................................................................................... 44
Fig. 41: Distribution of the answers to the question 2.1 of Irish participants ................................................................... 44
Fig. 42: Distribution of the answers to the question 2.3 of Irish participants ................................................................... 45
Fig. 43: Distribution of the answers to the question 2.4 of Irish participants ................................................................... 46
Fig. 44: Distribution of the answers to the question 2.6 of Irish participants ................................................................... 46
Fig. 45: Distribution of the answers to the question 2.7 of Irish participants ................................................................... 47
Fig. 46: Distribution of the answers to the question 2.8 of Irish participants ................................................................... 47
Fig. 47: Distribution of the answers to the question 2.9 of Irish participants ................................................................... 48
Fig. 48: Distribution of the answers to the question 2.10 of Irish participants ................................................................. 48
Fig. 49: Distribution of the answers to the question 2.11 of Irish participants ................................................................. 49
Fig. 50: Distribution of the answers to the question 2.12 of Irish participants ................................................................. 49
Fig. 51: Distribution of the answers to the question 3.1 of Irish participants ................................................................... 50
Fig. 52: Distribution of the answers to the question 3.2 of Irish participants ................................................................... 51
Fig. 53: Distribution of the answers to the question 3.3 of Irish participants ................................................................... 51
Fig. 54: Distribution of the answers to the question 3.4 of Irish participants ................................................................... 52
Fig. 55: Distribution of the answers to the question 5.1 of Irish participants ................................................................... 53
Fig. 56: Distribution of the answers to the question 5.2 of Irish participants ................................................................... 53
Fig. 57: Distribution of the answers to the question 5.3 of Irish participants ................................................................... 54
Fig. 58: Distribution of the answers to the question 5.4 of Irish participants ................................................................... 54

N°. 528005-LLP-1-2012-1-GR-COMENIUS-CMP - TRANSIt
D2.1 Needs Analysis Report 8/119
Fig. 59: Age distribution of the Spanish respondents ....................................................................................................... 55
Fig. 60: Distribution of the answers to the question 2.1 of Spanish participants .............................................................. 55
Fig. 61: Distribution of the answers to the question 2.3 of Spanish participants .............................................................. 56
Fig. 62: Distribution of the answers to the question 2.4 of Spanish participants .............................................................. 57
Fig. 63: Distribution of the answers to the question 2.6 of Spanish participants .............................................................. 57
Fig. 64: Distribution of the answers to the question 2.7 of Spanish participants .............................................................. 58
Fig. 65: Distribution of the answers to the question 2.8 of Spanish participants .............................................................. 58
Fig. 66: Distribution of the answers to the question 2.9 of Spanish participants .............................................................. 59
Fig. 67: Distribution of the answers to the question 2.10 of Spanish participants ............................................................ 59
Fig. 68: Distribution of the answers to the question 2.11 of Spanish participants ............................................................ 60
Fig. 70: Distribution of the answers to the question 3.1 of Spanish participants .............................................................. 61
Fig. 71: Distribution of the answers to the question 3.2 of Spanish participants .............................................................. 61
Fig. 72: Distribution of the answers to the question 3.3 of Spanish participants .............................................................. 62
Fig. 73: Distribution of the answers to the question 3.4 of Spanish participants .............................................................. 62
Fig. 74: Distribution of the answers to the question 5.1 of Spanish participants .............................................................. 63
Fig. 74: Age distribution of the French respondents. ........................................................................................................ 64
Fig. 75: Distribution of the answers to the question 2.1 of French participants ............................................................... 65
Fig. 80: Distribution of the answers to the question 2.3 of French participants ............................................................... 65
Fig. 81: Distribution of the answers to the question 2.4 of French participants ............................................................... 66
Fig. 82: Distribution of the answers to the question 2.6 of French participants ............................................................... 66
Fig. 83: Distribution of the answers to the question 2.7 of French participants ............................................................... 67
Fig. 84: Distribution of the answers to the question 2.8 of French participants ............................................................... 67
Fig. 85: Distribution of the answers to the question 2.9 of French participants ............................................................... 68
Fig. 86: Distribution of the answers to the question 2.10 of French participants.............................................................. 68
Fig. 87: Distribution of the answers to the question 2.11 of French participants.............................................................. 69
Fig. 88: Distribution of the answers to the question 2.12 of French participants.............................................................. 69
Fig. 89: Distribution of the answers to the question 3.1 of French participants ............................................................... 70
Fig. 90: Distribution of the answers to the question 3.2 of French participants ............................................................... 71
Fig. 91: Distribution of the answers to the question 3.3 of French participants ............................................................... 71
Fig. 92: Distribution of the answers to the question 3.4 of French participants ............................................................... 72
N°. 528005-LLP-1-2012-1-GR-COMENIUS-CMP - TRANSIt
D2.1 Needs Analysis Report 9/119
Fig. 93: Distribution of the answers to the question 5.1 of French participants ............................................................... 73
Fig. 94: Distribution of the answers to the question 5.2 of French participants ............................................................... 73
Fig. 95: Distribution of the answers to the question 5.3 of French participants ............................................................... 74
Fig. 96: Distribution of the answers to the question 5.4 of French participants ............................................................... 74
Fig. 97: Age distribution of the Austrian participants....................................................................................................... 75
Fig. 98: Distribution of the answers to the question 2.1 of Austrian participants ............................................................. 75
Fig. 99: Distribution of the answers to the question 2.3 of Austrian participants ............................................................. 76
Fig. 100: Distribution of the answers to the question 2.4 of Austrian participants ........................................................... 77
Fig. 101: Distribution of the answers to the question 2.6 of Austrian participants ........................................................... 77
Fig. 102: Distribution of the answers to the question 2.7 of Austrian participants ........................................................... 78
Fig. 103: Distribution of the answers to the question 2.8 of Austrian participants ........................................................... 78
Fig. 104: Distribution of the answers to the question 2.9 of Austrian participants ........................................................... 79
Fig. 105: Distribution of the answers to the question 2.10 of Austrian participants ......................................................... 79
Fig. 106: Distribution of the answers to the question 2.11 of Austrian participants ......................................................... 80
Fig. 107: Distribution of the answers to the question 2.12 of Austrian participants ......................................................... 80
Fig. 108: Distribution of the answers to the question 3.1 of Austrian participants ........................................................... 81
Fig. 109: Distribution of the answers to the question 3.2 of Austrian participants ........................................................... 82
Fig. 110: Distribution of the answers to the question 3.3 of Austrian participants ........................................................... 82
Fig. 111: Distribution of the answers to the question 4.4 of Austrian participants ........................................................... 83
Fig. 112: Distribution of the answers to the question 5.1 of Austrian participants ........................................................... 84
Fig. 113: Distribution of the answers to the question 5.2 of Austrian participants ........................................................... 84
Fig. 114: Distribution of the answers to the question 5.3 of Austrian participants ........................................................... 85
Fig. 115: Distribution of the answers to the question 5.4 of Austrian participants ........................................................... 85
Fig. 116: Age distribution (all participants) ...................................................................................................................... 86
Fig. 117: Distribution of the answers to the question 2.1 (all participants) ...................................................................... 86
Fig. 118: Distribution of the answers to the question 2.3 (all participants) ...................................................................... 87
Fig. 119: Distribution of the answers to the question 2.4 (all participants) ...................................................................... 88
Fig. 120: Distribution of the answers to the question 2.6 (all participants) ...................................................................... 88
Fig. 121: Distribution of the answers to the question 2.7 (all participants) ...................................................................... 89
Fig. 122: Distribution of the answers to the question 2.8 (all participants) ...................................................................... 89

N°. 528005-LLP-1-2012-1-GR-COMENIUS-CMP - TRANSIt
D2.1 Needs Analysis Report 10/119
Fig. 123: Distribution of the answers to the question 2.9 (all participants) ...................................................................... 90
Fig. 124: Distribution of the answers to the question 2.10 (all participants) .................................................................... 90
Fig. 125: Distribution of the answers to the question 2.11 (all participants) .................................................................... 91
Fig. 126: Distribution of the answers to the question 2.12 (all participants) .................................................................... 91
Fig. 127: Distribution of the answers to the question 3.1 (all participants) ...................................................................... 92
Fig. 128: Distribution of the answers to the question 3.2 (all participants) ...................................................................... 92
Fig. 129: Distribution of the answers to the question 3.3 (all participants) ...................................................................... 93
Fig. 130: Distribution of the answers to the question 3.4 (all participants) ...................................................................... 93
Fig. 131: Distribution of the answers to the question 5.1 (all participants) ...................................................................... 94
Fig. 132: Distribution of the answers to the question 5.2 (all participants) ...................................................................... 94
Fig. 133: Distribution of the answers to the question 5.3 (all participants) ...................................................................... 95
Fig. 134: Distribution of the answers to the question 5.4 (all participants) ...................................................................... 95
Fig. 135: SWOT analysis ................................................................................................................................................ 102

N°. 528005-LLP-1-2012-1-GR-COMENIUS-CMP - TRANSIt
D2.1 Needs Analysis Report 11/119
0.5 List of Tables
Table 1: Users’ training requirements per country ......................................................................................................... 104

N°. 528005-LLP-1-2012-1-GR-COMENIUS-CMP - TRANSIt
D2.1 Needs Analysis Report 12/119
Executive Summary
This document shows the results of a needs analysis regarding competence based learning and
teaching. Within the six (6) countries of the consortium (Greece, The Netherlands, Ireland, Spain,
France and Austria), Delphi-studies, a survey and a SWOT analysis have been conducted. The aim
of this survey was to identify, classify and analyse the needs of European educational staff
regarding competence based teaching. Within the needs analysis we identify user training needs
in terms of educational theories, models and frameworks, ICT tools and other learning design
processes that may prove useful to teachers. The results of this survey will be used for the
development of the TRANSIt training framework to improve teachers’ capacity on competence
oriented education.
In the online survey 1.078 respondents participated, the majority of them had a Greek background.
The results show that teachers are generally open and positive towards teaching in a competence
based way. The only problem is the lack of knowledge and ability to do so. The respondents expect
that courses and workshops can help them to expand their knowledge about how to teach in a
competence based way and how to assess the possible acquired competences. Despite the lack of
knowledge and ability, the respondents appoint themselves as experienced in teaching four of the
five transversal competences (digital competences, learning to learn, social and civic competences,
sense of initiative and entrepreneurship and cultural awareness and expression) that are included in
this study. Respondents mostly indicate that there is a lack of experience in teaching the
competence about sense of initiative and entrepreneurship. In contrast, the stimulation of student’s
cultural awareness is a structural component of education policy in the six countries. The didactics
and teaching methods that were used in the different countries are mostly discussion and debating
and the sub-group activities, while the story line and interviewing experts, peers or others were used
seldom. A striking result from the survey is the fact that respondents see themselves as enthusiastic
in the use of ICT for educational purposes, but that they rarely use the existing ICT-tools for
teaching and assessment purposes. The use of the traditional methods still dominates the
educational landscape.
The results show that there is a high need for training in themes applied throughout competences,
i.e. critical thinking, problem solving, decision taking etc. Beside that they need more training in
teaching methods fostering competence based learning, like project based learning, action based
learning etc. They also have a high need for training in the assessment of competencies. They have
insufficient knowledge and skills in the specific tools for assessing competencies and the different
approaches and objectives related to competencies assessment. To fulfil these needs, it is important
to account for giving best practices in the field of competency-based curriculum.
Concluding, based on the results of the survey the training framework has to address the following
needs for teachers: (1) how to get the knowledge and abilities to practice competence based
teaching, (2) how to acquire the necessary teaching skills for competence based teaching and
required teachers’ skills in competence based teaching. In addition, there is the need to assist head
teachers when creating a work and learning environment for teachers to support them in developing
competence based teaching skills and help them to promote competence based teaching among
teaching staff. These four needs are important to add to the training framework.

N°. 528005-LLP-1-2012-1-GR-COMENIUS-CMP - TRANSIt
D2.1 Needs Analysis Report 13/119
1 Introduction
1.1 Scope
This deliverable presents the training needs of European educational stakeholders concerning the
development and implementation of competency based learning approaches.
The TRANSIt training needs report provides the basis for the training modules in WP3.
1.2 Audience
This report is addressed to all the consortium partners, the European Commission and to public in
general.
1.3 Definition
“Competence means the proven ability to use knowledge, skills and personal, social and/or
methodological abilities, in work or study situations and in professional and personal development”
(Grün, Tritscher-Archan & Weiss, 2009, p. 3). Competence based learning implies according to
Biemans et al (2005) the creation of opportunities for students and workers, close to their world of
experience in a meaningful learning environment (preferably professional practice) where the
learner can develop integrated, performance-oriented capabilities for handling the core problems in
practice.
1.4 Structure
Chapter 1: Gives an overview of this document, providing its scope, the definitions used and its
structure.
Chapter 2: Provides the methodology to identify the User Needs regarding Competence Based
learning
Chapter 3: An overview of the targeted audience of this project
Chapter 4: Report on the questionnaire results of all consortium partners
Chapter 5: Report on the Workshops conducted
Chapter 6: Report on the Delphi study results
Chapter 7: SWOT-analysis
Chapter 8: Conclusions/Contributions to the TRANSIt Training Framework
Chapter 9: References
Annex A: Questionnaire form

N°. 528005-LLP-1-2012-1-GR-COMENIUS-CMP - TRANSIt
D2.1 Needs Analysis Report 14/119
Annex B: Delphi Study questions
Annex C: Delphi Interviews conducted
N°. 528005-LLP-1-2012-1-GR-COMENIUS-CMP - TRANSIt
D2.1 Needs Analysis Report 15/119
2 TRANSIt: User Needs Analysis Goals and
Methodology
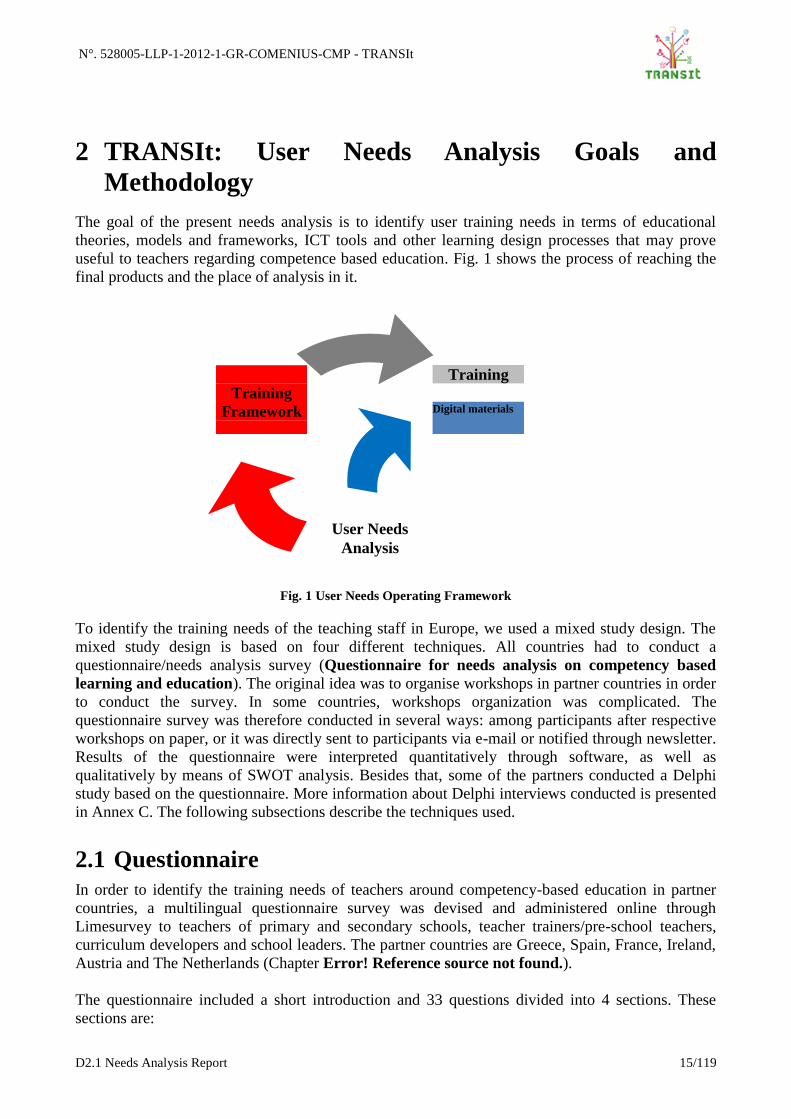
The goal of the present needs analysis is to identify user training needs in terms of educational
theories, models and frameworks, ICT tools and other learning design processes that may prove
useful to teachers regarding competence based education. Fig. 1 shows the process of reaching the
final products and the place of analysis in it.
Fig. 1 User Needs Operating Framework
To identify the training needs of the teaching staff in Europe, we used a mixed study design. The
mixed study design is based on four different techniques. All countries had to conduct a
questionnaire/needs analysis survey (Questionnaire for needs analysis on competency based
learning and education). The original idea was to organise workshops in partner countries in order
to conduct the survey. In some countries, workshops organization was complicated. The
questionnaire survey was therefore conducted in several ways: among participants after respective
workshops on paper, or it was directly sent to participants via e-mail or notified through newsletter.
Results of the questionnaire were interpreted quantitatively through software, as well as
qualitatively by means of SWOT analysis. Besides that, some of the partners conducted a Delphi
study based on the questionnaire. More information about Delphi interviews conducted is presented
in Annex C. The following subsections describe the techniques used.
2.1 Questionnaire
In order to identify the training needs of teachers around competency-based education in partner
countries, a multilingual questionnaire survey was devised and administered online through
Limesurvey to teachers of primary and secondary schools, teacher trainers/pre-school teachers,
curriculum developers and school leaders. The partner countries are Greece, Spain, France, Ireland,
Austria and The Netherlands (Chapter Error! Reference source not found.).
The questionnaire included a short introduction and 33 questions divided into 4 sections. These
sections are:
Training
Digital materials
User Needs
Analysis
Training
Framework
N°. 528005-LLP-1-2012-1-GR-COMENIUS-CMP - TRANSIt
D2.1 Needs Analysis Report 16/119
- General background information
- Current implementation of didactic and assessment of key competencies
- Training needs
- Availability to participate in the project
The average duration required to complete the questionnaire was around 20 minutes. The majority
of the questionnaire items – except for the sections about factual background information, open
questions to clarify answers and availability to participate in the project – were five-points Likert
scale questions. Data collection started in February 2013 and was planned to last until the end of the
school year (July 2013). However, during the recruitment of respondents many problems arose. One
of the main reasons for these problems was the lack of awareness in competency-based education
by the educators. Most educators did not have sufficient knowledge and experience with
competence-based teaching.
The link for the survey was disseminated and in the case of Greece was made available through the
eTwinning mailing list by the National Contact Service, CTI Diophantus. The analysis of the
project’s target groups’ questionnaires was carried out by the use of descriptive statistical analysis
(tables and graphical visualization). For the statistical analysis and the creation of the graphs SPSS
was used, as well as the functions available in the open source software LimeSurvey.
2.2 Delphi-study
A Delphi method is qualitative of nature and is a technique for gathering data that is similar to focus
groups. The main difference between a focus group and Delphi is that experts do not meet each
other physically, with the advantage of not influencing each other. Linstone and Turoff (1975, p. 3)
note "Delphi may be characterised as a method for structuring a group communication process, so
that the process is effective in allowing a group of individuals, as a whole, to deal with complex
problems". Furthermore, the goal of a Delphi method is to generate qualitative data and is
facilitating consensus among individuals who are experts into the field of expertise. Usually a
Delphi study consists of two or more rounds. The first round provides input for the second round
and in the second round experts have the opportunity to react on the input of the first round.
The goal of the Delphi study is to find consensus about:
1. What the users’ needs regarding competency based learning approaches are
2. What the training needs regarding competency based teaching approaches are.
The Delphi method has proven a popular tool in research for identifying and prioritizing issues for
managerial decision-making (Okoli & Pawlowski, 2004). In this version of the Delphi method, the
experts are answering questions in two or more rounds. According to Skulmoski et al. (2007), a
Delphi study is conducted online, by telephone, and sometimes by personal interviews. In this study
is chosen for a personal interview with teachers and student teachers, in the first round. This is
because of the complexity of the subject. In addition, it could be necessary to give additional
explanations about the questions. During this interview the experts came up with ten open
questions. The participants answered the questions in their own language. The interview takes
approximately 45 minutes to an hour. The goal of the open questions is to provide answers about
which experiences and related needs the professionals have related to competency based learning
and teaching approaches.
In the second round, the intention is to gain consensus on the various giving answers by the
participants in the first round. The questions in the second round will be held in form of closed

N°. 528005-LLP-1-2012-1-GR-COMENIUS-CMP - TRANSIt
D2.1 Needs Analysis Report 17/119
questions, the participants are able to answer the questions on different scales. By doing so, the
experts are able to revise their first answer by comparing it with other experts’ answers from the
panel. Rowe and Wright (1999) note "It is believed that during this process the range of the
answers will decrease and the group will converge towards the "correct" answer". In case of this
Delphi study it is important to find consensus in the most important training needs regarding
competency based learning and teaching approaches. If no consensus is achieved between the
experts, a third round belongs to the possibilities. In general, the Delphi study consists of seven
steps:
1. Selection of the “expert” panel.
2. The preparation of the first questionnaire for the interviews.
3. The interviews with the experts (Error! Reference source not found. open questions).
4. Compare and categorise the answers and develop the questions/statements for Round 2.
5. Distribute the questionnaire with questions/statements for the second round (Annex A:
Questionnaire Form).
6. Compare and categorize the answers and process results with the goal of reaching
consensus.
a. If there is no consensus a third round is a possibility
7. The findings and results have to apply in the descriptive model.
2.3 Workshops
To identify the training needs in a qualitative manner in some partner countries a Delphi study was
conducted and in other countries workshops were organised (Chapter 5). The structure of the
workshop was for 60% based on introducing the project and explaining its main topics, the other
part was focused on the discussion with participants and the collection of input regarding the
training needs of the users. The materials used were:
a) Common general material:
a. The objectives and approaches of the TRANSIt project and how it aims to help
teachers;
b. An introduction to basic topics and terms;
c. A short section about EU policies and initiatives that are relevant to the TRANSIt
ideas;
d. The envisaged benefits of using competence based approaches in school classroom.
b) Specialised, national material:
a. Demonstration of characteristics TRANSIt ideas at a national, regional and sectorial
level;
b. Posing the questions that the workshops aims to answer: Do teachers know about the
presented ideas, have they ever used them, what are the reasons for not using them,
what kind of training would they consider useful for this purpose, etc.
c) Questionnaires:
a. Demographics
b. Identification of training needs (in terms of how the participant feels about proposed
training forms/methods, topics, duration, and other very specific attributes that are
defined in order to get very specific feedback).

N°. 528005-LLP-1-2012-1-GR-COMENIUS-CMP - TRANSIt
D2.1 Needs Analysis Report 18/119
2.4 SWOT-analysis
The SWOT analysis is used to identify the Strengths, Weaknesses, Opportunities, and Threats
related to the needs analysis. The SWOT analysis is a direct result of the questionnaire. The results
in the questionnaire were analysed based on the strengths, weaknesses, opportunities and threats.
Setting the objective of the training framework should be done after the SWOT analysis has been
performed. This would allow achievable goals or objectives to be set for the framework. The
structure of a SWOT analysis is as follows:
Strengths: Characteristics of the project that give it an advantage over others.
Weaknesses: Characteristics that lace the team as a disadvantage over others.
Opportunities: Elements that the project could exploit to its advantage.
Threats: Elements in the environment that could cause trouble for the business or project.
The SWOT analysis may be used in any decision-making situation when a desired end-state
(objective) has been defined.

N°. 528005-LLP-1-2012-1-GR-COMENIUS-CMP - TRANSIt
D2.1 Needs Analysis Report 19/119
3 Description of Target Groups and Potential Participants
in TRANSIt Project Research and Training Activities
The network of participating teachers consists of:
Greece:
Teachers from EA.
Teachers’ communities of Open Discovery Space (ODS), LD-Skills, METASCHOOL,
OSR, and Natural Europe projects (from Greece).
Educational policy makers in Greece
Teachers’ trainers in Greece
Teacher students/Pre-service teachers in Greece
Teachers in primary and secondary education in Greece
School leaders in Greece
The Netherlands:
Teachers in primary and secondary educations in the Netherlands
Teachers’ communities of ODS (from Netherlands)
Teachers’ trainers in the Netherlands
Teachers from universities in the Netherlands
Curriculum project coordinators and developers in the Netherlands
Teachers’ trainers in the Netherlands
Ireland:
Teachers in primary and secondary education in Ireland
Teachers’ communities of ODS (from Ireland)
Curriculum project coordinators and developers in Ireland
Educational policy makers in Ireland
Teachers’ trainers in Ireland
School leaders in Ireland
Teacher student/Pre-service teacher in Ireland
France:
Teachers in primary and secondary education in Poitiers (France)
Educational policy makers in France
Teachers’ trainers in France
Austria:
Teachers in primary and secondary education in Austria
Educational policy makers in Austria
Teachers’ trainers in Austria
Spain:
Partner schools in Spain
Schools in Barcelona

N°. 528005-LLP-1-2012-1-GR-COMENIUS-CMP - TRANSIt
D2.1 Needs Analysis Report 20/119
Education professionals who belong to the telematic network of education of Catalonia, the
official college of graduates in arts and sciences network and the “Didactics, innovation and
Multimedia” network, amongst other similar educational networks.
Teachers, trainers and educational staff in touch with their public local centres of resources
Teachers who use public centres for resources in science, language or mathematics, amongst
other subjects.
Teachers’ trainers
Teachers from primary and secondary education
The conducted workshops and the number of respondents in the needs analysis show that the
interest in the project topic is large and the envisaged number of participants will increase.

N°. 528005-LLP-1-2012-1-GR-COMENIUS-CMP - TRANSIt
D2.1 Needs Analysis Report 21/119
4 Report on the Questionnaire Results
4.1 Greece
4.1.1 User profile
From the total of 648 stakeholders that participated in the online survey from Greece, 196 (30%)
were men and 452 (70%) were women with the majority in the age range of 41 to 55 years old
(57,14%). All participants were related to the field of Education. The majority of respondents are
teachers in secondary education (74,80%) and teachers in primary education (48,60%). The next
group of participants with highest representation are School leaders (11%), Teachers’ trainers
(10,40%), Pre-service Teachers with percentage of 3,60%, Curriculum developers and Educational
Policy Makers (1%), each, whereas other roles were 3,40%. Among them persons responsible for
environmental centres, responsible of counselling centres for students, career counsellors, adult
trainers or researchers/PhD candidates).
Fig. 2 Age distribution of Greek respondents
The majority of respondents have a more than 15 years’ experience in their profession (43,83%).
The qualification of respondents is Degree (50,31%), Masters (41,67%) and PhD (7,10%). Only
0,93% had just the teaching qualification. Regarding usage of ICT, the highest percentage defines
themselves to be Enthusiastic on the use of ICT (56,64%) while those claiming to have taken part in
continuing professional development (CPD) activities on the theme of competence acquisition was
(55,25%). Reviewing the descriptions provided on these training activities, there is of a wide and
varied spectrum, but mostly around technology enhanced learning. Training varies from Level 1
ICT training program- “In-Service Training of Primary and Secondary School Teachers on
Information and Communication Technology (ICT). Basic Skills in Education”, Level 2 ICT
training program - “Teachers’ Training in the Use and the Exploitation of ICT in the Educational
Teaching Process”, creative writing/thinking in class, use of Web2.0/social media tools, training for
implementing projects, creative drama activities/creativity techniques and in-service training

N°. 528005-LLP-1-2012-1-GR-COMENIUS-CMP - TRANSIt
D2.1 Needs Analysis Report 22/119
activities. In the training special needs is also mentioned, and there are respondents who feel that
the available training opportunities are not enough, especially for the regional parts of the country.
4.1.2 Current implementation of didactic and assessment of key
competences
Fig. 3 Distribution of the answers to the question 2.2 of Greek participants

N°. 528005-LLP-1-2012-1-GR-COMENIUS-CMP - TRANSIt
D2.1 Needs Analysis Report 23/119
Fig. 4 Distribution of the answers to the question 2.3 of Greek participants

N°. 528005-LLP-1-2012-1-GR-COMENIUS-CMP - TRANSIt
D2.1 Needs Analysis Report 24/119
Fig. 5: Distribution of the answers to the question 2.4 of Greek participants
Fig. 6: Distribution of the answers to the question 2.6 of Greek participants

N°. 528005-LLP-1-2012-1-GR-COMENIUS-CMP - TRANSIt
D2.1 Needs Analysis Report 25/119
Fig. 7: Distribution of the answers to the question 2.7 of Greek participants
Fig. 8: Distribution of the answers to the question 2.8 of Greek participants

N°. 528005-LLP-1-2012-1-GR-COMENIUS-CMP - TRANSIt
D2.1 Needs Analysis Report 26/119
Fig. 9: Distribution of the answers to the question 2.9 of Greek participants
Fig. 10: Distribution of the answers to the question 2.10 of Greek participants

N°. 528005-LLP-1-2012-1-GR-COMENIUS-CMP - TRANSIt
D2.1 Needs Analysis Report 27/119
Fig. 11. Distribution of the answers to the question 2.11 of Greek participants
Fig. 12: Distribution of the answers to the question 2.12 of Greek participants
Requirements: The respondents from Greece indicate that they mostly have experience with
teaching digital competencies. Almost 50% have more than three years of experience, almost 35%
indicate that they have more than 3 years of experience in teaching learning to learn and 32% have
more than 3 years of experience in teaching cultural awareness and expression. Especially
discussion and debating and (sub)group activities are important didactics and teaching methods
within the Greek education. Information searching tools and productivity tools are the two most
used technologies during the planning and implementation of competency based learning. The
majority of the respondents mentioned that they use these tools to assess student performances and
to gain (as a teacher) information about the progress in student performance. However, despite the
use of new technologies for teaching and evaluation in competency based learning, the assessment
within education is mostly based on paper and pencil tests and to a lesser extent the use of computer
assignments. The amount of knowledge and ability is according to the respondents sufficient in the
stimulation of student’s cultural awareness as a structural component of education policy. However,
the knowledge and ability about learning to learn and teaching digital competencies is only resent to

N°. 528005-LLP-1-2012-1-GR-COMENIUS-CMP - TRANSIt
D2.1 Needs Analysis Report 28/119
a limited extent. Nevertheless, CBL is usually implemented in the classroom and implemented in
specific projects. Finally, the level of support within Greek schools is insufficient for continuing
professional development. Most respondents also mentioned that there is no or insufficient
databases with learning and teaching materials.
Open question 2.2: Please briefly describe what general steps you take when you plan a cross-
curricular lesson that promotes key competency acquisition for your students.
Regarding the description of general steps that respondents take when planning a cross-curricular
lesson that promotes key competency acquisition for their students, a high percentage (71,5%)
provided answers to the open question. A common pattern was that teachers try to elicit the level of
their students and their individual interests, define in collaboration with them the subject that they
will work on, the educational aims, the students’ teams and then they assign the tasks. Teams are
guided and facilitated by the teacher and as final step results are composed, evaluated and presented
in class. A great percentage of participants refer to collaboration with colleagues for the design and
implementation of cross-curricular projects, showing its importance.
Open question 2.5: Do you experience constraints when planning competency based teaching?
If yes, please describe these constraints (e.g. constraints relating to resources, class size, time,
knowledge and experience, not a priority in my school)?
Participants spot several constraints to the systematic implementation of transversal CBL activities.
They feel their working schedule doesn’t allow for the educational innovation they would like, the
most frequent answer being time constraints. The low availability of resources such as a computer
room and a very limited flexibility to use them has also been mentioned among the biggest barriers
encountered. Other constraints are: class size, knowledge, priority, flexibility and experience.
4.1.3 Training needs
Fig. 13: Distribution of the answers to the question 3.1 of Greek participants

N°. 528005-LLP-1-2012-1-GR-COMENIUS-CMP - TRANSIt
D2.1 Needs Analysis Report 29/119
Fig. 14: Distribution of the answers to the question 3.2 of Greek participants
Fig. 15: Distribution of the answers to the question 3.3 of Greek participants

N°. 528005-LLP-1-2012-1-GR-COMENIUS-CMP - TRANSIt
D2.1 Needs Analysis Report 30/119
Fig. 16: Distribution of the answers to the question 3.4 of Greek participants
Training requirements: The results show that the participants in this survey have a high need for
themes applied throughout competencies, for example in critical thinking creativity, initiative etc.
Beside that they want to learn more about teaching methods fostering competency based learning.
In case of learning how to assess competencies, the Greek respondents want to learn more about
specific tools for assessing competencies and approaches and objectives related to the assessment.
The result of question 3.3 show that the respondents have a high need to learn more on school
curricula in relation to the characteristics of competence based curricula (features of competence
based school and learning environments). The results of question 3.4 indicate that the professional
development of teachers in Greece is on a low level, the need for professional development is high.
They want to learn how to create a work and learning environment for teachers to allow them
develop competence based teaching skills, how to promote competence based teaching among
teaching staff, how to acquire the necessary teaching skills for competence based teaching and the
required teachers’ skills in competence based teaching.
N°. 528005-LLP-1-2012-1-GR-COMENIUS-CMP - TRANSIt
D2.1 Needs Analysis Report 31/119
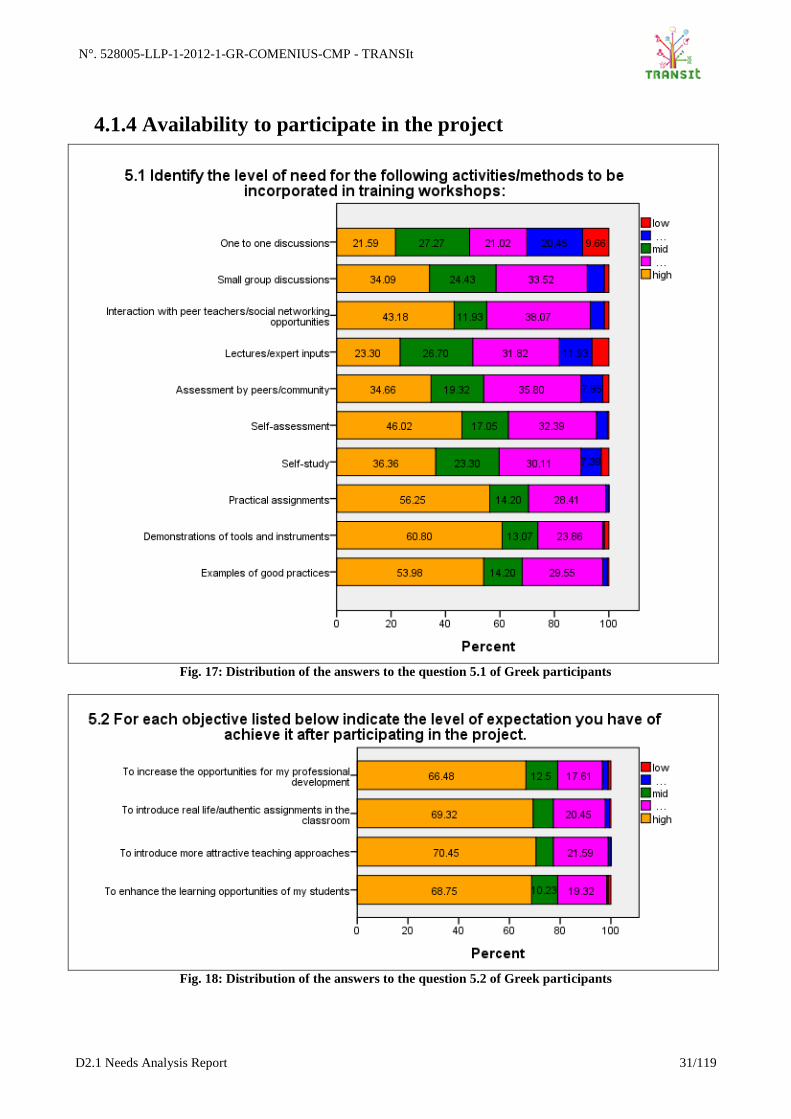
4.1.4 Availability to participate in the project
Fig. 17: Distribution of the answers to the question 5.1 of Greek participants
Fig. 18: Distribution of the answers to the question 5.2 of Greek participants
N°. 528005-LLP-1-2012-1-GR-COMENIUS-CMP - TRANSIt
D2.1 Needs Analysis Report 32/119
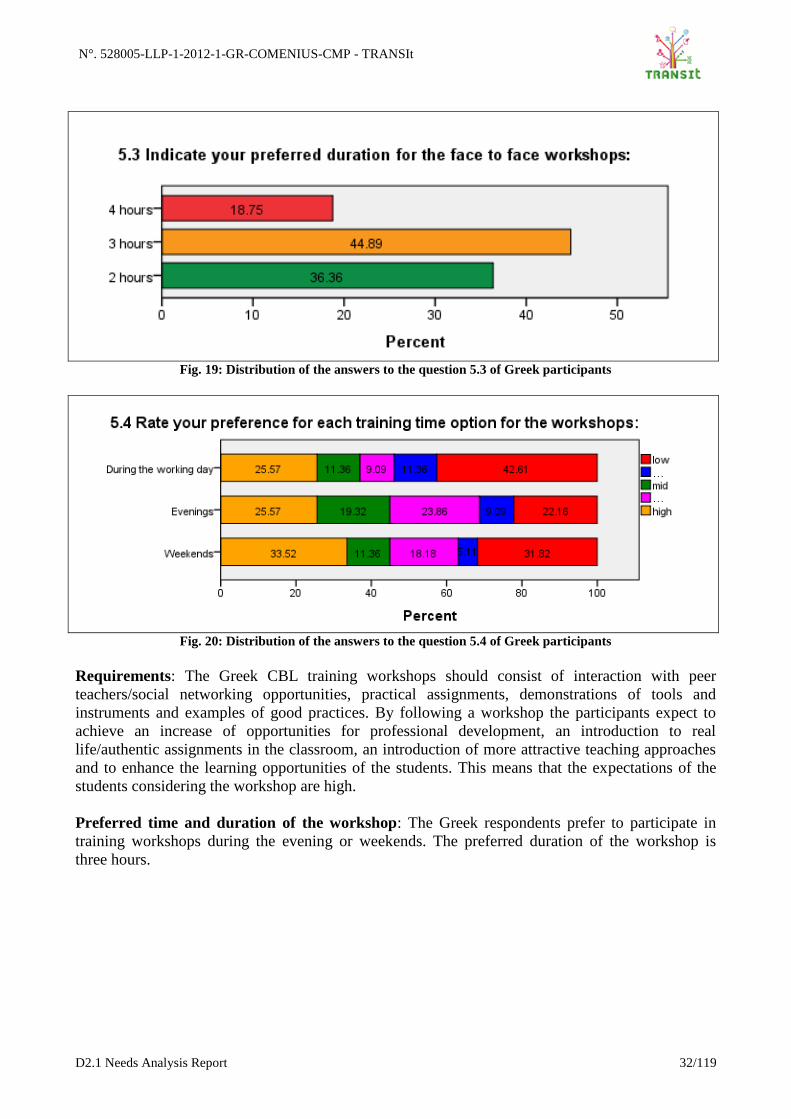
Fig. 19: Distribution of the answers to the question 5.3 of Greek participants
Fig. 20: Distribution of the answers to the question 5.4 of Greek participants
Requirements: The Greek CBL training workshops should consist of interaction with peer
teachers/social networking opportunities, practical assignments, demonstrations of tools and
instruments and examples of good practices. By following a workshop the participants expect to
achieve an increase of opportunities for professional development, an introduction to real
life/authentic assignments in the classroom, an introduction of more attractive teaching approaches
and to enhance the learning opportunities of the students. This means that the expectations of the
students considering the workshop are high.
Preferred time and duration of the workshop: The Greek respondents prefer to participate in
training workshops during the evening or weekends. The preferred duration of the workshop is
three hours.

N°. 528005-LLP-1-2012-1-GR-COMENIUS-CMP - TRANSIt
D2.1 Needs Analysis Report 33/119
4.2 The Netherlands
4.2.1 User profile
In the Netherlands 16 respondents participated in the survey research. The majority of these
respondents in the questionnaire were female (62,5%). The ages of these respondents were mostly
older than 31 (see Figure 21).
Fig. 21: Age distribution of Dutch respondents.
Most Dutch respondents have different professions within education. Some are teacher in primary
or secondary education and some are curriculum developer. The highest amount of respondents
(43,8%) has a masters’ degree, while 25 percent has a teaching qualification. 56,3 percent of these
educational staff have more than 15 years of experience within their profession. The Dutch
respondents will mainly characterize themselves as enthusiastic in the use of ICT for educational
purposes, 75% uses ICT when they can.
4.2.2 Current implementation of didactic and assessment of key
competencies
One of the main reasons the concept of competency is popular in Dutch educational settings, is the
expectation by many stakeholders that the gap between the labour market and education can be
reduced through competency-based education. In the Netherlands, teachers are not fully convinced
of their knowledge and skills to give competency-based education. However, the participants expect
that the knowledge and skills are most present in vocational and higher education and lesser within
primary and secondary education. But some participants also suspect that almost all Dutch teachers
and policy makers need additional training in giving competency-based education.
The participants use different assessment methods, both formative and summative approaches.
Some tools to assess the competencies of the students. Assignment, projects, performance
assessments, counselling interviews, (e)Portfolios.

N°. 528005-LLP-1-2012-1-GR-COMENIUS-CMP - TRANSIt
D2.1 Needs Analysis Report 34/119
Fig. 22: Distribution of the answers to the question 2.1 of Dutch participants
Fig. 23: Distribution of the answers to the question 2.3 of Dutch participants

N°. 528005-LLP-1-2012-1-GR-COMENIUS-CMP - TRANSIt
D2.1 Needs Analysis Report 35/119
Fig. 24: Distribution of the answers to the question 2.4 of Dutch participants
Fig. 25: Distribution of the answers to the question 2.6 of Dutch participants

N°. 528005-LLP-1-2012-1-GR-COMENIUS-CMP - TRANSIt
D2.1 Needs Analysis Report 36/119
Fig. 26: Distribution of the answers to the question 2.7 of Dutch participants
Fig. 27: Distribution of the answers to the question 2.8 of Dutch participants

N°. 528005-LLP-1-2012-1-GR-COMENIUS-CMP - TRANSIt
D2.1 Needs Analysis Report 37/119
Fig. 28: Distribution of the answers to the question 2.9 of Dutch participants
Fig. 29: Distribution of the answers to the question 2.10 of Dutch participants

N°. 528005-LLP-1-2012-1-GR-COMENIUS-CMP - TRANSIt
D2.1 Needs Analysis Report 38/119
Fig. 30: Distribution of the answers to the question 2.11 of Dutch participants
Fig. 31: Distribution of the answers to the question 2.12 of Dutch participants
Requirements: In general the Dutch respondents in this survey have quite a lot of experience with
teaching following a competence based approach. More than 54% have more than three years of
experience in the field of teaching social and civic competencies. In case of cultural awareness and
expression, learning to learn and digital competencies, more than 45% of the respondents indicate
that they have more than three years of teaching experience. Most of the Dutch respondents
mentioned that they have experience with problem-based learning. Half of the respondents confirm
that they use this approach more than regularly. However, some teaching methods were almost
never used, i.e. guided discovery and action learning are two methods that were rarely used. During
the planning and implementation of competence based learning three tools were used the most: 1)
information searching tools (web browsers, online databases and WebQuests), 2) productivity tools
(word processors and presentation software) and 3) basic communication tools (video-conferencing,
instant messaging and Email). Almost 64% of the Dutch respondents indicate that they use ICT
assessment tools to gain (as a teacher) information about the progress in student performance. More
than half of the participants in the survey indicate that they use these tools to assess the student

N°. 528005-LLP-1-2012-1-GR-COMENIUS-CMP - TRANSIt
D2.1 Needs Analysis Report 39/119
performance. The assessment tools/methods the respondents have used regularly are computer
assignments, peer assessment and self-assessment techniques, while the rubrics were almost never
used. The Dutch respondents have confidence in the knowledge and ability of their colleagues when
it comes to the competencies, only the competencies 'cultural awareness and expression' and
'competencies about sense of initiative and entrepreneurship' doesn’t have a high score. The
position of competence based learning and teaching in the curriculum is mainly implemented in
specific projects and is according to half of the Dutch respondents cross curricular. There is no
consensus in the quality of the in-service education. Competence oriented teaching is for example
almost never promoted among the teaching staff and the teachers’ abilities in competence based
teaching is hardly assessed. The results from question 2.12 show that only the internet access is
sufficient in the school. The level of continuing professional development and a database with
learning and teaching material is only seldom present.
Open question 2.2: Please briefly describe what general steps you take when you plan a cross-
curricular lesson that promotes key competency acquisition for your students.
There is big variation in answers to this open question. Some respondents mentioned that they try to
start planning based on the competency and enhance it with cross- curricular approach. Others start
the development of a cross curricular approach for teaching and assessing key competencies by
planning lessons where competencies are immediately tested/practiced, i.e. by role playing games to
test the social and citizen competencies, cultural awareness and expression or by doing online
workshops to teach and assess the digital competencies.
Open question 2.5: Do you experience constraints when planning competency based teaching?
If yes, please describe these constraints (e.g. constraints relating to resources, class size, time,
knowledge and experience, not a priority in my school)?
Some constraints the respondents encounter when planning competency based teaching are: class
size, time constraints and insufficient available rooms. Beside that some respondents also
mentioned some structural shortcomings like institutional frameworks and established (traditional)
systems.
4.2.3 Training needs
Fig. 32: Distribution of the answers to the question 3.1 of Dutch participants

N°. 528005-LLP-1-2012-1-GR-COMENIUS-CMP - TRANSIt
D2.1 Needs Analysis Report 40/119
Fig. 33: Distribution of the answers to the question 3.2 of Dutch participants
Fig. 34: Distribution of the answers to the question 3.3 of Dutch participants

N°. 528005-LLP-1-2012-1-GR-COMENIUS-CMP - TRANSIt
D2.1 Needs Analysis Report 41/119
Fig. 35: Distribution of the answers to the question 3.4 of Dutch participants
Training requirements: The result show that Dutch participants in the survey have a high need in
teaching methods fostering competency based learning (i.e. project based, action learning, problem
oriented learning and narrative approaches). In addition there is a substantial need for learning
theories on competency based learning and teaching (i.e. constructivism). In case of assessment
methods there is a high need for both specific tools for assessing competencies as approaches and
objectives related to competencies assessment. Half of the participants in this survey have a need to
learn more on school curricula in relation to characteristics of competence based curricula (features
of competence based school and learning environments). The need for professional development –
as asked in question 3.4 – is high for circumstances. More than 83% want to learn how they can
create a work and learning environment for teachers to allow them in developing competence based
teaching skills, the same amount of respondents also want to learn more about the required teachers’
skills in competence based teaching.

N°. 528005-LLP-1-2012-1-GR-COMENIUS-CMP - TRANSIt
D2.1 Needs Analysis Report 42/119
4.2.4 Availability to participate in the project
Fig. 36: Distribution of the answers to the question 5.1 of Dutch participants
Fig. 37: Distribution of the answers to the question 5.2 of Dutch participants

N°. 528005-LLP-1-2012-1-GR-COMENIUS-CMP - TRANSIt
D2.1 Needs Analysis Report 43/119
Fig. 38: Distribution of the answers to the question 5.3 of Dutch participants
Fig. 39: Distribution of the answers to the question 5.4 of Dutch participants
Requirements: During the workshops, the following activities/methods should be integrated:
examples of good practices workshops, practical assignments workshops and lectures/expert inputs.
There is no urgent need for one-to-one discussions in the upcoming workshops. The respondents
expect to learn how to increase the opportunities for a professional development, how to introduce
real life/authentic assignment in the classroom, how to introduce more attractive teaching
approaches and how to enhance the learning opportunities of the students.
Preferred time and duration of the workshop: The Dutch respondents prefer to participate in the
training workshops during the working day and with duration of three hours.
4.3 Ireland
4.3.1 User profile
In Ireland 17 respondents filled in the questionnaire related to competency-based learning and
training. Most of them were male and in the age of 41 and older. Half of them are teachers in
secondary education, while the other half is school leader.

N°. 528005-LLP-1-2012-1-GR-COMENIUS-CMP - TRANSIt
D2.1 Needs Analysis Report 44/119
Fig. 40: Age distribution of respondents
Most of the respondents have more than 15 years of experience within their profession. Seven of
them have a bachelor-degree and six of them a master-degree. The respondents characterize
themselves as enthusiastic users of ICT.
4.3.2 Current implementation of didactic and assessment of key
competencies
Fig. 41: Distribution of the answers to the question 2.1 of Irish participants

N°. 528005-LLP-1-2012-1-GR-COMENIUS-CMP - TRANSIt
D2.1 Needs Analysis Report 45/119
Fig. 42: Distribution of the answers to the question 2.3 of Irish participants

N°. 528005-LLP-1-2012-1-GR-COMENIUS-CMP - TRANSIt
D2.1 Needs Analysis Report 46/119
Fig. 43: Distribution of the answers to the question 2.4 of Irish participants
Fig. 44: Distribution of the answers to the question 2.6 of Irish participants

N°. 528005-LLP-1-2012-1-GR-COMENIUS-CMP - TRANSIt
D2.1 Needs Analysis Report 47/119
Fig. 45: Distribution of the answers to the question 2.7 of Irish participants
Fig. 46: Distribution of the answers to the question 2.8 of Irish participants

N°. 528005-LLP-1-2012-1-GR-COMENIUS-CMP - TRANSIt
D2.1 Needs Analysis Report 48/119
Fig. 47: Distribution of the answers to the question 2.9 of Irish participants
Fig. 48: Distribution of the answers to the question 2.10 of Irish participants

N°. 528005-LLP-1-2012-1-GR-COMENIUS-CMP - TRANSIt
D2.1 Needs Analysis Report 49/119
Fig. 49: Distribution of the answers to the question 2.11 of Irish participants
Fig. 50: Distribution of the answers to the question 2.12 of Irish participants
Requirements: The respondents in Ireland mentioned that they have a high level of experience
within teaching digital competencies (66,7%). The experience with teaching the other competencies
is a bit lower. Half of the respondents have more than five year experience with teaching the
competency ‘learning to learn’. However, within the Irish sample there is little experience with the
teaching of social and civic competencies, competencies about sense of initiative and
entrepreneurship and cultural awareness and expression. The didactics and teaching methods in
Ireland are mostly based on classroom instruction and (sub)group activities and teaching methods.
Storyline, action learning and project-based learning are also used with great frequency. The
method to interview experts, peers or others is a seldom used one. In the implementation of CBL
information searching tools and productivity tools were the most used technologies, while there is
almost no use of 3D-environments. The use of ICT assessment tools is often used to assess the
student performance, to gain information about the progress in student performance and to improve
student learning. The Irish respondent pointed computer assignments and paper and pencil
assignments as two of the most used assessment tools. Simulation, rubrics and role play are three

N°. 528005-LLP-1-2012-1-GR-COMENIUS-CMP - TRANSIt
D2.1 Needs Analysis Report 50/119
tools that are used very rarely. There is still some doubt about the knowledge and ability of the Irish
teachers on CBL. They are more confident about giving competency based teaching, especially
when it comes to stimulate student’s cultural awareness as a structural component of educational
policy. The position of CBL in the curriculum is limited mainly to the classroom and specific
projects. One of the reasons for the limited position of CBL in the curriculum can be the in-service
training; the teachers’ abilities in competence based teaching are for example almost not assessed.
The support of teachers in the preparation and implementation of competency based education is a
much more positive tendency. The level of school support when it comes to having a database with
learning and teaching material is limited to a small part of educational institutions. The internet
access and software & hardware provision is much better regulated.
Open question 2.2: Please briefly describe what general steps you take when you plan a cross-
curricular lesson that promotes key competency acquisition for your students.
The majority of Irish respondents don’t plan cross curricular lessons. Most of them only plan
subject lessons. However, some respondents mentioned that they want to create CBL: “I try to build
in the competencies in my lesson plans and project work I give using rubrics and continuous
assessment.
Open question 2.5: Do you experience constraints when planning competency based teaching?
If yes, please describe these constraints (e.g. constraints relating to resources, class size, time,
knowledge and experience, not a priority in my school)?
The constraints the participants in this survey experience are class size, lack of broadband
connectivity and lack of time. One respondent describes it as follows: “Not a priority in my school -
not part of the exam syllabus thus time constraints”.
4.3.3 Training needs
One of the major needs is for themes applied throughout competencies such as critical thinking,
creativity, initiative, problem solving, risk assessment, decision taking, and constructive
management of feelings. Big variation is noticed in answering the specific question.
Fig. 51: Distribution of the answers to the question 3.1 of Irish participants

N°. 528005-LLP-1-2012-1-GR-COMENIUS-CMP - TRANSIt
D2.1 Needs Analysis Report 51/119
Fig. 52: Distribution of the answers to the question 3.2 of Irish participants
Fig. 53: Distribution of the answers to the question 3.3 of Irish participants

N°. 528005-LLP-1-2012-1-GR-COMENIUS-CMP - TRANSIt
D2.1 Needs Analysis Report 52/119
Fig. 54: Distribution of the answers to the question 3.4 of Irish participants
Training requirements: The Irish respondents mentioned the themes applied throughout
competencies, like critical thinking, creativity, initiative, problem solving, risk assessment, decision
taking, and constructive management of feelings as the key training need to improve competency
based teaching. Beside that they want to learn more about teaching methods fostering competency
based learning and the societal and anthropological views underlying the concept of competency
based learning. In case of the assessment of competencies, the respondents point specific tools for
assessing competencies and approaches and objectives related to competencies assessment as the
most important needs. The need to learn more on school curricula in relation to characteristics of
competency based curricula (features of competence based school and learning environments) is
quite high in Ireland. A lot of respondents (more than 72%) have a need for more education in
school curricula. The level of need for professional development of teachers is especially high when
it comes to the creation of a work and learning environment for teachers to allow them in
developing competence based skills. Besides that they have a high need for more guidelines in how
to promote competence based teaching among teaching staff.

N°. 528005-LLP-1-2012-1-GR-COMENIUS-CMP - TRANSIt
D2.1 Needs Analysis Report 53/119
4.3.4 Availability to participate in the project
Fig. 55: Distribution of the answers to the question 5.1 of Irish participants
Fig. 56: Distribution of the answers to the question 5.2 of Irish participants

N°. 528005-LLP-1-2012-1-GR-COMENIUS-CMP - TRANSIt
D2.1 Needs Analysis Report 54/119
Fig. 57: Distribution of the answers to the question 5.3 of Irish participants
Fig. 58: Distribution of the answers to the question 5.4 of Irish participants
Requirements: The Irish respondents prefer to have the following activities/methods incorporated
in the upcoming training workshops: lectures/expert inputs, demonstrations of tools and instruments
and examples of good practices. The respondents only have no need for self-study, as a method for
the workshops. The participants in the online survey expect that they enhance the learning
opportunities of the students, when they participate in the upcoming CBL-workshops. Beside that
they also expect to achieve the objective to introduce real life/authentic assignments in the
classroom, to increase the opportunities of the professional development and to introduce more
attractive teaching approaches.
The preferred time and duration of the workshop in Ireland is in the evening, with a maximum
duration of approximately two hours.
4.4 Spain
4.4.1 User profile
The sample size in Spain was 32. The majority of these participants were female and in the age
range of 41 to 55 years old (57,14%). The other half of age range were spread across the remaining
categories (see figure 1).

N°. 528005-LLP-1-2012-1-GR-COMENIUS-CMP - TRANSIt
D2.1 Needs Analysis Report 55/119
Fig. 59: Age distribution of the Spanish respondents
All participants were related to the field of Education. 19 participants devoted their activities to
students from Primary education and 5 to Secondary education. Regarding their profession, 15
participants were teachers. The second group of participants with a highest representation, i.e. 5
participants, was pre-service teachers. Most participants report more than 15 years of experience in
their profession, but only 2 of them have taken training in competency-based education.
4.4.2 Current implementation of didactic and assessment of key
competencies
Fig. 60: Distribution of the answers to the question 2.1 of Spanish participants

N°. 528005-LLP-1-2012-1-GR-COMENIUS-CMP - TRANSIt
D2.1 Needs Analysis Report 56/119
Fig. 61: Distribution of the answers to the question 2.3 of Spanish participants

N°. 528005-LLP-1-2012-1-GR-COMENIUS-CMP - TRANSIt
D2.1 Needs Analysis Report 57/119
Fig. 62: Distribution of the answers to the question 2.4 of Spanish participants
Fig. 63: Distribution of the answers to the question 2.6 of Spanish participants
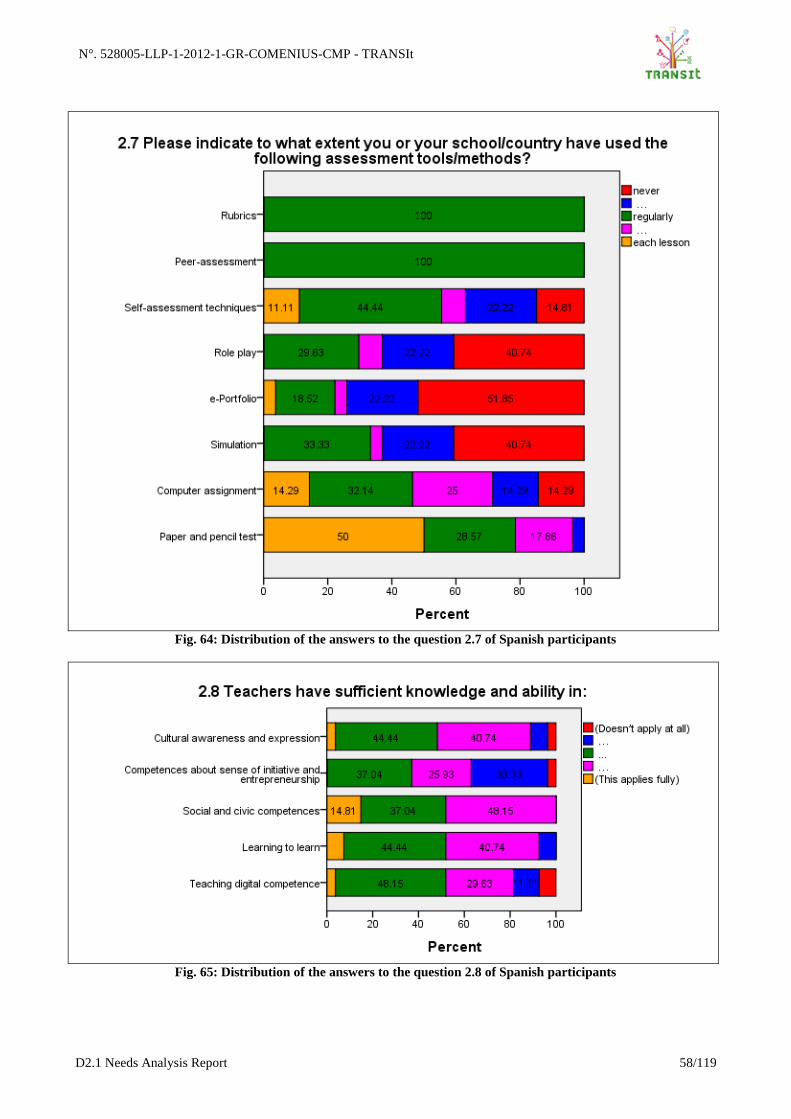
N°. 528005-LLP-1-2012-1-GR-COMENIUS-CMP - TRANSIt
D2.1 Needs Analysis Report 58/119
Fig. 64: Distribution of the answers to the question 2.7 of Spanish participants
Fig. 65: Distribution of the answers to the question 2.8 of Spanish participants

N°. 528005-LLP-1-2012-1-GR-COMENIUS-CMP - TRANSIt
D2.1 Needs Analysis Report 59/119
Fig. 66: Distribution of the answers to the question 2.9 of Spanish participants
Fig. 67: Distribution of the answers to the question 2.10 of Spanish participants

N°. 528005-LLP-1-2012-1-GR-COMENIUS-CMP - TRANSIt
D2.1 Needs Analysis Report 60/119
Fig. 68: Distribution of the answers to the question 2.11 of Spanish participants
Requirements: The Spanish respondents in the survey indicate that they have pretty much
experience in teaching the competences. A quarter of them indicate that they have more than three
years of experience in teaching social and civic competences and digital competences. The
experience in teaching competences about sense of initiative and entrepreneurship remains
somewhat behind. Almost 48% of the teachers use (sub)group activities to teach the competences
and almost 35% makes use of the traditional classroom instructions. Striking result of the survey is
that Spanish teachers almost never use e-portfolios when planning and implementing competence
based learning. Nevertheless, the Spanish teachers make extensive use of ICT tools for assessment
purposes in order to assess student performance or gain information about the progress in student
performance. However, the most used assessment tool is a traditional one: paper and pencil tests. As
said e-Portfolio, role play and simulation are used very rarely. But the respondents have still the
feeling that they have sufficient knowledge and ability in the different competences. Only
competences about sense of initiative and entrepreneurship is thereby somewhat behind.
Competence based learning and teaching has a central position in the curriculum of the Spanish
education. More than three quarters of respondents said that the learning environment of the school
is suitable for competence oriented learning, approximately the same amount of respondents said
that CBL is implemented in specific projects, that CBL is usually implemented in the classroom and
that CBL is cross curricular. However, the in-service training of teachers can be better. Almost all
respondents mentioned that teachers’ abilities in competence based learning are not assessed and
the majority of respondents also said that teachers do not support each other in the preparation and
implementation of competence-based education.
Open questions: There is an insufficient amount of answers to the open question 2.2 to formulate a
general answer to this question. However, some constraints the participants encounter are: time
constraints, insufficient flexibility to adapt the curriculum, lack of resources (Wifi, hard- and
software), and insufficient knowledge and experience of teaching staff.

N°. 528005-LLP-1-2012-1-GR-COMENIUS-CMP - TRANSIt
D2.1 Needs Analysis Report 61/119
4.4.3 Training needs
Fig. 69: Distribution of the answers to the question 3.1 of Spanish participants
Fig. 70: Distribution of the answers to the question 3.2 of Spanish participants

N°. 528005-LLP-1-2012-1-GR-COMENIUS-CMP - TRANSIt
D2.1 Needs Analysis Report 62/119
Fig. 71: Distribution of the answers to the question 3.3 of Spanish participants
Fig. 72: Distribution of the answers to the question 3.4 of Spanish participants
Training requirements: Respondents were asked to grade their training needs on various topics,
covering underpinnings and specificities of transversal key competencies, competency-based
didactics and assessment and teacher professional development, among others. Data on training
needs is consistent with the current implementation of competency-based didactics and assessment.
The most important need of the respondents is to learn more about themes applied throughout
competences (e.g. critical thinking, creativity, initiative, etc.). But beside that there is also a need to
learn more on teaching methods fostering competence based learning (e.g. project based, action
learning, etc.) and finally there is also a high need to learn more about specific tools for assessing
competences and approaches and objectives related to competences assessment.
The answers to question 3.4 indicates that the respondents have a need for professional
development in relation to the creation of work- and learning environments to allow them to
develop competence based teaching skills and to guidelines how to promote competence based
teaching among teaching staff. The respondents also want to learn more about how to acquire the
necessary teaching skills for competence based teaching.
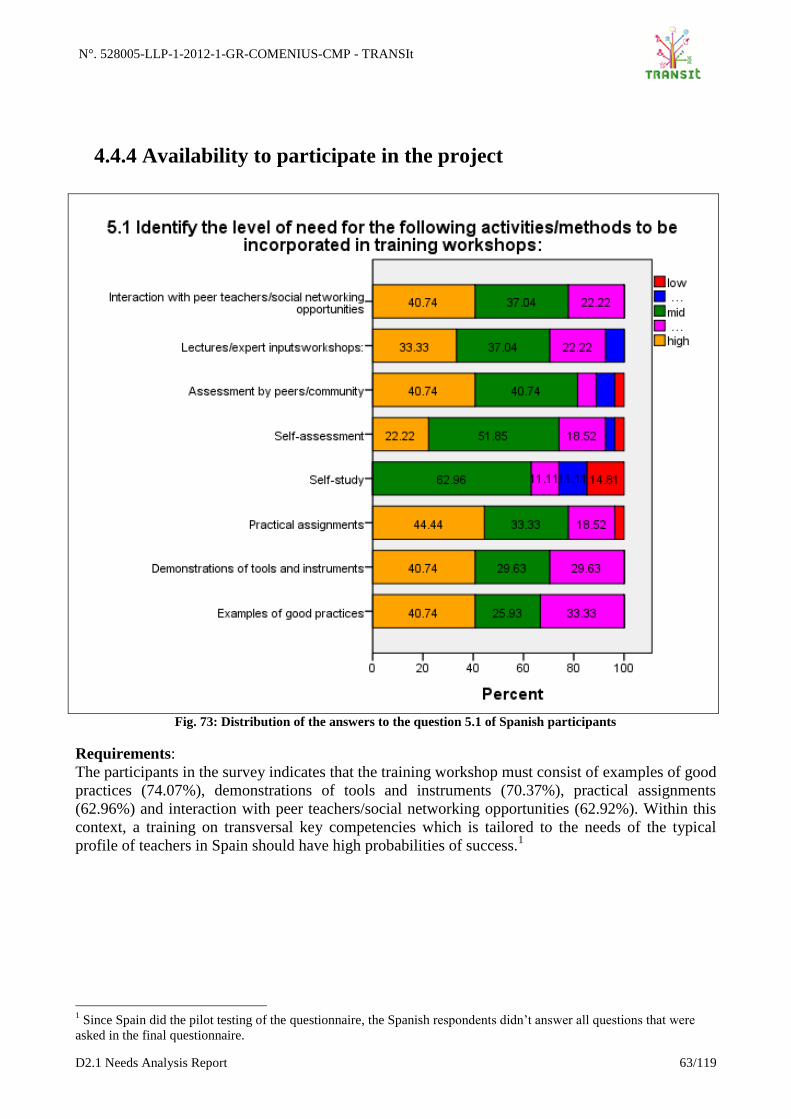
N°. 528005-LLP-1-2012-1-GR-COMENIUS-CMP - TRANSIt
D2.1 Needs Analysis Report 63/119
4.4.4 Availability to participate in the project
Fig. 73: Distribution of the answers to the question 5.1 of Spanish participants
Requirements:
The participants in the survey indicates that the training workshop must consist of examples of good
practices (74.07%), demonstrations of tools and instruments (70.37%), practical assignments
(62.96%) and interaction with peer teachers/social networking opportunities (62.92%). Within this
context, a training on transversal key competencies which is tailored to the needs of the typical
profile of teachers in Spain should have high probabilities of success.1
1 Since Spain did the pilot testing of the questionnaire, the Spanish respondents didn’t answer all questions that were
asked in the final questionnaire.

N°. 528005-LLP-1-2012-1-GR-COMENIUS-CMP - TRANSIt
D2.1 Needs Analysis Report 64/119
4.5 France
4.5.1 User profile
The sample-size in France was 28 respondents. The major part of these respondents are male
(85,7%). The largest part of the respondents felt in the age range of 41 till 55.
Fig. 74: Age distribution of the French respondents.
Most respondents from France have their profession in secondary education (57,1%) or are teacher
trainer (21,4%). 60,7% of them have more than fifteen years of experience in their profession and
currently holds a master’s degree. The respondents describe themselves as enthusiastic with ICT.
They are benevolent to make maximum advantage of the available ICT-application within the
educational institution.
4.5.2 Current implementation of didactic and assessment of key
competencies

N°. 528005-LLP-1-2012-1-GR-COMENIUS-CMP - TRANSIt
D2.1 Needs Analysis Report 65/119
Fig. 75: Distribution of the answers to the question 2.1 of French participants
Fig. 76: Distribution of the answers to the question 2.3 of French participants

N°. 528005-LLP-1-2012-1-GR-COMENIUS-CMP - TRANSIt
D2.1 Needs Analysis Report 66/119
Fig. 77: Distribution of the answers to the question 2.4 of French participants
Fig. 78: Distribution of the answers to the question 2.6 of French participants

N°. 528005-LLP-1-2012-1-GR-COMENIUS-CMP - TRANSIt
D2.1 Needs Analysis Report 67/119
Fig. 79: Distribution of the answers to the question 2.7 of French participants
Fig. 80: Distribution of the answers to the question 2.8 of French participants
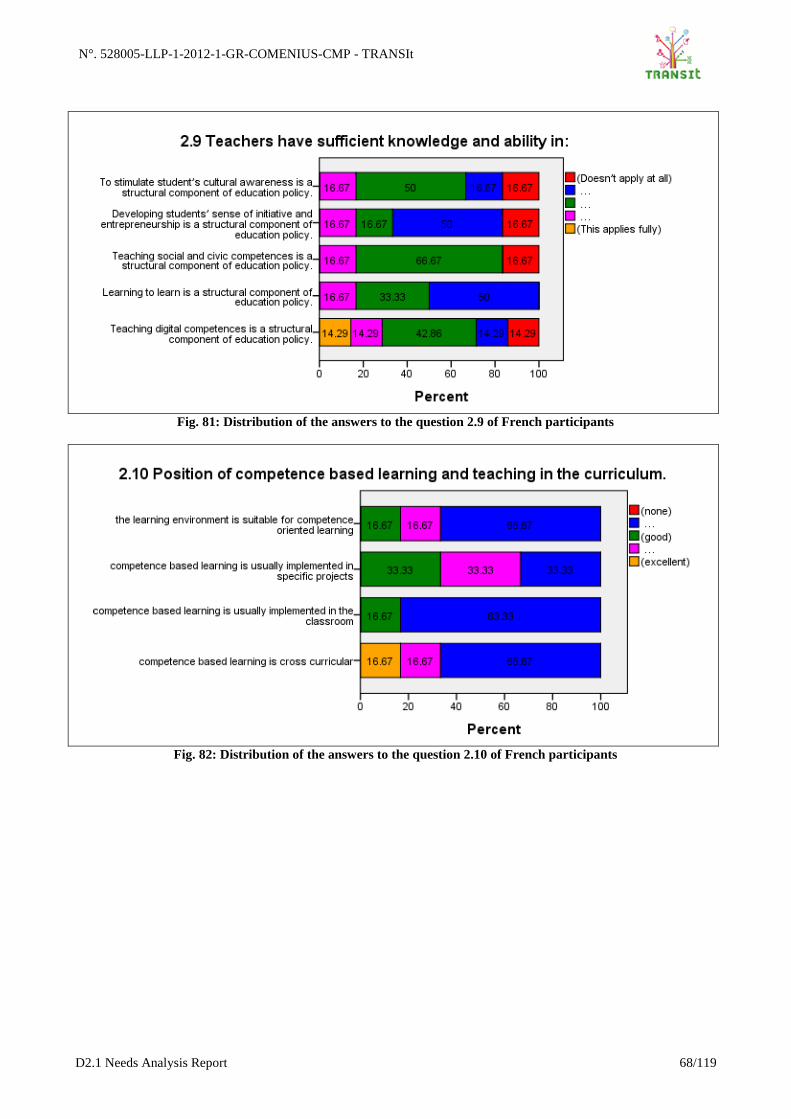
N°. 528005-LLP-1-2012-1-GR-COMENIUS-CMP - TRANSIt
D2.1 Needs Analysis Report 68/119
Fig. 81: Distribution of the answers to the question 2.9 of French participants
Fig. 82: Distribution of the answers to the question 2.10 of French participants

N°. 528005-LLP-1-2012-1-GR-COMENIUS-CMP - TRANSIt
D2.1 Needs Analysis Report 69/119
Fig. 83: Distribution of the answers to the question 2.11 of French participants
Fig. 84: Distribution of the answers to the question 2.12 of French participants
Requirements: The majority of French respondents have more than 3 years of experience in
teaching digital competencies. More than half of the respondents have more than 3 years of
experience in teaching competences about sense of initiative and entrepreneurship. A third of the
respondents has no experience with social and civic competences. The didactics and teaching
methods they use in classes are mainly classroom instructions. Guided discovery, problem based
learning, interviewing experts, peers or others and (sub)group activities were used (more than)
regularly. A striking result is the fact that the French respondents don’t use storyline as a didactic
and teaching method. In the implementation of CBL, French respondents mainly use productivity
tools, information searching tools and 3D virtual environments. ePortfolios, Web2.0, Learning
management tools and software authoring tools are tools that were used seldom. The French
educational staff frequently uses several ICT assessment tools to assess student performance and to
gain information about the progress in student performance. But the current assessment tools that
were used are mainly written; paper and pencil tests. However, computer assignments are also
firmly on the rise.

N°. 528005-LLP-1-2012-1-GR-COMENIUS-CMP - TRANSIt
D2.1 Needs Analysis Report 70/119
The respondents assess their colleagues as having sufficient knowledge and ability in teaching
digital competencies, social and civic competencies and competencies about sense of initiative and
entrepreneurship. There is no consensus about the availability of skilled teachers in the field cultural
awareness and expression and learning to learn. There is also sufficient knowledge and ability in
stimulating student’s cultural awareness as a structural component of educational policy to teach
social and civic competences as a structural component of educational policy. Sense of initiative
and entrepreneurship is a competency that needs more attention in the future. It can be assumed that
competence based learning and teaching have a central position in specific projects. But the
respondents mention that it has no specific role in the classroom. However, the limited sample size
makes drawing conclusions difficult. The majority of respondents (60%) points that French teachers
were not assessed for their competence based learning abilities. 67% of the respondents mentioned
that competency oriented teaching has been promoted among the teaching staff. The facilities in
France are very limited; continuing professional development and database with learning and
teaching material are very rarely present.
Open questions: Because there are insufficient answers to question 2.2, it is not possible to give a
general answer to this question. Lack of time and lack of hard- and software are two constraints the
French respondents mentioned as problematic when creating competence based learning curricula.
One respondents mentioned the following problem: “The difficulty of assessment, which is not as
methodological as you would like us to believe. There is also a lack of understanding of the
elements related to competencies. What is a competency?”
4.5.3 Training needs
Fig. 85: Distribution of the answers to the question 3.1 of French participants

N°. 528005-LLP-1-2012-1-GR-COMENIUS-CMP - TRANSIt
D2.1 Needs Analysis Report 71/119
Fig. 86: Distribution of the answers to the question 3.2 of French participants
Fig. 87: Distribution of the answers to the question 3.3 of French participants
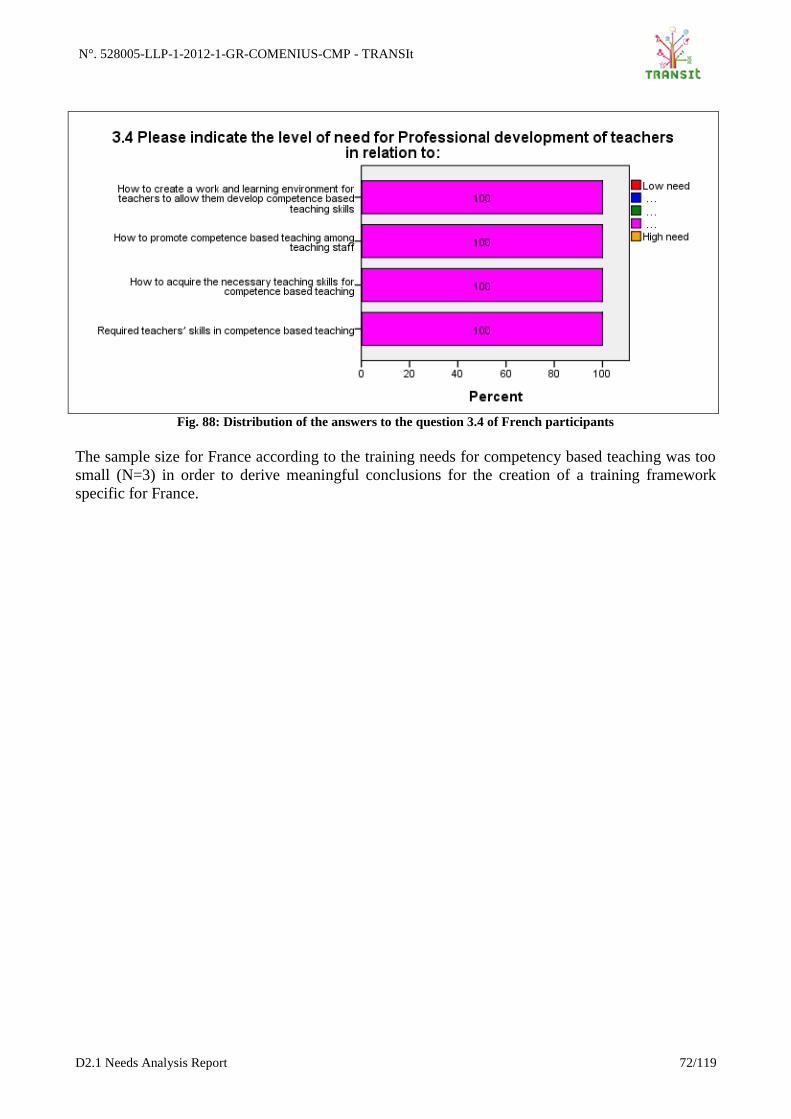
N°. 528005-LLP-1-2012-1-GR-COMENIUS-CMP - TRANSIt
D2.1 Needs Analysis Report 72/119
Fig. 88: Distribution of the answers to the question 3.4 of French participants
The sample size for France according to the training needs for competency based teaching was too
small (N=3) in order to derive meaningful conclusions for the creation of a training framework
specific for France.

N°. 528005-LLP-1-2012-1-GR-COMENIUS-CMP - TRANSIt
D2.1 Needs Analysis Report 73/119
4.5.4 Availability to participate in the project
Fig. 89: Distribution of the answers to the question 5.1 of French participants
Fig. 90: Distribution of the answers to the question 5.2 of French participants

N°. 528005-LLP-1-2012-1-GR-COMENIUS-CMP - TRANSIt
D2.1 Needs Analysis Report 74/119
Fig. 91: Distribution of the answers to the question 5.3 of French participants
Fig. 92: Distribution of the answers to the question 5.4 of French participants
The sample size for France according to the availability for competency based teaching training was
too small (N=3) in order to derive meaningful conclusions for the creation of a training framework
specific for France.
4.6 Austria
4.6.1 User profile
In Austria 30 respondents participated in the survey. The major part of these respondents are female
(60%) and the largest part of the respondents are in the age range of 31 and older (see Figure 97).
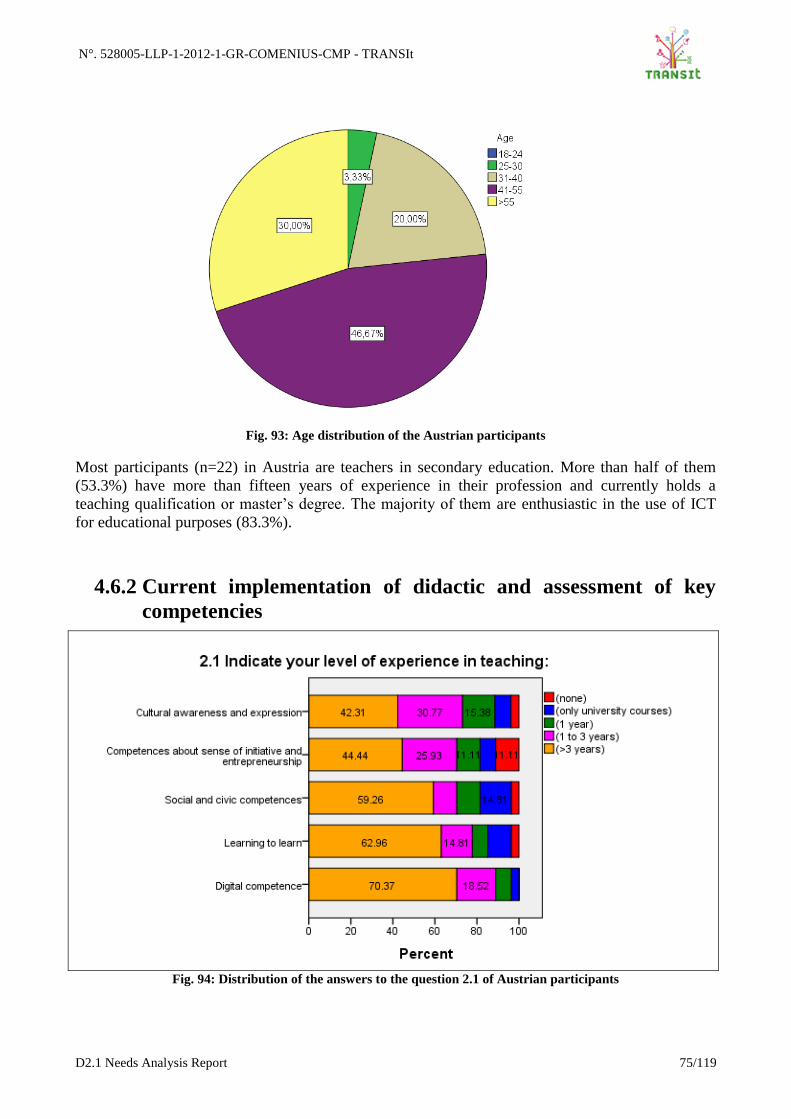
N°. 528005-LLP-1-2012-1-GR-COMENIUS-CMP - TRANSIt
D2.1 Needs Analysis Report 75/119
Fig. 93: Age distribution of the Austrian participants
Most participants (n=22) in Austria are teachers in secondary education. More than half of them
(53.3%) have more than fifteen years of experience in their profession and currently holds a
teaching qualification or master’s degree. The majority of them are enthusiastic in the use of ICT
for educational purposes (83.3%).
4.6.2 Current implementation of didactic and assessment of key
competencies
Fig. 94: Distribution of the answers to the question 2.1 of Austrian participants

N°. 528005-LLP-1-2012-1-GR-COMENIUS-CMP - TRANSIt
D2.1 Needs Analysis Report 76/119
Fig. 95: Distribution of the answers to the question 2.3 of Austrian participants
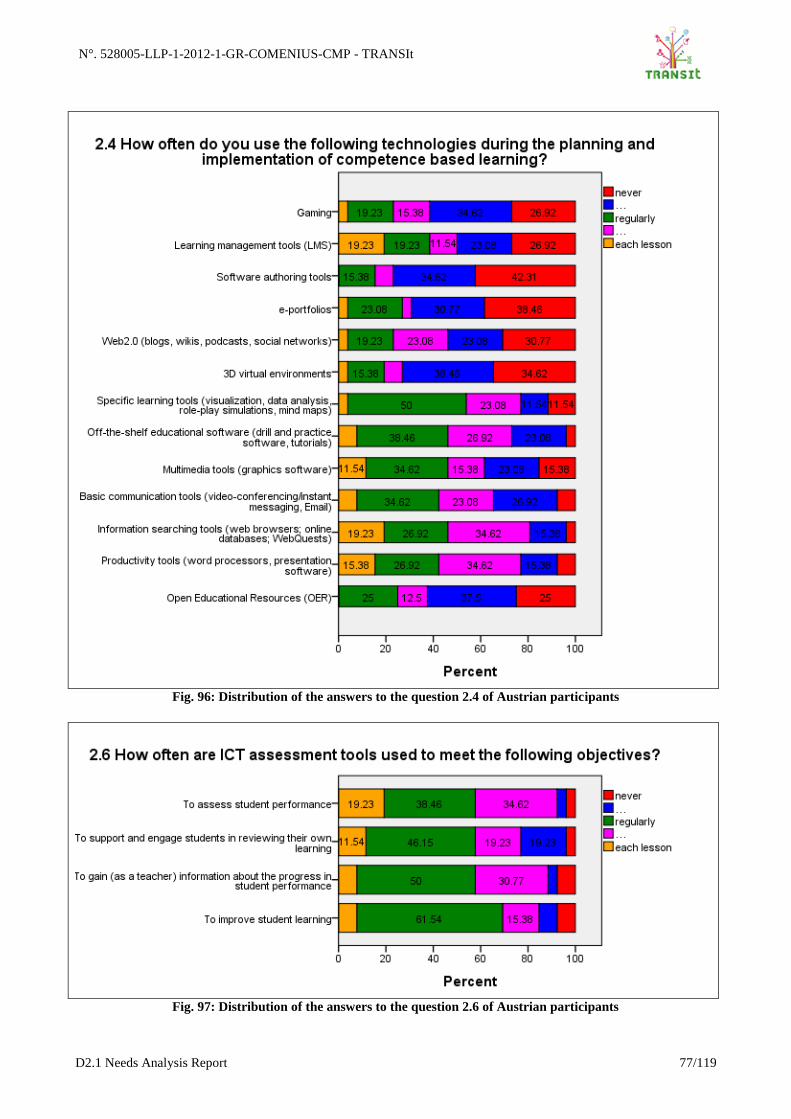
N°. 528005-LLP-1-2012-1-GR-COMENIUS-CMP - TRANSIt
D2.1 Needs Analysis Report 77/119
Fig. 96: Distribution of the answers to the question 2.4 of Austrian participants
Fig. 97: Distribution of the answers to the question 2.6 of Austrian participants

N°. 528005-LLP-1-2012-1-GR-COMENIUS-CMP - TRANSIt
D2.1 Needs Analysis Report 78/119
Fig. 98: Distribution of the answers to the question 2.7 of Austrian participants
Fig. 99: Distribution of the answers to the question 2.8 of Austrian participants

N°. 528005-LLP-1-2012-1-GR-COMENIUS-CMP - TRANSIt
D2.1 Needs Analysis Report 79/119
Fig. 100: Distribution of the answers to the question 2.9 of Austrian participants
Fig. 101: Distribution of the answers to the question 2.10 of Austrian participants

N°. 528005-LLP-1-2012-1-GR-COMENIUS-CMP - TRANSIt
D2.1 Needs Analysis Report 80/119
Fig. 102: Distribution of the answers to the question 2.11 of Austrian participants
Fig. 103: Distribution of the answers to the question 2.12 of Austrian participants
Requirements: The Austrian respondents label themselves as experienced in teaching in a
competence-based way. They have for example a lot of experience in teaching digital competences,
learning to learn and social and civic competences. Besides experience, the respondents also
indicate that they have a lot of knowledge and ability in teaching social and civic competences,
learning to learn and cultural awareness and expression. Knowledge and ability with sense of
initiative and digital competences still lie somewhat behind. The majority of respondents label their
colleagues as having sufficient knowledge and ability in teaching these competences. But these
results are not entirely conclusive. As mentioned in the state-of-the-art, the position of competence
based learning and teaching has a central position in primary and secondary education in Austria. At
the same time, about 45% of the respondents appoint that the learning environment is not suitable
for competence oriented learning. Teachers’ abilities in competence based teaching were also
assessed seldom. More than 82% of the respondents pointed that the teachers’ abilities regarding
CBL were almost never assessed.

N°. 528005-LLP-1-2012-1-GR-COMENIUS-CMP - TRANSIt
D2.1 Needs Analysis Report 81/119
The didactics and teaching methods used in practice by the Austrian respondents is mostly based on
project-based learning and problem-based learning. Interviewing experts, peers or others and using
a storyline is a seldom used teaching method. Despite the enthusiasm in using ICT for educational
purposes, technologies were seldom used. Software authoring tools, e-portfolios and 3D-virtual
environments are some of the tools that were rarely used. Striking is the fact that some respondents
(20%) use learning management tools and information searching tools each lesson. Despite the
moderate use of ICT tools for the planning and implementation of competence based learning, the
respondents use ICT for the assessment of student performance, to support and engage students in
reviewing their own learning, to gain information about the progress in student performance and to
improve students learning, mostly on regular basis. However, the assessment tools/methods
mentioned in question 2.7 were used seldom in Austria. Only computer assignments and paper and
pencil tests were used sometimes. The use of the digital tools for the assessment of competences
can increase in the near future, because the majority of respondents pointed that the ICT
infrastructure in Austria is sufficient.
Open questions: Most Austrian teachers start cross-curricular teaching with collaborative
discussions with colleagues, then in consultation with colleagues the objectives will be defined.
When the objectives are formulated, several teams of teachers will be formed. They are jointly
responsible for the successful implementation of the competence-based learning of students. After
finishing the project, the outcomes will be evaluated. Each school has therefore different methods
and expect different outcomes. Some obstacles to the successful implementation of competence-
based education are: group size, flexibility of the curriculum, lack of resources, insufficient support
within the educational institution and time constraints.
4.6.3 Training needs
Fig. 104: Distribution of the answers to the question 3.1 of Austrian participants

N°. 528005-LLP-1-2012-1-GR-COMENIUS-CMP - TRANSIt
D2.1 Needs Analysis Report 82/119
Fig. 105: Distribution of the answers to the question 3.2 of Austrian participants
Fig. 106: Distribution of the answers to the question 3.3 of Austrian participants

N°. 528005-LLP-1-2012-1-GR-COMENIUS-CMP - TRANSIt
D2.1 Needs Analysis Report 83/119
Fig. 107: Distribution of the answers to the question 4.4 of Austrian participants
Requirements: The majority of Austrian respondents in the online survey need to learn more on
philosophy/didactics and teaching methods in relation to themes applied throughout competences,
like critical thinking, creativity and initiative. Another need is for teaching methods fostering
competence based learning, e.g. project based, action learning and problem oriented learning).
Beside the general philosophy and didactics related to the teaching methods, the Austrian
respondents also mentioned the need for specific tools for assessing competences and approaches
and objectives related to competences assessments. Due to the fact that the CBL is partly integrated
in the Austrian education programs, the need for more in the curricula in relation to characteristics
of learning competency curricula is less pronounced. The answers on question 2.4 indicate that the
Austrian respondents have the highest need for information about how to create a work and learning
environment for teachers to allow them in developing competence based teaching skills and the
need for teachers’ skills in competence based teaching.
4.6.4 Availability to participate in the project
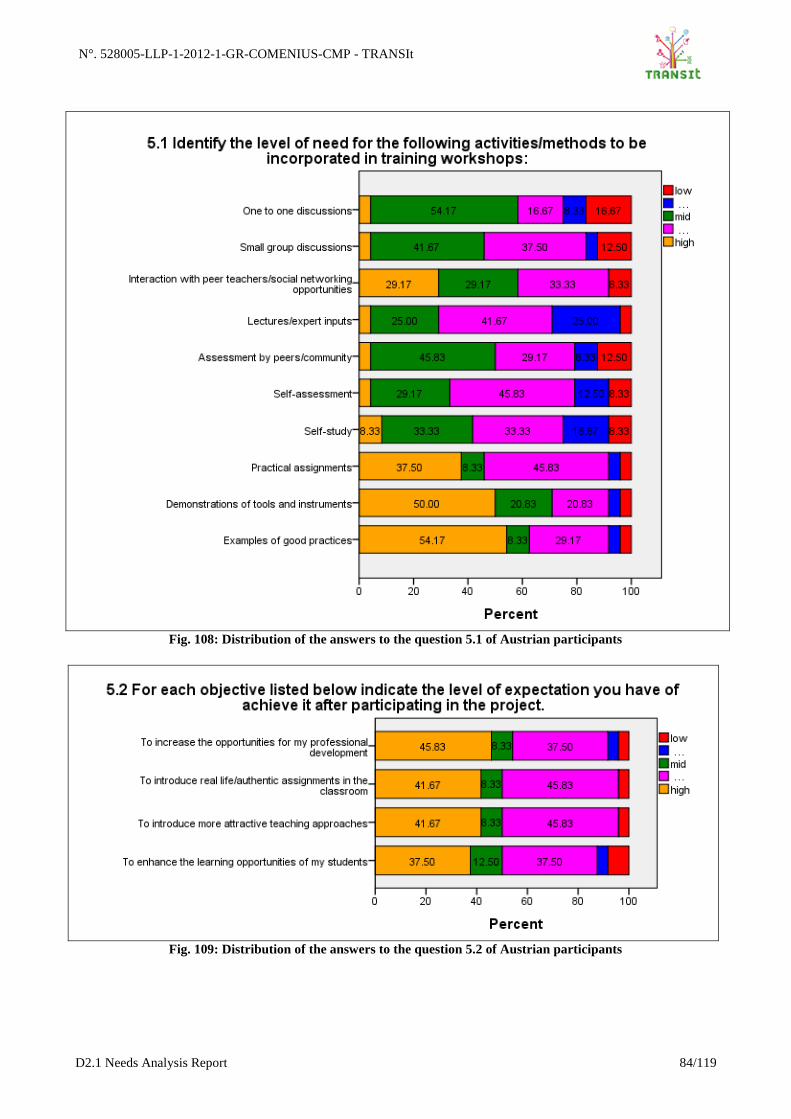
N°. 528005-LLP-1-2012-1-GR-COMENIUS-CMP - TRANSIt
D2.1 Needs Analysis Report 84/119
Fig. 108: Distribution of the answers to the question 5.1 of Austrian participants
Fig. 109: Distribution of the answers to the question 5.2 of Austrian participants

N°. 528005-LLP-1-2012-1-GR-COMENIUS-CMP - TRANSIt
D2.1 Needs Analysis Report 85/119
Fig. 110: Distribution of the answers to the question 5.3 of Austrian participants
Fig. 111: Distribution of the answers to the question 5.4 of Austrian participants
Most of the Austrian respondents in this survey indicate discreet interest in further participation in
the project but as on the one hand the implementation phase and the first pilot workshops will start
in the next school year and on the other hand the TRANSIt training modules are not specified up to
now nobody was able to make concrete affirmations.
4.7 Summary
The total sample size of teacher participating in the survey (pre-service and in-service) was 1.078.
The majority of these respondents come from Greece (n=648). In the next section follows the analysis of
all responses is presented. The most interesting results are marked with red frames and arrows.

N°. 528005-LLP-1-2012-1-GR-COMENIUS-CMP - TRANSIt
D2.1 Needs Analysis Report 86/119
4.7.1 User profile
Fig. 112: Age distribution (all participants)
The majority of respondents in this survey are female (65,9%). A quarter of the respondents are
teachers at a primary school, 40.8% are teachers at a secondary school and the rest is school leader,
curriculum developer, teachers’ trainer or educational policy maker. Most of the respondents have
more than 5 years of experience (91.2%) in their current profession. 46.9% of them have a
bachelors’ degree and 41.3% have a masters’ degree. Most respondents identify themselves as
enthusiastic in the use of ICT for educational purposes (59.3%), only 3.3% is sceptical to the use of
ICT for educational purposes, preferring to avoid the use of ICT in classes.
4.7.2 Current implementation of didactic and assessment of key
competencies
Fig. 113: Distribution of the answers to the question 2.1 (all participants)

N°. 528005-LLP-1-2012-1-GR-COMENIUS-CMP - TRANSIt
D2.1 Needs Analysis Report 87/119
Fig. 114: Distribution of the answers to the question 2.3 (all participants)

N°. 528005-LLP-1-2012-1-GR-COMENIUS-CMP - TRANSIt
D2.1 Needs Analysis Report 88/119
Fig. 115: Distribution of the answers to the question 2.4 (all participants)
Fig. 116: Distribution of the answers to the question 2.6 (all participants)

N°. 528005-LLP-1-2012-1-GR-COMENIUS-CMP - TRANSIt
D2.1 Needs Analysis Report 89/119
Fig. 117: Distribution of the answers to the question 2.7 (all participants)
Fig. 118: Distribution of the answers to the question 2.8 (all participants)

N°. 528005-LLP-1-2012-1-GR-COMENIUS-CMP - TRANSIt
D2.1 Needs Analysis Report 90/119
Fig. 119: Distribution of the answers to the question 2.9 (all participants)
Fig. 120: Distribution of the answers to the question 2.10 (all participants)

N°. 528005-LLP-1-2012-1-GR-COMENIUS-CMP - TRANSIt
D2.1 Needs Analysis Report 91/119
Fig. 121: Distribution of the answers to the question 2.11 (all participants)
Fig. 122: Distribution of the answers to the question 2.12 (all participants)
Requirements: The majority of the general respondents in this survey have more than one year of
experience in teaching digital competency, learning to learn, social and civic competencies and
cultural awareness and expression. More than 50% of the respondents have also more than 3 years
of experience in teaching digital competencies. Most used didactics and teaching methods are
discussion and debating, (sub)group activities and guided discovery. On the side, there is almost no
interest for interviewing experts, peers or others as a form of teaching. The respondents in this
survey mostly use information searching tools and productivity tools during the planning and
implementation of CBL. The latest technological possibilities such as gaming, LMS, software
authoring tools and e-portfolios are rarely used in CBL. Most respondents mentioned that they use
ICT assessment tools for all four objectives in question 2.6, so in case of assessing students’
performances, supporting and engaging students in reviewing their own learning, gaining
information about the progress in student performance and improving students’ learning. The
answers to question 2.8 and 2.9 (Figure 120 & 121) show that teachers have insufficient knowledge
and ability in competencies about (developing) sense of initiative and entrepreneurship and teaching
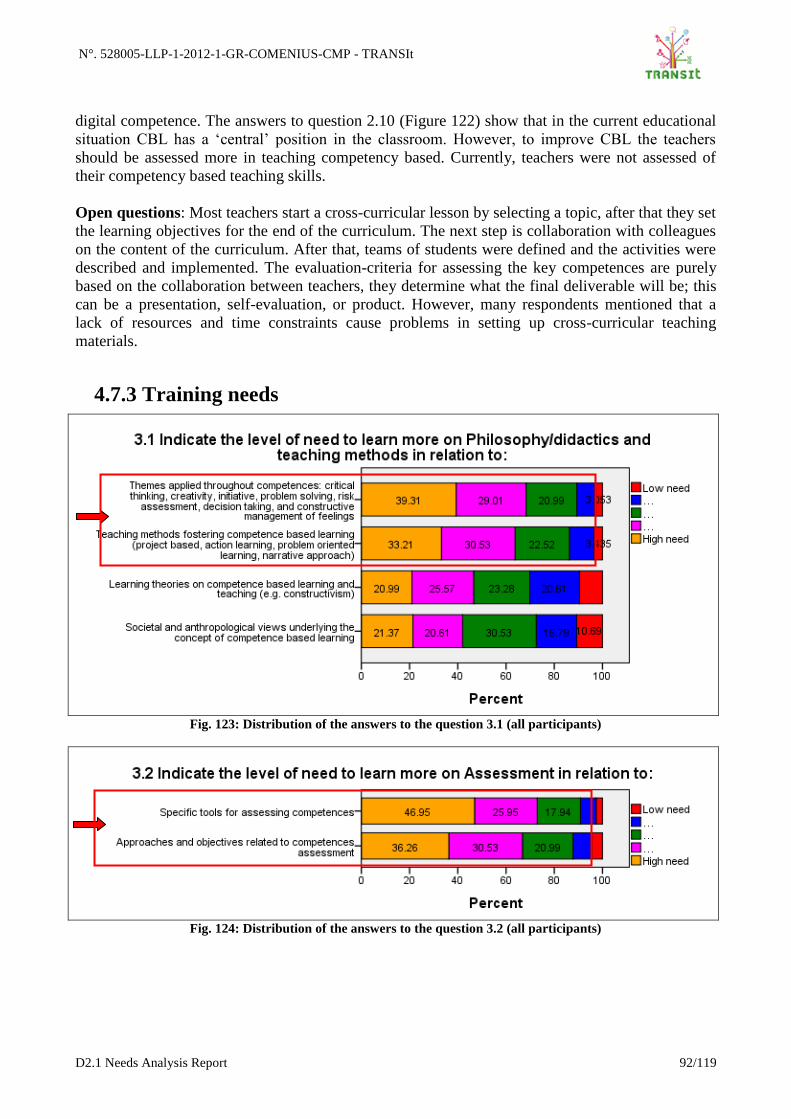
N°. 528005-LLP-1-2012-1-GR-COMENIUS-CMP - TRANSIt
D2.1 Needs Analysis Report 92/119
digital competence. The answers to question 2.10 (Figure 122) show that in the current educational
situation CBL has a ‘central’ position in the classroom. However, to improve CBL the teachers
should be assessed more in teaching competency based. Currently, teachers were not assessed of
their competency based teaching skills.
Open questions: Most teachers start a cross-curricular lesson by selecting a topic, after that they set
the learning objectives for the end of the curriculum. The next step is collaboration with colleagues
on the content of the curriculum. After that, teams of students were defined and the activities were
described and implemented. The evaluation-criteria for assessing the key competences are purely
based on the collaboration between teachers, they determine what the final deliverable will be; this
can be a presentation, self-evaluation, or product. However, many respondents mentioned that a
lack of resources and time constraints cause problems in setting up cross-curricular teaching
materials.
4.7.3 Training needs
Fig. 123: Distribution of the answers to the question 3.1 (all participants)
Fig. 124: Distribution of the answers to the question 3.2 (all participants)

N°. 528005-LLP-1-2012-1-GR-COMENIUS-CMP - TRANSIt
D2.1 Needs Analysis Report 93/119
Fig. 125: Distribution of the answers to the question 3.3 (all participants)
Fig. 126: Distribution of the answers to the question 3.4 (all participants)
Training requirements: The results show that there is a high need for themes applied throughout
competencies and teaching methods fostering competency based learning. To assess the (learned)
competencies, the respondents point that they first should learn more about the specific tools for
assessing competencies and the approaches and objectives related to competencies assessment.
There is also a high need to learn more on school curricula in relation to characteristics of
competency based curricula (features of competency based school and learning environments).
Finally, there is a high need for professional development of teachers in relation to the creation of a
work and learning environment for teachers to allow them to develop competency based teaching
skills and also for the promotion of competency based teaching among teaching staff. For that
reason there should be a better work and learning environment for teachers to allow them for giving
competency based teaching, before competency based teaching can be adapted.

N°. 528005-LLP-1-2012-1-GR-COMENIUS-CMP - TRANSIt
D2.1 Needs Analysis Report 94/119
4.7.4 Availability to participate in the project
Fig. 127: Distribution of the answers to the question 5.1 (all participants)
Fig. 128: Distribution of the answers to the question 5.2 (all participants)

N°. 528005-LLP-1-2012-1-GR-COMENIUS-CMP - TRANSIt
D2.1 Needs Analysis Report 95/119
Fig. 129: Distribution of the answers to the question 5.3 (all participants)
Fig. 130: Distribution of the answers to the question 5.4 (all participants)
Requirements: the majority of the respondents mentioned practical assignments, demonstrations of
tolls and instruments and examples of good practices as the activities/methods that are most needed.
Just a small part of the respondents points one-to-one discussions as an important need for the
training workshops. The respondents expect that they can achieve all the four objectives mentioned
in question 5.2. They expect that they can increase the opportunities for the professional
development; they expect that they get an introduction to real life/authentic assignments in the
classroom, they expect that they achieve more attractive teaching approaches and finally they
expect to achieve more learning opportunities of my students. The general picture that emerges is
that the respondents expect a lot of the workshops, but that the most important need is to learn more
about the way they can teach and assess the key competencies.
Preferred time and location for the workshop: There are no conclusive results on the preferred
time for training workshops but duration of 2 to 3 hours is acceptable.

N°. 528005-LLP-1-2012-1-GR-COMENIUS-CMP - TRANSIt
D2.1 Needs Analysis Report 96/119
5 Report on the Workshops conducted
5.1 Spain
On the 12th
and 14th
of March, 2013, two workshops were conducted by the University of Barcelona
with the goal to identify user needs from potential TRANSIt participants. During the workshops,
participants filled in the TRANSIt needs analysis questionnaire on paper.
Details of discussions during the workshop:
Involvement of the audience in Competence Based Learning (CBL)
Participants are involved in Competence-Based Learning (CBL) activities to various extents.
Several participants know very little about competences, but they are aware that public policy is
strongly encouraging the change of paradigm towards teaching by competences. They were
motivated and have already carried out educational innovations of some kind. Other participants are
already implementing cross-curricular educational activities which aim to the acquisition of
competences by their students. However, most of these practitioners admit that they aren’t
implementing them in a systematic way. Rather, they slightly modify their practice in the direction
of competence-based teaching. For instance, they carry out one project-based learning activity every
year. Another example is a teacher who reported to be working on her students’ mathematical
competence in her English class. Generally, those practitioners work autonomously and they don’t
share their practice with their peers.
Regardless of their level of involvement in CBL activities, most participants are concerned about
competence-based assessment. They don’t know how change to competence-based assessment from
a goal-oriented assessment while meeting the official curriculum, following the school policy and
pleasing students and parents.
1. Limitations of school practice
Participants are motivated to implement competence-based teaching but they spot several
constraints. In their minds, their working schedule doesn’t allow for educational innovation as they
would wish. For instance, primary school teachers who teach one different subject every hour, often
to different groups of students, have difficulties in breaking the boundaries of these subjects. The
lack of resources such as a computer room and lack of flexibility to use them has also been
mentioned among the biggest obstacles encountered.
2. Curriculum opportunities for applying CBL
Some participants identified enablers to the implementation of Competence-Based Learning (CBL)
activities. Several participants believe that the competence based teaching and assessment books
published by the Department of Education of the Catalan government are useful “because they let
you know what competences your students must acquire and to what extent”. In general, they feel
that schools have enough freedom to develop an educational policy that meets the goals of the
regional curriculum. This is to say, they think that the institutional framework allows for achieving
the same educational goals in different ways.
Such freedom is higher in primary than in secondary school, participants think. More specifically,
teachers believe that nowadays CBL activities are rather suited for young students within primary
school. According to them, as the end of primary school approaches, teachers shift towards content-
oriented teaching because they must prepare their students for undertaking secondary education.

N°. 528005-LLP-1-2012-1-GR-COMENIUS-CMP - TRANSIt
D2.1 Needs Analysis Report 97/119
Given the constraints of the official curriculum, a number of practitioners from secondary school
spotted ways to implement CBL activities, which mainly rely on communication among teachers
and support from the management team.
A teacher summarizes the opportunities for CBL activities: “teachers who have an open mind and
will to work can innovate every day”.
3. Training needs to overcome the limitations
Participants implied that if they had a clearer idea on how to teach and assess by competences, they
would be more willing to implement it. They wish to learn through examples of success stories and
good practices, through interacting with practitioners who teach and assess by competences and by
having access to educational materials, especially digital, that they can use.
Most participants wish to undertake hands-on training, which can have a direct impact in their daily
practice. They mention competences as a methodology for the training.
4. Tools for supporting CBL teachers
Digital resources seem to be a suitable way to increase teachers and school leaders’ skills in
competence-based teaching.
5. Conclusions
Participants are generally motivated to change towards competence-based teaching and assessment
because they feel that students won’t accept old school methods any longer and because it is highly
supported by public policy. At the moment, they seem to lack training and resources so to bridge
the gap between theory and practice of CBL.
6. Recommendations
A successful training for Spanish teachers and school leaders seems to rely on making it easier for
them to implement public policies on competence-based education. Most participants to the
workshop are motivated to implement the competence-based teaching and assessment guidelines
given in the documents published by the Educational Department of the Catalan government.
Others may benefit from being led through the design and implementation of cross-curricular
activities oriented to competence acquisition by their students.
The results of the workshops from Spain have been summarised in a national report, a synopsis of
which with main results has been sent to participants in local language.
5.2 Austria
26 teachers participated in the face-to-face workshop in Bad Hofgastein on the 09th
April 2013.
The workshop in Bad Hofgastein took place in the framework of the Annual Meeting of
Advisors of subject portals from the National Austrian School Portal (www.schule.at). The
TRANSIt visionary workshop was organized on the basis of workshop materials developed by
PLATO, the former WP2 leader of the TRANSIt project. 26 participants filled in the TRANSIt
needs analysis questionnaires on paper.
One online workshop was carried through on the 23th
June 2013 with 8 participants using
Skype and Google.docs. This workshop was planned in order to gain more specific feedback
and insight to everyday practice of CBL and especially to do the SWOT analysis on internal and
external factors that support or constrain CLB in the educational system in Austria.

N°. 528005-LLP-1-2012-1-GR-COMENIUS-CMP - TRANSIt
D2.1 Needs Analysis Report 98/119
Most of the participants of the 2 workshops are teachers working in secondary education. It has to
be pointed out that teachers of different types of school have been involved:
the so-called “NMS” (Neue Mittelschule = New Secondary School; see
http://www.bmukk.gv.at/enfr/school/gen_edu/new_secondary_school.xml) is a newly
established Austrian school for lower secondary education (students 10-14 years),
the so-called “AHS” (Allgemein bildende höhere Schule = Secondary Academic School, see
http://www.bmukk.gv.at/enfr/school/gen_edu/secon.xml) lasts for eight years and is divided
in a lower level (students 10 – 14 years) and an upper level (students 15 – 18 years) and
leads students to the “Austrian Matura” (maturity exam).
Besides there are different school types for Secondary Technical and Vocational Education
(see http://www.bmukk.gv.at/enfr/school/secon/basic.xml).
Most of the workshop participants work either in NMS or in AHS teaching a broad spectrum of
subjects, only 4 teachers are primary school teachers. Most of the participating teachers have been
in their profession for more than 5 years but the main part of participants did not participate in
professional development activities for key competence acquisition up to now.
User profile in detail (including data from the 2 workshops conducted)
Gender: Male: 13 Female: 21
Age: 20-30 (3 participants)
30-40 (8 participants)
40-50 (9 participants)
50-60 (8 participants)
>60 (none)
6 missing items
School information
I work in:
Primary education (4 participants)
Secondary education (26 participants )
Vocational education
Other:
4 teacher trainers, teacher educators………
Student numbers:
<200 (5 part.)
200 – 350 (4 part.)
350 – 500 (6 part.)
500 – 750 (6 part.)
750 – 1000 (5 part.)
1000 – 1250 (1 part.)
1250 – 1500 (1 part.)
> 1500
6 missing items
Experience
Main Professional activity
Teacher (26 participants)
School leader (2 participants)
Teachers trainer (6 participants)
Pre-service teacher (none)
Curriculum development (none)
Other: ------
For how many years have
you been in this profession?
0 - 2 years (4 part.)
3 - 5 years (3 part.)
6 - 10 years (6 part.)
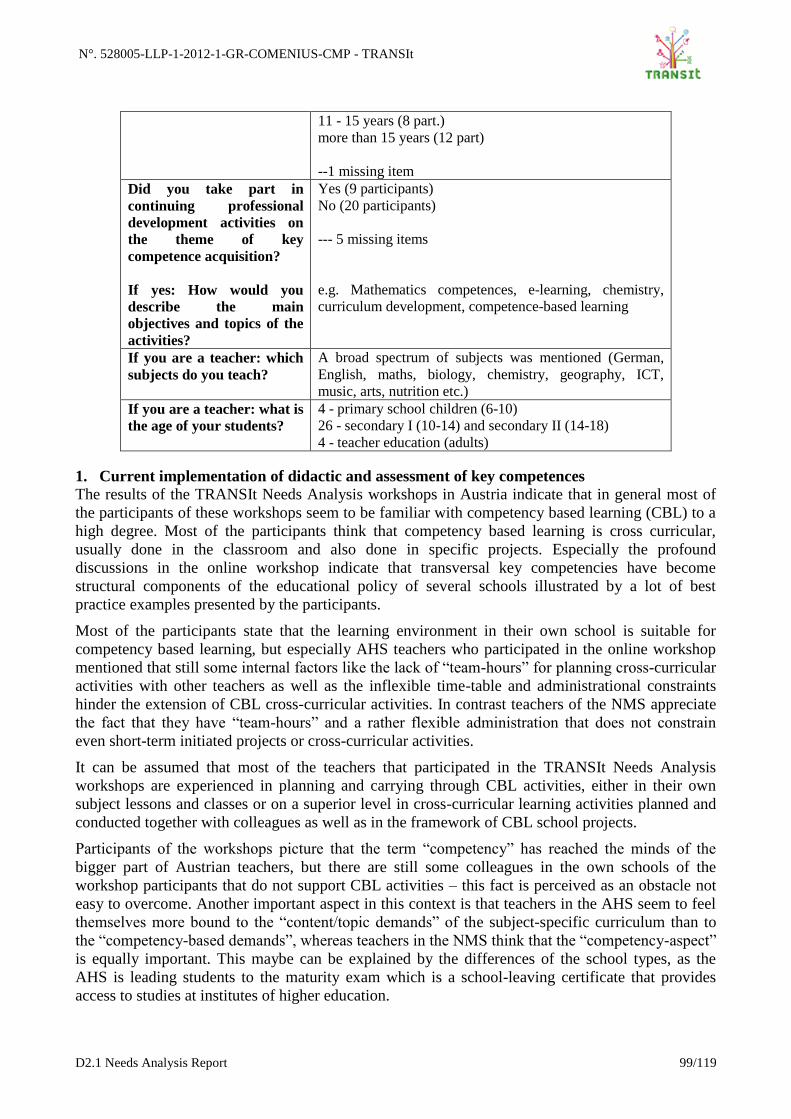
N°. 528005-LLP-1-2012-1-GR-COMENIUS-CMP - TRANSIt
D2.1 Needs Analysis Report 99/119
11 - 15 years (8 part.)
more than 15 years (12 part)
--1 missing item
Did you take part in
continuing professional
development activities on
the theme of key
competence acquisition?
If yes: How would you
describe the main
objectives and topics of the
activities?
Yes (9 participants)
No (20 participants)
--- 5 missing items
e.g. Mathematics competences, e-learning, chemistry,
curriculum development, competence-based learning
If you are a teacher: which
subjects do you teach?
A broad spectrum of subjects was mentioned (German,
English, maths, biology, chemistry, geography, ICT,
music, arts, nutrition etc.)
If you are a teacher: what is
the age of your students?
4 - primary school children (6-10)
26 - secondary I (10-14) and secondary II (14-18)
4 - teacher education (adults)
1. Current implementation of didactic and assessment of key competences
The results of the TRANSIt Needs Analysis workshops in Austria indicate that in general most of
the participants of these workshops seem to be familiar with competency based learning (CBL) to a
high degree. Most of the participants think that competency based learning is cross curricular,
usually done in the classroom and also done in specific projects. Especially the profound
discussions in the online workshop indicate that transversal key competencies have become
structural components of the educational policy of several schools illustrated by a lot of best
practice examples presented by the participants.
Most of the participants state that the learning environment in their own school is suitable for
competency based learning, but especially AHS teachers who participated in the online workshop
mentioned that still some internal factors like the lack of “team-hours” for planning cross-curricular
activities with other teachers as well as the inflexible time-table and administrational constraints
hinder the extension of CBL cross-curricular activities. In contrast teachers of the NMS appreciate
the fact that they have “team-hours” and a rather flexible administration that does not constrain
even short-term initiated projects or cross-curricular activities.
It can be assumed that most of the teachers that participated in the TRANSIt Needs Analysis
workshops are experienced in planning and carrying through CBL activities, either in their own
subject lessons and classes or on a superior level in cross-curricular learning activities planned and
conducted together with colleagues as well as in the framework of CBL school projects.
Participants of the workshops picture that the term “competency” has reached the minds of the
bigger part of Austrian teachers, but there are still some colleagues in the own schools of the
workshop participants that do not support CBL activities – this fact is perceived as an obstacle not
easy to overcome. Another important aspect in this context is that teachers in the AHS seem to feel
themselves more bound to the “content/topic demands” of the subject-specific curriculum than to
the “competency-based demands”, whereas teachers in the NMS think that the “competency-aspect”
is equally important. This maybe can be explained by the differences of the school types, as the
AHS is leading students to the maturity exam which is a school-leaving certificate that provides
access to studies at institutes of higher education.

N°. 528005-LLP-1-2012-1-GR-COMENIUS-CMP - TRANSIt
D2.1 Needs Analysis Report 100/119
Teachers in both workshops mentioned that from the institutional side they perceive same kind of
“extensive use” of the “term” competency, but some teachers also stated that it is not easy for them
to define specific competencies and as a consequence of that they do not really have a clear picture
about how to assess specific competencies. Some participants of the online workshop pointed out
that up to now they feel a little bit like “pioneers on finding concepts for assessing competencies”.
This seems to be more relevant in the upper secondary level in the AHS where currently an
extensive reform of the maturity exam is on its way, affecting all teachers and subjects. Teaching
practices in the upper secondary level in the AHS actually have to undergo severe changes by
switching from the main focus on subject matters and topics to the focus on subject-specific
competencies. The new standardised competency based maturity exam will be established within
the next two years, and as this is an ongoing process AHS teachers feel somehow insecure
concerning competency assessment, not only concerning key competencies but also subject-specific
competencies.
On the other side NMS-teacher state that they become more and more familiar with the new
education standards and competency models as well as the respective competency diagnosis tools of
the Austrian BIFIE (https://www.bifie.at/ikm). But these diagnosis tools exist only for English
(foreign language), German (mother tongue) and Maths and only for the lower secondary level (up
to 7th year of school).
In general it can be summarised that currently the implementation of CBL is on its way in Austria,
as well in the lower secondary level as in the upper secondary level. For most teachers the process
indicates a paradigm change from teaching subject-specific content to foster transversal and
subject-specific competencies. Most teachers that participated in the workshops seem to be familiar
with CBL but they are also aware that there is still a need for training - for themselves and also for
their colleagues. Most participants of the face-to-face workshop regard the acquisition of teaching
competencies for competency based teaching as important element of professional development of
teachers. Participants in the online workshop stated that they have a strong need to learn more about
effective concepts for competency-assessment.
2. Training needs
In Austria the initial teacher education is not uniform up to now, teachers in the AHS and the NMS
have passed different types of teacher education. The ministry is working on a teacher education
reform to harmonize initial teacher education in the future.
The profound discussions in the online workshop reveal that teachers in the NMS seem to be more
trained to teach in a competency based way than their colleagues in the AHS, and especially AHS
teachers in the first year of practice feel themselves not trained enough to foster CBL. Although
most of the more experienced teachers declare that they feel familiar with CBL teaching practices
they indicate that there is still a need to learn more about specifics of the transversal key
competencies and competency based didactics and teaching methods. Special training needs have
been mentioned for effective concepts on how to assess competencies, but also for specific “soft
skills” as e.g. collaborative working, creative teamwork or digital tools.
3. Availability to participate in the project
Most of the proposed components listed in the questionnaire (that have been filled in by participants
of the face-to-face workshop) for the TRANSIt training (expert inputs, interactions with peer
teachers, demonstrations of tools and instruments, examples of good practice, hands-on training,
follow up action planning etc.) are highly appreciated and should be included in the TRANSIt
training modules.

N°. 528005-LLP-1-2012-1-GR-COMENIUS-CMP - TRANSIt
D2.1 Needs Analysis Report 101/119
6 Report on the Delphi-study results
To identify the training needs of teachers around competency-based education in Europe, a Delphi-
study was conducted. This Delphi-study was conducted both online and offline. The Delphi study
makes it possible to gather qualitative data.
6.1 The Netherlands
The interview sessions with the eleven (11) teachers, policy makers and curriculum developers in
the Netherlands has yielded eight (8) different training needs:
1. General introduction of competency based education;
2. A structural design/training;
3. Focus on the broad competencies of the student;
4. Training on good rubrics and assessments;
5. Development of meta-competency skills;
6. Development of learning objectives with students;
7. Context-based competency-learning training;
8. Creating (valid) assessment on all educational levels
The results of the first round in the Delphi study suggest that there is no consensus in the training
needs of the participants. Some participants request a general introduction of competency-based
learning, other participants ask for a structural design and training and some participants ask for
clear assessment methods. In the sample of eleven participants, nine of them are willing to
participate in the project’s activities.
6.2 Austria
Two interviews based on the Delphi study were conducted with Austrian teachers that did not take
part in the workshops conducted (via Skype). The answers in the Delphi study resulted in six
training needs:
1. Teachers need to understand the whole process of CBL;
2. Gain understanding for the process and its practical implementation;
3. Training teachers in the necessary competences to conduct CBL activities;
4. Training in instructional design methodologies;
5. How to assess the competences;
6. Creative learning techniques
Due to the limited number of participants in the Austrian Delphi study there is no consensus in the
different needs. However, the results are due to the qualitative nature particularly valuable for the
construction of the training framework for competence based teaching.

N°. 528005-LLP-1-2012-1-GR-COMENIUS-CMP - TRANSIt
D2.1 Needs Analysis Report 102/119
7 SWOT analysis
In Fig. 135 the SWOT analysis derived from questionnaire survey and workshop discussions is
presented. A systematic analysis of the results from the questionnaire survey and workshops
resulted in the strengths, weaknesses, opportunities and threats. The main Strengths, Weaknesses,
Opportunities and Threats (SWOT) of future training workshops are depicted.
Fig. 131: SWOT analysis
Helpful to achieving the
objectives
Harmful to achieving the
objectives
Inte
rnal
fact
ors
Ex
tern
al
fact
ors
- Respondents are positive about
teaching in a competence based
way
- Respondents are willing to
participate in workshops
- Respondents are willing to learn
more about teaching and
assessment techniques
- Respondents are willing to
implement new (ICT) technologies
into the competence-based
teaching methods.
- Respondents have low experience
in the core components of CBL
- Respondents have low experience
with teaching with a major focus
on competencies.
- Respondents have low experience
with the new teaching and
assessing techniques (e-Portfolios,
etc.)
- Respondents should be trained in
being a competence based learning
teacher
- Respondents should know more
about the possibilities of teaching
based on competences
- Respondents should know more
about ‘how to’ assess competences.
-
- Class size
- Time pressure
- Constrains of curriculum.
- Traditional way of thinking
(subject themes)
S W
O T

N°. 528005-LLP-1-2012-1-GR-COMENIUS-CMP - TRANSIt
D2.1 Needs Analysis Report 103/119
8 Conclusions/Contributions to the TRANSIt Training
Framework
8.1 Findings from the needs analysis survey
The Needs Analysis Report highlights the training needs of the project’s target groups. Many of the
needs are common to all countries, but indeed there are some differentiations between the partner
countries.
Identified needs Greece The
Netherlands
Ireland Spain France Austria
Themes applied throughout competences:
critical thinking, initiative, problem solving, risk
assessment, decision taking, and constructive
management of feelings.
√ √ √ √ √ √
Teaching methods fostering competence based
learning (project based, action learning,
problem oriented learning, narrative approach)
√ √ √ √ √
Learning theories on competence based learning
and teaching (e.g. constructivism) √ √
√
Societal and anthropological views underlying
the concept of competence based learning.
√
Assessment in relation to specific tools for
assessing competences √ √ √ √
√
Assessment in relation to approaches and
objectives related to competences assessment. √ √ √ √ √ √
Need to learn more on school curricula in
relation to characteristics of competence based
curricula (features of competence based school
and learning environments)
√ √ √ √
Need for professional development of teachers
in relation to the creation of a work and
learning environment for teachers to allow them
to develop competence based teaching skills
√ √ √ √ √ √
Need for professional development of teachers
in relation to the promotion of competence
based teaching among teaching staff
√ √ √ √
Need for professional development of teachers
in relation to acquiring the necessary teaching
skills for competence base teaching
√ √ √ √ √

N°. 528005-LLP-1-2012-1-GR-COMENIUS-CMP - TRANSIt
D2.1 Needs Analysis Report 104/119
Need for professional development of teachers
in relation to the required teachers’ skills in
competence based teaching.
√ √ √ √ √
Need for one to one discussions (in the training
workshops) √
√ √
Need for small group discussions (in the training
workshops) √
√ √
Need for the interactions with peer
teachers/social networking opportunities √ √ √
√
Need for lectures/expert inputs √ √ √
Need for assessment by peers/community √ √
Need for self-assessment √ √ √
Need for self-study √ √
Need for: practical assignments √ √ √ √ √
Need for the demonstration of tools and
instruments √ √ √ √
√
Need for examples of good practices √ √ √ √ √ √
Table 1: Users’ training requirements per country
8.2 Conclusions
The goal of the needs analysis was to identify, classify and analyse the needs of European
educational staff regarding competence based teaching. Within the needs analysis we identified user
training needs in terms of educational theories, models and frameworks, ICT tools and other
learning design processes that may prove useful to teachers. The results of this survey will be used
for the development of a training framework to improve teachers’ capacity on competence oriented
education.
Our survey has shown that teachers are generally open and positive towards teaching based from a
competency based perspective. They are interested in courses and workshops that can help them
expand their knowledge about how to teach in a competency based way and how to assess the
possible acquired competencies.
The respondents in this survey – with a majority of Greek descent – appoint themselves as
experienced in teaching four out of the five transversal competences. Most of them have more than
1 year of experience in teaching them. 47% of the respondents have minimal experience in teaching
the sense of initiative and entrepreneurship competence. This key competence is for that reason an
important one to consider for the training framework. However, despite the experience of the
respondents, they didn’t feel that they have sufficient knowledge and ability in most of the
competencies. Stimulating student’s cultural awareness is a structural component of education
policy. The didactics and teaching methods that were used in the different countries are mostly

N°. 528005-LLP-1-2012-1-GR-COMENIUS-CMP - TRANSIt
D2.1 Needs Analysis Report 105/119
discussion and debating and the sub-group activities, while the storyline and interviewing experts,
peers or others were methods that were used rarely.
The majority of survey respondents (59.3%) call themselves enthusiastic in the use of ICT.
However, the use of new technologies during the planning and implementation of competency
based learning is still at a very low level. Only the ‘traditional’ ICT-skills like information
searching tools and productivity tools were used very often. The ‘progressive’ tools like gaming,
learning management tools (LMS), software authoring tools and e-portfolios were rarely used. We
should be alert regarding these results. Because the chances are that the teachers use these
technologies very seldom because of the fact that they are not familiar with these types of software.
Creating awareness of the possibilities of these ICT-tools and then skills to use them in a
competency-based context should be an important part of the training framework.
The same phenomenon can be identified in the assessment tools or methods. More than half of the
participants never or almost never used rubrics (68%), peer assessment (56%), role play (54%),
ePortfolios (78%) and simulation (68%) as tools to measure the knowledge and skills of the
students. The paper and pencil tests and the computer assignments are still the most commonly used
assessment methodologies. This emphasizes the disturbed relationship between the willingness to
use ICT for educational purposes and the actual use of ICT within education.
The majority of respondents pointed that CBL has an important position within the curriculum.
Especially in the classroom it has a central position. However, there is no consensus about the
situation of the learning environment. Approximately half of the participant in this survey
mentioned that the learning environment in which they work is suitable for competence oriented
learning. But the other half has doubts about that. In the framework we need to take in consideration
that the framework will only work if all learning environments are suitable for CBL. Another
important point is the lack of assessment of the teacher abilities in case of competency based
education. More than 65% of the respondents indicate that they are not assessed for their abilities.
In the sample of respondents is a high need for training in themes applied throughout competences,
i.e. critical thinking, problem solving, decision taking etc. Beside that they need more training in
teaching methods fostering competence based learning, like project based learning, action based
learning etc. They also have a high need for more training in the assessment of competencies. They
have insufficient knowledge and skills in the specific tools for assessing competencies and the
different approaches and objectives related to competencies assessment. To fulfil these needs, it is
important to account for giving best practices in the field of competency-based curriculum.
The training framework should also contain activities like: how to create a work and learning
environment for teachers to allow them in developing competency based teaching skills, how to
promote competency based teaching among teaching staff, how to acquire the necessary teaching
skills for competency based teaching and required teachers’ skills in competency based teaching.
Adding these four needs in the training framework is of importance.
There is a certain trend in the results of the survey. The participants in this survey mentioned that
they don’t have the possibilities to adjust CBL in the current educational setting. For that reason
they pointed a lot of different training needs within the upcoming workshops. From practical
assignments to good practices to self-assessment and interaction with peer teachers and /social
networking opportunities.

N°. 528005-LLP-1-2012-1-GR-COMENIUS-CMP - TRANSIt
D2.1 Needs Analysis Report 106/119
9 References
Biemans, H., Nieuwenhuis, L., Poell, R., Mulder, M., Wesselink, R. (2005). Competency-based
VET in the Netherlands: background and pitfalls. BWP, 7, 1-14.
Certificate Informatique et Internet (2012). French Competency Framework – Computing and
Internet Certificate for teachers. MINES – DGESIP
Civilservice (2012). Civil Service Competency Framework 2012-2017. Retrieved 31 October 2013,
from http://www.civilservice.gov.uk/wp-content/uploads/2011/05/Civil-Service-Competency-
Framework-Jan2013.pdf
ETQF (2010). The eTQF Teacher ICT Competency Framework.
European Institute for E-Learning (2006). The eLearning Competency Framework for Teachers and
Trainers.
Grün, G., Tritscher-Archan, S., Weiss, S. (2009). Guidelines for the Description of Learning
Outcomes. Retrieved 30 August 2013, from http://ibw4.m-
services.at/zoom/pdf/wp2/Guidelines_EN_final_2.pdf
Hooker, M., Mwiyeria, E., Verma, A. (2011). Tanzanian ICT Competency Framework for
Teachers.
Linstone, H., & Turoff, M. (1975). The Delphi Method: Techniques and Applications. Addison-
Wesley, Reading: MA.
Okoli, C., Pawlowski, S.D. (2004). The Delphi Method as a Research Tool: An Example, Design
Considerations and Applications. Information & Management, 42 (1), 15-29.
Rowe, G., Wright, G. (1999). The Delphi technique as a forecasting tool: issues and analysis.
International Journal of Forecasting, 15, 353-375.
Skulmoski, G.J., Hartman, F.T., Krahn, J. (2007). The Delphi Method for Graduate Research.
Journal of Information Technology Education, 6, 1-21.
United Nations Educational, Scientific and Cultural Organization (2011). UNESCO ICT
Competency Framework for Teachers. Paris: UNESCO and Microsoft 2011

N°. 528005-LLP-1-2012-1-GR-COMENIUS-CMP - TRANSIt
D2.1 Needs Analysis Report 107/119
Annex A: Questionnaire Form
TRANSIt: Questionnaire for needs analysis on competency based learning and education
Introduction
Dear teacher/student,
The aim of our project is to help teachers acquire and reinforce such skills and knowledge so that
they can design cross-curricular activities that support the key competency acquisition (KCA) of
their students. In this context, it is necessary to gain understanding of the needs related to
competency based learning, teaching and assessment.
To that end, we would kindly like to ask you to fill in this questionnaire. It should take no more
than 15 minutes of your time and it will greatly help us in our goal.
All information provided by you will only be used to the development of the TRANSIt training
framework aimed to fit your needs and will be treated with confidentiality.
Thank you very much for your help!
The TRANSIt Project Team
Background information
The main aims of the TRANSIt project are:
- to help teachers acquire and reinforce skills and knowledge to design cross-curricular activities
that support the development of key competencies by their students;
- to support teachers in the process of assessing competencies with the use of e-portfolios;
- to raise school administrative staff awareness to support teachers in bridging the gap between
policy and practice (e.g. curricular reforms in order to support cross-curricular competency
driven activities);
- to promote teacher collaboration with colleagues, in order to become innovation leaders in their
institutions.
Key Competencies
The European Framework for Key competencies for Lifelong Learning identifies 8 key
competencies necessary for personal fulfilment, active citizenship, social inclusion and
employability in a knowledge society.
1. Communication in the mother tongue;
2. Communication in foreign languages;
3. Mathematical competency and basic competencies in science and technology;
4. Digital competency;
5. Learning to learn;
6. Social and civic competencies;
7. Sense of initiative and entrepreneurship;
8. Cultural awareness and expression.

N°. 528005-LLP-1-2012-1-GR-COMENIUS-CMP - TRANSIt
D2.1 Needs Analysis Report 108/119
1 User profile
1.1 Gender Male Female
1.2 Age 18-24
25-30
31-40
41-55
>55
1.3 Role subject(s) Teacher (Primary education: students age 6-10) _______________
Teacher (Secondary education: students age 10-17) _______________
Teacher student/Pre-service Teacher _______________
School leader _______________
Teachers’ trainer _______________
Curriculum developer _______________
Educational Policy Maker
Other _______________
1.4 For how many years have you been in this profession?
0 - 2 years
3 - 5 years
6 - 10 years
11 - 15 years
More than 15 years
1.5 Country Austria
Netherlands
France
Greece
Ireland
Spain
Other please specify _______________
1.4 Qualification level Initial teacher education
Bachelor
Master
Phd
1.5 Profile. How would you characterize yourself?
early adopter, enthusiastic with ICT
sceptical, if put in a digital environment I try to use the tools
cautious, trying to avoid the use of digital tools and TEL pedagogies as much as I can
1.6 Have you taken part in continuing professional development activities on the theme of competency
acquisition?
yes
no
If yes: How would you describe the main objectives and topics of such training activities?

N°. 528005-LLP-1-2012-1-GR-COMENIUS-CMP - TRANSIt
D2.1 Needs Analysis Report 109/119
2 Current practice
In this part of the form, current practice questions are asked regarding various topics on teaching key
competencies. On most of the topics you will find a list of statements or items. Please indicate to what extent
these statements or items apply to you. You may do so by scoring the statements or items with a score
ranging from 1- 5.
2.1 Describe your experience in teaching:
1
(none)
2
(only in
university
courses)
3
(less than
1 year)
4
(between
1 and 3
years)
5
(More than
3 years)
Digital competency Learning to learn Social and civic competencies competencies about sense of initiative and
entrepreneurship
Cultural awareness and expression
2.2 Please tell us in a few sentences what general steps you take when you plan a cross-curricular
lesson that promotes key competency acquisition of your students.
2.3 Didactics and teaching methods
If you are a teacher: Indicate to what extent you have been using the following didactics and methods:
If you are not a teacher: Indicate to what extent the following didactics and methods are being used in
your school/country:
1
never
2
…
3
regularly
4
…
5
each lesson
(Sub)group activities
Interviewing experts, peers or others
Classroom instruction
Search assignments
Discussion and debating
Project-based learning
Problem-based learning
Action learning (e.g. creating an artifact)
Storyline
Guided discovery Reflection on learning
Reflection on collaboration
Other (please specify):
2.4 How often do you use the following technologies during the planning and implementation of
competency based learning?
1
never
2
…
3
regularly
4
…
5
each lesson
OER resources
Productivity tools (word processors,

N°. 528005-LLP-1-2012-1-GR-COMENIUS-CMP - TRANSIt
D2.1 Needs Analysis Report 110/119
presentation software)
Information searching tools (web browsers;
online databases; WebQuests)
Basic communication tools (video-
conferencing/instant messaging, Email)
Multimedia tools (graphics software)
Off-the-shelf educational software (drill and
practice software, tutorials)
Specific learning tools (visualization, data
analysis, role-play simulations, mind maps)
3D virtual environments
Web2.0 (blogs, wikis, podcasts, social
networks)
e-portfolios
Software authoring tools
Synchronous/asynchronous e-learning
technologies
Learning management tools (LMS)
Gaming
Other (please specify):
2.5 Do you experience constraints when planning competency based teaching? If yes, what are these
constraints (e.g. constraints relating to resources, class size, time, knowledge and experience, or
school’s priority is low)?
2.6 Assessment
To what end assessment tools are usually being applied at your school?
1
never
2
…
3
regularly
4
…
5
each lesson
To improve student learning
To gain (as a teacher) information about the
progress in student performance
To support and engage students in
reviewing their own learning
To assess student performance
Other (please specify):
2.7 Assessment
If you are a teacher: Please indicate to what extent you have used the following assessment
tools/methods
If you are not a teacher: Please indicate to what extent the following assessment tools are being used at
your school/country
1
never
2
…
3
regularly
4
…
5
each lesson
Paper and pencil test
Computer assignment
Simulation
e-Portfolio
Role play
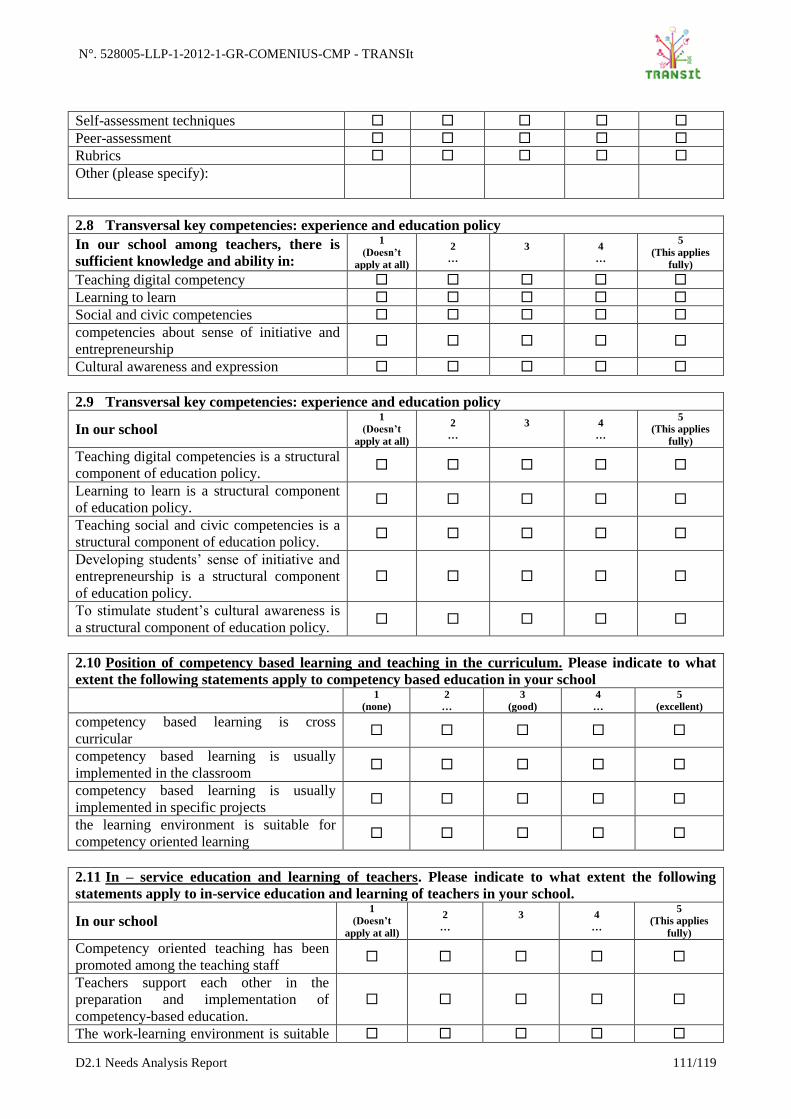
N°. 528005-LLP-1-2012-1-GR-COMENIUS-CMP - TRANSIt
D2.1 Needs Analysis Report 111/119
Self-assessment techniques
Peer-assessment
Rubrics
Other (please specify):
2.8 Transversal key competencies: experience and education policy
In our school among teachers, there is
sufficient knowledge and ability in:
1
(Doesn’t
apply at all)
2
…
3
4
…
5
(This applies
fully)
Teaching digital competency
Learning to learn
Social and civic competencies
competencies about sense of initiative and
entrepreneurship
Cultural awareness and expression
2.9 Transversal key competencies: experience and education policy
In our school 1
(Doesn’t
apply at all)
2
…
3
4
…
5
(This applies
fully)
Teaching digital competencies is a structural
component of education policy.
Learning to learn is a structural component
of education policy.
Teaching social and civic competencies is a
structural component of education policy.
Developing students’ sense of initiative and
entrepreneurship is a structural component
of education policy.
To stimulate student’s cultural awareness is
a structural component of education policy.
2.10 Position of competency based learning and teaching in the curriculum. Please indicate to what
extent the following statements apply to competency based education in your school
1
(none)
2
…
3
(good)
4
…
5
(excellent)
competency based learning is cross
curricular
competency based learning is usually
implemented in the classroom
competency based learning is usually
implemented in specific projects
the learning environment is suitable for
competency oriented learning
2.11 In – service education and learning of teachers. Please indicate to what extent the following
statements apply to in-service education and learning of teachers in your school.
In our school 1
(Doesn’t
apply at all)
2
…
3
4
…
5
(This applies
fully)
Competency oriented teaching has been
promoted among the teaching staff
Teachers support each other in the
preparation and implementation of
competency-based education.
The work-learning environment is suitable

N°. 528005-LLP-1-2012-1-GR-COMENIUS-CMP - TRANSIt
D2.1 Needs Analysis Report 112/119
for competency-based education.
Teachers’ abilities in competency based
teaching are assessed.
2.12 Does your school support:
1
none
2
low
3
sufficient
4
high
Hardware provision
Software provision
Internet access
Database with learning and teaching material
Continuing professional development
3 Questions about training needs
In this part of the form you are asked to indicate to what extent you feel the need to learn more on the topics
related to competency based learning, teaching and assessment.
3.1 Philosophy/didactics and teaching methods
1
Low need
2
…
3
4
…
5
High need
Societal and anthropological views
underlying the concept of competency
based learning
Learning theories on competency based
learning and teaching (e.g.
constructivism)
Teaching methods fostering competency
based learning (project based, action
learning, problem oriented learning,
narrative approach)
Themes applied throughout
competencies: critical thinking,
creativity,
initiative, problem solving, risk
assessment, decision taking, and
constructive management of feelings
3.2 Assessment
1
Low need
2
…
3
4
…
5
High need
Approaches and objectives related to
competencies assessment
Specific tools for assessing competencies
3.3 School curricula
1
Low need
2
…
3
4
…
5
High need
Characteristics of competency based
curricula (features of competency based
school and learning environments)
3.4 In case you are not a teacher: Professional development of teachers
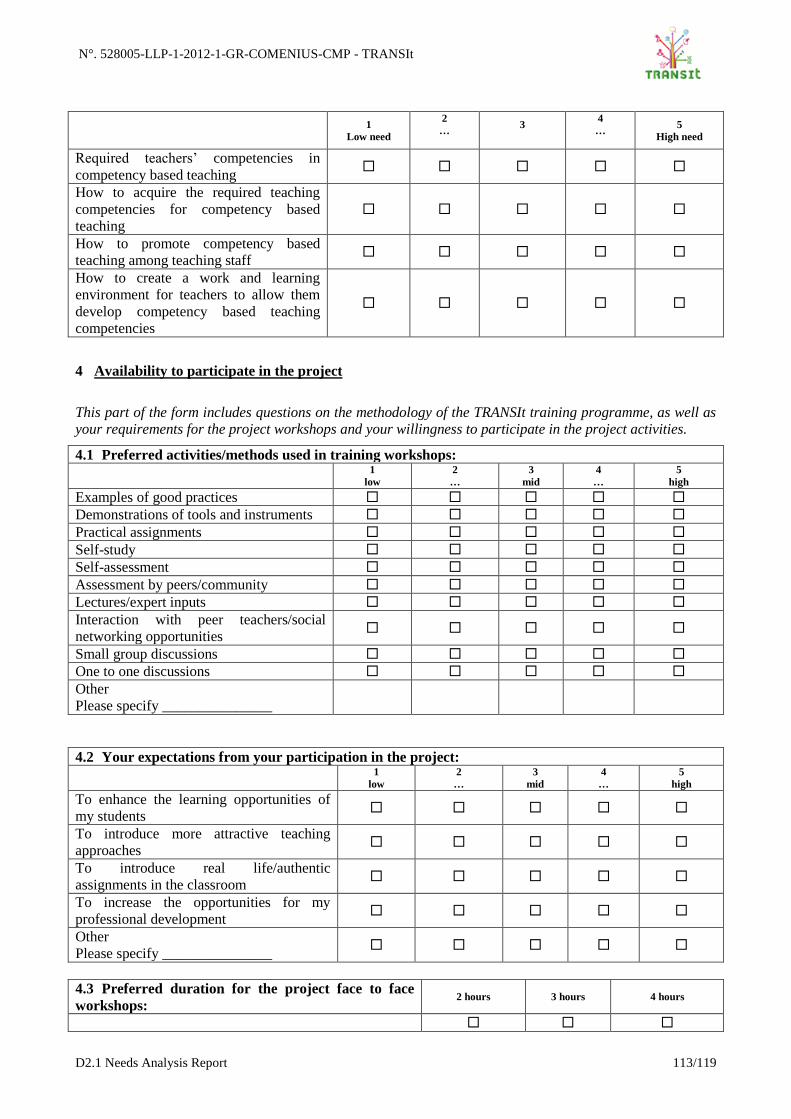
N°. 528005-LLP-1-2012-1-GR-COMENIUS-CMP - TRANSIt
D2.1 Needs Analysis Report 113/119
1
Low need
2
…
3
4
…
5
High need
Required teachers’ competencies in
competency based teaching
How to acquire the required teaching
competencies for competency based
teaching
How to promote competency based
teaching among teaching staff
How to create a work and learning
environment for teachers to allow them
develop competency based teaching
competencies
4 Availability to participate in the project
This part of the form includes questions on the methodology of the TRANSIt training programme, as well as
your requirements for the project workshops and your willingness to participate in the project activities.
4.1 Preferred activities/methods used in training workshops:
1
low
2
…
3
mid
4
…
5
high
Examples of good practices
Demonstrations of tools and instruments
Practical assignments
Self-study
Self-assessment
Assessment by peers/community
Lectures/expert inputs
Interaction with peer teachers/social
networking opportunities
Small group discussions
One to one discussions
Other
Please specify _______________
4.2 Your expectations from your participation in the project:
1
low
2
…
3
mid
4
…
5
high
To enhance the learning opportunities of
my students
To introduce more attractive teaching
approaches
To introduce real life/authentic
assignments in the classroom
To increase the opportunities for my
professional development
Other
Please specify _______________
4.3 Preferred duration for the project face to face
workshops: 2 hours 3 hours 4 hours

N°. 528005-LLP-1-2012-1-GR-COMENIUS-CMP - TRANSIt
D2.1 Needs Analysis Report 114/119
4.4 Preferred training times for the project workshops:
1
low
2
…
3
mid
4
…
5
high
Weekends
Evenings
During the working day
Other
Please specify _______________
5 Impressions from the workshop: Bringing competency based learning to my classroom
5.1 What aspects did you like about the presentation of educational resources/scenarios in this
workshop? Was the case presented inspiring and helpful for you? Why?
5.2 How would you adapt such a scenario to your teaching? What kind of help/training would you
need?
Thank you for your collaboration!

N°. 528005-LLP-1-2012-1-GR-COMENIUS-CMP - TRANSIt
D2.1 Needs Analysis Report 115/119
Annex B: Delphi Study questions
Structure of the first round in the Delphi study
The structure of the Delphi study will be as follows:
1st round: Interviews with teachers and student teachers from primary and secondary
schools. These interviews can be held either online (Skype) or offline (face-to-face). The
interview scheme will consist of the following open-ended questions (based on the needs
analysis questionnaire, Annex A).
o What are your experiences with competency based teaching?
o What competencies do students need within the contemporary education?
o What didactics and methods do you use in competency based teaching?
o If you have experience with competency based teaching, have you ever used various
technologies in the planning and implementation of competency based teaching? If yes,
what kind of technologies did you use?
o Did you assess the competencies of students? How?
o To what extent do you think that there is sufficient knowledge to provide competency-
based education?
o Do you face any limitations when planning competency based education? What are the
limitations? (e.g. restrictions regarding resources, group size, time, knowledge and
experience, or lack of support from the school)
o If you need training in competency based teaching, what should be treated during these
trainings?
o Are you willing to participate in training for improving your competency based teaching
skills?
2nd
round: Questionnaire with closed questions to find consensus about the needs. These
questionnaires were distributed online. The questionnaire scheme consists of the closed
questions based on the questionnaire (Annex A: Questionnaire Form) and of the results in
the first round.

N°. 528005-LLP-1-2012-1-GR-COMENIUS-CMP - TRANSIt
D2.1 Needs Analysis Report 116/119
Annex C: Delphi Interviews conducted
Date: 23.06.2013
Offline (Skype, phone)
What are your experiences with giving competence based teaching?
As a teacher trainer and educational training facilitator I mainly work with teachers or trainers in the
field of the educational use of digital resources and blended-learning approaches enabled through
competency based learning. The most consistent experience is that teachers often have problems to
design competence based teaching activities; they can either not turn theory into practical learning
activities or don’t know how to follow an instructional teaching design. I have also observed that
teachers who were mainly educated in a knowledge-gaining education system are less familiar with
the whole concept of competence based learning than their students are. Or in other words the
students use social web tools to create their own e-Content and to design their own activities while
teachers are often more orientated towards the learning outcomes and not the learning process.
What competencies do students need within the contemporary education?
Students need to be better prepared for the highly-specified job market which requires the
acquaintance of a broad range of very specific competencies (job market preparation).
Digital competencies are gaining more and more and more importance. Students need to learn how
to use and reflect on new media and social web tools.
Critical thinking, problem-solving, analytical, reasoning, and reflection skills are very important on
cross-curricular level.
Social and collaborative competencies are necessary for the social development of the students and
facilitate competence based learning.
In my opinion creative competences should be highlighted as they further the understanding of
process orientated learning (individual, creative learning approaches).
What didactics and methods do you use in competence based teaching?
Instructional Design Approaches
Five principles of instruction (Merrill, 2002):
Analysis
Design
Development
Implementation
Evaluation
Didactical methods:
- Collaborative working techniques (i.e. collaborative writing, story writing)
- Interdisciplinary methods
- Project work and project planning methods (To-Do Lists, PM-tools)

N°. 528005-LLP-1-2012-1-GR-COMENIUS-CMP - TRANSIt
D2.1 Needs Analysis Report 117/119
- Use of web tools (research and collaborative techniques)
If you have experience with competence based teaching, have you ever used various
technologies in the planning and implementation of competence based teaching? If yes,
what kind of technologies did you use?
Social web tools:
Wikis for collaborative learning
Google Drive
Google+, Facebook
Online Platforms:
LMS, i. e. Moodle for group work, for assessing the learning outcomes
Educational Online repositories (www.osrportal.eu)
Did you assess the competencies of students? How?
I have used or developed evaluation criteria depending on the competency; the students and the
learning design. Important is that each student/learner can present his/her learning outcomes and
receives feedback from the teacher and other learners.
To what extent do you think that there is sufficient knowledge to provide competence-based
education?
As mentioned earlier (1st question), I think that teachers need more training particularly in
instructional design methodologies.
If you have any limitations when planning competence based education? What are the
limitations (e.g. Restrictions regarding resources, group size, time, knowledge and
experience, or lack of support from the school)
There are currently two contradictory EU-wide developments, the fostering of individualized
learning, of competence based learning on one side and a standardization of curricula on the other
side. The second disables competency based teaching. Well designed and implemented CBL
activities require a lot of time. Currently there are very few well designed learning activities
/scenarios available, which consequently demand a lot of development efforts from teachers.
Teachers still lack the necessary competencies to conduct CBL activities and are often
overwhelmed by the complexity of the approach.
If you need training in competence based teaching, what should be treated during these
trainings?
As already mentioned I believe that teachers need to understand the whole process of CBL. In my
opinion they should be trained in using one or two instructional learning design theories to gain an
understanding for the process and its practical implementation rather than learning how to teach
single competencies.
Are you willing to participate in training for improving your competence based teaching
skills?
Yes.

N°. 528005-LLP-1-2012-1-GR-COMENIUS-CMP - TRANSIt
D2.1 Needs Analysis Report 118/119
Date: 23.06.2013
Offline (Skype, phone)
What are your experiences with giving competence based teaching?
I am teacher (in leave) and teachers trainer for “Self-directed learning” (partly based on the
approach of Klippert, see http://www.bmukk.gv.at/medienpool/15601/mat_eva.pdf and
http://homepage.univie.ac.at/rudolf.beer/Eigenverantwortliches_Arbeiten_und_Lernen_nach_Heinz
_Klippert_2008.pdfm, but adapted to my own needs) which is a didactic approach to fosters
personal responsibility and autonomy in learning. Student´s activity is in the foreground and the
teacher arranges activity-oriented learning situation and acts himself as mentor and coach. Students
work in different team-constellations and use varying methods to plan and work out their tasks.
What competencies do students need within the contemporary education?
It is not easy to define, students need to be flexible and able to solve problem-oriented tasks so they
need all competences that enable them to find their individual “problem-solving style”: this means
for example to be competent in analysing the given tasks, in planning ways to find solutions, in
organizing the workflow, in researching and extracting relevant information and in presenting the
results in an adequate manner. Further it is indispensable that students are able to cooperate with
others in an efficient and agreeable way.
What didactics and methods do you use in competence based teaching?
- different types of collaboration and communication techniques
- visualization techniques
- presentation techniques
- self-reflection and feedback
- “learning spirals” (specific arrangements that combine individual work and teamwork)
- Research techniques
- Creative techniques (e.g. role play, creative writing)
If you have experience with competence based teaching, have you ever used various
technologies in the planning and implementation of competence based teaching? If yes,
what kind of technologies did you use?
Yes, see answer point 3
Did you assess the competencies of students? How?
It is hard to find an adequate way to do so, because it is hard to define “this student is competent to
this or that degree”. I tried out and adapted diverse “monitoring grids” based on my own
experiences – but in most cases self-assessment of students was an integral part of grading.
To what extent do you think that there is sufficient knowledge to provide competence-based
education?
I am not able to judge this…..

N°. 528005-LLP-1-2012-1-GR-COMENIUS-CMP - TRANSIt
D2.1 Needs Analysis Report 119/119
If you have any limitations when planning competence based education? What are the
limitations (e.g. Restrictions regarding resources, group size, time, knowledge and
experience, or lack of support from the school)
In most cases time is the restriction: problem-solving learning arrangements and self-directed
learning require time and sometimes the “overload of the curriculum” is hard to handle.
If you need training in competence based teaching, what should be treated during these
trainings?
How to assess competences is the most crucial aspect for me, this is really hard to do. Further I
would like to learn more about creative learning techniques.
Are you willing to participate in training for improving your competence based teaching
skills?
That depends on what the training program comprises….
Related Documents


![SESAR 2020 - 763601 - D2.1 - Scenarios and Requirements · SESAR 2020 - 763601 - D2.1 - Scenarios and Requirements DeliverableID [D2.1] ProjectAcronym DroC2om Grant: 763601 Call:](https://static.cupdf.com/doc/110x72/603a54b6ac67ff69d9242d39/sesar-2020-763601-d21-scenarios-and-requirements-sesar-2020-763601-d21.jpg)