Online Appendix: Not For Publication Asker, Collard-Wexler and De Loecker D ONLINE Appendix to Dynamic Inputs and Resource (Mis)Allocation - Not For Publication This section gives additional tables and figures that provide the details behind com- ments made in footnotes and text. Some tables are also provided merely to give more detail to the interested reader. The majority of the appendix is devoted to robustness and further detail regarding the analysis of the World Bank data contained in Section 5. Below, we list the figures and tables, with a brief description and a reference to the sections of the paper that they supplement. • Figure D.1 shows simulation results for the standard deviation in the change in MRPK, using the same parameters used to create Figure 1 in the paper. This set of results are described to in Subsection 3.3.2 in discussing the results in Table 7. • Table D.1 shows the S 2 measure of fit for the model in capturing the standard deviation in the change in capital, for Tier 1 countries. This is described in footnote 36 of the paper. • Table D.2 shows the S 2 measure of fit for the model in caputuring dispersion in MRPK, under alternative AR(1) specifications which include firm fixed e↵ects. Including the fixed e↵ects can change the estimates of ⇢ and σ in the AR(1) somewhat, and we show robustness to these alternate estimates. By Theorem 1, the model predictions, conditional on the ⇢ and σ, are una↵ected by the inclusion of firm FE’s. These results are described in footnote 27 of the paper. • Tables D.4 and D.3 report the results of a barrage of robustness checks on the correlation between dispersion in MRPK and TFPR volatility reported in Table 11 in section 5 of the paper, using the World Bank data. These robustness tests are briefly described in footnote 38 of the paper. • Tables D.5 and D.6: In order to test whether our results from the World Bank data (WBES) could be plagued by remaining measurement error, we follow Hsieh and Klenow (2009) and relate our measure of productivity to decision variables that plausibly have little room for measurement error. Regardless of the ultimate hypothesized source of measurement error, if measured TFPR were mere measurement error, we would not expect actual behavior to be correlated with measured TFPR. 1 With this in mind, we ran a probit with an indicator for positive investment as the dependent variable, and TFPR, log capital and country fixed e↵ects as the explanatory variables. See Table D.5. The average marginal e↵ect on TFPR was estimated to be 0.11 with a standard error of 0.01, making it significant at better than one percent. The pseudo-R-squared was 0.16. We also ran an OLS regression with the log investment to capital ratio as the dependent variable, and (again) TFPR, log capital and country fixed e↵ects as the explanatory variables (using the World Bank data). See Table D.6. The coefficient on productivity was 0.34, again significant at better than one percent. The R-squared was 0.12. We also ran the same regression with just log investment as the dependent variable, with no change in results. The indicator for positive investment is likely to be well measured and is pos- itively, and significantly, correlated with productivity. The log investment to 1 A plausible specification for measurement error would be to add an i.i.d. shock to measured TFPR of the form: ! ⇤ it = ! it + ✏ it . Notice that for the issue of dynamic inputs, it is irrelevant if these i.i.d. shocks ✏ it are measurement error, or real shocks that are revealed after a firm has chosen inputs. In either case, ✏ it will not be part of the firm’s state variables when making investment decisions. Thus it will be difficult to separate transitory shocks to TFPR from i.i.d. measurement error, as these generate identical behavior (with the exception that true shocks have an impact on profits, since they enter in a non-linear way). Clearly, the dispersion of marginal products generated by these error shocks is irrelevant for welfare. 1

Welcome message from author
This document is posted to help you gain knowledge. Please leave a comment to let me know what you think about it! Share it to your friends and learn new things together.
Transcript

Online Appendix: Not For Publication Asker, Collard-Wexler and De Loecker
D ONLINE Appendix to Dynamic Inputs and
Resource (Mis)Allocation- Not For Publication
This section gives additional tables and figures that provide the details behind com-ments made in footnotes and text. Some tables are also provided merely to give moredetail to the interested reader. The majority of the appendix is devoted to robustnessand further detail regarding the analysis of the World Bank data contained in Section5.
Below, we list the figures and tables, with a brief description and a reference to thesections of the paper that they supplement.
• Figure D.1 shows simulation results for the standard deviation in the change inMRPK, using the same parameters used to create Figure 1 in the paper. This setof results are described to in Subsection 3.3.2 in discussing the results in Table 7.
• Table D.1 shows the S
2 measure of fit for the model in capturing the standarddeviation in the change in capital, for Tier 1 countries. This is described infootnote 36 of the paper.
• Table D.2 shows the S
2 measure of fit for the model in caputuring dispersion inMRPK, under alternative AR(1) specifications which include firm fixed e↵ects.Including the fixed e↵ects can change the estimates of ⇢ and � in the AR(1)somewhat, and we show robustness to these alternate estimates. By Theorem 1,the model predictions, conditional on the ⇢ and �, are una↵ected by the inclusionof firm FE’s. These results are described in footnote 27 of the paper.
• Tables D.4 and D.3 report the results of a barrage of robustness checks on thecorrelation between dispersion in MRPK and TFPR volatility reported in Table11 in section 5 of the paper, using the World Bank data. These robustness testsare briefly described in footnote 38 of the paper.
• Tables D.5 and D.6: In order to test whether our results from the World Bankdata (WBES) could be plagued by remaining measurement error, we follow Hsiehand Klenow (2009) and relate our measure of productivity to decision variablesthat plausibly have little room for measurement error.Regardless of the ultimate hypothesized source of measurement error, if measuredTFPR were mere measurement error, we would not expect actual behavior to becorrelated with measured TFPR.1
With this in mind, we ran a probit with an indicator for positive investment asthe dependent variable, and TFPR, log capital and country fixed e↵ects as theexplanatory variables. See Table D.5. The average marginal e↵ect on TFPR wasestimated to be 0.11 with a standard error of 0.01, making it significant at betterthan one percent. The pseudo-R-squared was 0.16.We also ran an OLS regression with the log investment to capital ratio as thedependent variable, and (again) TFPR, log capital and country fixed e↵ects asthe explanatory variables (using the World Bank data). See Table D.6. Thecoe�cient on productivity was 0.34, again significant at better than one percent.The R-squared was 0.12. We also ran the same regression with just log investmentas the dependent variable, with no change in results.The indicator for positive investment is likely to be well measured and is pos-itively, and significantly, correlated with productivity. The log investment to
1A plausible specification for measurement error would be to add an i.i.d. shock to measured TFPR ofthe form: !
⇤it = !it + ✏it. Notice that for the issue of dynamic inputs, it is irrelevant if these i.i.d. shocks
✏it are measurement error, or real shocks that are revealed after a firm has chosen inputs. In either case, ✏itwill not be part of the firm’s state variables when making investment decisions. Thus it will be di�cult toseparate transitory shocks to TFPR from i.i.d. measurement error, as these generate identical behavior (withthe exception that true shocks have an impact on profits, since they enter in a non-linear way). Clearly, thedispersion of marginal products generated by these error shocks is irrelevant for welfare.
1

Online Appendix: Not For Publication Asker, Collard-Wexler and De Loecker
capital ratio, while arguably more prone to measurement error, displays the samepattern. This constitutes evidence that plausibly well-measured decision variablesare correlated with productivity.
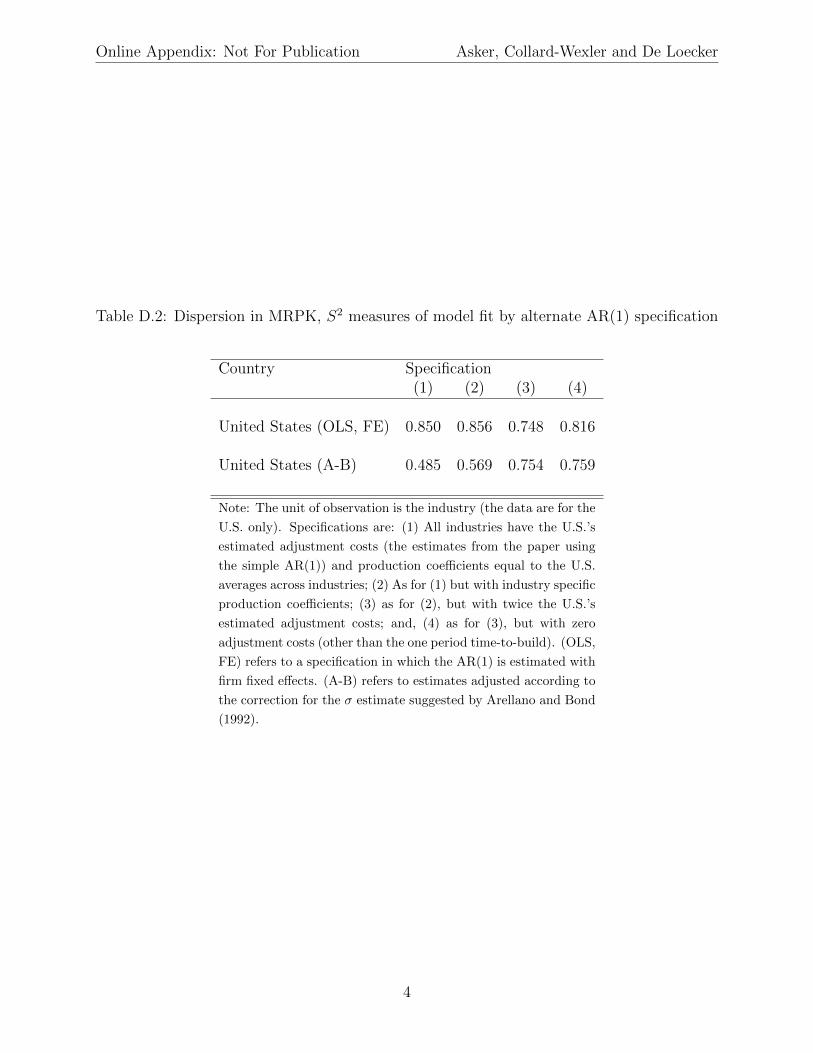
• Tables D.7 and D.8 report the AR(1) estimates that are used in Section 5.3 tocomputed the model predictions for the WBES sample. Specification (5) in TableD.7 (equiv. Table D.8) are the primary estimates of interest.
• Table D.9 reports the country specific production coe�cients for the WBES sam-ple.
Figure D.1: Volatility and Change in MRPK: Model Simulations
0
1
2
3
4
5
0.1 0.19 0.28 0.37 0.46 0.55 0.64 0.73 0.82 0.91 1 1.09 1.18 1.27 1.36
Dis
pers
ion
in !
MR
PK
Productivity volatility
Notes: Volatility is the �c term in the AR(1) process. Values used in this simulation are: ✏ = �4, � =
10%,� = 11+0.065 ,�K = 0.12,�M = 0.40,�L = 0.23, CF
K = 0.09, CQK = 8.8,� = 1, µ = 0, ⇢c 2
{0.65, 0.85, 0.94},�C 2 [0.1, 1.4]. We use the means in the U.S. Census Data to get our �’s and use es-
timates of adjustment costs for the United States discussed in Section 4.
2

Online Appendix: Not For Publication Asker, Collard-Wexler and De Loecker
Table D.1: Stds
(�k), S2 measures of model fit by specification
Country Specification(1) (2) (3) (4) (5)
United States 0.769 0.921 0.921 0.836 -17.902
France 0.577 0.977 0.568 0.459 0.899Chile 0.948 0.957 0.935 0.790 -7.113India 0.825 0.908 0.8019 0.679 -5.239Mexico 0.575 0.773 0.503 0.377 0.667Romania 0.542 0.952 0.476 0.303 0.214Slovenia 0.552 0.982 0.552 0.416 0.521Spain 0.640 0.902 0.613 0.494 -0.051
All (ex U.S.) 0.599 0.919 0.566 0.432 0.067All 0.619 0.919 0.608 0.480 -2.045
Note: The unit of observation is the country-industry. Specifications are: (1)
All countries have the U.S.’s estimated adjustment costs and production coe�-
cients equal to the U.S. averages across industries; (2) Industry-country specific
production coe�cients (except for Slovenia see section 3.1.2), country specific ad-
justment costs, industry-country specific AR(1); (3) as for (2), but with the U.S.’s
estimated adjustment costs for all countries; (4) as for (3), but with twice the
U.S.’s estimated adjustment costs for all countries; and, (5) as for (3), but with
zero adjustment costs (other than the one period time-to-build) for all countries.
In all specifications, the AR(1) is estimated using TFPR computed using the pro-
duction coe�cients used in the model specification.
3
Online Appendix: Not For Publication Asker, Collard-Wexler and De Loecker
Table D.2: Dispersion in MRPK, S2 measures of model fit by alternate AR(1) specification
Country Specification(1) (2) (3) (4)
United States (OLS, FE) 0.850 0.856 0.748 0.816
United States (A-B) 0.485 0.569 0.754 0.759
Note: The unit of observation is the industry (the data are for the
U.S. only). Specifications are: (1) All industries have the U.S.’s
estimated adjustment costs (the estimates from the paper using
the simple AR(1)) and production coe�cients equal to the U.S.
averages across industries; (2) As for (1) but with industry specific
production coe�cients; (3) as for (2), but with twice the U.S.’s
estimated adjustment costs; and, (4) as for (3), but with zero
adjustment costs (other than the one period time-to-build). (OLS,
FE) refers to a specification in which the AR(1) is estimated with
firm fixed e↵ects. (A-B) refers to estimates adjusted according to
the correction for the � estimate suggested by Arellano and Bond
(1992).
4

Online Appendix: Not For Publication Asker, Collard-Wexler and De Loecker
Table D.3: WBES Robustness Checks: Productivity Measurement
Dep. Var.: Dispersion of MRPK Coe↵. on Std.(!it
� !
it�1)Baseline 0.67**
(0.21)Firm-Level Input Shares 0.47*
(0.23)Less Elastic Demand (✏ = 2) 0.65**
(0.18)More Elastic Demand (✏ = 6) 0.69***
(0.15)Productivity Estimated via OLS 0.77***(with industry-country fixed e↵ects) (0.13)Drop top and bottom decile for each country 1.10***
(0.22)Interquartile Range 0.54**
(0.16)
Note: All regressions share a common specification: yit = constant + Std.(!it � !it�1). We use a
weighted OLS with weights equal to the number of firms per country. ‘Baseline’ refers to specification I
of panel A in Table 11. ‘Firm-Level Input Shares’ uses firm-level labor and material shares to compute
firm-level production function coe�cients �it. ‘Less and More Elastic’ computes productivity assuming
either ✏ = 2 or ✏ = 6 (the results in the Baseline specification assume ✏ = 4). ‘Productivity estimated
via OLS’ computes production function coe�cients as the coe�cients of an OLS regression of log sales
on log labor, materials and capital. These coe�cients are allowed to vary by country-industry pair, and
include a country-industry specific intercept. ‘Interquartile Range’ computes the dependent variables as
interquartile ranges rather than standard deviations.
5

Online Appendix: Not For Publication Asker, Collard-Wexler and De Loecker
Table D.4: WBES Robustness Checks: Sample Composition
Dependent Variable: MRPK Dispersion(1) (2) (3) (4) (5)
Standard Deviation of 0.667*** 0.436* 0.684*** 0.180 0.497*Change in TFPR (0.170) (0.165) (0.168) (0.542) (0.201)
Constant 0.781*** 0.851*** 0.769*** 1.022*** 0.833***(0.098) (0.098) (0.097) (0.213) (0.096)
All XManufacturing Only XMore than 10 workers XMore than 50 workers XFactor Share for Materials and Labor Xin 10-90 percentile
r
2 0.33 0.21 0.39 0.01 0.22F-stat 15.38 7.02 16.51 0.11 6.13Countries 33 29 28 12 24Firm-level Observations 5563 3872 4801 2909 3667
Note: Standard errors clustered by country. Factor Share for Materials and Labor dropsfirms whose factor shares for materials or labor are outside the 10-90th percentile across allfirms in the WBES data.
Table D.5: WBES, Positive Investment and TFPR
Dep. Var.: Positive Investment Indictator(1) (2) (3)
TFPR 0.11*** 0.05*** 0.05***(0.01) (0.01) (0.01)
Log Capital 0.04*** 0.04***(0.00) (0.00)
Country FE XCountry-Industry FE XFirm-level Observations 5532 5532 5388Countries 32 32 32
Note: Marginal E↵ects from a Probit are reported.Fixed-e↵ects implemented by estimating countrydummies, and country-industry dummies. Resultsfrom a conditional logit produce similar coe�-cients. The number of countries is 32, due to thefact that the Peruvian data in the WBES reportszero investment for all firms.
6

Online Appendix: Not For Publication Asker, Collard-Wexler and De Loecker
Table D.6: WBES, Investment and TFPR
Dep. Var.: Log Investment to Capital Ratio Log Investment(1) (2) (3) (4)
TFPR 0.34*** 0.24** 0.34*** 0.24**(0.09) (0.07) (0.09) (0.07)
Log Capital -0.30*** -0.33*** 0.70*** 0.67***(0.04) (0.03) (0.04) (0.03)
Country-Industry FE X XFirm-level Observations 2740 2740 2740 2740Country 32 32 32 32R-Squared .12 .19 .62 .65
Note: The number of countries is 32, due to the fact that the Peruvian data in theWBES reports zero investment for all firms. Firms with zero investment are notincluded.
7
Online Appendix: Not For Publication Asker, Collard-Wexler and De Loecker
Table D.7: Time series process, AR(1), for productivity: Using the World Bank data
Dependent Var: Productivity !it (1) (2) (3) (4) (5)
!it�1 0.88*** 0.92*** 0.79** 0.91*** 0.91***(0.05) (0.12) (0.30) (0.04) (0.04)
(!it�1) •(Country Dummy) X XVar. 0.07 0.16
!
2it�1 0.13* 0.15
(0.06) (0.14)!
3it�1 -0.04** -0.03
(0.01) (0.03)!
4it�1 0.00** 0.00
(0.00) (0.00)Constant 0.33* 0.01 0.09 0.22 0.49
(0.15) (0.11) (0.24) (0.11)Country Specific Constant XVar. 0.06Variance �
Constant 0.56*** 0.43*** 0.56*** 0.56*** 0.45(0.06) (0.04) (0.00) (0.00)
Country Specific Variance X X XVar. .23 .24 .23Log Assets 0.02*
(0.01)
Observations 5563 5563 5563 5563 5274Countries 33 33 33 33 33Log-Likelihood -4636 -4366 -3355 -3352 -3352
Note: Productivity is measured using gross output. Standard Errors (in parentheses) clus-tered by country. ‘Var.’ indicates the standard deviation of the set of parameters indicatedin the row above. For specification (5), averages from country-level regressions are pre-sented. The full set of coe�cients and standard errors, together with those estimated usingthe other data sets, are presented in Table D.8.
8

Online Appendix: Not For Publication Asker, Collard-Wexler and De Loecker
Table D.8: Country-specific AR(1) coe�cients: Using the World Bank Data
Specification: !it = µc + ⇢c!it�1 + �c⌘it
Country ⇢c se(⇢c) �c se(�c) µc se(µc)
Bangladesh 0.92 0.08 0.56 0.03 0.19 0.23Benin 0.80 0.05 0.36 0.03 0.54 0.12Brazil 0.94 0.04 0.26 0.02 0.26 0.12Chile 0.68 0.02 0.70 0.02 1.08 0.07Costa Rica 0.85 0.03 0.48 0.02 -0.09 0.03Ecuador 0.99 0.07 0.44 0.03 0.02 0.19El Salvador 0.86 0.03 0.36 0.02 0.14 0.05Ethiopia 0.84 0.04 0.55 0.03 0.36 0.09Guatemala 0.30 0.04 0.60 0.03 1.81 0.12Guyana 1.05 0.10 0.69 0.09 -0.06 0.50Honduras 0.71 0.03 0.50 0.02 0.66 0.10Indonesia 0.74 0.03 0.90 0.03 0.81 0.11Kyrgyzstan 1.00 0.03 0.11 0.01 0.01 0.05Lithuania 0.81 0.06 0.37 0.03 0.58 0.16Madagascar 0.79 0.06 0.44 0.03 0.66 0.20Malawi 0.92 0.04 0.37 0.02 0.29 0.12Mauritius 0.61 0.13 1.04 0.10 1.08 0.41Moldova 0.94 0.03 0.14 0.01 0.14 0.08Morocco 0.56 0.03 0.47 0.02 1.34 0.10Nicaragua 0.76 0.03 0.38 0.02 0.54 0.08Peru 0.98 0.04 0.20 0.03 0.11 0.12Philippines 1.01 0.01 0.18 0.01 -0.01 0.03Poland 1.03 0.04 0.12 0.01 -0.05 0.10South Africa 0.95 0.03 0.24 0.01 0.28 0.10Sri Lanka 0.85 0.03 0.38 0.03 0.41 0.10Syria 0.92 0.10 0.49 0.05 0.12 0.21Tajikistan 1.03 0.04 0.14 0.01 -0.13 0.08Tanzania 1.00 0.06 0.38 0.04 0.06 0.16Thailand 0.84 0.02 0.24 0.01 0.57 0.08Turkey 0.93 0.05 0.40 0.05 0.27 0.16Uzbekistan 0.97 0.07 0.33 0.02 -0.04 0.13Vietnam 0.84 0.03 0.39 0.01 0.50 0.08Zambia 0.68 0.05 0.33 0.02 0.89 0.12
Note: the µ coe�cients will not be comparable across data sets due tothe use of di↵erent measurement units.
9

Online Appendix: Not For Publication Asker, Collard-Wexler and De Loecker
Table D.9: WBES Production function coe�cients: Mean estimates by country
Labor Coe�cient �l Material Coe�cient �m Capital Coe�cient �k
Bangladesh 0.14 0.50 0.11Benin 0.17 0.48 0.10Brazil 0.17 0.48 0.11Chile 0.15 0.44 0.16Costa Rica 0.17 0.47 0.12Ecuador 0.15 0.48 0.12El Salvador 0.15 0.48 0.12Ethiopia 0.18 0.46 0.11Guatemala 0.17 0.47 0.11Guyana 0.12 0.50 0.13Honduras 0.16 0.47 0.12Indonesia 0.15 0.48 0.12Kyrgyzstan 0.16 0.47 0.12Lithuania 0.17 0.44 0.14Madagascar 0.17 0.46 0.12Malawi 0.14 0.48 0.12Mauritius 0.14 0.48 0.12Moldova 0.16 0.47 0.12Morocco 0.16 0.48 0.11Nicaragua 0.16 0.47 0.11Peru 0.17 0.47 0.11Philippines 0.14 0.49 0.12Poland 0.15 0.48 0.12South Africa 0.16 0.47 0.12Sri Lanka 0.15 0.48 0.11Syria 0.16 0.48 0.11Tajikistan 0.17 0.47 0.11Tanzania 0.14 0.49 0.11Thailand 0.15 0.49 0.11Turkey 0.13 0.49 0.13Uzbekistan 0.16 0.48 0.12Vietnam 0.16 0.47 0.12Zambia 0.13 0.50 0.12
10
Related Documents