D. Friedman, G. Mattos, D. Rico Presented by Donald Friedman to the Transportation Research Board of the National Academy of Science Washington D.C. January 27, 2011 Jordan Rollover System (JRS) Vehicle Parameter Sensitivity vs Injury

D. Friedman, G. Mattos, D. Rico Presented by Donald Friedman to the Transportation Research Board of the National Academy of Science Washington D.C. January.
Dec 17, 2015
Welcome message from author
This document is posted to help you gain knowledge. Please leave a comment to let me know what you think about it! Share it to your friends and learn new things together.
Transcript
D. Friedman, G. Mattos, D. Rico Presented by Donald Friedman
to the Transportation Research Board of the National Academy of ScienceWashington D.C. January 27, 2011
Jordan Rollover System (JRS)
Vehicle Parameter Sensitivity
vs Injury

This CfIR analysis is part of a continuing effort to evaluate vehicle rollover and test parameters beyond the previously investigated sensitivity of roof strength to weight ratio (SWR) and impact pitch angle, as related to residual and dynamic roof crush and injury potential.
The purpose is three fold:• To predict the dynamic injury potential performance of as yet dynamically untested vehicles from static tests and vehicle geometry;• To contribute to the effort to develop a real world rollover test protocol; • To alert government, industry and safety advocates of the lessons learned and their application to other modes, systems and occupants.
Introduction
Analysis of JRS Data Base*
Parameter Sensitivity to Injury mechanisms Injury mechanisms and criteria Parameter sensitivity Prediction and Mitigation means
Developing a real world protocol Lessons learned Applicability to Frontal Impact Applicability to Side Impact
*In the following data, Roll 1 is at 5° and Roll 2 is at 10° pitch

Injury Mechanism, Criteria and Measurements
In a previous series of papers CfIR identified:
Correlation of residual roof crush and statistical injury potential Neck Bending as the major injury mechanism Peak Axial loading in Humans from Roof Crush is unlikely Bending Injuries occur from the extent (stroke) of roof crush Primary Injury location is in the lower neck Primary Measurement is by Lower Neck Load Cells Axial Neck Alignment and Orientation at 30°+ Flexion Development of the Integrated Bending Moment (IBM), a
Momentum Injury Criteria based on duration of loading. Development of a Low Durometer Hybrid III Neck Correlation with IARV and Human Bending Injury Criteria

Spinal Injury Criteria and MeasuresHybrid III 50th % Male Dummy Lower Neck Bending Moment and
Duration
Peak Axial Neck Load
5
FA Pintar, LM Voo, N Yoganandan, TH Cho, and DJ Maiman, ‘Mechanisms of hyperflexion cervical spine injury’,IRCOBI Conference, Goteborg, September 1998.
SP Mandell, et al., "Mortality and Injury Patterns Associated with Roof Crush in Rollover Crashes," Accid. Anal. Prev., 2010.
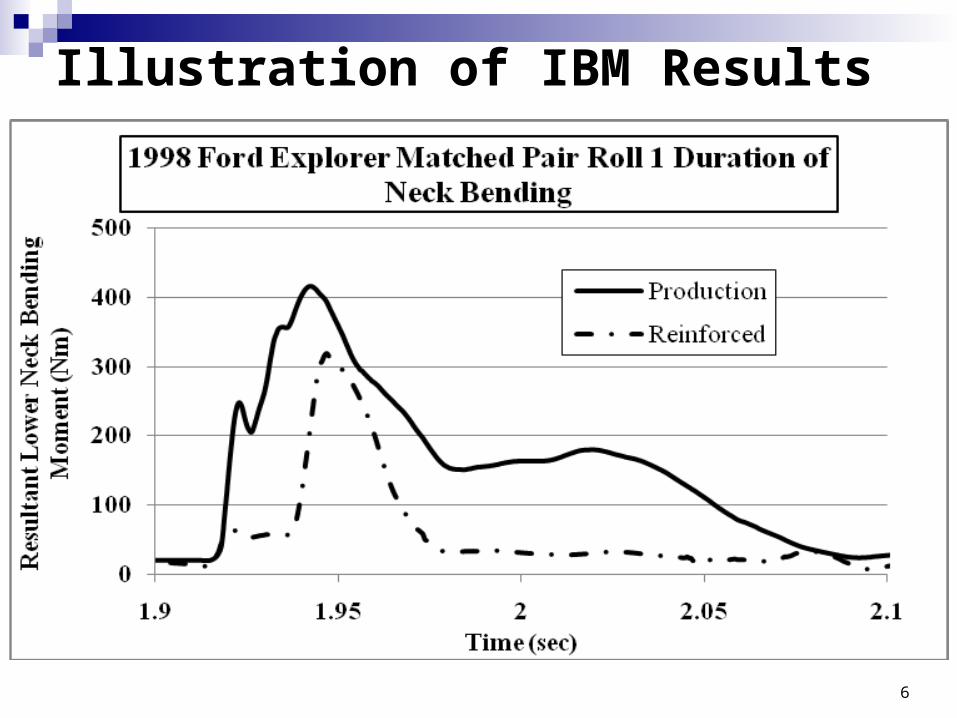
Illustration of IBM Results
6
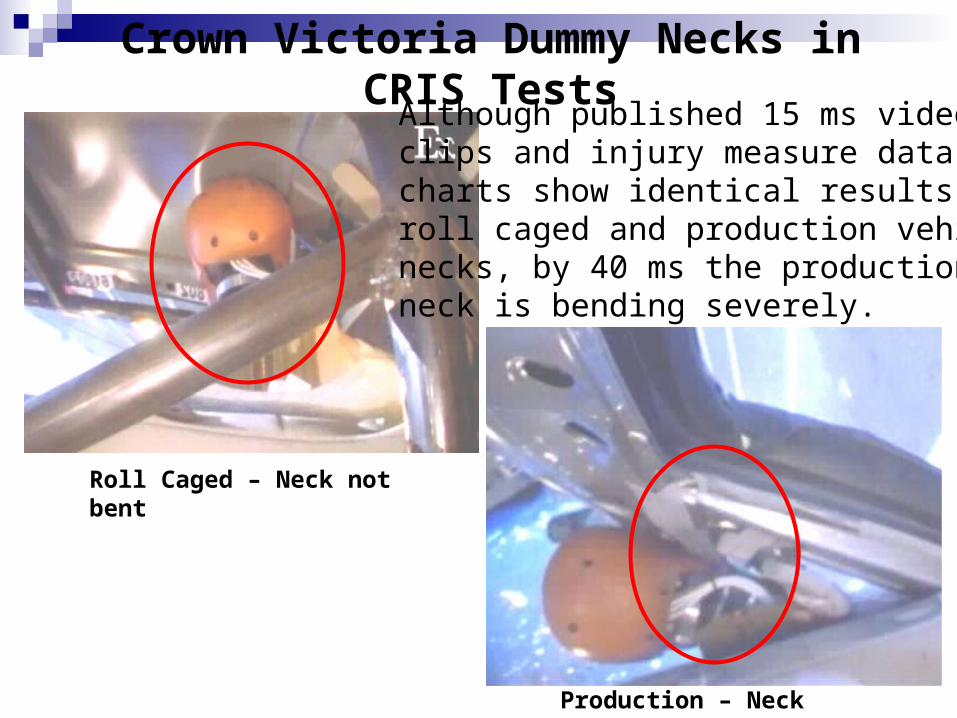
Crown Victoria Dummy Necks in CRIS Tests
Roll Caged – Neck not bent
Production – Neck Severely bent
Although published 15 ms video clips and injury measure data charts show identical results in roll caged and production vehicle necks, by 40 ms the production neck is bending severely.

The SWR = 6.8, Scion Xb broke the Neck
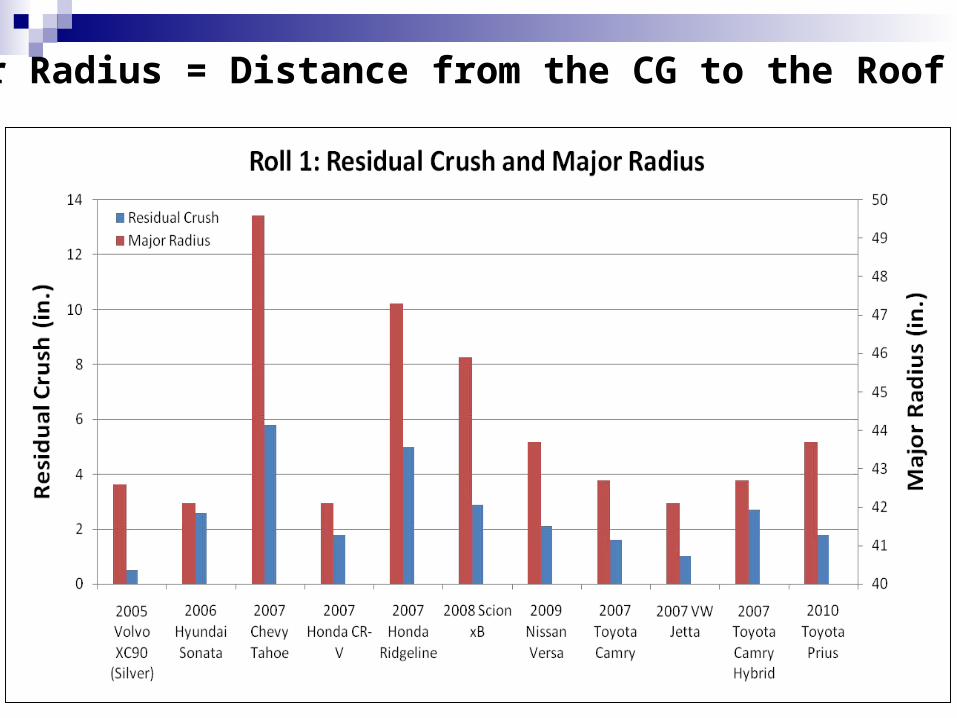
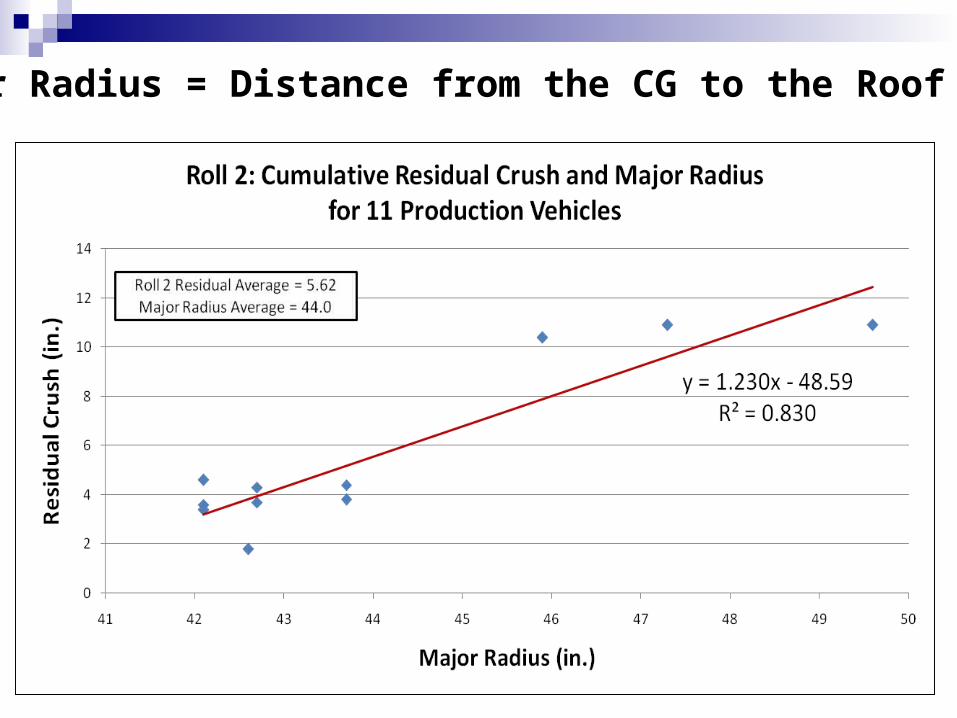
Major Radius = Distance from the CG to the Roof Rail

Major Radius = Distance from the CG to the Roof Rail

Major Radius = Distance from the CG to the Roof Rail
Major Radius = Distance from the CG to the Roof Rail

Roll 1: Residual Crush and Elasticity
(2005 Volvo XC90)
(2006 Hyundai Sonata)
(2007 Chevy Tahoe)
(2007 Honda CR-V)
(2007 Honda Ridgeline)
(2008 Scion xB)(2009 Nissan Versa)
(2007 Toyota Camry) (2007 VW Jetta)
(2007 Toyota Camry Hybrid)
(2010 Toyota Prius)
y = -0.119x + 8.474R² = 0.873
0
1
2
3
4
5
6
7
20 30 40 50 60 70 80
Elasticty (%)(Peak Dynamic - Residual)/Peak Dynamic *100
Resi
dual
Cru
sh (i
n.)
Residual Crush and Elasticity

Roll 2: Residual Crush and Elasticity
(2005 Volvo XC90)(2006 Hyundai Sonata)
(2007 Chevy Tahoe)
(2007 Honda CR-V)
(2007 Honda Ridgeline)
(2008 Scion xB)
(2009 Nissan Versa)(2010 Toyota Camry) (2007 VW Jetta)
(2007 Toyota Camry Hybrid)
(2010 Toyota Prius)
y = -0.159x + 11.44R² = 0.861
0
1
2
3
4
5
6
7
8
20 30 40 50 60 70 80
Elasticity (%)(Peak Dynamic - Residual)/Peak Dynamic*100
Resi
dual
Cru
sh (i
n.)
Residual Crush and Elasticity

Residual Roof Crush and Integrated Bending Moment
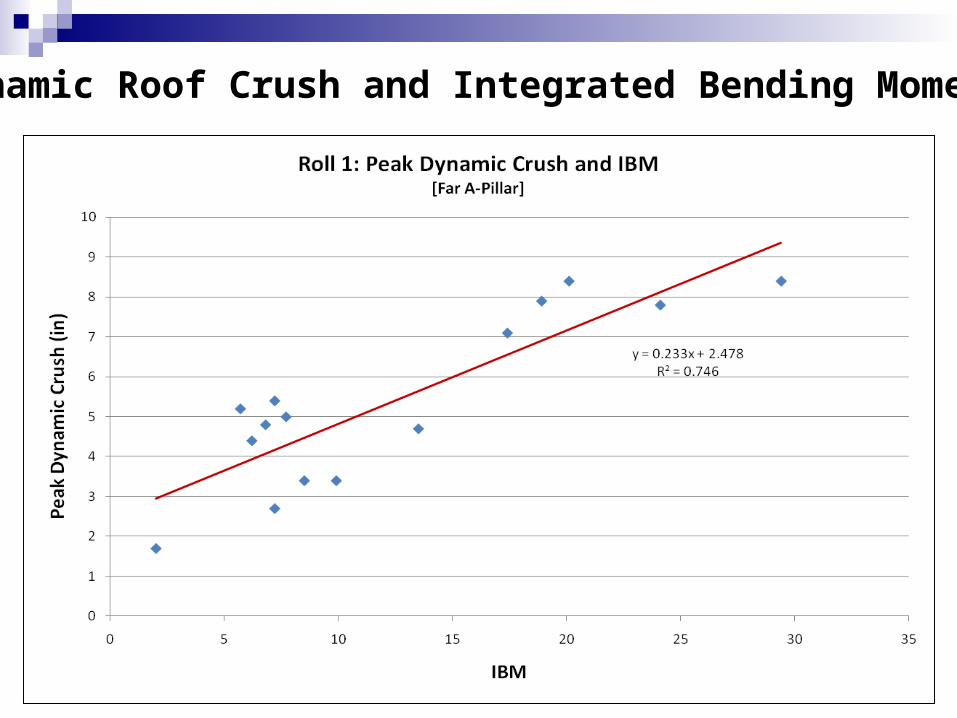
Dynamic Roof Crush and Integrated Bending Moment
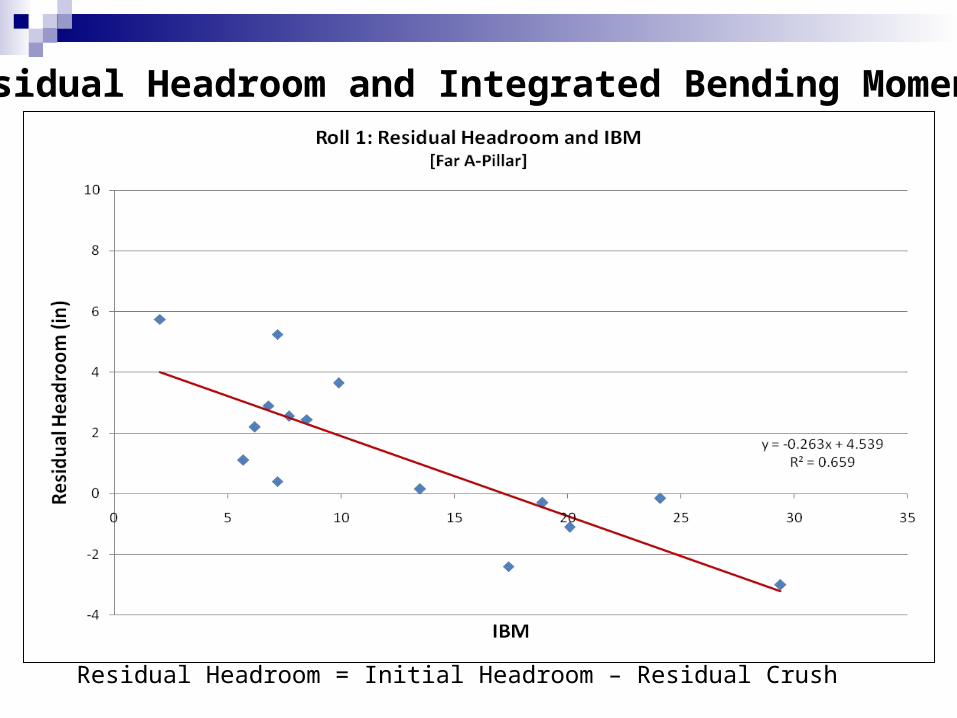
Residual Headroom = Initial Headroom – Residual Crush
Residual Headroom and Integrated Bending Moment
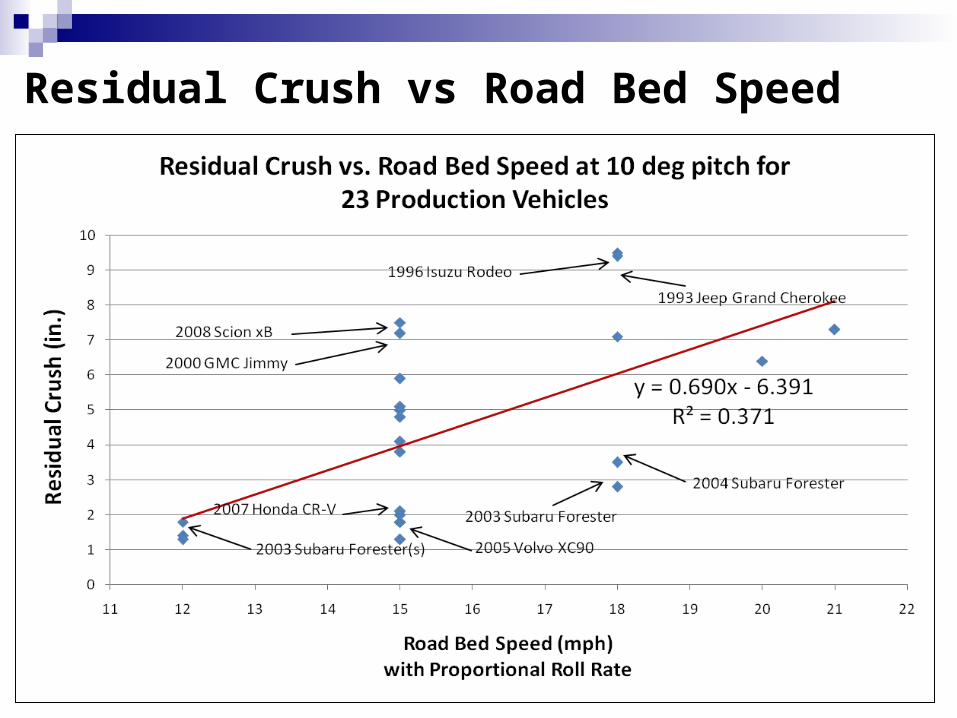
Residual Crush vs Road Bed Speed

Residual Crush vs Average Road Bed Speed
Residual Crush vs. Avg. Road Bed Speed at 10°pitch for 23 Production Vehicles
(3 Vehicles)
(13 Vehicles)
(5 Vehicles)
(1 Vehicle)(1 Vehicle)
y = 0.631x - 5.7536
R2 = 0.9517
0
1
2
3
4
5
6
7
8
9
10
11 12 13 14 15 16 17 18 19 20 21 22
Avg. Road Bed Speed (mph)with Proportional Roll Rate
Res
idua
l Cru
sh (i
n.)
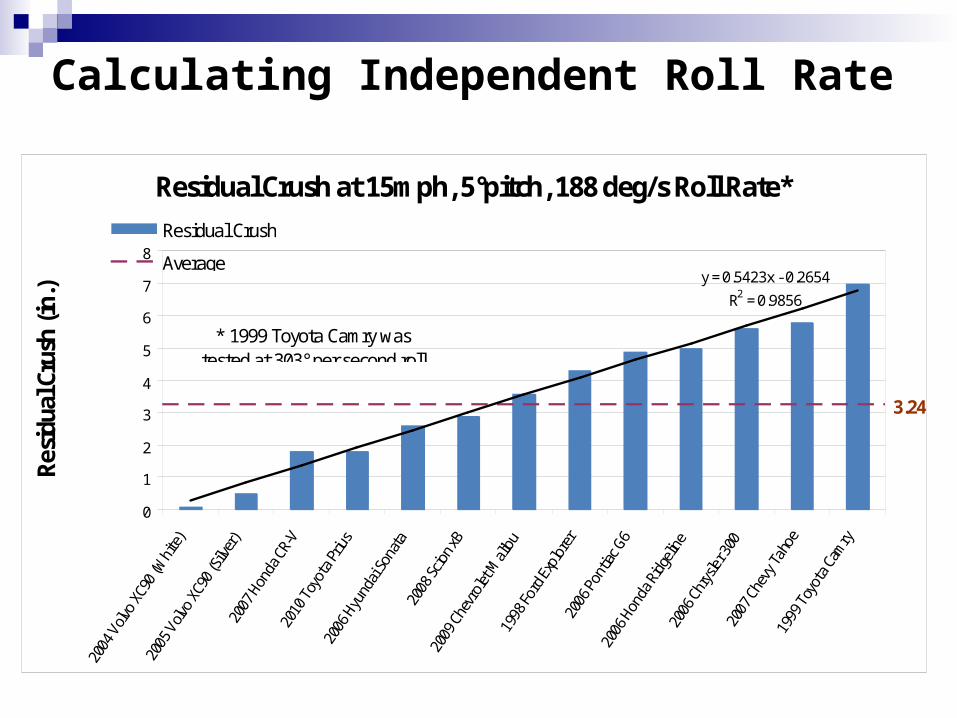
Residual Crush at 15mph, 5°pitch, 188 deg/s Roll Rate*
3.24
y = 0.5423x - 0.2654
R2 = 0.9856
0
1
2
3
4
5
6
7
8
2004
Volv
o XC
90 (W
hite
)
2005
Volv
o XC
90 (S
ilver
)20
07 H
onda
CR-
V20
10 T
oyot
a Priu
s20
06 H
yund
ai So
nata
2008
Scio
n xB
2009
Che
vrol
et M
alibu
1998
Ford
Exp
lore
r20
06 P
ontia
c G6
2006
Hon
da R
idge
line
2006
Chr
ysle
r 300
2007
Che
vy Ta
hoe
1999
Toy
ota C
amry
Resi
dual
Cru
sh (i
n.)
Residual Crush
Average
Linear (ResidualCrush)
* 1999 Toyota Camry was tested at 303° per second roll
Calculating Independent Roll Rate
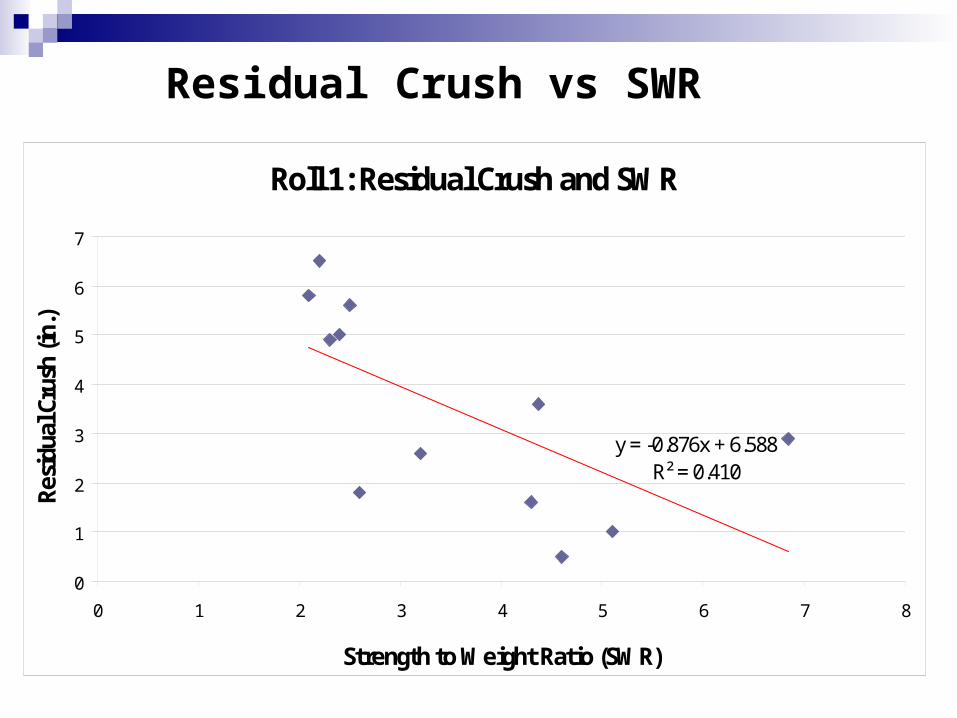
Roll 1: Residual Crush and SWR
y = -0.876x + 6.588R² = 0.410
0
1
2
3
4
5
6
7
0 1 2 3 4 5 6 7 8
Strength to Weight Ratio (SWR)
Resi
dual
Cru
sh (i
n.)
Residual Crush vs SWR

Roll 2: Residual Crush and SWR
y = 0.350x + 1.807R² = 0.068
0
1
2
3
4
5
6
7
8
0 1 2 3 4 5 6 7 8
Strength to Weight Ratio (SWR)
Resi
dual
Cru
sh (i
n.)
Residual Crush vs SWR

CG Location Relative to A Pillar vs Pitch Propensity
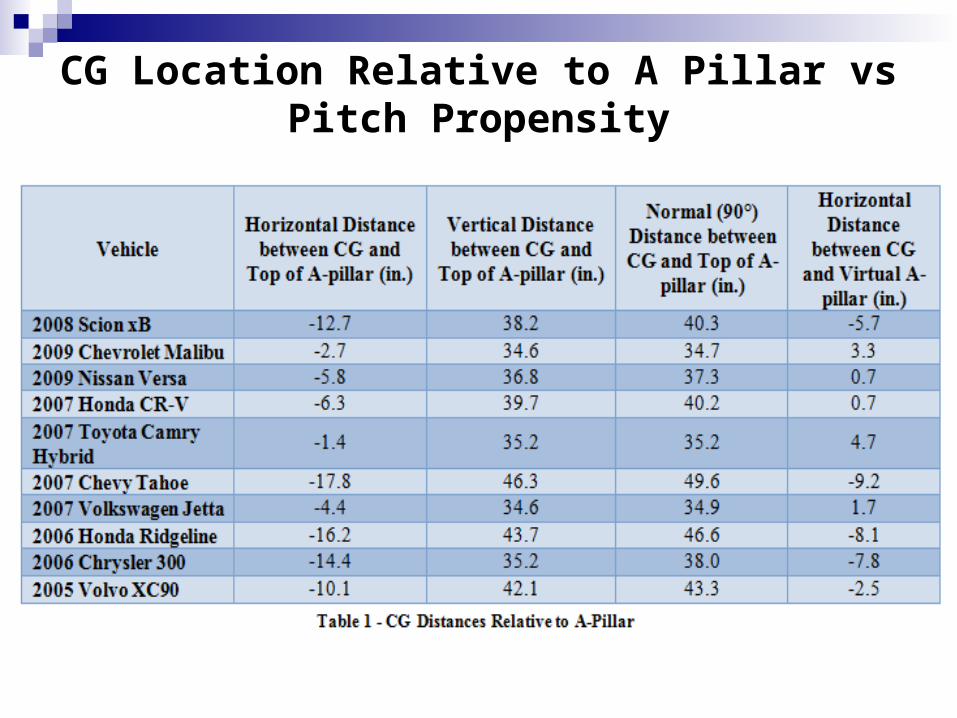
CG Location Relative to A Pillar vs Pitch Propensity

Residual Crush and Horizontal Distance between CG and A-Pillar

R2 Correlation and Slope of Roof Crush vs. Parameters
5 ° / 10° pitch Major radius (of 41 to 50 inches) 0.793 / 0.830 Elasticity 0.873 / 0.861 Dynamic Dummy Injury Measure (IBM) 0.746 / 0.233 Residual Dummy Injury Measure (IBM) 0.792 / 0.289 Peak Dynamic Headroom and Injury Measure (IBM) 0.642 / 0.427 Residual Headroom and Injury Measure (IBM) 0.659 / ----- Peak Dynamic Headroom and Injury Measure (IARV) 0.289 / 0.252 Road speed and proportional roll rate ----- / 0.371 Road speed and average residual crush ----- / 0.951 Road speed independent of roll rate (20% increase) 0.985 / ~15% Roll rate independent of road speed (20% increase) ----- / ~35% Strength to weight ratio (SWR) 0.410 / 0.068 Curb Weight 0.257 / 0.034 Roll Moment of Inertia 0.274 / 0.166 Major/minor radius difference 0.005 / 0.0002 CG vs A-Pillar location ----- / 0.659
Prediction and Mitigation Means
CfIR previously showed that residual crush and ejection potential decrease with SWR greater than 3.0 and increase with 10° pitch.
This analysis indicates that: Momentum derived hybrid III dummy injury measures correlate
with one roll residual crush injury potential. Increased major radius results in increased injury potential
independent of SWR, Elastic structures reduce injury potential. Increasing road speed increases injury potential Increased roll rate has more substantial effect than road speed Shifting CG Rearward (Rear seat passengers or load) reduces
injury potential by reducing pitch propensity.

Developing a real world protocolCfIR has proposed a real world rollover test protocol and normalized the 50 dynamic test already conducted to predict dynamic performance with in the protocol. The University of Virginia sponsored by NHTSA have been given responsibility to developed a real world protocol. By virtue of the relationships developed here the performance can be varied to adjust for road speed and roll rate. To predict the dynamic performance from 5 degree static test data for vehicles with SWR equal to or greater than 3.25;
Adjust the rating by the most significant geometric factor with a high correlation and substantial slope which is the major radius at 5 and 10 degrees of pitch.
Depending on whether the University of Virginia chooses 5 degrees or concurs with our 10 degrees of pitch real world protocol we would adjust the IIHS rating by incrementing down with greater than 44” major radius and up with less than 44” major radius.
Should IIHS conduct a second side test at 10 degrees of pitch and 40 degrees of roll a much more accurate measure of injury performance would result.
Lessons learned Conducting Dynamic Rollover tests has provided the following insights:
1/3 the tensed stiffness of the Hybrid III neck more accurately represent the mildly tensed neck of a normal human. The major rollover injury mechanism is bending. Peak IARV are not good dummy injury references. The momentum exchange between roof crush and neck bending is best represented by the Integrated bending moment (IBM). The IBM correlates with statistical NASS and CIREN data, post crash headroom and roof crush criteria. The neck orientation should be adjusted to represent human axial alignment. Correlating the momentum exchange between roof crush and the Integrated bending moment (IBM) injury measure means that we have the equivalent of a frontal and side impact test system with the Hybrid III, particularly for head and neck injury.

Applicability to Neck Comparison in 15 mph Frontal Impact
Production Neck
Low Durometer Neck

Applicability to Deploying Side Impact Airbag
Window curtain air bags are now in use as head impact protection for side impacts and as such deploy at 100 to 120 mph. Rollover activated window curtain airbags for ejection protection deploy at 25 to 50mph.
If the side impact bag is activated during a rollover because of the vehicle side being in proximity to the ground while the occupant is “up and out” against the roof rail the result may be head and brain trauma, diffuse axonal injury, and coma.
A solution would be to have two or variable inflators and change the rollover sensing algorithm to override and inhibit the side impact deployment gas generator.

The authors welcome feedback and proposals
for cooperative research.
Please contact: Susie Bozzini

Thank You.
Related Documents