DEAN FOODS COMPANY (NYSE:DF) December 3, 2013 1 Dan Ballantine Jason Chan Michael DeRenzo Dan Kleeman

D EAN F OODS C OMPANY (NYSE:DF) December 3, 2013 1 Dan Ballantine Jason Chan Michael DeRenzo Dan Kleeman.
Dec 27, 2015
Welcome message from author
This document is posted to help you gain knowledge. Please leave a comment to let me know what you think about it! Share it to your friends and learn new things together.
Transcript
DEAN FOODS COMPANY (NYSE:DF)December 3, 2013
1
Dan BallantineJason ChanMichael DeRenzoDan Kleeman

AGENDA
2
• Introduction• Macroeconomic Outlook• Industry Overview• Company Overview• Financial Analysis• Valuation• Recommendation
DEAN FOODS COMPANY (NYSE: DF)
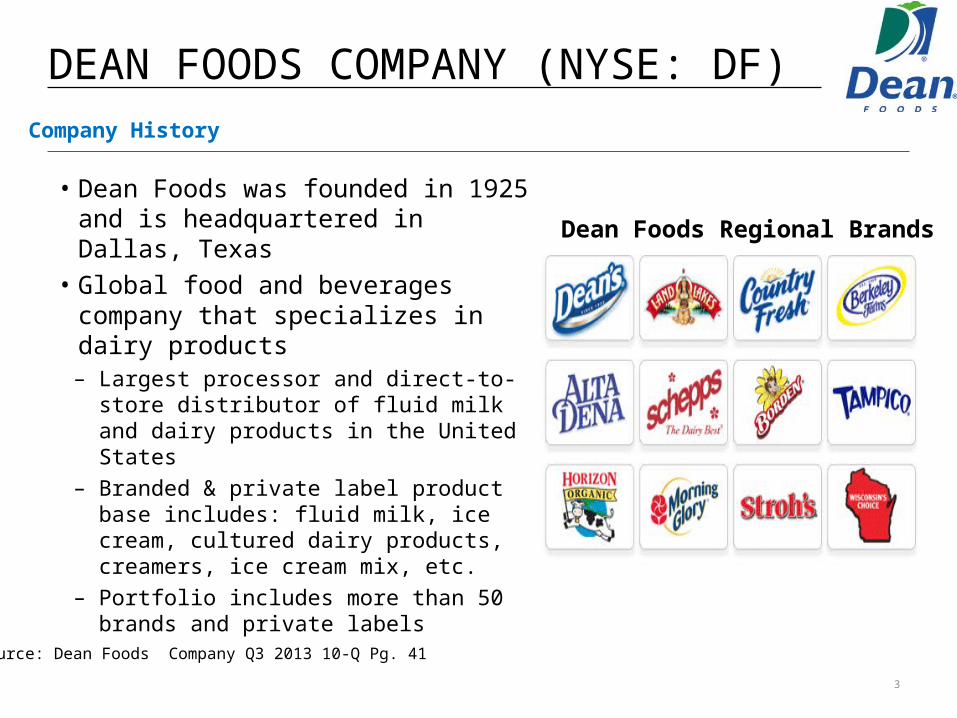
• Dean Foods was founded in 1925 and is headquartered in Dallas, Texas
• Global food and beverages company that specializes in dairy products– Largest processor and direct-to-store
distributor of fluid milk and dairy products in the United States
– Branded & private label product base includes: fluid milk, ice cream, cultured dairy products, creamers, ice cream mix, etc.
– Portfolio includes more than 50 brands and private labels
3
Company History
Source: Dean Foods Company Q3 2013 10-Q Pg. 41
Dean Foods Regional Brands
MACROECONOMIC OUTLOOK
4
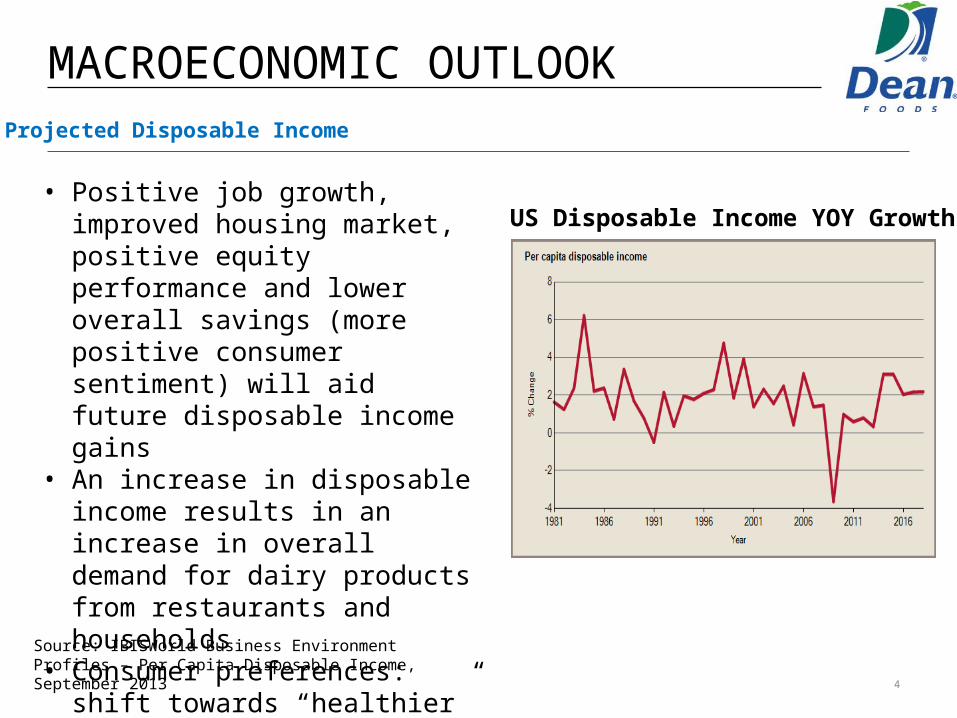
• Positive job growth, improved housing market, positive equity performance and lower overall savings (more positive consumer sentiment) will aid future disposable income gains
• An increase in disposable income results in an increase in overall demand for dairy products from restaurants and households
• Consumer preferences: shift towards “healthier” dietary habits
Projected Disposable Income
Source: IBISWorld Business Environment Profiles – Per Capita Disposable Income, September 2013
US Disposable Income YOY Growth

MACROECONOMIC OUTLOOK
5
• $21.92 per hundredweight in 2013 vs. a forecasted value of $24.50 per hundredweight in 2018 – 2008 – 2013 CAGR of 1.7% vs. 2013 –
2018 CAGR of 2.2%• Projected prices increases largely
driven by increased foreign demand• WTO continues to push US to
withdraw its price support for Milk– Removal of price supports will result
in price volatility and potentially lower milk prices
Source: IBISWorld Business Environment Profiles – Price of Milk, April 2013
Raw Milk Prices
Forecasted Price of Raw Milk

INDUSTRY OVERVIEW
6
Source: Hoover’s – Dairy Products Manufacturing, Industry Description
Dairy Products Manufacturing
• Companies that manufacture dairy-based products from raw & manufactured milk and milk substitutes
• US dairy products manufacturing market has about 1,100 companies with combined revenue of $107 billion annually
• High degree of economies of distribution– 50 largest fluid milk producers claim
85% of annual fluid milk revenue
• Industry heavily relies on direct-to-store delivery (DSD)
Dairy Products Manufacturing – Product Breakdown by Revenue
INDUSTRY OVERVIEW
• Overall industry consolidation– Acquisitions of local dairy farms and local manufacturers– Creating more efficient production and distribution networks
• Continued declining milk consumption in US• Increased competition from large grocery chains
7
Industry Trends & Challenges
Source: Hoover’s – Dairy Products Manufacturing,

INDUSTRY FORCES ANALYSIS
8
INDUSTRY FORCES ANALYSIS
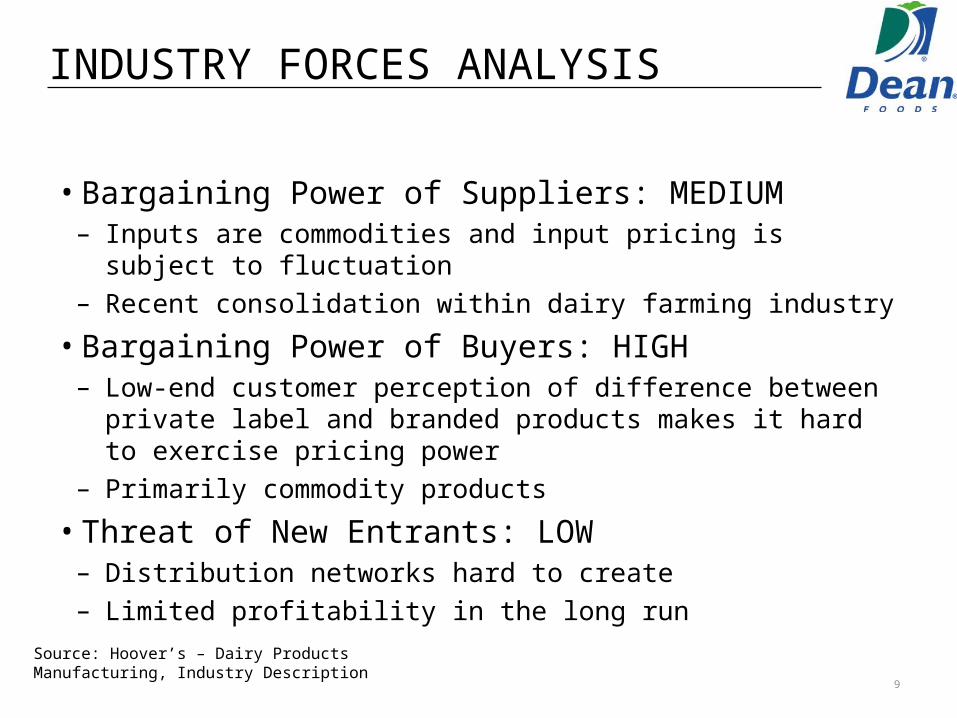
• Bargaining Power of Suppliers: MEDIUM– Inputs are commodities and input pricing is subject to fluctuation– Recent consolidation within dairy farming industry
• Bargaining Power of Buyers: HIGH– Low-end customer perception of difference between private label and
branded products makes it hard to exercise pricing power– Primarily commodity products
• Threat of New Entrants: LOW – Distribution networks hard to create – Limited profitability in the long run
9
Source: Hoover’s – Dairy Products Manufacturing, Industry Description
INDUSTRY FORCES ANALYSIS
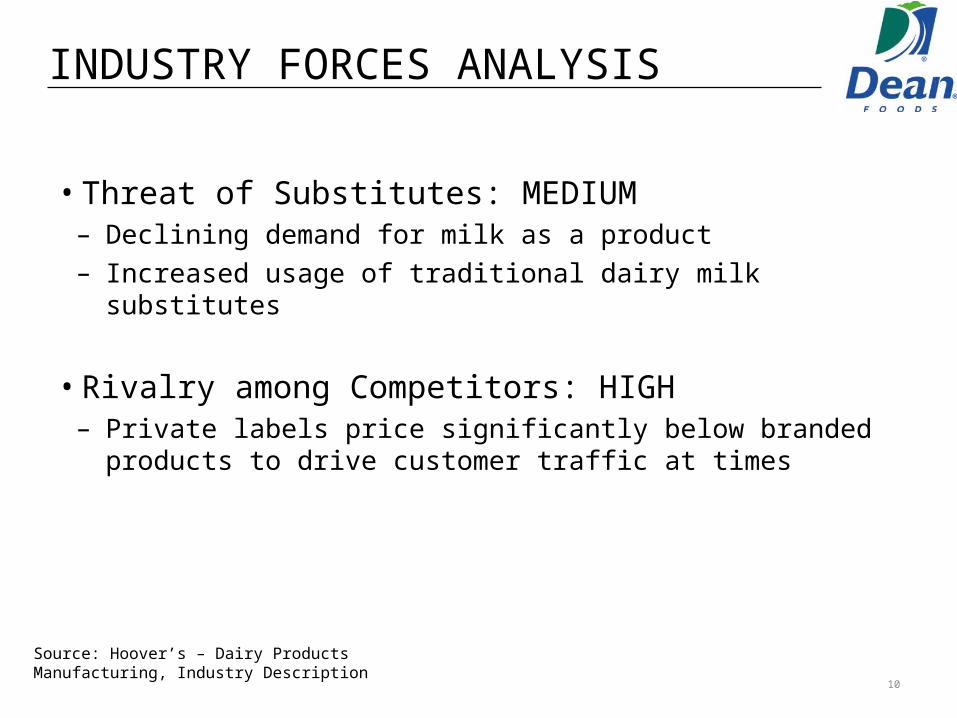
• Threat of Substitutes: MEDIUM– Declining demand for milk as a product– Increased usage of traditional dairy milk substitutes
• Rivalry among Competitors: HIGH– Private labels price significantly below branded products to drive
customer traffic at times
10
Source: Hoover’s – Dairy Products Manufacturing, Industry Description

COMPANY OVERVIEW
11
Fresh Dairy Direct Segment Breakdown (Fiscal Year 2012)
Source: Dean Foods Company 2012 10-K, Pg. 5
• Dean Foods has a very concentrated product mix (74% fluid milk)• Majority of Dean Foods sales comes from private labels
COMPANY OVERVIEW
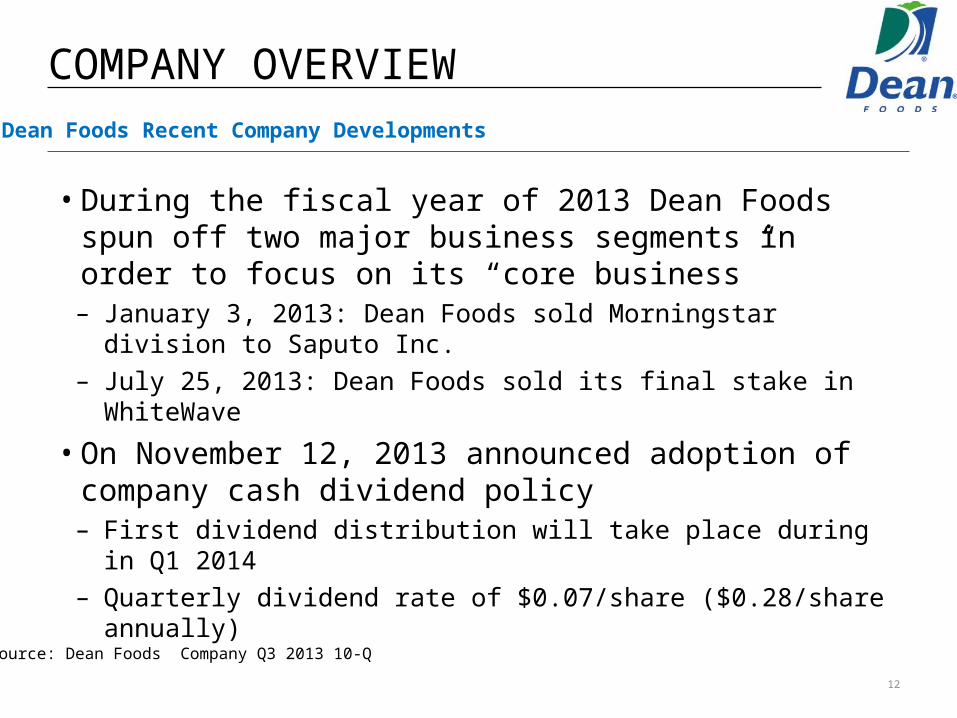
• During the fiscal year of 2013 Dean Foods spun off two major business segments in order to focus on its “core business”– January 3, 2013: Dean Foods sold Morningstar division to Saputo Inc.– July 25, 2013: Dean Foods sold its final stake in WhiteWave
• On November 12, 2013 announced adoption of company cash dividend policy– First dividend distribution will take place during in Q1 2014– Quarterly dividend rate of $0.07/share ($0.28/share annually)
12
Dean Foods Recent Company Developments
Source: Dean Foods Company Q3 2013 10-Q

RECENT FINANCIAL INFORMATION
13
Source: Dean Foods Company 2012 10-K, Dean Food Company 2010 10-K

COMPANY STRATEGY
• Dean Foods recently sold its two “high-growth potential” divisions and decided to solely focus on Fresh Dairy Direct– Much less dynamic business model– Focused on new successful brands like TruMoo flavored milk
• Continue to cut costs across the board and expand market share• Significantly reduce the debt on the balance sheet and
continue to strengthen it moving forward• Primarily focused on offsetting the weak margins within the
fresh dairy business– Maximize sales, increase volume and efficient operations (cutting costs)
14
Change in Company Strategy
Source: Sosland, Josh. "A New Day at Dean Foods." Food Business Week. N.p., 6 June 2013. Web. 2 Dec. 2013.
MANAGEMENT’S OUTLOOK
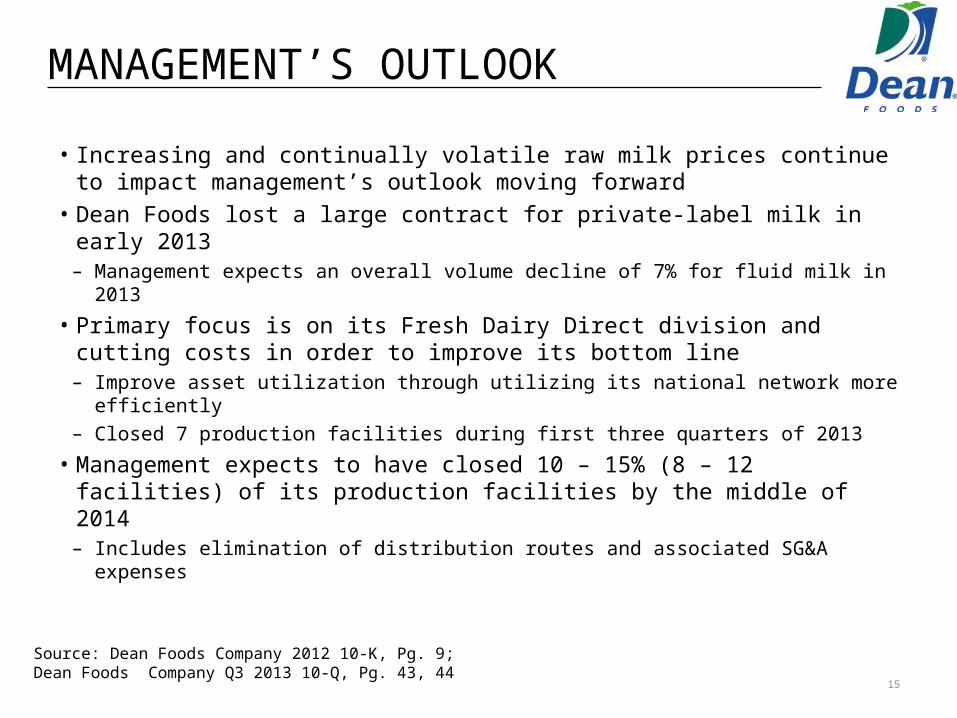
• Increasing and continually volatile raw milk prices continue to impact management’s outlook moving forward
• Dean Foods lost a large contract for private-label milk in early 2013– Management expects an overall volume decline of 7% for fluid milk in 2013
• Primary focus is on its Fresh Dairy Direct division and cutting costs in order to improve its bottom line– Improve asset utilization through utilizing its national network more
efficiently– Closed 7 production facilities during first three quarters of 2013
• Management expects to have closed 10 – 15% (8 – 12 facilities) of its production facilities by the middle of 2014– Includes elimination of distribution routes and associated SG&A expenses
15
Source: Dean Foods Company 2012 10-K, Pg. 9; Dean Foods Company Q3 2013 10-Q, Pg. 43, 44
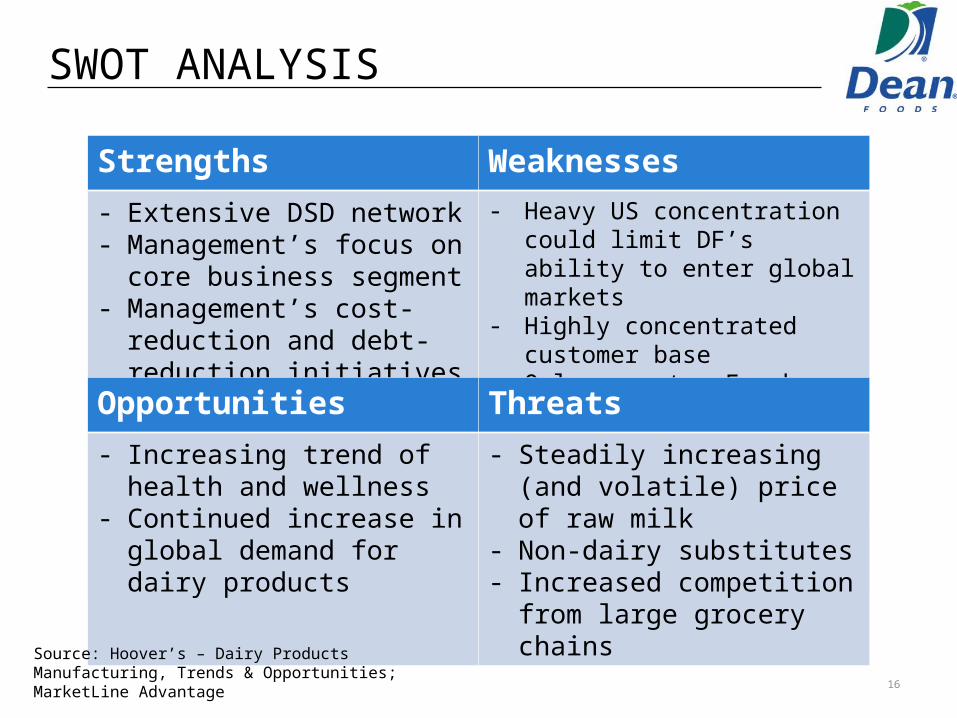
SWOT ANALYSIS
16
Strengths Weaknesses- Extensive DSD network- Management’s focus on
core business segment- Management’s cost-
reduction and debt-reduction initiatives
- Heavy US concentration could limit DF’s ability to enter global markets
- Highly concentrated customer base
- Only operates Fresh Dairy Direct segment (74% of sales from FFD from fluid milk)
Opportunities Threats- Increasing trend of
health and wellness- Continued increase in
global demand for dairy products
- Steadily increasing (and volatile) price of raw milk
- Non-dairy substitutes- Increased competition
from large grocery chains
Source: Hoover’s – Dairy Products Manufacturing, Trends & Opportunities; MarketLine Advantage

CURRENT STOCK INFORMATION
17
Metric Value
Current Stock Price $18.17
Trailing P/E10.7
Forward P/E17.6
Dividend YieldN/A*
Market Cap($ millions) $1,677.9
Source: Capital IQ, Yahoo Finance, Dean Foods Q3 2013 Earnings Release
* DF will begin paying a $0.07/share quarterly dividend in 2014, implying a current dividend yield of 1.6%
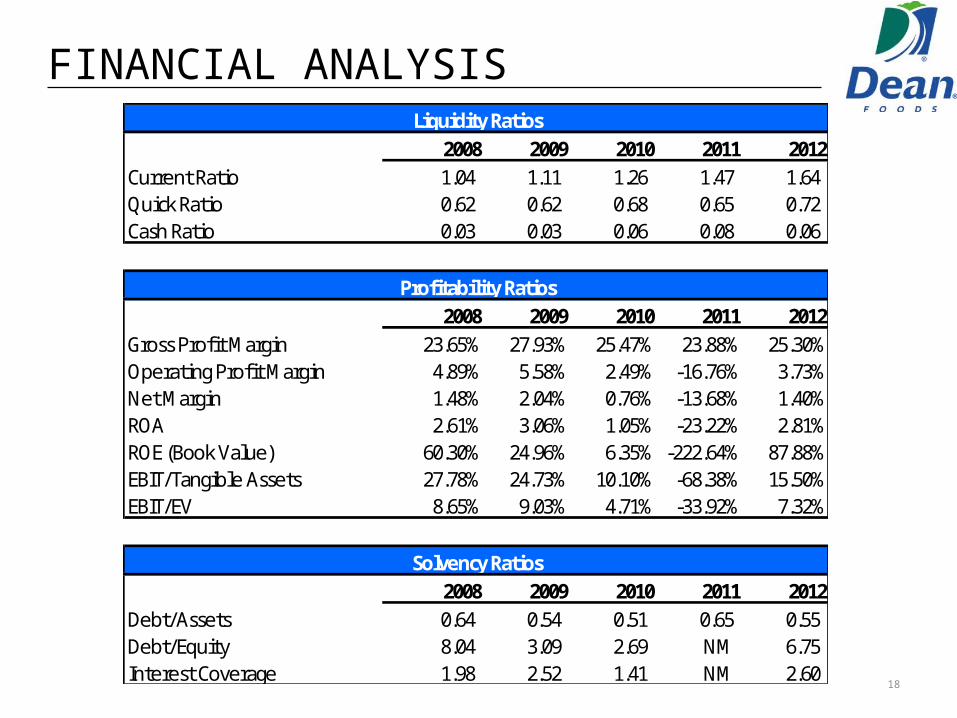
FINANCIAL ANALYSIS
18
2008 2009 2010 2011 2012Current Ratio 1.04 1.11 1.26 1.47 1.64 Quick Ratio 0.62 0.62 0.68 0.65 0.72 Cash Ratio 0.03 0.03 0.06 0.08 0.06
2008 2009 2010 2011 2012Gross Profit Margin 23.65% 27.93% 25.47% 23.88% 25.30%Operating Profit Margin 4.89% 5.58% 2.49% -16.76% 3.73%Net Margin 1.48% 2.04% 0.76% -13.68% 1.40%ROA 2.61% 3.06% 1.05% -23.22% 2.81%ROE (Book Value) 60.30% 24.96% 6.35% -222.64% 87.88%EBIT/Tangible Assets 27.78% 24.73% 10.10% -68.38% 15.50%EBIT/EV 8.65% 9.03% 4.71% -33.92% 7.32%
2008 2009 2010 2011 2012Debt/Assets 0.64 0.54 0.51 0.65 0.55 Debt/Equity 8.04 3.09 2.69 NM 6.75 Interest Coverage 1.98 2.52 1.41 NM 2.60
Liquidity Ratios
Profitability Ratios
Solvency Ratios

FINANCIAL ANALYSIS
19
2008 2009 2010 2011 2012A/R Turnover 14.09 12.92 12.28 13.20 13.07 Days Sales Outstanding 25.91 28.24 29.73 27.65 27.93 Inventory Turnover 24.61 19.40 18.72 21.87 21.60 Days Inventory on Hand 14.83 18.82 19.50 16.69 16.90 A/P Turnover 9.55 6.97 6.48 7.41 7.38 Days Payables Outstanding 38.22 52.40 56.31 49.23 49.46 Fixed Asset Turnover 6.88 5.69 5.13 5.75 6.02 Total Asset Turnover 1.77 1.50 1.37 1.70 2.00
2008 2009 2010 2011 2012Tax Burden 61.32% 63.27% 117.83% NM 60.10%Interest Burden 49.23% 61.05% 28.86% NM 61.69%Operating Profit Margin 4.89% 5.58% 2.49% NM 3.73%Asset Turnover 1.77 1.42 1.36 NM 2.02 Leverage 12.61 5.74 5.26 NM 12.37 ROE 32.92% 17.58% 6.04% NM 34.51%
Activity Ratios
DuPont Analysis
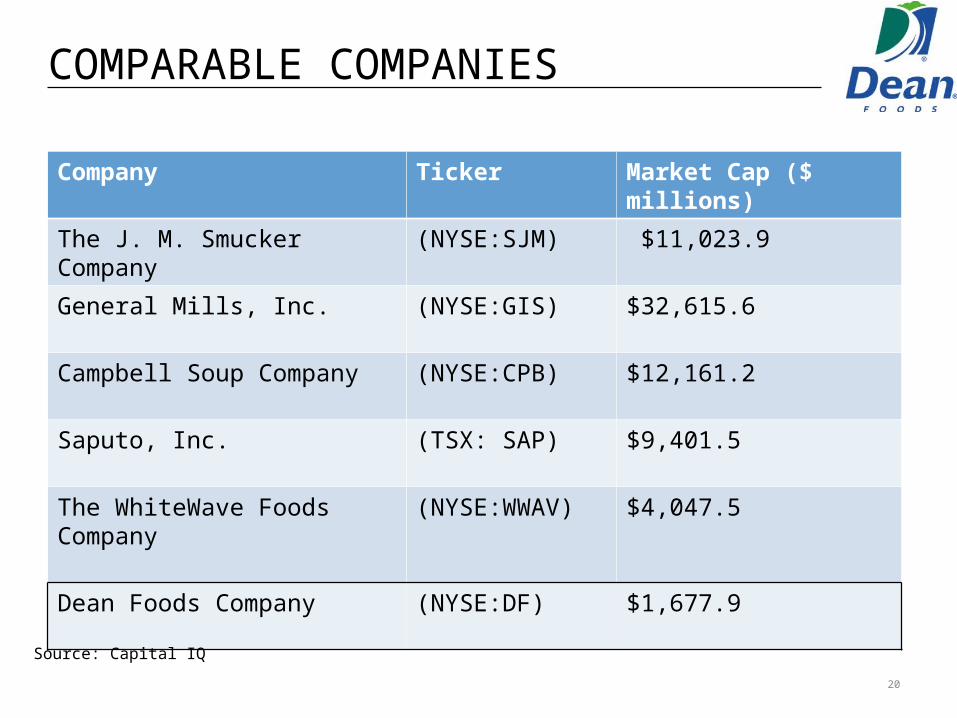
COMPARABLE COMPANIES
20
Company Ticker Market Cap ($ millions)
The J. M. Smucker Company (NYSE:SJM) $11,023.9
General Mills, Inc. (NYSE:GIS) $32,615.6
Campbell Soup Company (NYSE:CPB) $12,161.2
Saputo, Inc. (TSX: SAP) $9,401.5
The WhiteWave Foods Company (NYSE:WWAV) $4,047.5
Dean Foods Company (NYSE:DF) $1,677.9
Source: Capital IQ

STOCK PERFORMANCE
21
Source: Yahoo Finance

COMPARABLE COMPANY ANALYSIS
22
Source: Capital IQ

COMPARABLE COMPANY ANALYSIS
23
Source: Capital IQ
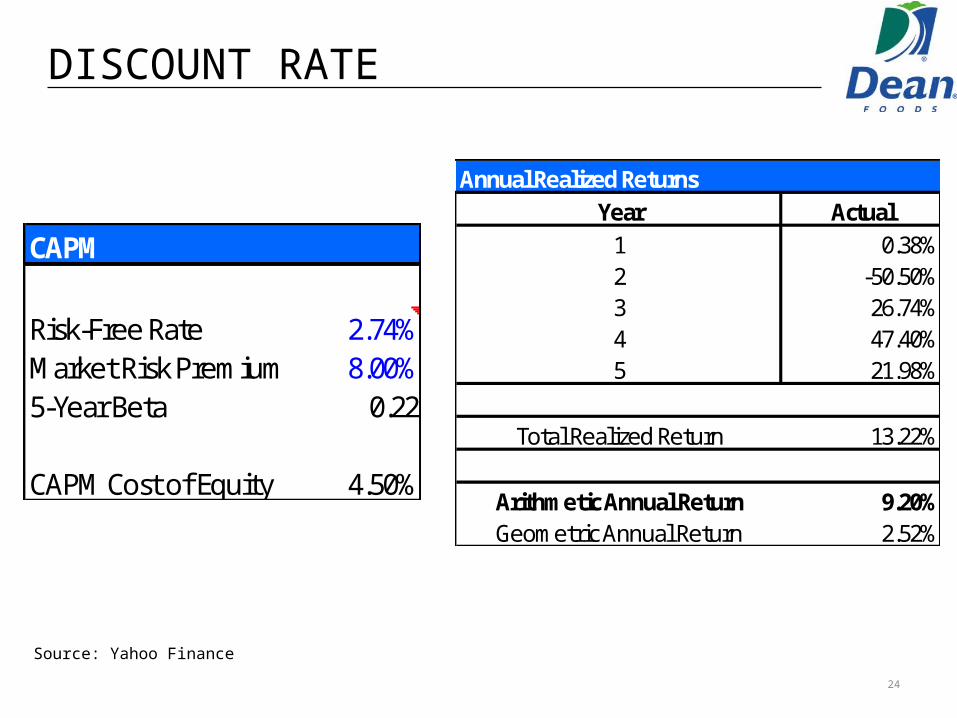
DISCOUNT RATE
24
CAPM
Risk-Free Rate 2.74%Market Risk Premium 8.00%5-Year Beta 0.22
CAPM Cost of Equity 4.50%
Year Actual1 0.38%2 -50.50%3 26.74%4 47.40%5 21.98%
Total Realized Return 13.22%
Arithmetic Annual Return 9.20%Geometric Annual Return 2.52%
Annual Realized Returns
Source: Yahoo Finance

DISCOUNT RATE
25
Share Price 17.98$ Shares Outstanding (thousands) 94,404.21 Market Value of Equity 1,697,387.77$
Debt 1,031,643
Percent Equity Weight 62.20%Percent Debt Weight 37.80%
Cost of Debt 5.00%Cost of Equity
CAPM Cost of Equity 4.50% 0.00%DF Realized Return 9.20% 100.00%
Cost of Equity 9.20%
Tax Rate 40.0%
WACC 6.86%
Business Risk Premium 3.00%
Discount Rate 9.86%
Weighted Average Cost of Capital
Cost of Equity Weightings
DCF ANALYSIS
26
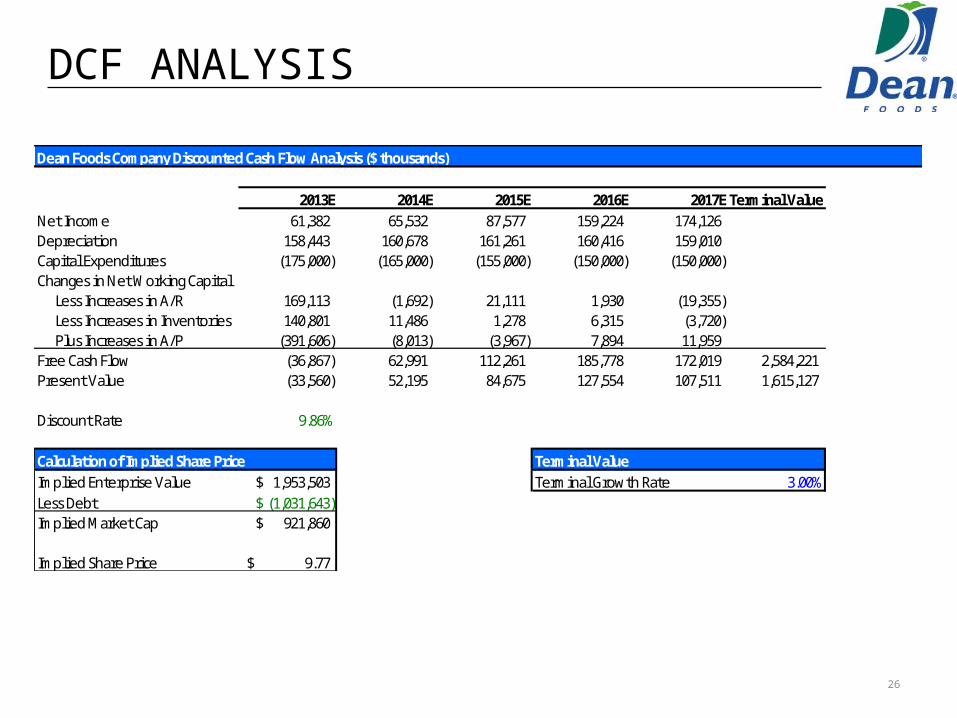
2013E 2014E 2015E 2016E 2017E Terminal ValueNet Income 61,382 65,532 87,577 159,224 174,126 Depreciation 158,443 160,678 161,261 160,416 159,010 Capital Expenditures (175,000) (165,000) (155,000) (150,000) (150,000) Changes in Net Working Capital
Less Increases in A/R 169,113 (1,692) 21,111 1,930 (19,355) Less Increases in Inventories 140,801 11,486 1,278 6,315 (3,720) Plus Increases in A/P (391,606) (8,013) (3,967) 7,894 11,959
Free Cash Flow (36,867) 62,991 112,261 185,778 172,019 2,584,221 Present Value (33,560) 52,195 84,675 127,554 107,511 1,615,127
Discount Rate 9.86%
Calculation of Implied Share Price Terminal ValueImplied Enterprise Value 1,953,503$ Terminal Growth Rate 3.00%Less Debt (1,031,643)$ Implied Market Cap 921,860$
Implied Share Price 9.77$
Dean Foods Company Discounted Cash Flow Analysis ($ thousands)

DECISION DRIVERS
• Strengths– GICS Diversification– Cost and debt reduction initiatives– Extensive and improving production and distribution networks– Renewed focus on returning cash to shareholders
• Concerns– Concentrated geographic, product, and customer bases– Limited growth in core geographic market– Exited higher margin business lines in 2013– Increasingly negative industry outlook
27

RECOMMENDATION
• Valuation Summary– Current Stock Price: $18.17– Comparable Companies Valuation: $30.41– DCF Valuation: $9.77
• Recommendation: WATCH LIST– Place DF on the RCMP Watch List
28

29
QUESTIONS?
Related Documents