D 5.3.2 – 2 nd Trial Evaluation Document Project Deliverable Project Number AAL-201-4-024 Project Name Confidence Duration June 2012 – May 2015 (36 Months) Coordinator Salzburg Research Forschungsgesellschaft mbH Document ID D 5.3.2 Release Number /Date V1/15 th May 2015 Checked and released by Alexandru Sterea, AAIF Document Type Project Deliverable Original Due Date 15 th May 2015 Dissemination Level Public Main Editor Alexandru Sterea, AAIF Contributing Partners All partners Reviewed by Viktoria Willner, SRFG

Welcome message from author
This document is posted to help you gain knowledge. Please leave a comment to let me know what you think about it! Share it to your friends and learn new things together.
Transcript
D 5.3.2 – 2nd
Trial Evaluation
Document Project Deliverable
Project Number AAL-201-4-024
Project Name Confidence
Duration June 2012 – May 2015 (36 Months)
Coordinator Salzburg Research Forschungsgesellschaft mbH
Document ID D 5.3.2
Release Number /Date V1/15th
May 2015
Checked and released by Alexandru Sterea, AAIF
Document Type Project Deliverable
Original Due Date 15th
May 2015
Dissemination Level Public
Main Editor Alexandru Sterea, AAIF
Contributing Partners All partners
Reviewed by Viktoria Willner, SRFG
Short Description
In Confidence a mobility safeguarding assistance service with community functionality was
developed. This service was tested within two field trials. This document presents the evaluation of
the second field trial.
© 2014 Confidence project consortium. Not to be reproduced or copied without permission.
The Confidence project is co-funded by the European AAL Joint Programme
Revisions
Rev. Date Author Description
0.1 30.4.2015 Viktoria Willner Template, Statistics
0.2 19.5.2015 Alexandru Sterea Text
0.3 31.5.2015 Viktoria Willner Review, Finalization
List of Authors
Alexandru Sterea (AAIF)
Viktoria Willner (SRFG)
Inhalt 1 Executive Summary ......................................................................................................................... 4
2 Introduction ..................................................................................................................................... 5
2.1 Purpose of this document ....................................................................................................... 5
2.2 Scope and Relationship to other Deliverables ........................................................................ 5
2.3 Definitions, Acronyms and Abbreviations ............................................................................... 5
3 Demography .................................................................................................................................... 6
3.1 Primary End-Users ................................................................................................................... 6
3.2 Secondary End-Users ............................................................................................................... 8
3.3 Volunteers ............................................................................................................................. 10
4 Safety and Mobility ....................................................................................................................... 12
5 Autonomy and Independence ....................................................................................................... 15
5.1 Primary End-Users ................................................................................................................. 15
5.2 Secondary End-Users ............................................................................................................. 16
6 Daily Assistance ............................................................................................................................. 19
7 Quality of Life ................................................................................................................................ 22
7.1 Primary End-Users ................................................................................................................. 22
7.2 Secondary End-Users ............................................................................................................. 24
8 Usability ......................................................................................................................................... 25
8.1 Primary End-Users ................................................................................................................. 26
8.2 Secondary End-Users ............................................................................................................. 34
9 Business ......................................................................................................................................... 39
10 Volunteers ................................................................................................................................. 41
1 Executive Summary
The purpose of the Confidence project consists in developing a mobility safeguarding assistance
service with community functionality for people with mild to moderate neurocognitive impairments.
This document describes the evaluation of the second field trial conducted in Austria, Switzerland,
and Romania. First, the demographic data of the involved end-users are presented. The second field
trial focused on measuring the effects of the usage of Confidence. These effects were evaluated
following an internal defined process. Participants were interviewed at three different points (before,
during and after the trial). The questions were related to an evaluation area (“safety and mobility”,
“autonomy and independence”, “daily assistance”, “quality of life”). So, this document presents the
results of the evaluated questions divided into these areas. Additionally, it provides the usability
evaluation and surveyed information according to business aspects. Finally, this document shows
further information about the integration of volunteers, which was important to gain insights into
community support.
2 Introduction
2.1 Purpose of the document This document contents the most important and detailed information about the second trial
evaluation of the Confidence app. The participants of this trial were person suffering from Mi-MoD as
primary end-users (as well as elderly without cognitive impairments), the persons being mainly in
contact with them, usually a life partner, son / daughter or relative, neighbour or a formal carer as
secondary end-users and the volunteers. They tested the Confidence app for six weeks and their
feedback was collected and analysed in this document. It includes the information about
demography, safety and mobility, autonomy and independence, daily assistance and quality of life.
Additionally, usability and business aspects are treated.
2.2 Scope and Relationship to other Deliverables
This document relates to deliverable D5.1, which contains more information about the field trials
setup and scenarios (D5.1, 2013). Additionally, it relates to D5.4 which describes the methodology
and organisation of the Confidence trials in general (D5.4, 2014).
2.3 Definitions, Acronyms and Abbreviations
Mi-MoD Mild-to-Moderate Dementia
MMSE Mini Mental State Examination (test)
PEU primary end user: the person suffering from Mi-MoD
SEU secondary end user: the person being mainly in contact with the PEU, usually a
spouse, son / daughter or neighbour
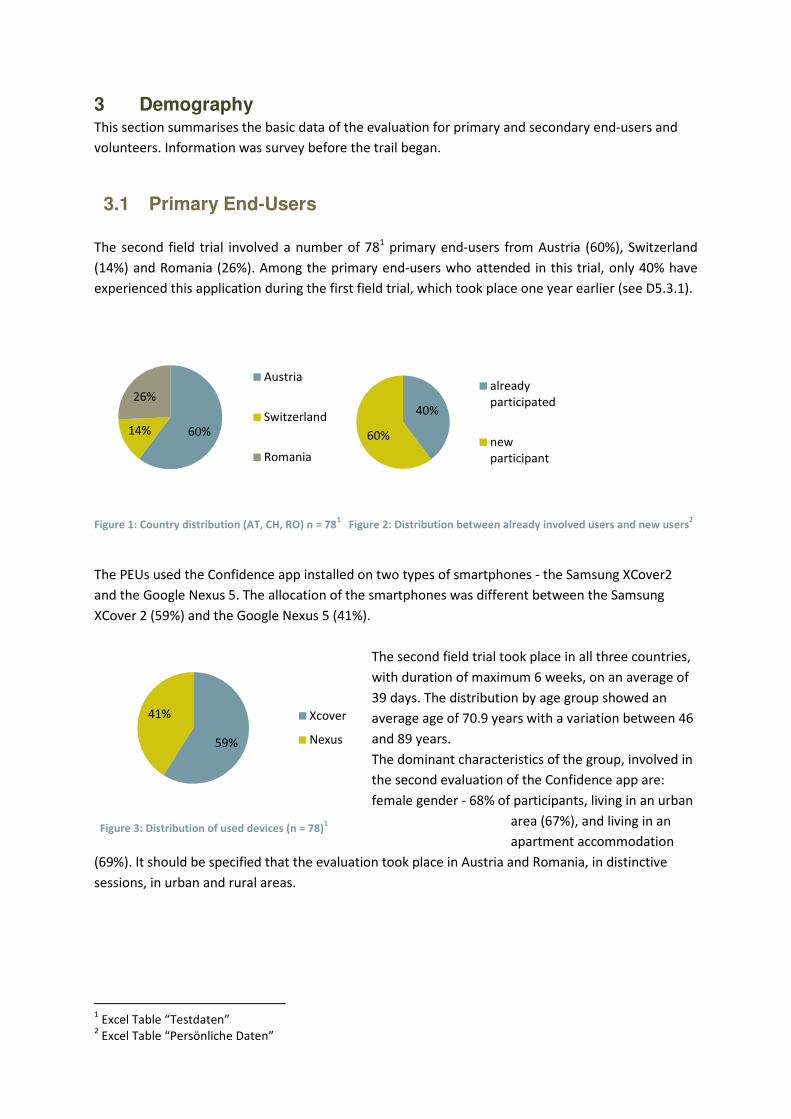
3 Demography This section summarises the basic data of the evaluation for primary and secondary end-users and
volunteers. Information was survey before the trail began.
3.1 Primary End-Users
The second field trial involved a number of 781 primary end-users from Austria (60%), Switzerland
(14%) and Romania (26%). Among the primary end-users who attended in this trial, only 40% have
experienced this application during the first field trial, which took place one year earlier (see D5.3.1).
Figure 1: Country distribution (AT, CH, RO) n = 78
1 Figure 2: Distribution between already involved users and new users
2
The PEUs used the Confidence app installed on two types of smartphones - the Samsung XCover2
and the Google Nexus 5. The allocation of the smartphones was different between the Samsung
XCover 2 (59%) and the Google Nexus 5 (41%).
The second field trial took place in all three countries,
with duration of maximum 6 weeks, on an average of
39 days. The distribution by age group showed an
average age of 70.9 years with a variation between 46
and 89 years.
The dominant characteristics of the group, involved in
the second evaluation of the Confidence app are:
female gender - 68% of participants, living in an urban
area (67%), and living in an
apartment accommodation
(69%). It should be specified that the evaluation took place in Austria and Romania, in distinctive
sessions, in urban and rural areas.
1 Excel Table “Testdaten”
2 Excel Table “Persönliche Daten”
60%14%
26%
Austria
Switzerland
Romania
40%
60%
already
participated
new
participant
59%
41% Xcover
Nexus
Figure 3: Distribution of used devices (n = 78)1
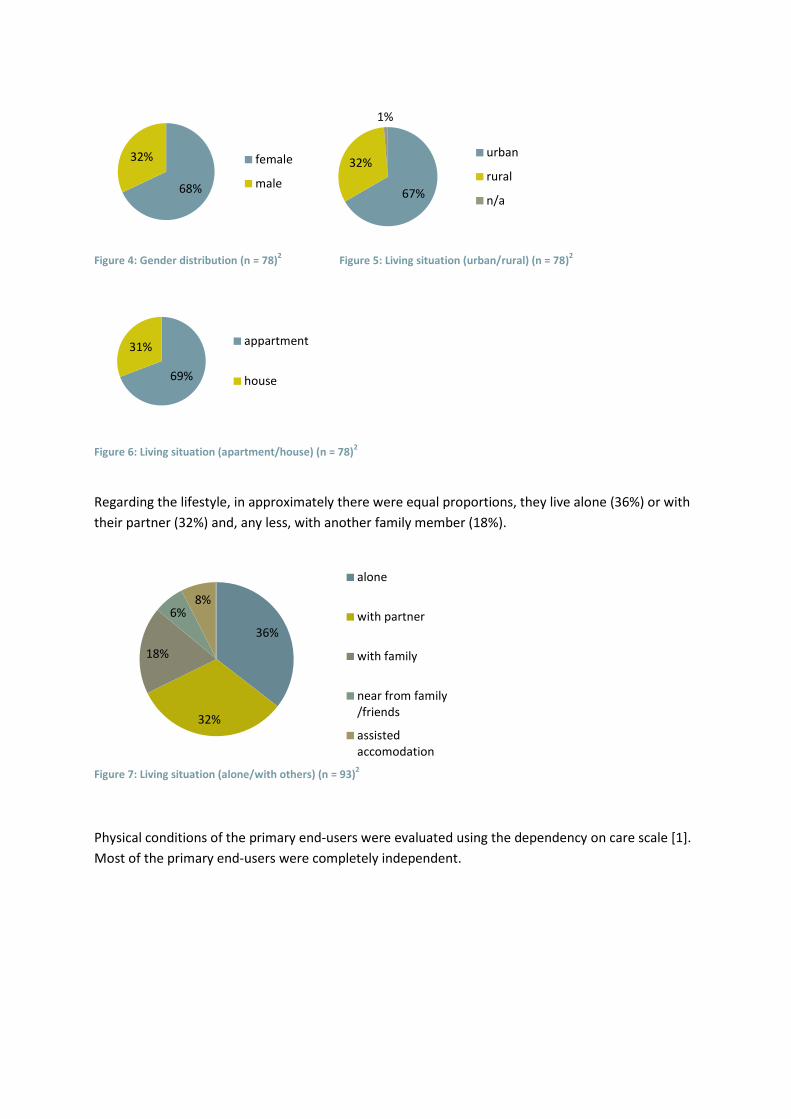
Figure 4: Gender distribution (n = 78)
2 Figure 5: Living situation (urban/rural) (n = 78)
2
Figure 6: Living situation (apartment/house) (n = 78)
2
Regarding the lifestyle, in approximately there were equal proportions, they live alone (36%) or with
their partner (32%) and, any less, with another family member (18%).
Figure 7: Living situation (alone/with others) (n = 93)
2
Physical conditions of the primary end-users were evaluated using the dependency on care scale [1].
Most of the primary end-users were completely independent.
68%
32% female
male67%
32%
1%
urban
rural
n/a
69%
31%appartment
house
36%
32%
18%
6%8%
alone
with partner
with family
near from family
/friends
assisted
accomodation
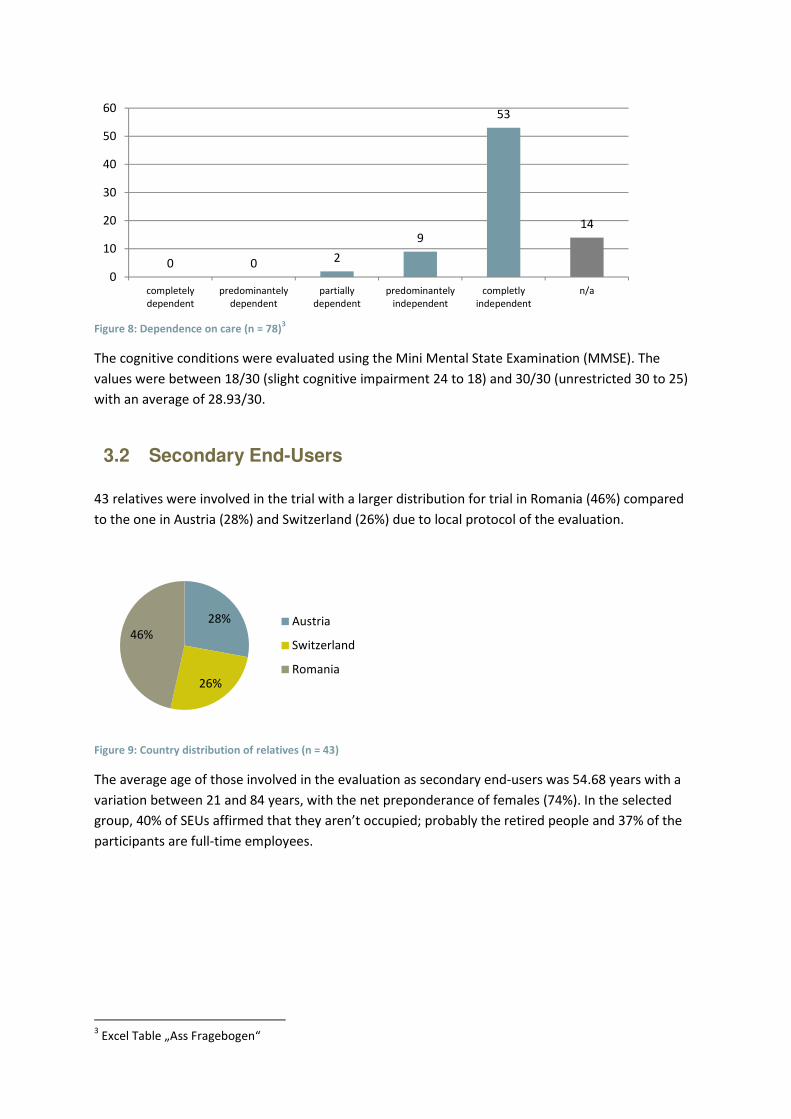
Figure 8: Dependence on care (n = 78)
3
The cognitive conditions were evaluated using the Mini Mental State Examination (MMSE). The
values were between 18/30 (slight cognitive impairment 24 to 18) and 30/30 (unrestricted 30 to 25)
with an average of 28.93/30.
3.2 Secondary End-Users
43 relatives were involved in the trial with a larger distribution for trial in Romania (46%) compared
to the one in Austria (28%) and Switzerland (26%) due to local protocol of the evaluation.
Figure 9: Country distribution of relatives (n = 43)
The average age of those involved in the evaluation as secondary end-users was 54.68 years with a
variation between 21 and 84 years, with the net preponderance of females (74%). In the selected
group, 40% of SEUs affirmed that they aren’t occupied; probably the retired people and 37% of the
participants are full-time employees.
3 Excel Table „Ass Fragebogen“
0 0 2
9
53
14
0
10
20
30
40
50
60
completely
dependent
predominantely
dependent
partially
dependent
predominantely
independent
completly
independent
n/a
28%
26%
46%Austria
Switzerland
Romania
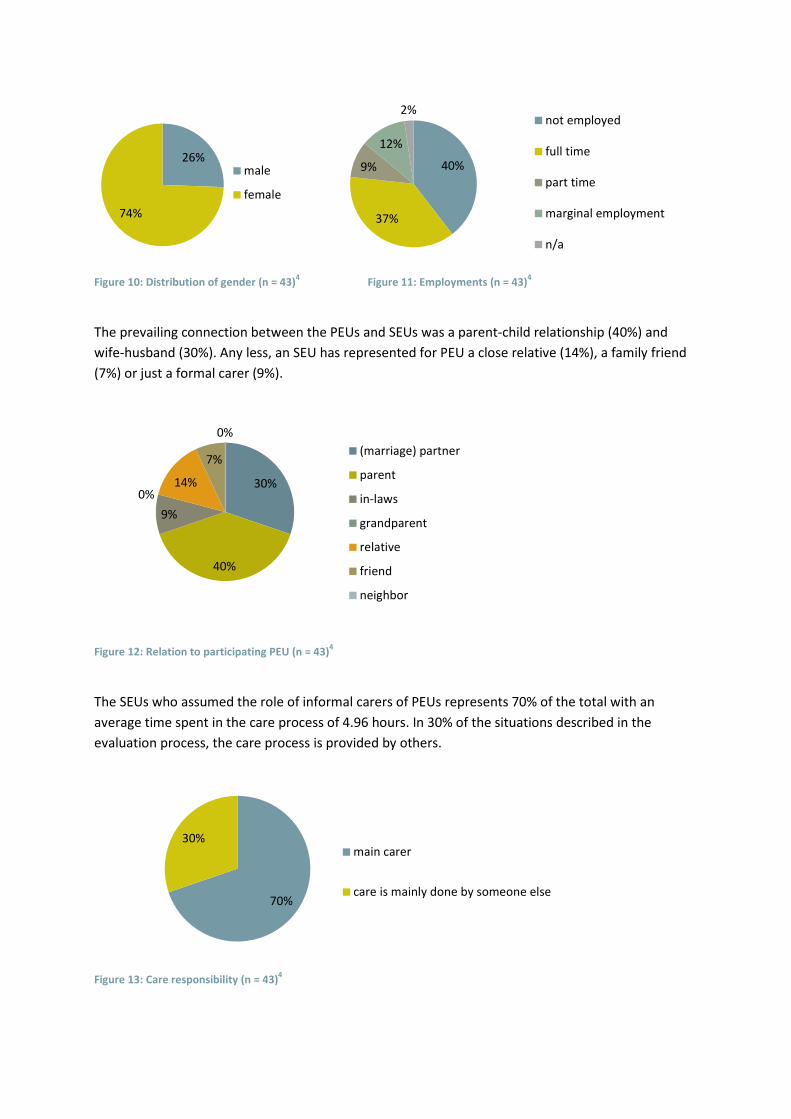
Figure 10: Distribution of gender (n = 43)
4 Figure 11: Employments (n = 43)
4
The prevailing connection between the PEUs and SEUs was a parent-child relationship (40%) and
wife-husband (30%). Any less, an SEU has represented for PEU a close relative (14%), a family friend
(7%) or just a formal carer (9%).
Figure 12: Relation to participating PEU (n = 43)
4
The SEUs who assumed the role of informal carers of PEUs represents 70% of the total with an
average time spent in the care process of 4.96 hours. In 30% of the situations described in the
evaluation process, the care process is provided by others.
Figure 13: Care responsibility (n = 43)
4
26%
74%
male
female
40%
37%
9%
12%
2%not employed
full time
part time
marginal employment
n/a
30%
40%
9%
0%14%
7%
0%
(marriage) partner
parent
in-laws
grandparent
relative
friend
neighbor
70%
30%main carer
care is mainly done by someone else
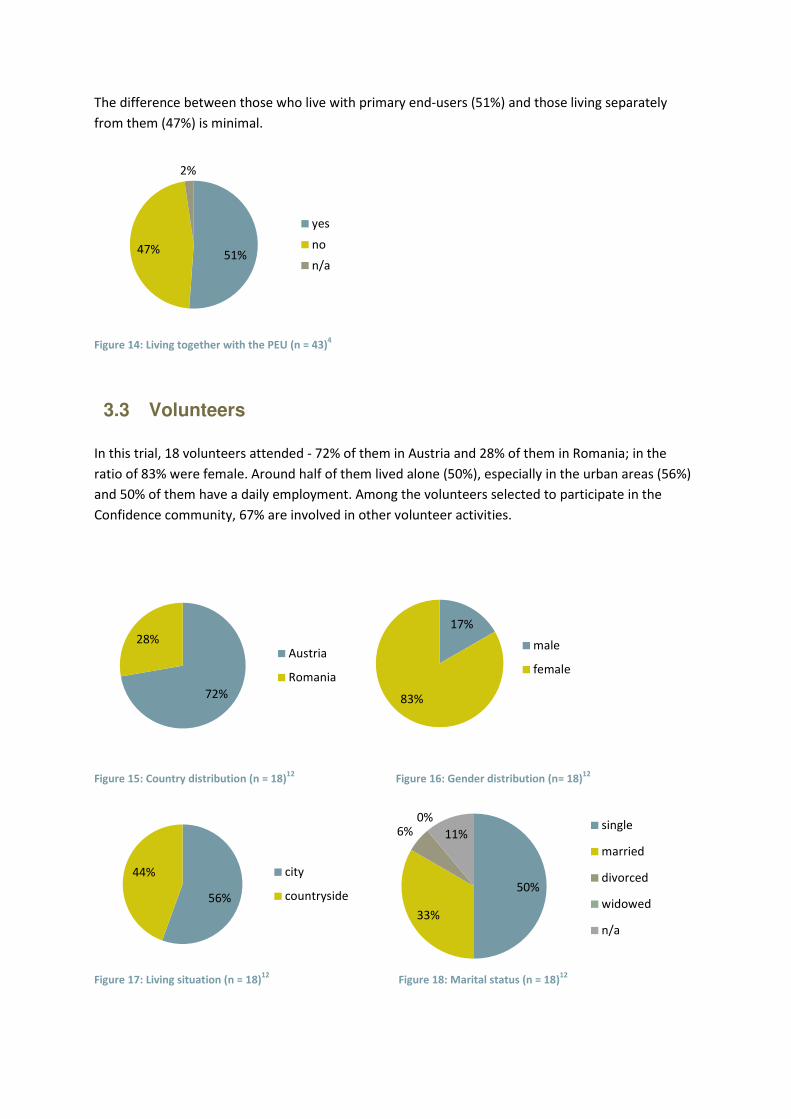
The difference between those who live with primary end-users (51%) and those living separately
from them (47%) is minimal.
Figure 14: Living together with the PEU (n = 43)
4
3.3 Volunteers
In this trial, 18 volunteers attended - 72% of them in Austria and 28% of them in Romania; in the
ratio of 83% were female. Around half of them lived alone (50%), especially in the urban areas (56%)
and 50% of them have a daily employment. Among the volunteers selected to participate in the
Confidence community, 67% are involved in other volunteer activities.
Figure 15: Country distribution (n = 18)
12 Figure 16: Gender distribution (n= 18)
12
Figure 17: Living situation (n = 18)
12 Figure 18: Marital status (n = 18)
12
51%47%
2%
yes
no
n/a
72%
28%Austria
Romania
17%
83%
male
female
56%
44% city
countryside50%
33%
6%0%
11%single
married
divorced
widowed
n/a
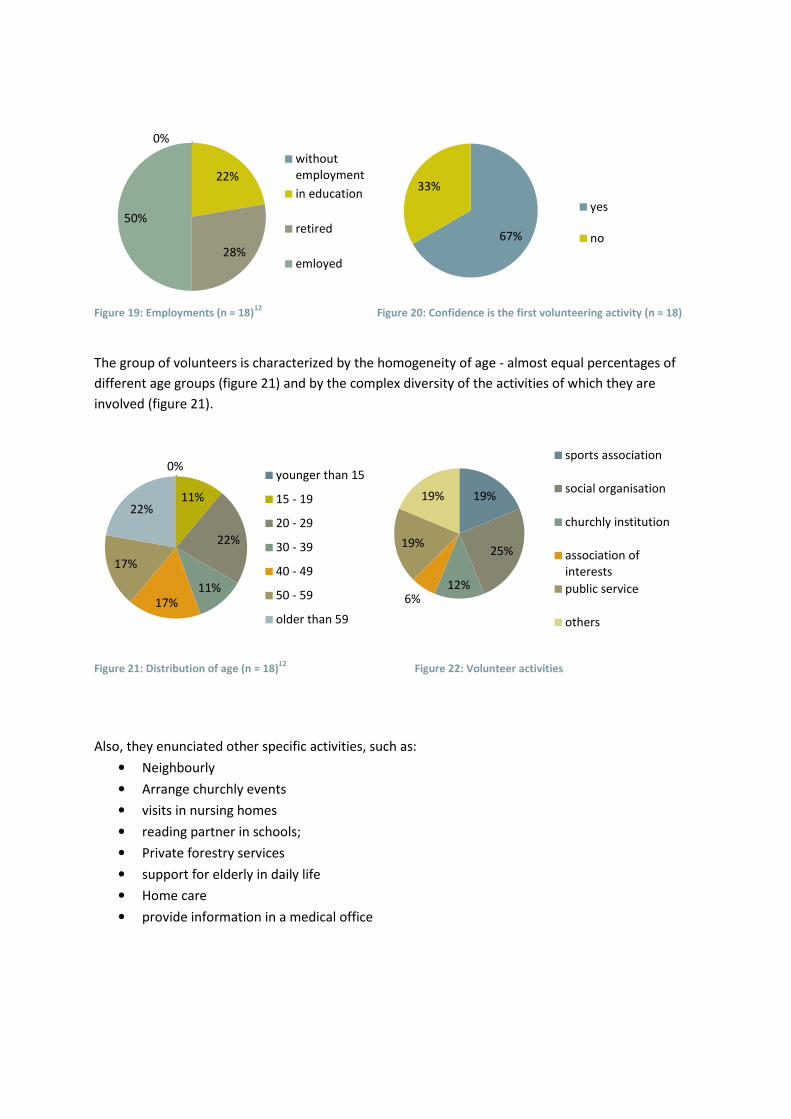
Figure 19: Employments (n = 18)
12 Figure 20: Confidence is the first volunteering activity (n = 18)
The group of volunteers is characterized by the homogeneity of age - almost equal percentages of
different age groups (figure 21) and by the complex diversity of the activities of which they are
involved (figure 21).
Figure 21: Distribution of age (n = 18)
12 Figure 22: Volunteer activities
Also, they enunciated other specific activities, such as:
• Neighbourly
• Arrange churchly events
• visits in nursing homes
• reading partner in schools;
• Private forestry services
• support for elderly in daily life
• Home care
• provide information in a medical office
0%
22%
28%
50%
without
employment
in education
retired
emloyed
67%
33%
yes
no
0%
11%
22%
11%
17%
17%
22%
younger than 15
15 - 19
20 - 29
30 - 39
40 - 49
50 - 59
older than 59
19%
25%
12%6%
19%
19%
sports association
social organisation
churchly institution
association of
interests
public service
others
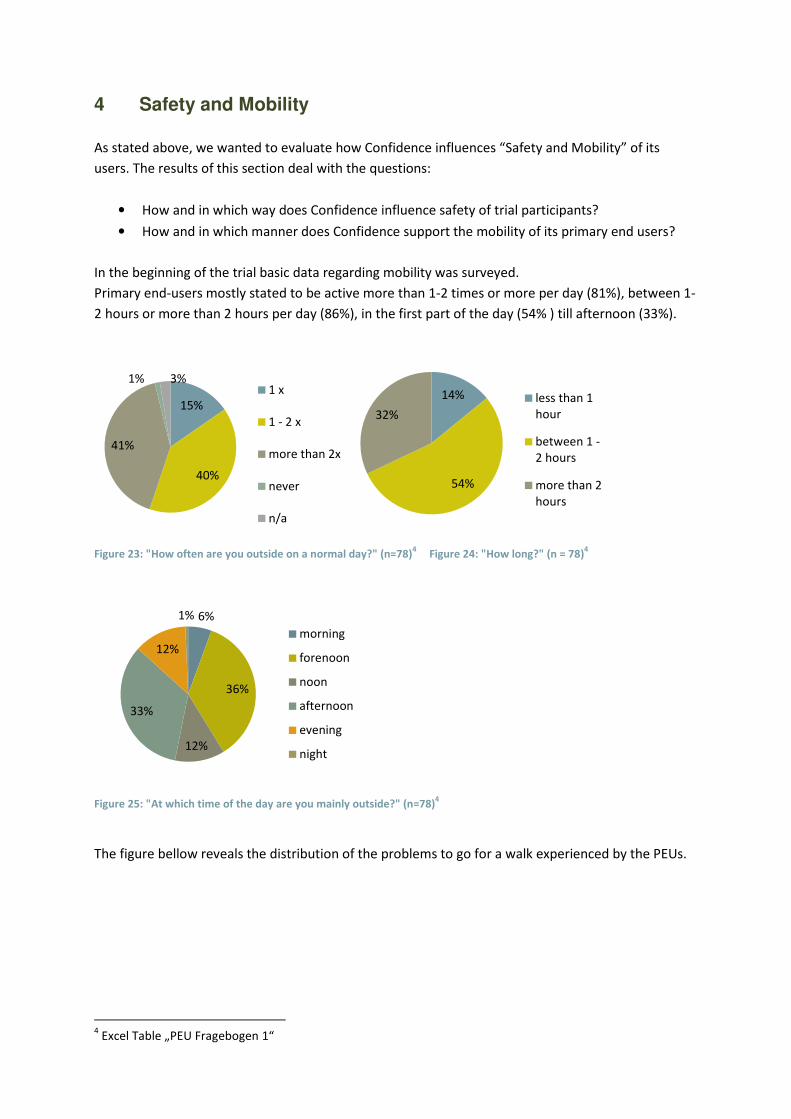
4 Safety and Mobility
As stated above, we wanted to evaluate how Confidence influences “Safety and Mobility” of its
users. The results of this section deal with the questions:
• How and in which way does Confidence influence safety of trial participants?
• How and in which manner does Confidence support the mobility of its primary end users?
In the beginning of the trial basic data regarding mobility was surveyed.
Primary end-users mostly stated to be active more than 1-2 times or more per day (81%), between 1-
2 hours or more than 2 hours per day (86%), in the first part of the day (54% ) till afternoon (33%).
Figure 23: "How often are you outside on a normal day?" (n=78)
4 Figure 24: "How long?" (n = 78)
4
Figure 25: "At which time of the day are you mainly outside?" (n=78)
4
The figure bellow reveals the distribution of the problems to go for a walk experienced by the PEUs.
4 Excel Table „PEU Fragebogen 1“
15%
40%
41%
1% 3%1 x
1 - 2 x
more than 2x
never
n/a
14%
54%
32%
less than 1
hour
between 1 -
2 hours
more than 2
hours
6%
36%
12%
33%
12%
1%
morning
forenoon
noon
afternoon
evening
night
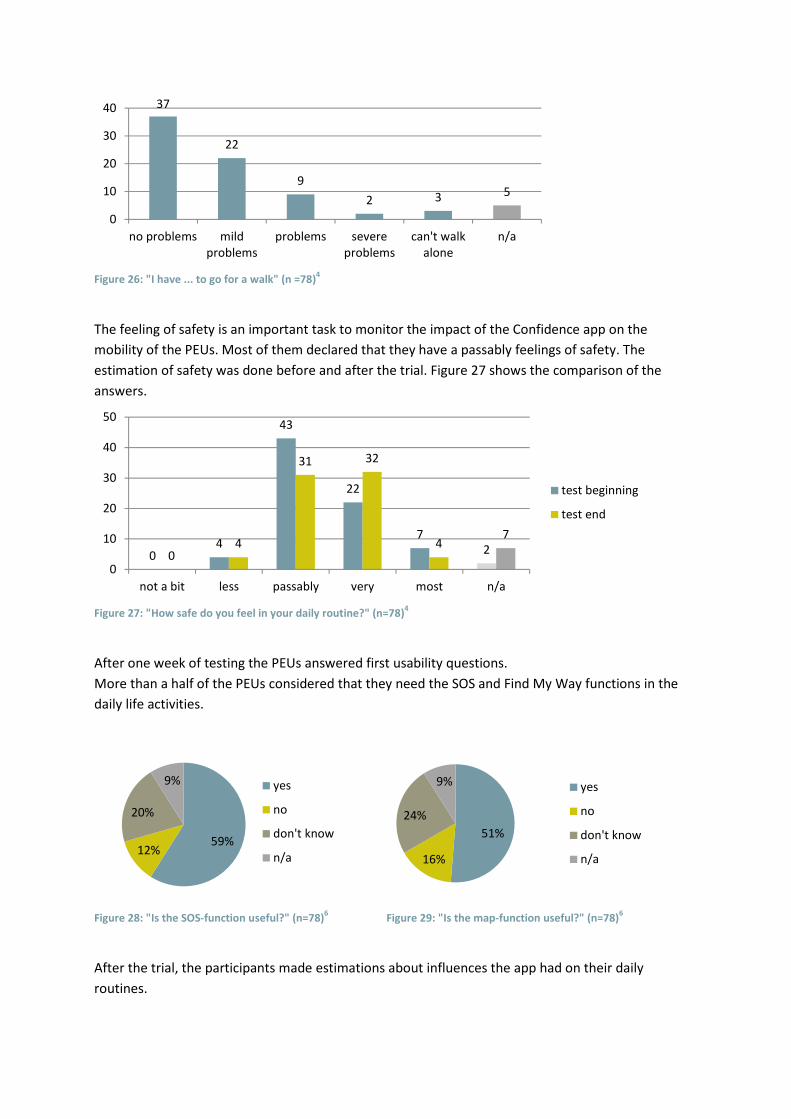
Figure 26: "I have ... to go for a walk" (n =78)
4
The feeling of safety is an important task to monitor the impact of the Confidence app on the
mobility of the PEUs. Most of them declared that they have a passably feelings of safety. The
estimation of safety was done before and after the trial. Figure 27 shows the comparison of the
answers.
Figure 27: "How safe do you feel in your daily routine?" (n=78)
4
After one week of testing the PEUs answered first usability questions.
More than a half of the PEUs considered that they need the SOS and Find My Way functions in the
daily life activities.
Figure 28: "Is the SOS-function useful?" (n=78)
6 Figure 29: "Is the map-function useful?" (n=78)
6
After the trial, the participants made estimations about influences the app had on their daily
routines.
37
22
9
2 3 5
0
10
20
30
40
no problems mild
problems
problems severe
problems
can't walk
alone
n/a
04
43
22
7
20
4
31 32
47
0
10
20
30
40
50
not a bit less passably very most n/a
test beginning
test end
59%12%
20%
9% yes
no
don't know
n/a
51%
16%
24%
9% yes
no
don't know
n/a
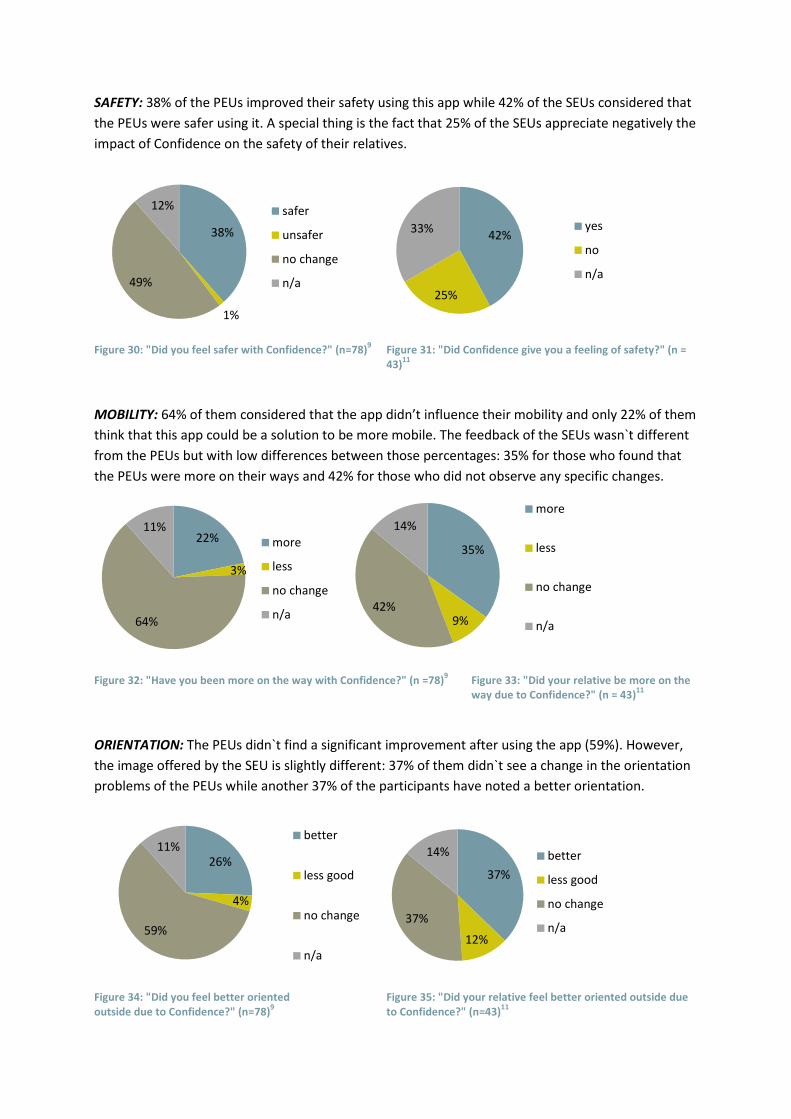
SAFETY: 38% of the PEUs improved their safety using this app while 42% of the SEUs considered that
the PEUs were safer using it. A special thing is the fact that 25% of the SEUs appreciate negatively the
impact of Confidence on the safety of their relatives.
Figure 30: "Did you feel safer with Confidence?" (n=78)
9 Figure 31: "Did Confidence give you a feeling of safety?" (n =
43)11
MOBILITY: 64% of them considered that the app didn’t influence their mobility and only 22% of them
think that this app could be a solution to be more mobile. The feedback of the SEUs wasn`t different
from the PEUs but with low differences between those percentages: 35% for those who found that
the PEUs were more on their ways and 42% for those who did not observe any specific changes.
Figure 32: "Have you been more on the way with Confidence?" (n =78)
9 Figure 33: "Did your relative be more on the
way due to Confidence?" (n = 43)11
ORIENTATION: The PEUs didn`t find a significant improvement after using the app (59%). However,
the image offered by the SEU is slightly different: 37% of them didn`t see a change in the orientation
problems of the PEUs while another 37% of the participants have noted a better orientation.
Figure 34: "Did you feel better oriented Figure 35: "Did your relative feel better oriented outside due
outside due to Confidence?" (n=78)9 to Confidence?" (n=43)
11
38%
1%
49%
12% safer
unsafer
no change
n/a
42%
25%
33% yes
no
n/a
22%
3%
64%
11%
more
less
no change
n/a
35%
9%42%
14%
more
less
no change
n/a
26%
4%
59%
11%better
less good
no change
n/a
37%
12%
37%
14% better
less good
no change
n/a
5 Autonomy and Independence
The question related to this topic is:
• In which respect and how does the usage of Confidence influence the autonomy and
independence of the primary and secondary end users?
5.1 Primary End-Users
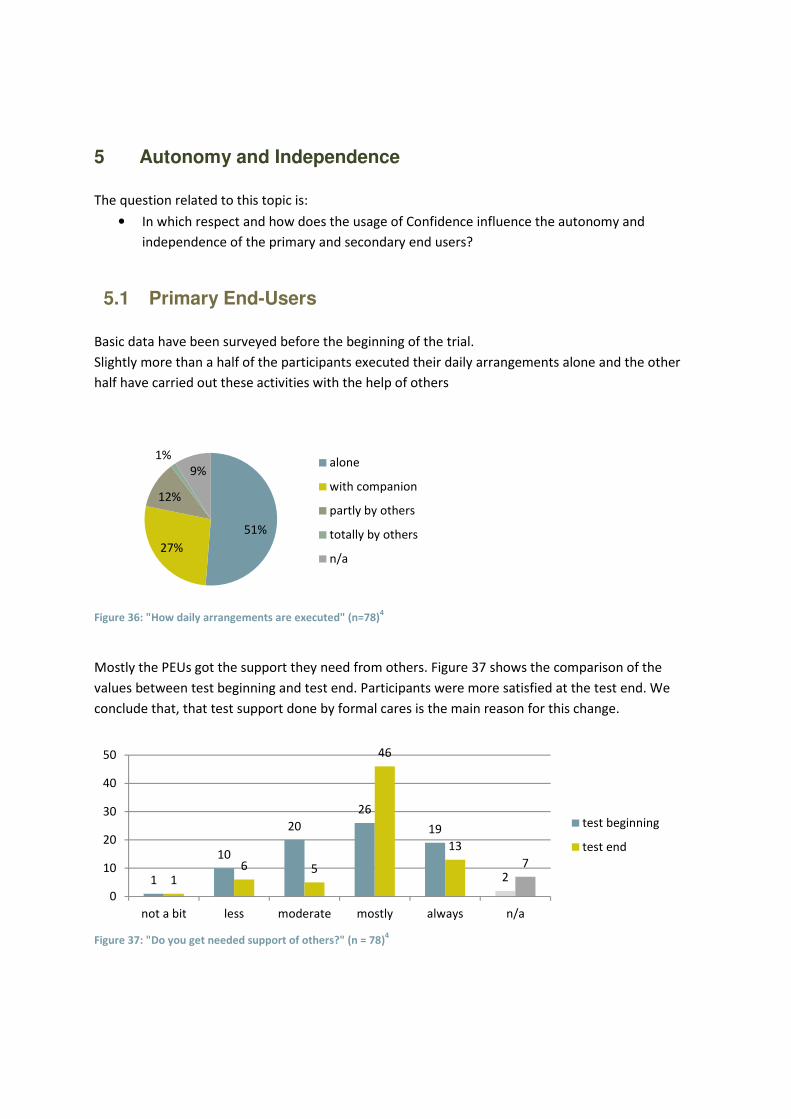
Basic data have been surveyed before the beginning of the trial.
Slightly more than a half of the participants executed their daily arrangements alone and the other
half have carried out these activities with the help of others
Figure 36: "How daily arrangements are executed" (n=78)
4
Mostly the PEUs got the support they need from others. Figure 37 shows the comparison of the
values between test beginning and test end. Participants were more satisfied at the test end. We
conclude that, that test support done by formal cares is the main reason for this change.
Figure 37: "Do you get needed support of others?" (n = 78)
4
51%
27%
12%
1%
9%alone
with companion
partly by others
totally by others
n/a
1
10
20
26
19
216 5
46
13
7
0
10
20
30
40
50
not a bit less moderate mostly always n/a
test beginning
test end
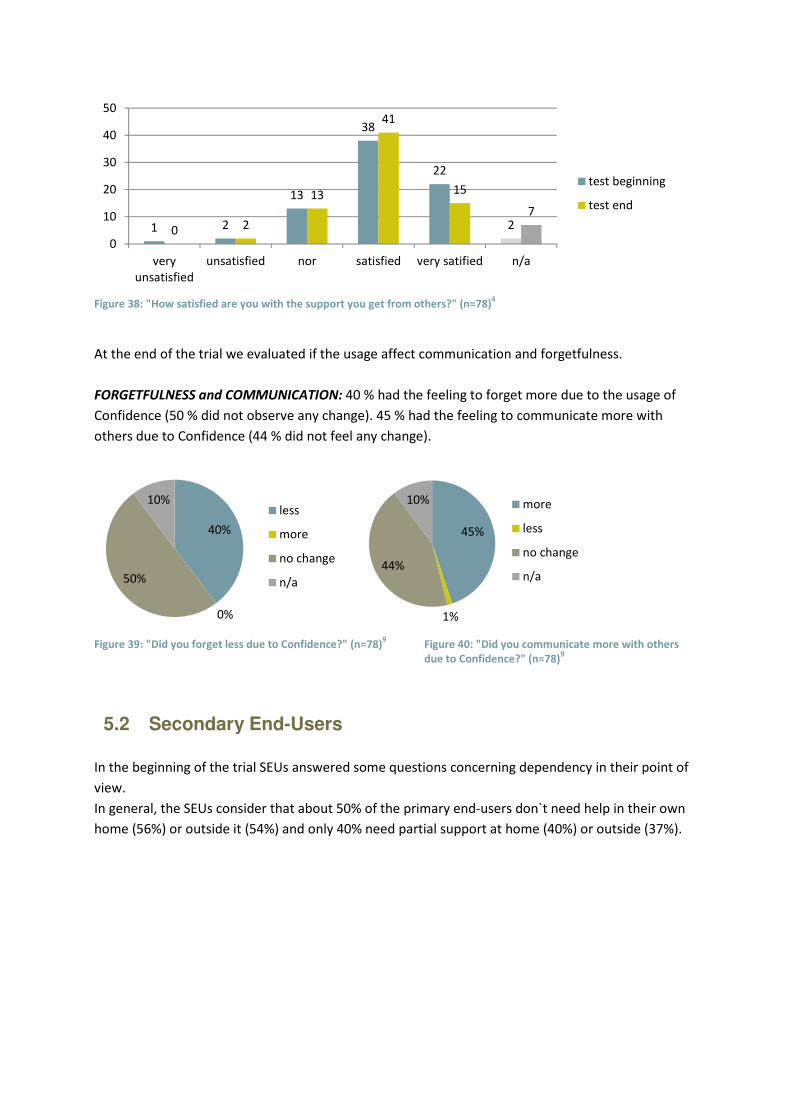
Figure 38: "How satisfied are you with the support you get from others?" (n=78)
4
At the end of the trial we evaluated if the usage affect communication and forgetfulness.
FORGETFULNESS and COMMUNICATION: 40 % had the feeling to forget more due to the usage of
Confidence (50 % did not observe any change). 45 % had the feeling to communicate more with
others due to Confidence (44 % did not feel any change).
Figure 39: "Did you forget less due to Confidence?" (n=78)
9 Figure 40: "Did you communicate more with others
due to Confidence?" (n=78)9
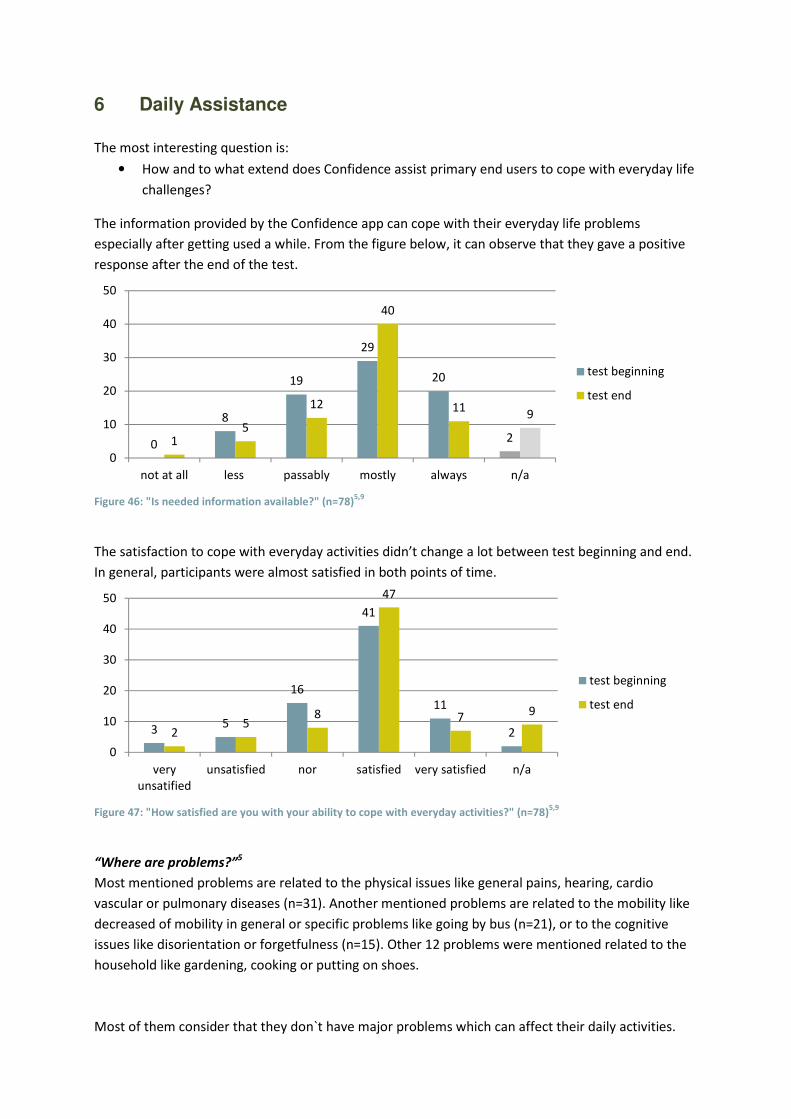
5.2 Secondary End-Users
In the beginning of the trial SEUs answered some questions concerning dependency in their point of
view.
In general, the SEUs consider that about 50% of the primary end-users don`t need help in their own
home (56%) or outside it (54%) and only 40% need partial support at home (40%) or outside (37%).
1 2
13
38
22
20 2
13
41
15
7
0
10
20
30
40
50
very
unsatisfied
unsatisfied nor satisfied very satified n/a
test beginning
test end
40%
0%
50%
10%less
more
no change
n/a
45%
1%
44%
10% more
less
no change
n/a
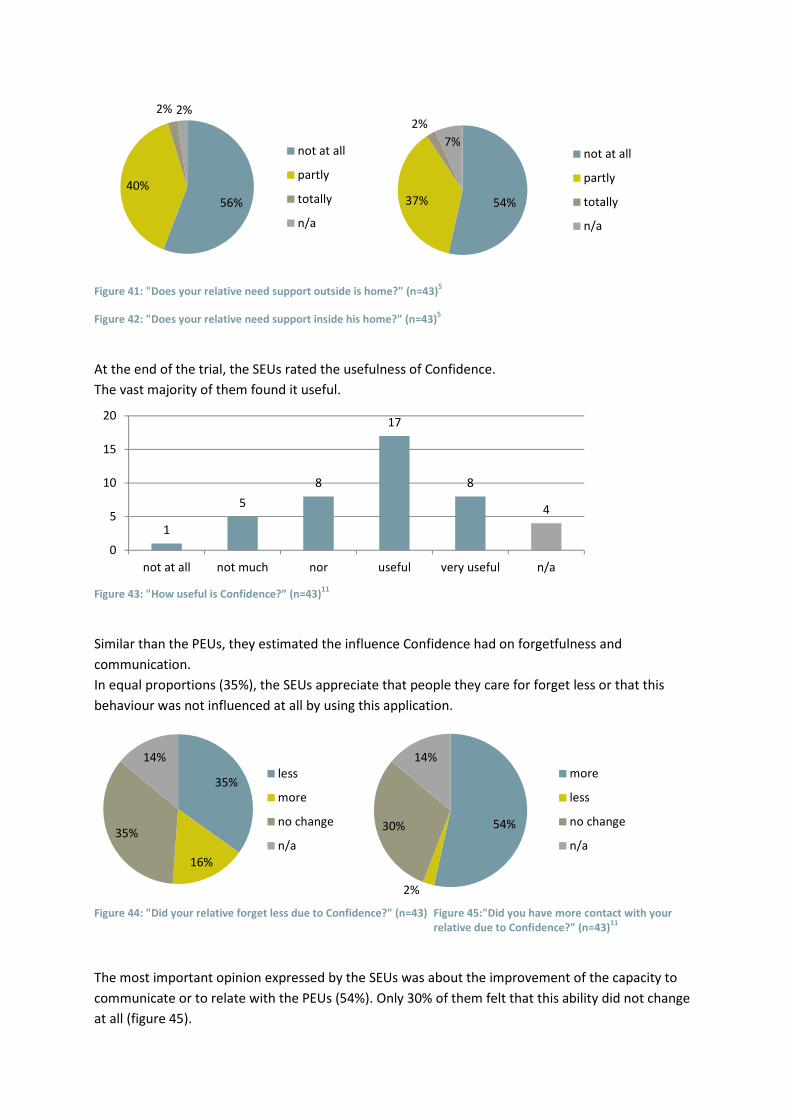
Figure 41: "Does your relative need support outside is home?" (n=43)
5
Figure 42: "Does your relative need support inside his home?" (n=43)5
At the end of the trial, the SEUs rated the usefulness of Confidence.
The vast majority of them found it useful.
Figure 43: "How useful is Confidence?” (n=43)
11
Similar than the PEUs, they estimated the influence Confidence had on forgetfulness and
communication.
In equal proportions (35%), the SEUs appreciate that people they care for forget less or that this
behaviour was not influenced at all by using this application.
Figure 44: "Did your relative forget less due to Confidence?" (n=43) Figure 45:"Did you have more contact with your
relative due to Confidence?" (n=43)11
The most important opinion expressed by the SEUs was about the improvement of the capacity to
communicate or to relate with the PEUs (54%). Only 30% of them felt that this ability did not change
at all (figure 45).
56%
40%
2% 2%
not at all
partly
totally
n/a
54%37%
2%
7%not at all
partly
totally
n/a
1
5
8
17
8
4
0
5
10
15
20
not at all not much nor useful very useful n/a
35%
16%
35%
14%
less
more
no change
n/a
54%
2%
30%
14%
more
less
no change
n/a

6 Daily Assistance
The most interesting question is:
• How and to what extend does Confidence assist primary end users to cope with everyday life
challenges?
The information provided by the Confidence app can cope with their everyday life problems
especially after getting used a while. From the figure below, it can observe that they gave a positive
response after the end of the test.
Figure 46: "Is needed information available?" (n=78)
5,9
The satisfaction to cope with everyday activities didn’t change a lot between test beginning and end.
In general, participants were almost satisfied in both points of time.
Figure 47: "How satisfied are you with your ability to cope with everyday activities?" (n=78)
5,9
“Where are problems?”5
Most mentioned problems are related to the physical issues like general pains, hearing, cardio
vascular or pulmonary diseases (n=31). Another mentioned problems are related to the mobility like
decreased of mobility in general or specific problems like going by bus (n=21), or to the cognitive
issues like disorientation or forgetfulness (n=15). Other 12 problems were mentioned related to the
household like gardening, cooking or putting on shoes.
Most of them consider that they don`t have major problems which can affect their daily activities.
0
8
19
29
20
215
12
40
119
0
10
20
30
40
50
not at all less passably mostly always n/a
test beginning
test end
35
16
41
11
225
8
47
79
0
10
20
30
40
50
very
unsatified
unsatisfied nor satisfied very satisfied n/a
test beginning
test end
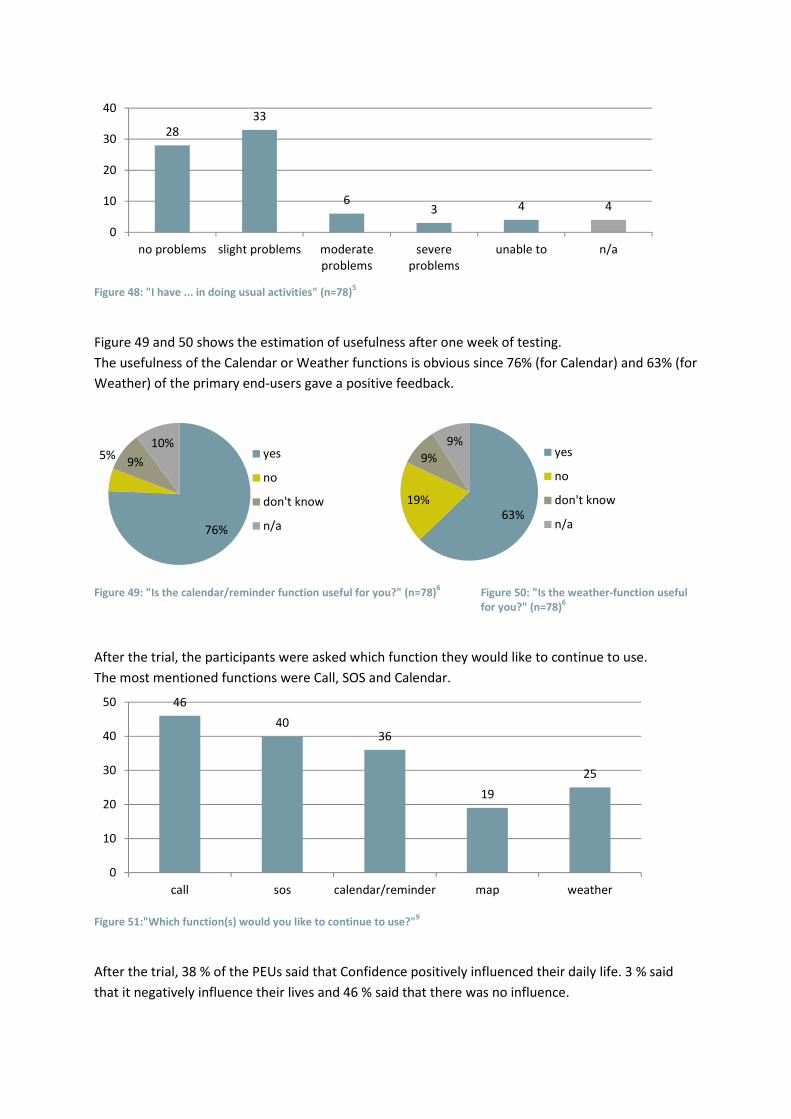
Figure 48: "I have ... in doing usual activities" (n=78)
5
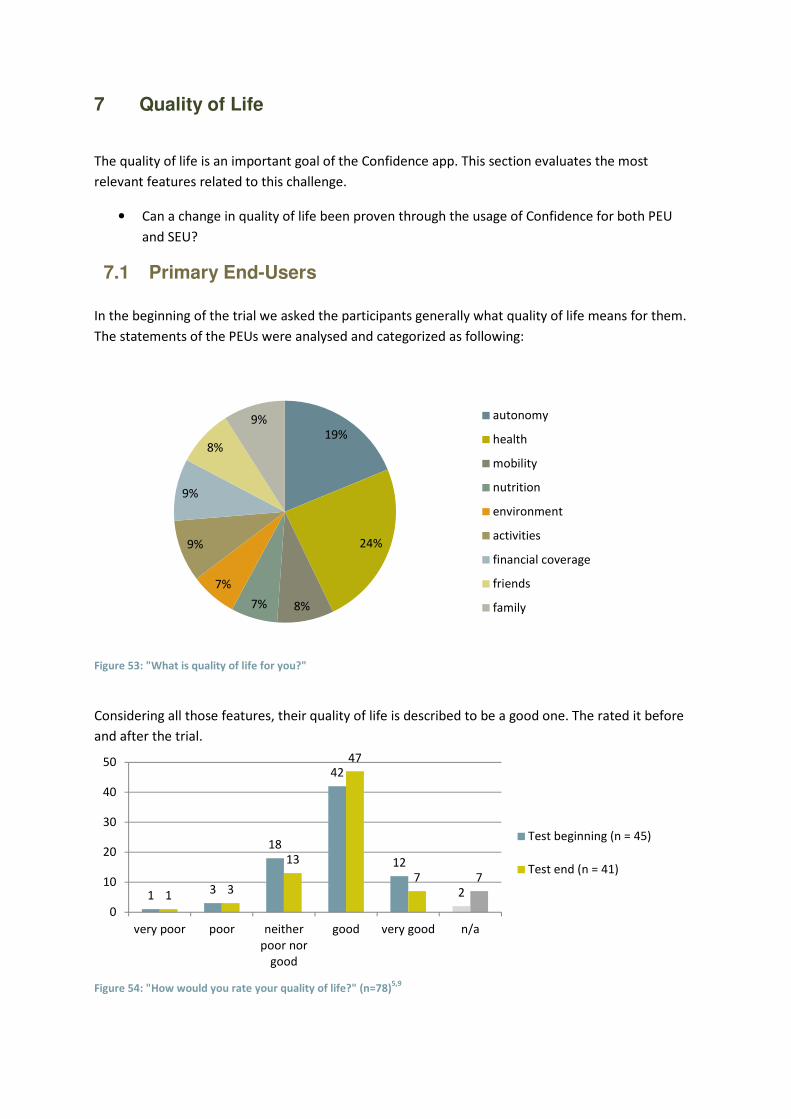
Figure 49 and 50 shows the estimation of usefulness after one week of testing.
The usefulness of the Calendar or Weather functions is obvious since 76% (for Calendar) and 63% (for
Weather) of the primary end-users gave a positive feedback.
Figure 49: "Is the calendar/reminder function useful for you?" (n=78)
6 Figure 50: "Is the weather-function useful
for you?" (n=78)6
After the trial, the participants were asked which function they would like to continue to use.
The most mentioned functions were Call, SOS and Calendar.
Figure 51:"Which function(s) would you like to continue to use?"
9
After the trial, 38 % of the PEUs said that Confidence positively influenced their daily life. 3 % said
that it negatively influence their lives and 46 % said that there was no influence.
28
33
63 4 4
0
10
20
30
40
no problems slight problems moderate
problems
severe
problems
unable to n/a
76%
5%9%
10%yes
no
don't know
n/a63%
19%
9%
9%yes
no
don't know
n/a
46
4036
19
25
0
10
20
30
40
50
call sos calendar/reminder map weather

Figure 52:"Did Confidence influence your everyday life?" (n=78)
9
38%
3%
46%
13%positive
negative
no influence
n/a
7 Quality of Life
The quality of life is an important goal of the Confidence app. This section evaluates the most
relevant features related to this challenge.
• Can a change in quality of life been proven through the usage of Confidence for both PEU
and SEU?
7.1 Primary End-Users
In the beginning of the trial we asked the participants generally what quality of life means for them.
The statements of the PEUs were analysed and categorized as following:
Figure 53: "What is quality of life for you?"
Considering all those features, their quality of life is described to be a good one. The rated it before
and after the trial.
Figure 54: "How would you rate your quality of life?" (n=78)
5,9
19%
24%
8%7%
7%
9%
9%
8%
9% autonomy
health
mobility
nutrition
environment
activities
financial coverage
friends
family
1 3
18
42
12
21 3
13
47
7 7
0
10
20
30
40
50
very poor poor neither
poor nor
good
good very good n/a
Test beginning (n = 45)
Test end (n = 41)
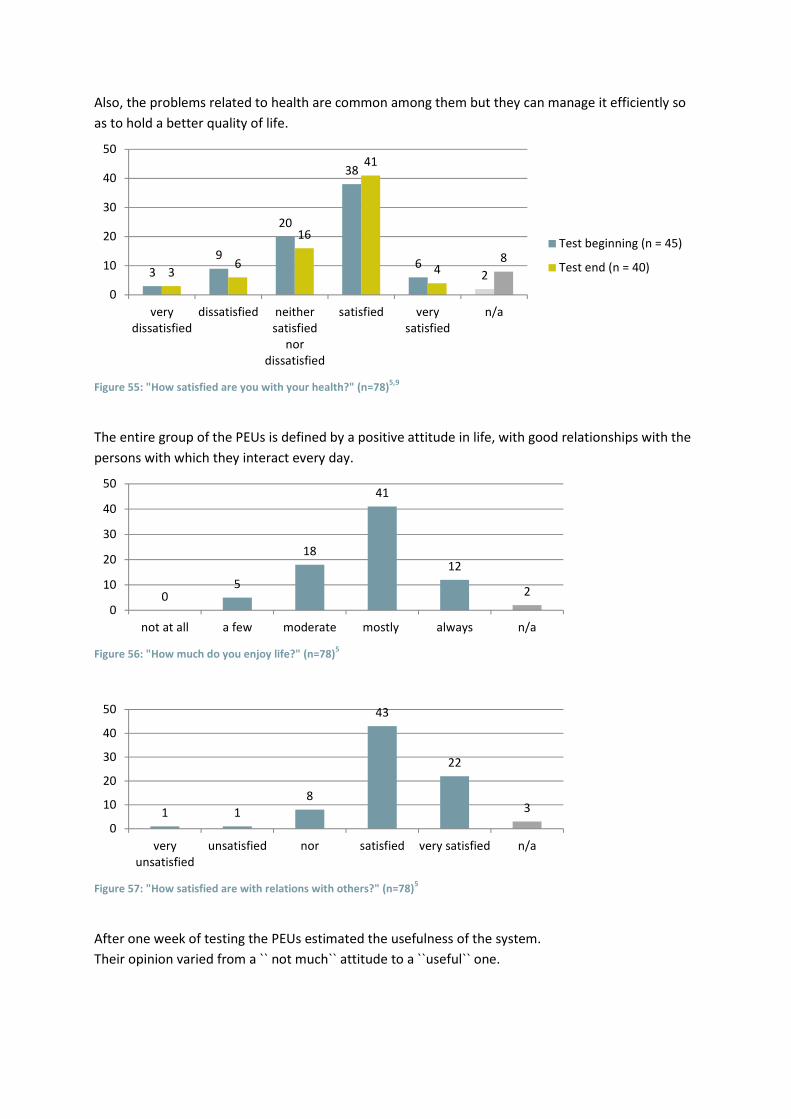
Also, the problems related to health are common among them but they can manage it efficiently so
as to hold a better quality of life.
Figure 55: "How satisfied are you with your health?" (n=78)
5,9
The entire group of the PEUs is defined by a positive attitude in life, with good relationships with the
persons with which they interact every day.
Figure 56: "How much do you enjoy life?" (n=78)
5
Figure 57: "How satisfied are with relations with others?" (n=78)
5
After one week of testing the PEUs estimated the usefulness of the system.
Their opinion varied from a `` not much`` attitude to a ``useful`` one.
3
9
20
38
623
6
16
41
48
0
10
20
30
40
50
very
dissatisfied
dissatisfied neither
satisfied
nor
dissatisfied
satisfied very
satisfied
n/a
Test beginning (n = 45)
Test end (n = 40)
05
18
41
12
2
0
10
20
30
40
50
not at all a few moderate mostly always n/a
1 1
8
43
22
3
0
10
20
30
40
50
very
unsatisfied
unsatisfied nor satisfied very satisfied n/a
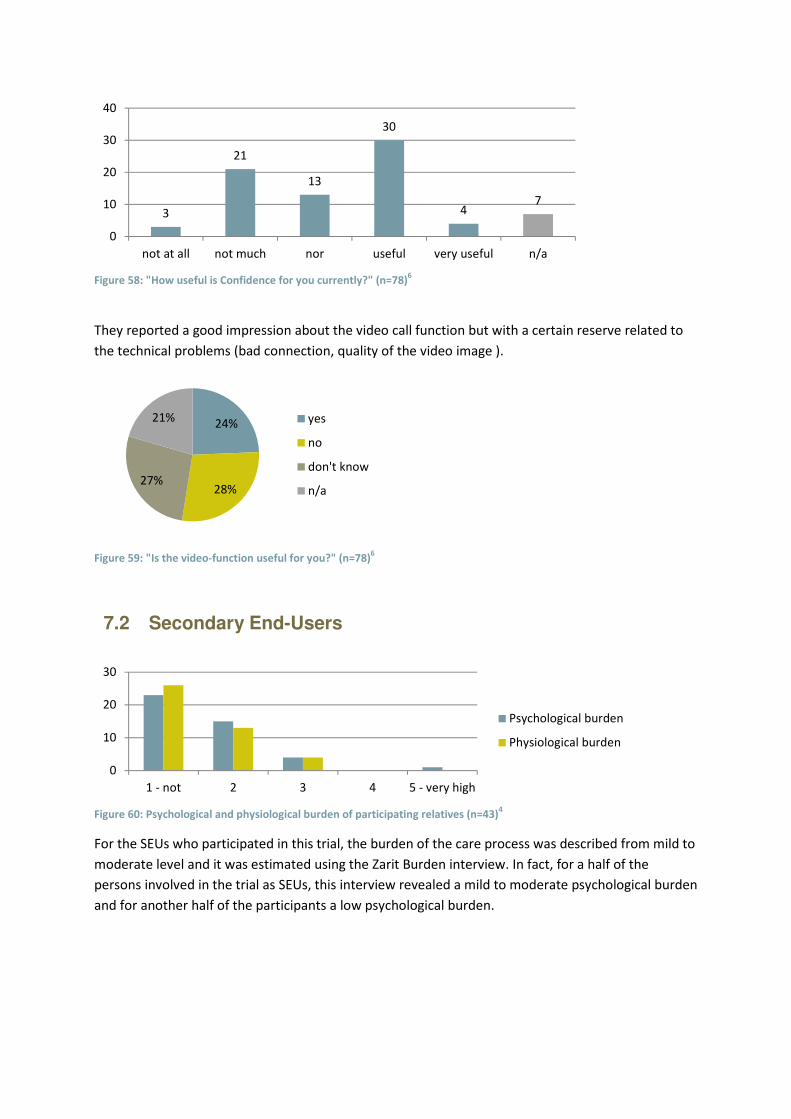
Figure 58: "How useful is Confidence for you currently?" (n=78)
6
They reported a good impression about the video call function but with a certain reserve related to
the technical problems (bad connection, quality of the video image ).
Figure 59: "Is the video-function useful for you?" (n=78)
6
7.2 Secondary End-Users
Figure 60: Psychological and physiological burden of participating relatives (n=43)
4
For the SEUs who participated in this trial, the burden of the care process was described from mild to
moderate level and it was estimated using the Zarit Burden interview. In fact, for a half of the
persons involved in the trial as SEUs, this interview revealed a mild to moderate psychological burden
and for another half of the participants a low psychological burden.
3
21
13
30
47
0
10
20
30
40
not at all not much nor useful very useful n/a
24%
28%27%
21% yes
no
don't know
n/a
0
10
20
30
1 - not 2 3 4 5 - very high
Psychological burden
Physiological burden
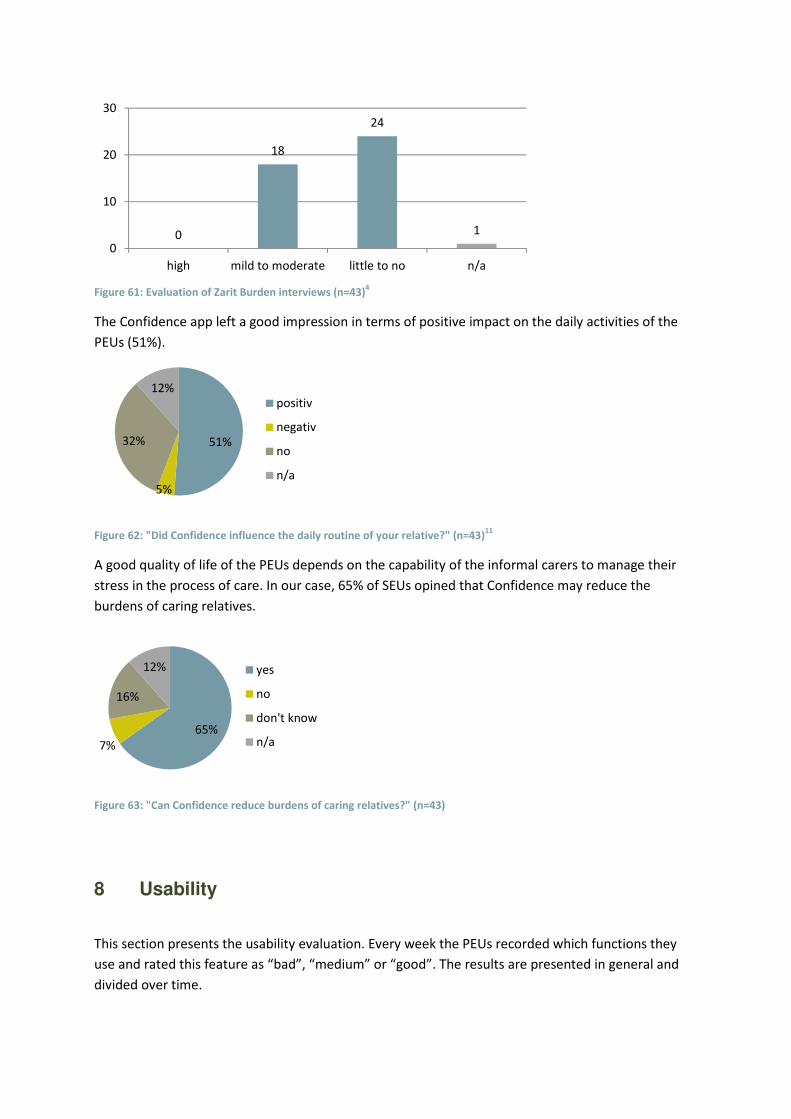
Figure 61: Evaluation of Zarit Burden interviews (n=43)
4
The Confidence app left a good impression in terms of positive impact on the daily activities of the
PEUs (51%).
Figure 62: "Did Confidence influence the daily routine of your relative?" (n=43)
11
A good quality of life of the PEUs depends on the capability of the informal carers to manage their
stress in the process of care. In our case, 65% of SEUs opined that Confidence may reduce the
burdens of caring relatives.
Figure 63: "Can Confidence reduce burdens of caring relatives?" (n=43)
8 Usability
This section presents the usability evaluation. Every week the PEUs recorded which functions they
use and rated this feature as “bad”, “medium” or “good”. The results are presented in general and
divided over time.
0
18
24
1
0
10
20
30
high mild to moderate little to no n/a
51%
5%
32%
12%
positiv
negativ
no
n/a
65%
7%
16%
12% yes
no
don't know
n/a
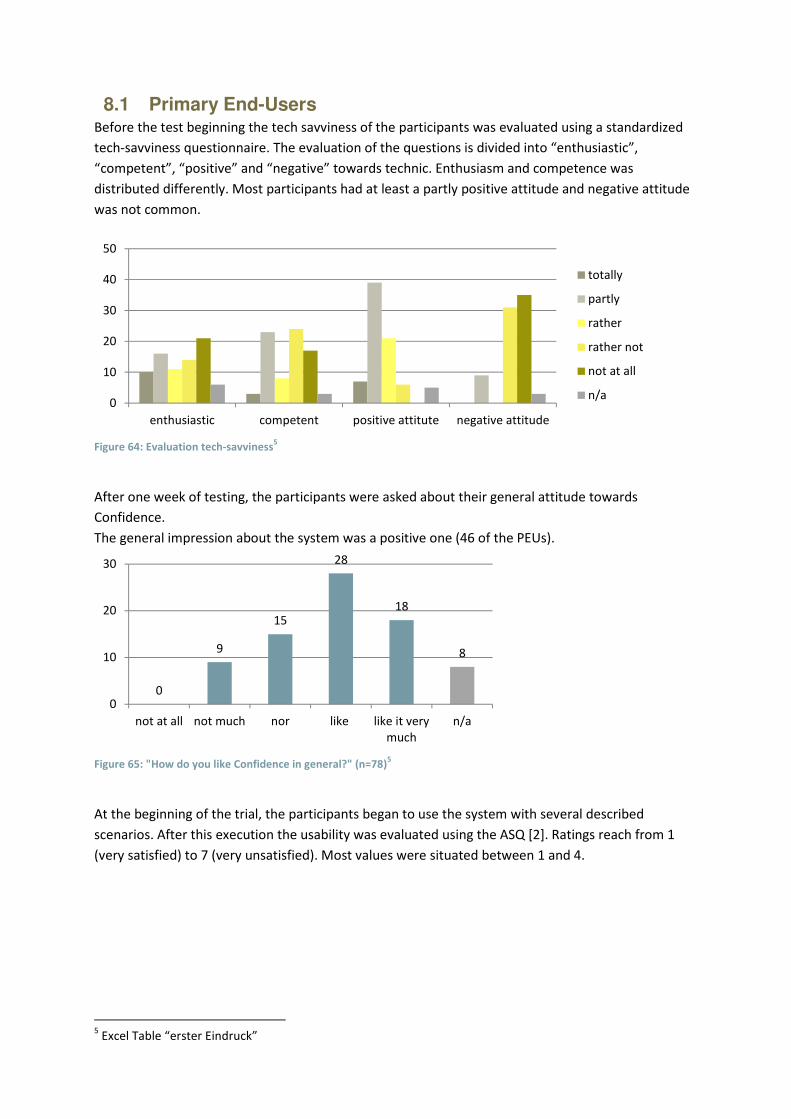
8.1 Primary End-Users Before the test beginning the tech savviness of the participants was evaluated using a standardized
tech-savviness questionnaire. The evaluation of the questions is divided into “enthusiastic”,
“competent”, “positive” and “negative” towards technic. Enthusiasm and competence was
distributed differently. Most participants had at least a partly positive attitude and negative attitude
was not common.
Figure 64: Evaluation tech-savviness
5
After one week of testing, the participants were asked about their general attitude towards
Confidence.
The general impression about the system was a positive one (46 of the PEUs).
Figure 65: "How do you like Confidence in general?" (n=78)
5
At the beginning of the trial, the participants began to use the system with several described
scenarios. After this execution the usability was evaluated using the ASQ [2]. Ratings reach from 1
(very satisfied) to 7 (very unsatisfied). Most values were situated between 1 and 4.
5 Excel Table “erster Eindruck”
0
10
20
30
40
50
enthusiastic competent positive attitute negative attitude
totally
partly
rather
rather not
not at all
n/a
0
9
15
28
18
8
0
10
20
30
not at all not much nor like like it very
much
n/a
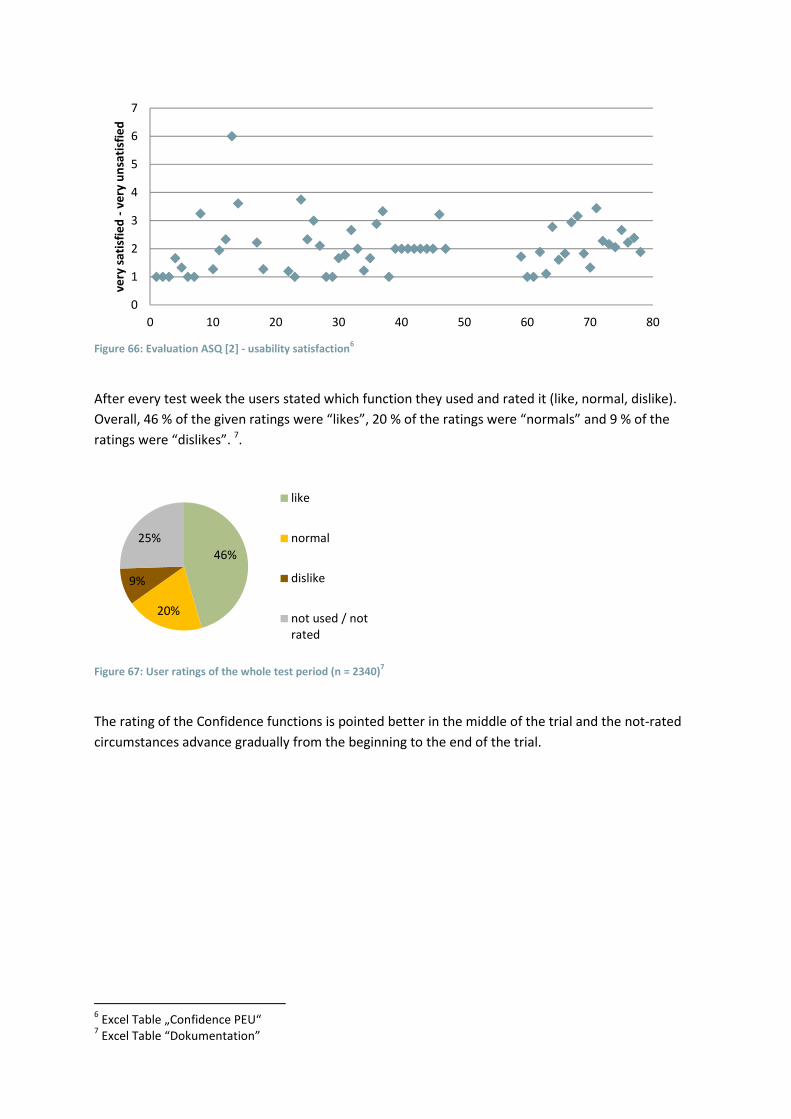
Figure 66: Evaluation ASQ [2] - usability satisfaction
6
After every test week the users stated which function they used and rated it (like, normal, dislike).
Overall, 46 % of the given ratings were “likes”, 20 % of the ratings were “normals” and 9 % of the
ratings were “dislikes”. 7.
Figure 67: User ratings of the whole test period (n = 2340)
7
The rating of the Confidence functions is pointed better in the middle of the trial and the not-rated
circumstances advance gradually from the beginning to the end of the trial.
6 Excel Table „Confidence PEU“
7 Excel Table “Dokumentation”
0
1
2
3
4
5
6
7
0 10 20 30 40 50 60 70 80
ve
ry s
ati
sfie
d -
ve
ry u
nsa
tisf
ied
46%
20%
9%
25%
like
normal
dislike
not used / not
rated
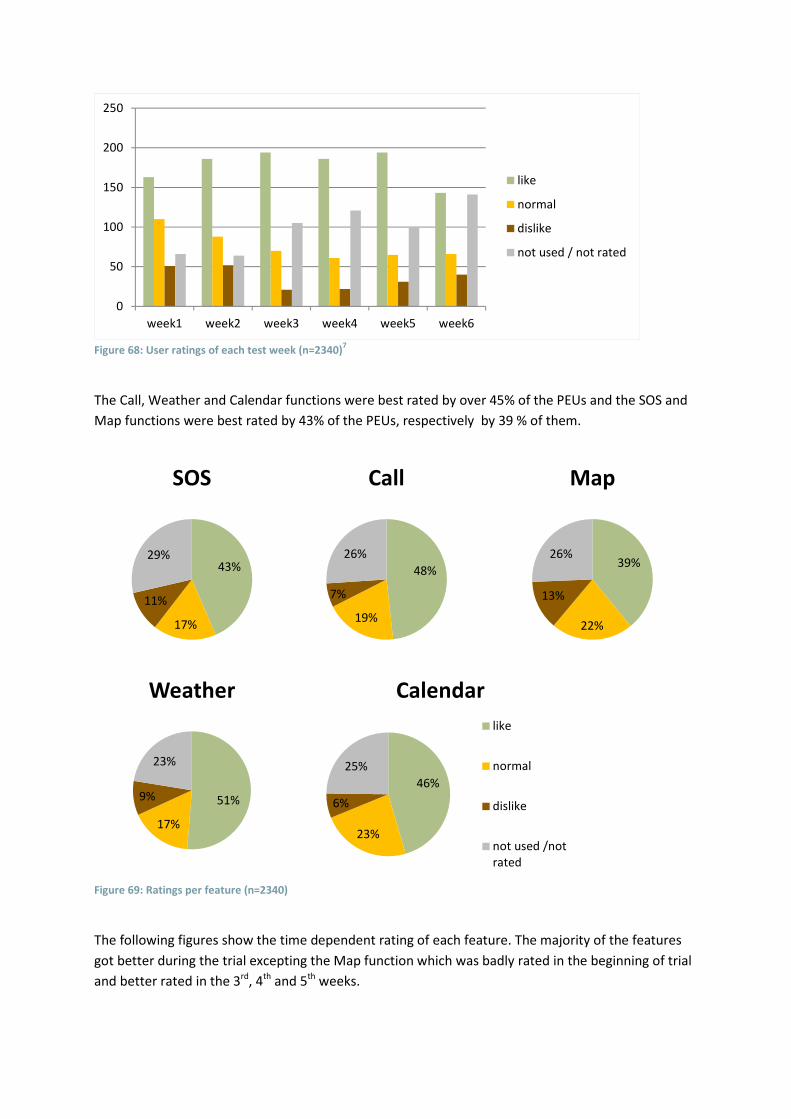
Figure 68: User ratings of each test week (n=2340)
7
The Call, Weather and Calendar functions were best rated by over 45% of the PEUs and the SOS and
Map functions were best rated by 43% of the PEUs, respectively by 39 % of them.
Figure 69: Ratings per feature (n=2340)
The following figures show the time dependent rating of each feature. The majority of the features
got better during the trial excepting the Map function which was badly rated in the beginning of trial
and better rated in the 3rd
, 4th
and 5th
weeks.
0
50
100
150
200
250
week1 week2 week3 week4 week5 week6
like
normal
dislike
not used / not rated
43%
17%
11%
29%
SOS
48%
19%
7%
26%
Call
39%
22%
13%
26%
Map
51%
17%
9%
23%
Weather
46%
23%
6%
25%
Calendar
like
normal
dislike
not used /not
rated
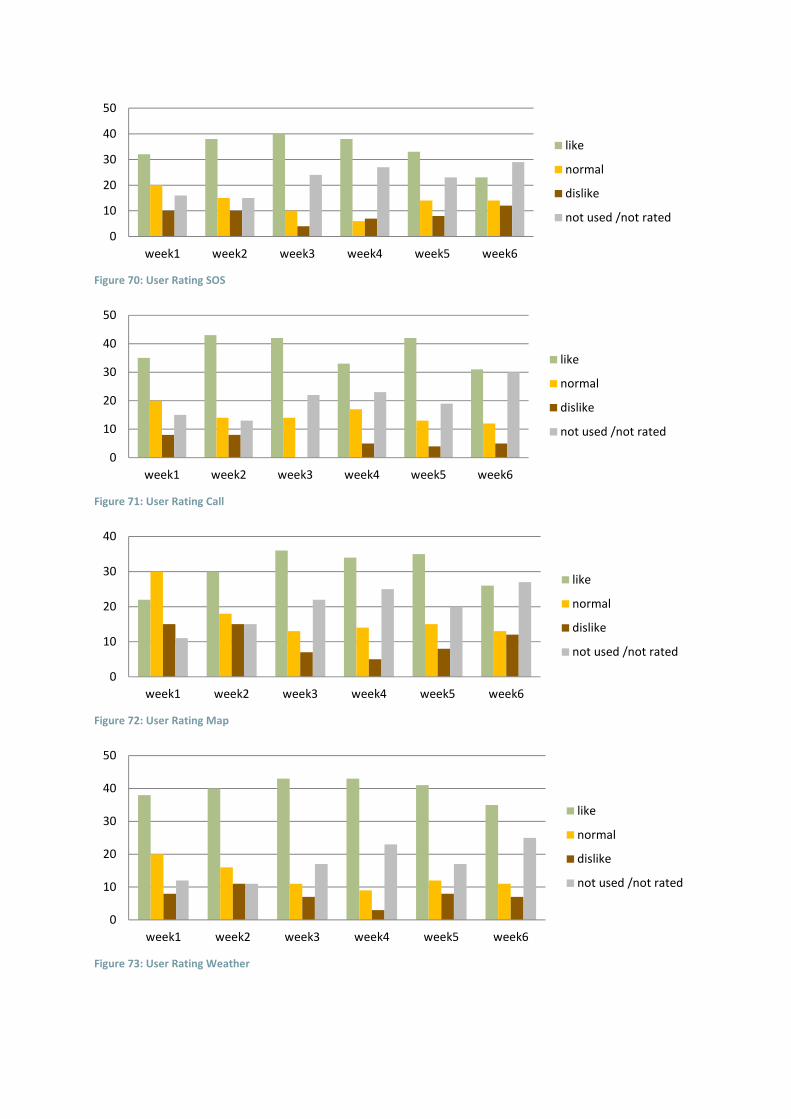
Figure 70: User Rating SOS
Figure 71: User Rating Call
Figure 72: User Rating Map
Figure 73: User Rating Weather
0
10
20
30
40
50
week1 week2 week3 week4 week5 week6
like
normal
dislike
not used /not rated
0
10
20
30
40
50
week1 week2 week3 week4 week5 week6
like
normal
dislike
not used /not rated
0
10
20
30
40
week1 week2 week3 week4 week5 week6
like
normal
dislike
not used /not rated
0
10
20
30
40
50
week1 week2 week3 week4 week5 week6
like
normal
dislike
not used /not rated
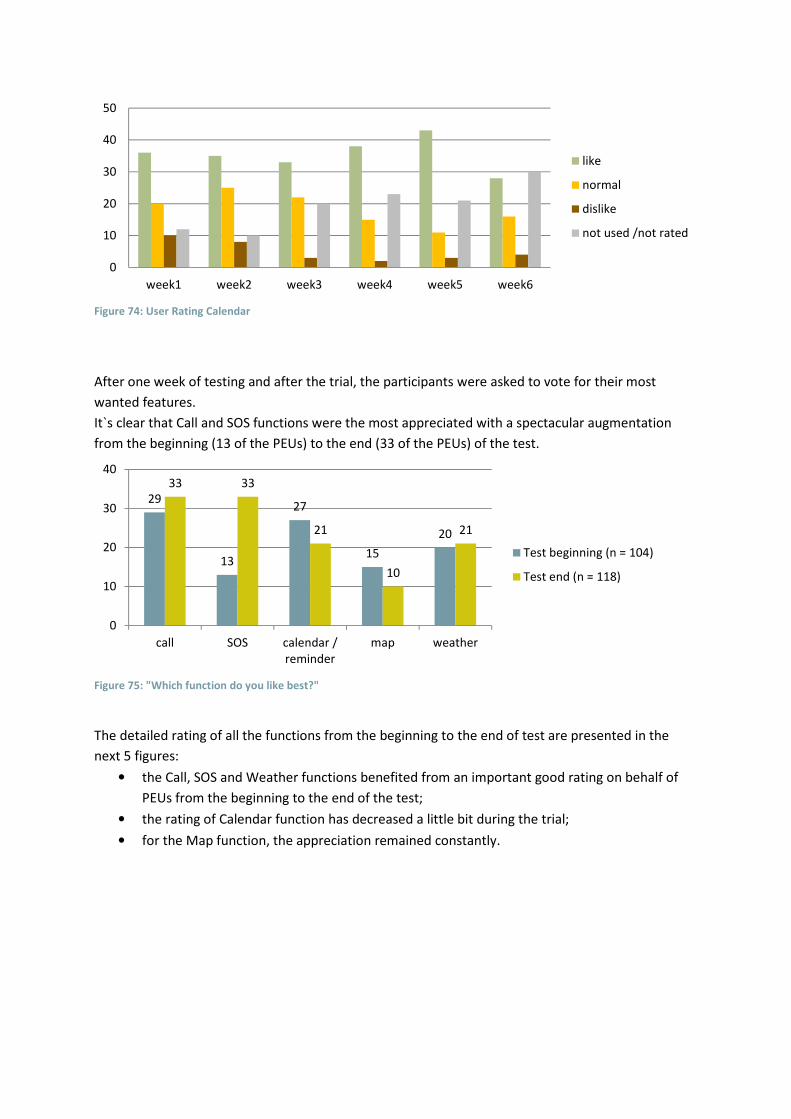
Figure 74: User Rating Calendar
After one week of testing and after the trial, the participants were asked to vote for their most
wanted features.
It`s clear that Call and SOS functions were the most appreciated with a spectacular augmentation
from the beginning (13 of the PEUs) to the end (33 of the PEUs) of the test.
Figure 75: "Which function do you like best?"
The detailed rating of all the functions from the beginning to the end of test are presented in the
next 5 figures:
• the Call, SOS and Weather functions benefited from an important good rating on behalf of
PEUs from the beginning to the end of the test;
• the rating of Calendar function has decreased a little bit during the trial;
• for the Map function, the appreciation remained constantly.
0
10
20
30
40
50
week1 week2 week3 week4 week5 week6
like
normal
dislike
not used /not rated
29
13
27
15
20
33 33
21
10
21
0
10
20
30
40
call SOS calendar /
reminder
map weather
Test beginning (n = 104)
Test end (n = 118)
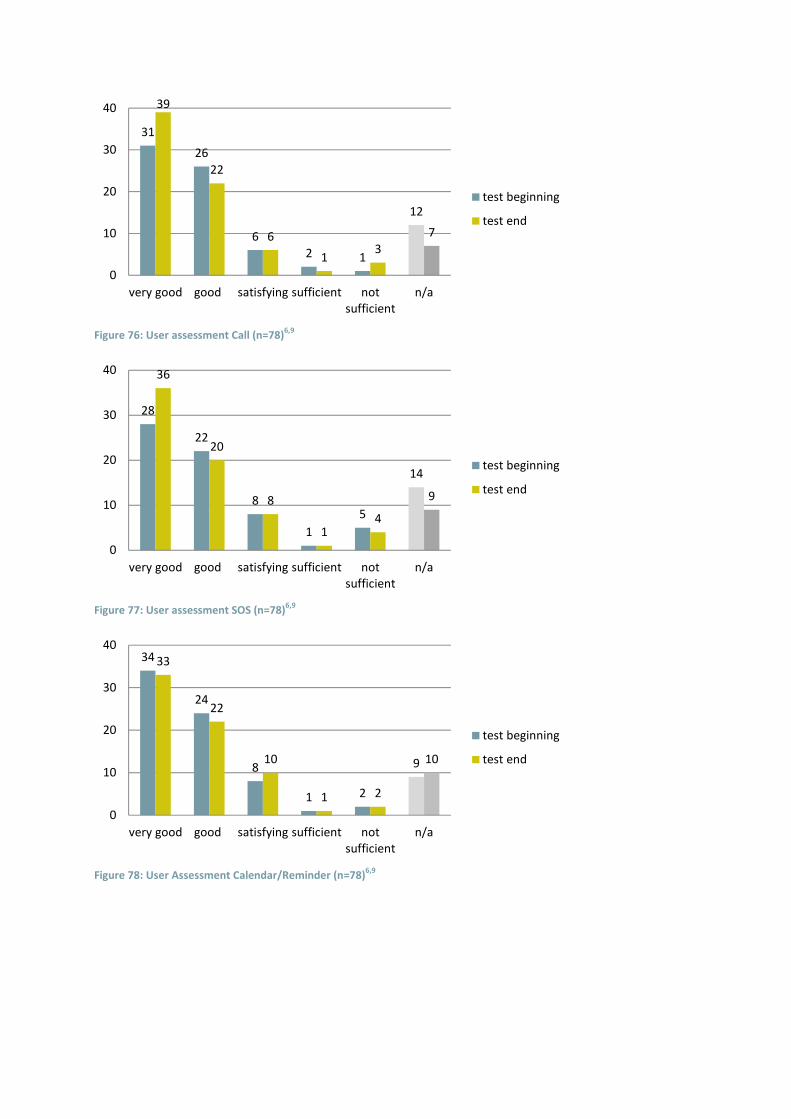
Figure 76: User assessment Call (n=78)
6,9
Figure 77: User assessment SOS (n=78)
6,9
Figure 78: User Assessment Calendar/Reminder (n=78)
6,9
31
26
6
2 1
12
39
22
6
13
7
0
10
20
30
40
very good good satisfying sufficient not
sufficient
n/a
test beginning
test end
28
22
8
1
5
14
36
20
8
14
9
0
10
20
30
40
very good good satisfying sufficient not
sufficient
n/a
test beginning
test end
34
24
8
1 2
9
33
22
10
1 2
10
0
10
20
30
40
very good good satisfying sufficient not
sufficient
n/a
test beginning
test end
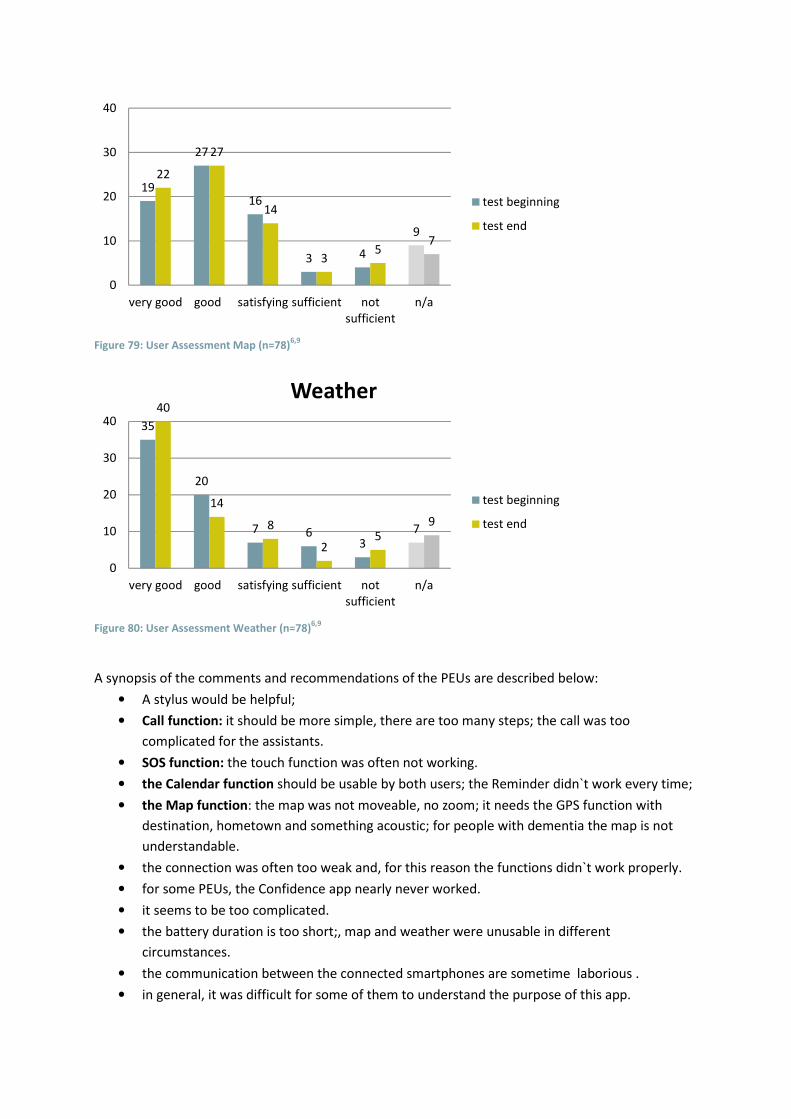
Figure 79: User Assessment Map (n=78)
6,9
Figure 80: User Assessment Weather (n=78)
6,9
A synopsis of the comments and recommendations of the PEUs are described below:
• A stylus would be helpful;
• Call function: it should be more simple, there are too many steps; the call was too
complicated for the assistants.
• SOS function: the touch function was often not working.
• the Calendar function should be usable by both users; the Reminder didn`t work every time;
• the Map function: the map was not moveable, no zoom; it needs the GPS function with
destination, hometown and something acoustic; for people with dementia the map is not
understandable.
• the connection was often too weak and, for this reason the functions didn`t work properly.
• for some PEUs, the Confidence app nearly never worked.
• it seems to be too complicated.
• the battery duration is too short;, map and weather were unusable in different
circumstances.
• the communication between the connected smartphones are sometime laborious .
• in general, it was difficult for some of them to understand the purpose of this app.
19
27
16
3 4
9
22
27
14
35
7
0
10
20
30
40
very good good satisfying sufficient not
sufficient
n/a
test beginning
test end
35
20
7 63
7
40
14
8
25
9
0
10
20
30
40
very good good satisfying sufficient not
sufficient
n/a
Weather
test beginning
test end
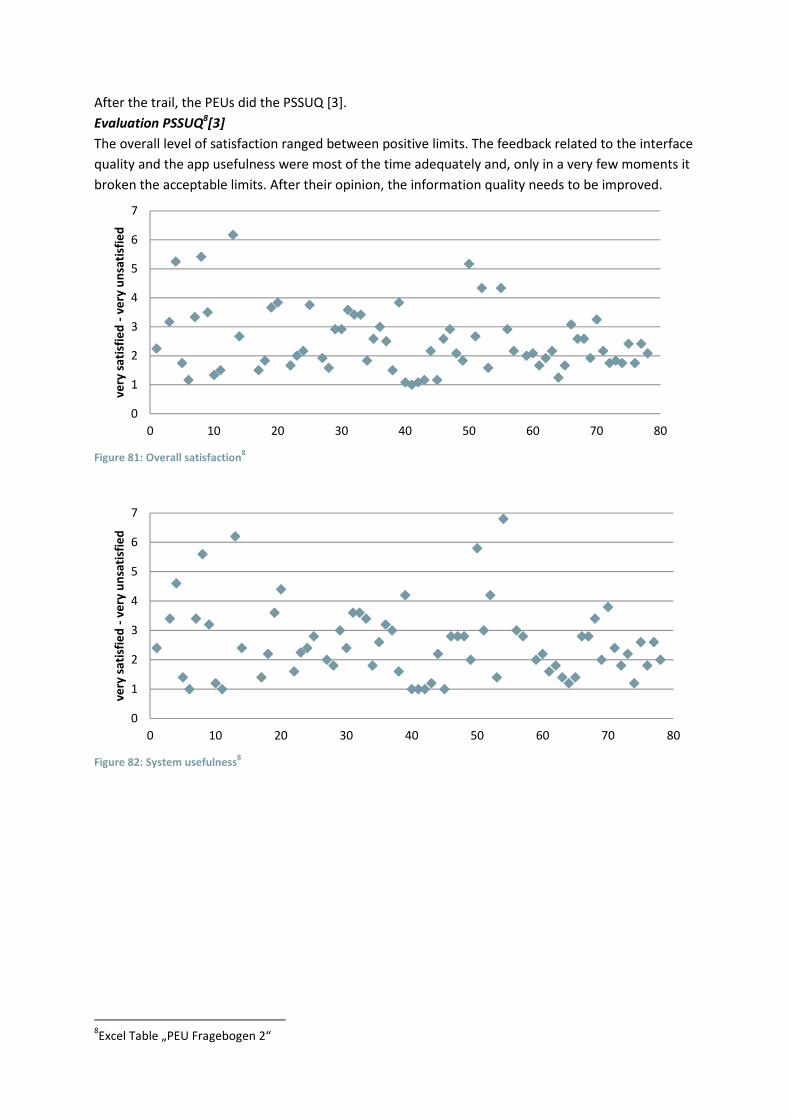
After the trail, the PEUs did the PSSUQ [3].
Evaluation PSSUQ8[3]
The overall level of satisfaction ranged between positive limits. The feedback related to the interface
quality and the app usefulness were most of the time adequately and, only in a very few moments it
broken the acceptable limits. After their opinion, the information quality needs to be improved.
Figure 81: Overall satisfaction
8
Figure 82: System usefulness
8
8Excel Table „PEU Fragebogen 2“
0
1
2
3
4
5
6
7
0 10 20 30 40 50 60 70 80
ve
ry s
ati
sfie
d -
ve
ry u
nsa
tisf
ied
0
1
2
3
4
5
6
7
0 10 20 30 40 50 60 70 80
ve
ry s
ati
sfie
d -
ve
ry u
nsa
tisf
ied
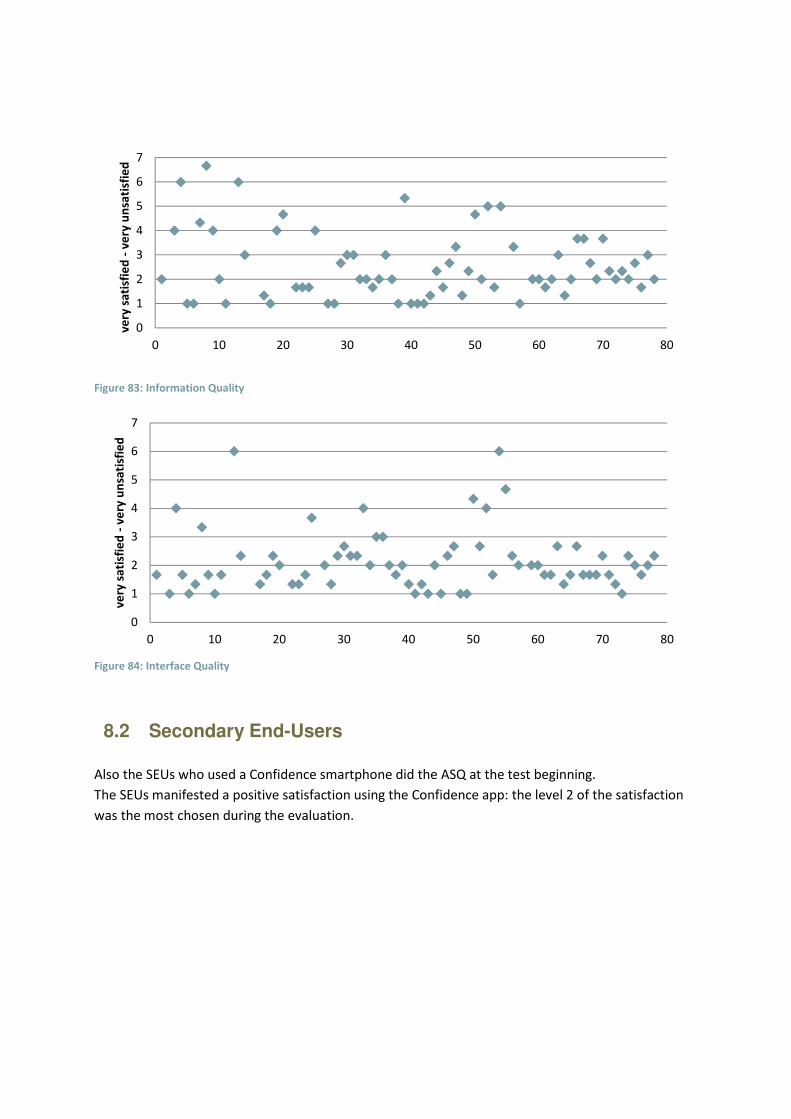
Figure 83: Information Quality
Figure 84: Interface Quality
8.2 Secondary End-Users
Also the SEUs who used a Confidence smartphone did the ASQ at the test beginning.
The SEUs manifested a positive satisfaction using the Confidence app: the level 2 of the satisfaction
was the most chosen during the evaluation.
0
1
2
3
4
5
6
7
0 10 20 30 40 50 60 70 80
ve
ry s
ati
sfie
d -
ve
ry u
nsa
tisf
ied
0
1
2
3
4
5
6
7
0 10 20 30 40 50 60 70 80
ve
ry s
ati
sfie
d -
ve
ry u
nsa
tisf
ied
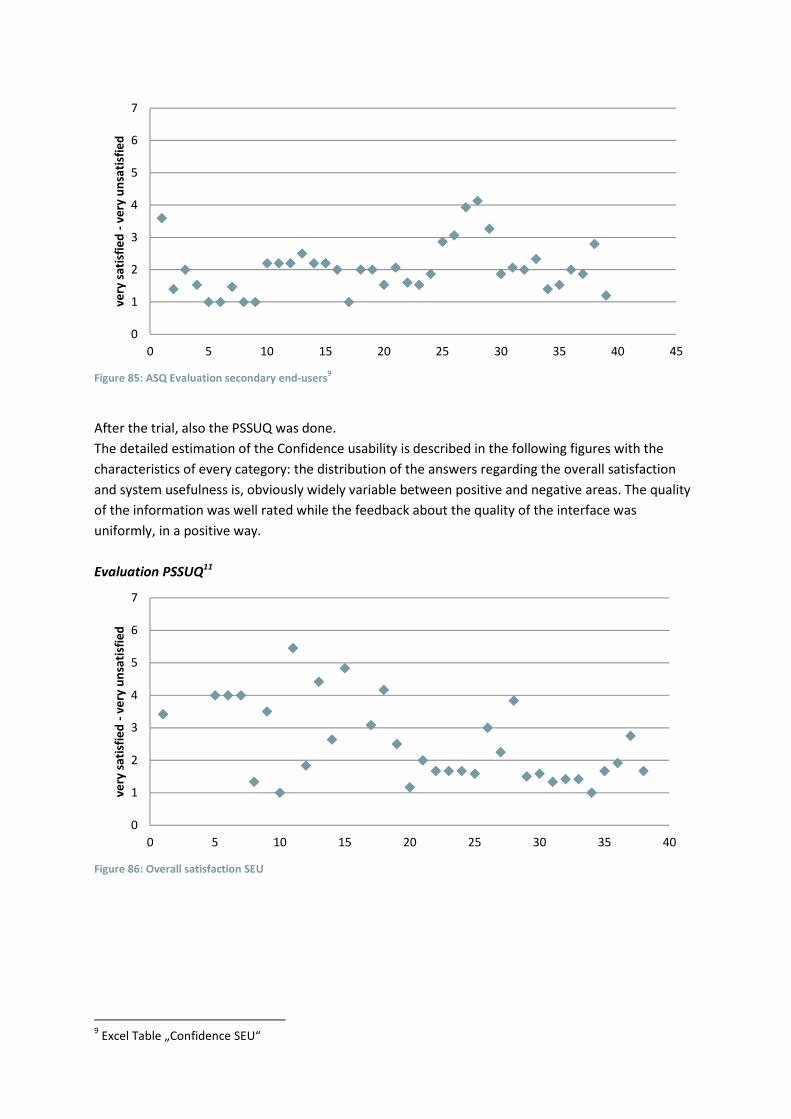
Figure 85: ASQ Evaluation secondary end-users
9
After the trial, also the PSSUQ was done.
The detailed estimation of the Confidence usability is described in the following figures with the
characteristics of every category: the distribution of the answers regarding the overall satisfaction
and system usefulness is, obviously widely variable between positive and negative areas. The quality
of the information was well rated while the feedback about the quality of the interface was
uniformly, in a positive way.
Evaluation PSSUQ11
Figure 86: Overall satisfaction SEU
9 Excel Table „Confidence SEU“
0
1
2
3
4
5
6
7
0 5 10 15 20 25 30 35 40 45
ve
ry s
ati
sfie
d -
ve
ry u
nsa
tisf
ied
0
1
2
3
4
5
6
7
0 5 10 15 20 25 30 35 40
ve
ry s
ati
sfie
d -
ve
ry u
nsa
tisf
ied
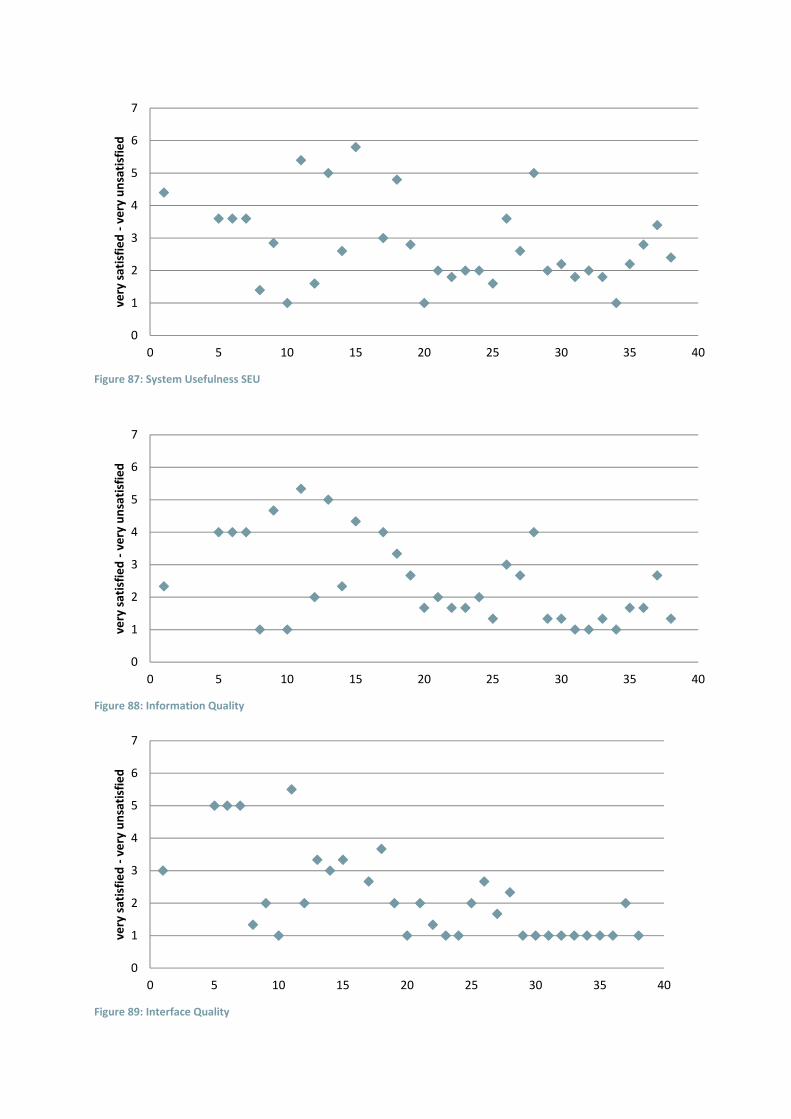
Figure 87: System Usefulness SEU
Figure 88: Information Quality
Figure 89: Interface Quality
0
1
2
3
4
5
6
7
0 5 10 15 20 25 30 35 40
ve
ry s
ati
sfie
d -
ve
ry u
nsa
tisf
ied
0
1
2
3
4
5
6
7
0 5 10 15 20 25 30 35 40
ve
ry s
ati
sfie
d -
ve
ry u
nsa
tisf
ied
0
1
2
3
4
5
6
7
0 5 10 15 20 25 30 35 40
ve
ry s
ati
sfie
d -
ve
ry u
nsa
tisf
ied
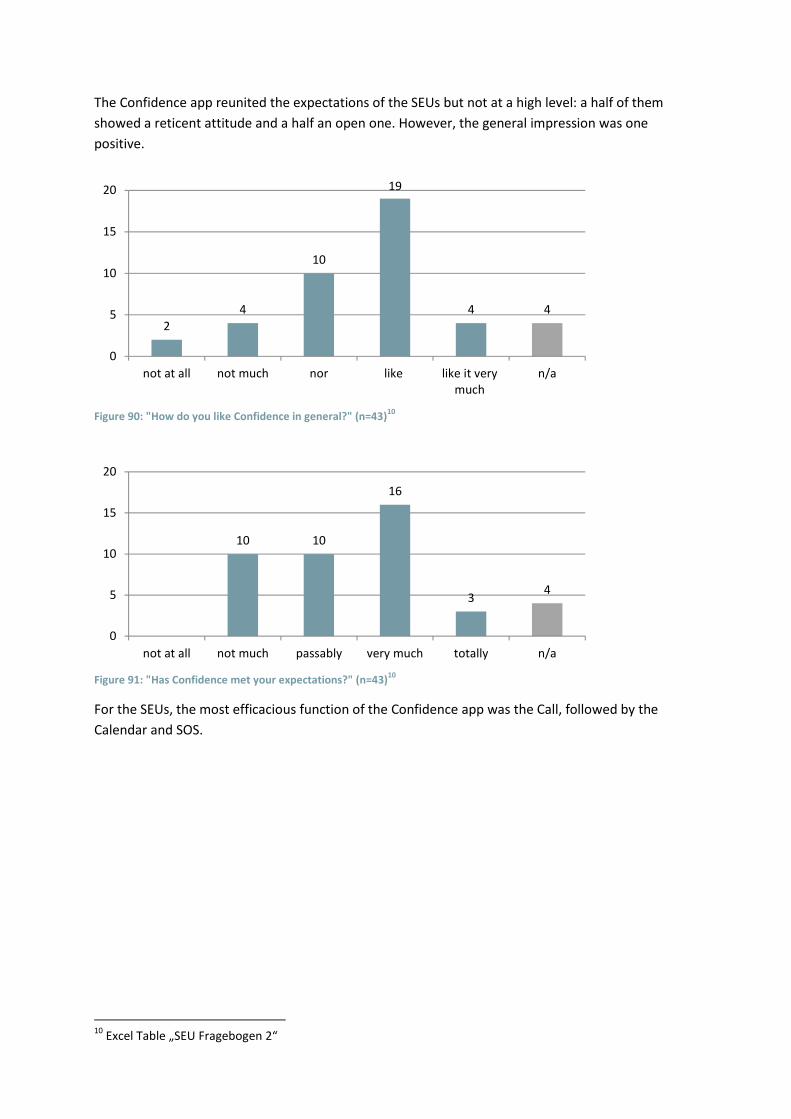
The Confidence app reunited the expectations of the SEUs but not at a high level: a half of them
showed a reticent attitude and a half an open one. However, the general impression was one
positive.
Figure 90: "How do you like Confidence in general?" (n=43)
10
Figure 91: "Has Confidence met your expectations?" (n=43)
10
For the SEUs, the most efficacious function of the Confidence app was the Call, followed by the
Calendar and SOS.
10
Excel Table „SEU Fragebogen 2“
2
4
10
19
4 4
0
5
10
15
20
not at all not much nor like like it very
much
n/a
10 10
16
34
0
5
10
15
20
not at all not much passably very much totally n/a
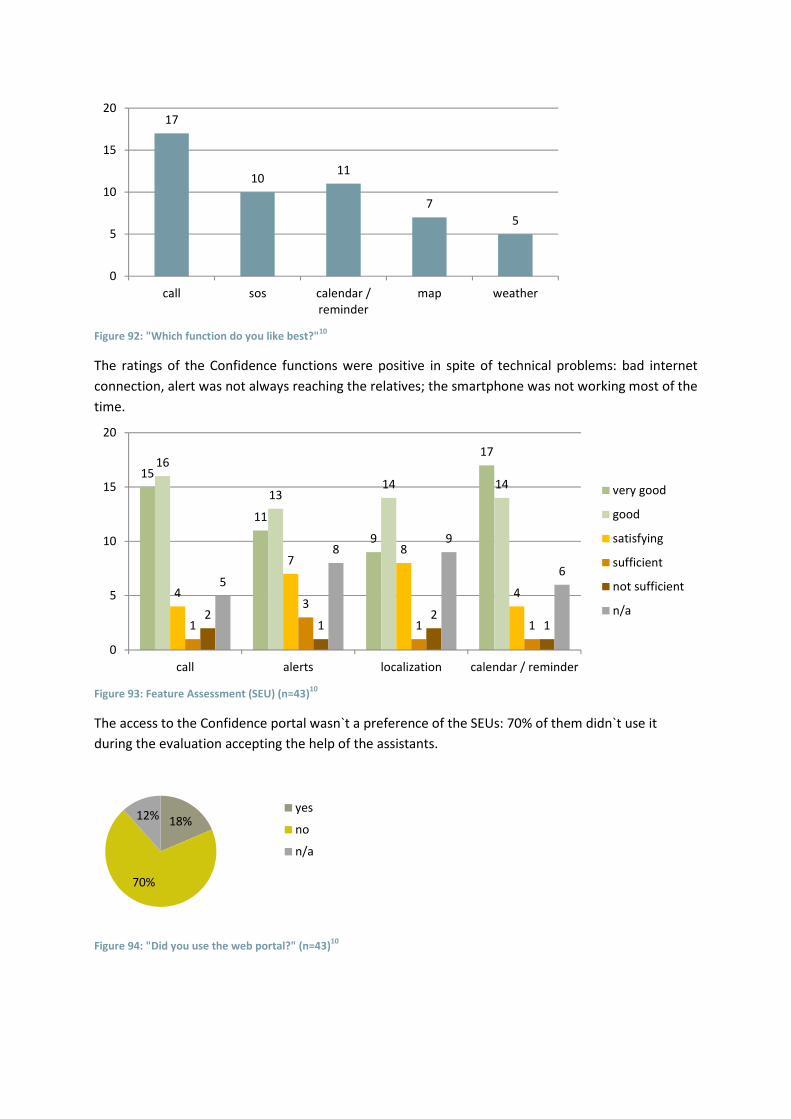
Figure 92: "Which function do you like best?"
10
The ratings of the Confidence functions were positive in spite of technical problems: bad internet
connection, alert was not always reaching the relatives; the smartphone was not working most of the
time.
Figure 93: Feature Assessment (SEU) (n=43)
10
The access to the Confidence portal wasn`t a preference of the SEUs: 70% of them didn`t use it
during the evaluation accepting the help of the assistants.
Figure 94: "Did you use the web portal?" (n=43)
10
17
1011
7
5
0
5
10
15
20
call sos calendar /
reminder
map weather
15
11
9
1716
1314 14
4
78
4
1
3
1 12
12
1
5
89
6
0
5
10
15
20
call alerts localization calendar / reminder
very good
good
satisfying
sufficient
not sufficient
n/a
18%
70%
12%yes
no
n/a
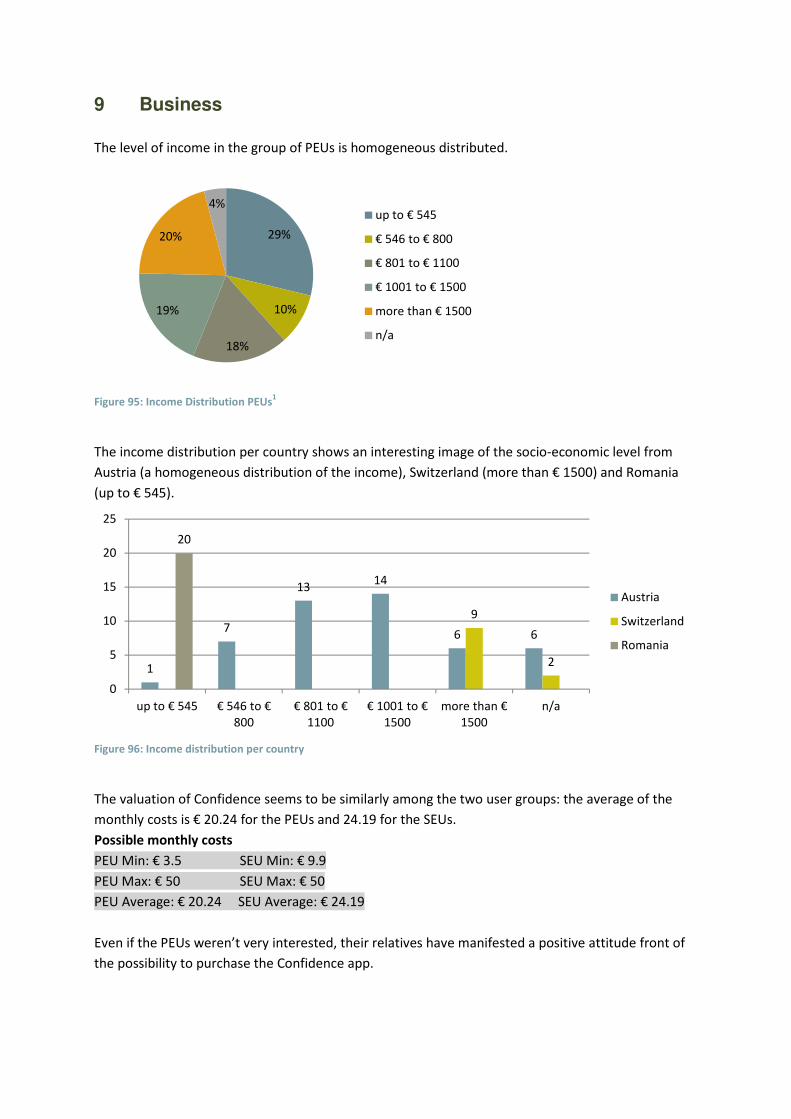
9 Business
The level of income in the group of PEUs is homogeneous distributed.
Figure 95: Income Distribution PEUs
1
The income distribution per country shows an interesting image of the socio-economic level from
Austria (a homogeneous distribution of the income), Switzerland (more than € 1500) and Romania
(up to € 545).
Figure 96: Income distribution per country
The valuation of Confidence seems to be similarly among the two user groups: the average of the
monthly costs is € 20.24 for the PEUs and 24.19 for the SEUs.
Possible monthly costs
PEU Min: € 3.5 SEU Min: € 9.9
PEU Max: € 50 SEU Max: € 50
PEU Average: € 20.24 SEU Average: € 24.19
Even if the PEUs weren’t very interested, their relatives have manifested a positive attitude front of
the possibility to purchase the Confidence app.
29%
10%
18%
19%
20%
4%up to € 545
€ 546 to € 800
€ 801 to € 1100
€ 1001 to € 1500
more than € 1500
n/a
1
7
1314
6 6
9
2
20
0
5
10
15
20
25
up to € 545 € 546 to €
800
€ 801 to €
1100
€ 1001 to €
1500
more than €
1500
n/a
Austria
Switzerland
Romania
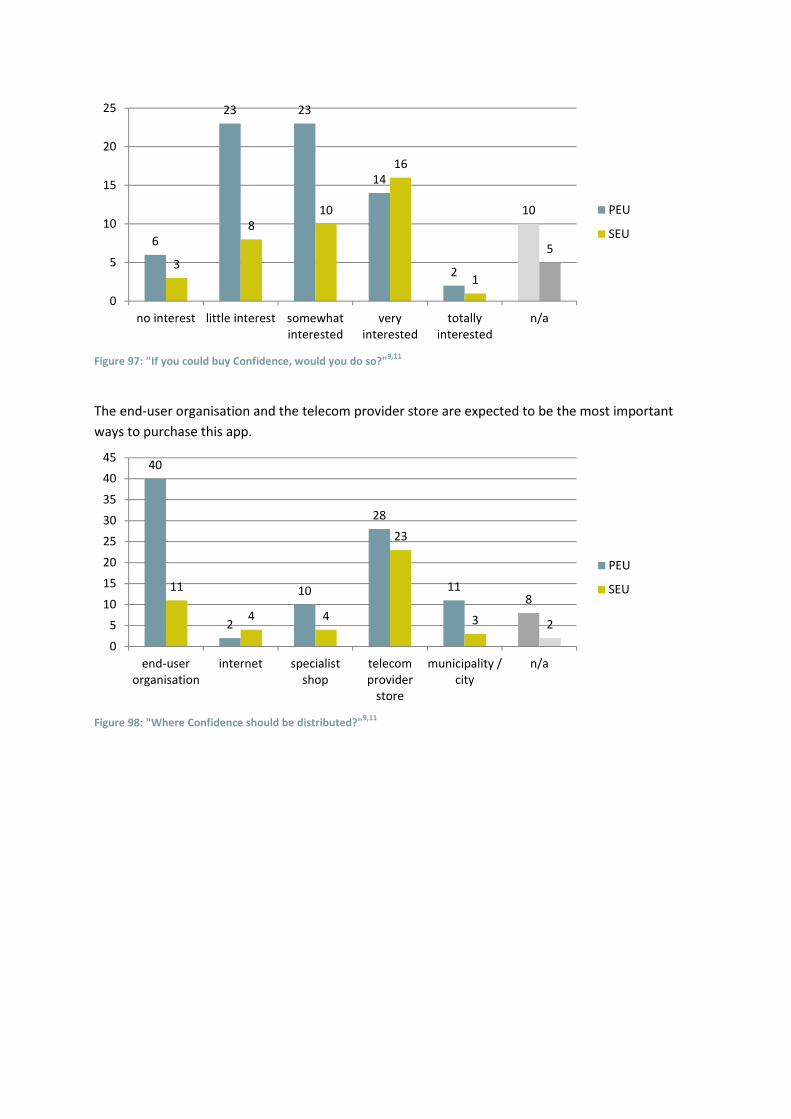
Figure 97: "If you could buy Confidence, would you do so?"
9,11
The end-user organisation and the telecom provider store are expected to be the most important
ways to purchase this app.
Figure 98: "Where Confidence should be distributed?"
9,11
6
23 23
14
2
10
3
8
10
16
1
5
0
5
10
15
20
25
no interest little interest somewhat
interested
very
interested
totally
interested
n/a
PEU
SEU
40
2
10
28
118
11
4 4
23
3 2
0
5
10
15
20
25
30
35
40
45
end-user
organisation
internet specialist
shop
telecom
provider
store
municipality /
city
n/a
PEU
SEU
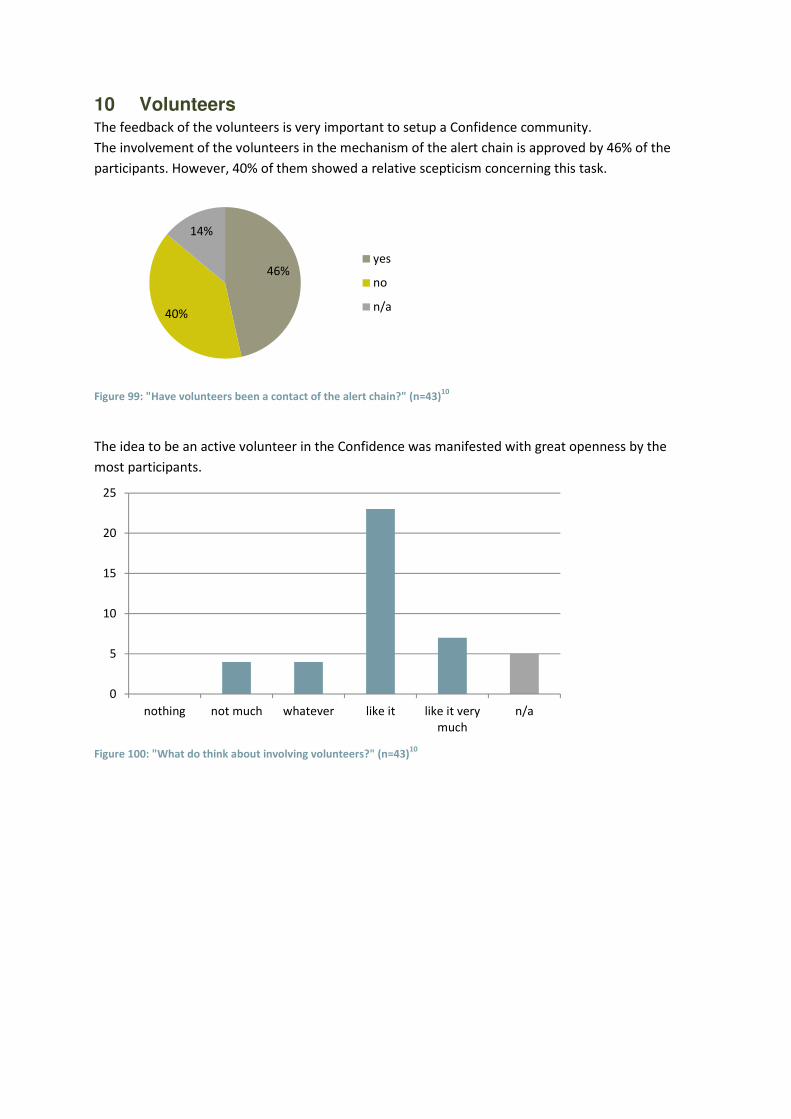
10 Volunteers The feedback of the volunteers is very important to setup a Confidence community.
The involvement of the volunteers in the mechanism of the alert chain is approved by 46% of the
participants. However, 40% of them showed a relative scepticism concerning this task.
Figure 99: "Have volunteers been a contact of the alert chain?" (n=43)
10
The idea to be an active volunteer in the Confidence was manifested with great openness by the
most participants.
Figure 100: "What do think about involving volunteers?" (n=43)
10
46%
40%
14%
yes
no
n/a
0
5
10
15
20
25
nothing not much whatever like it like it very
much
n/a
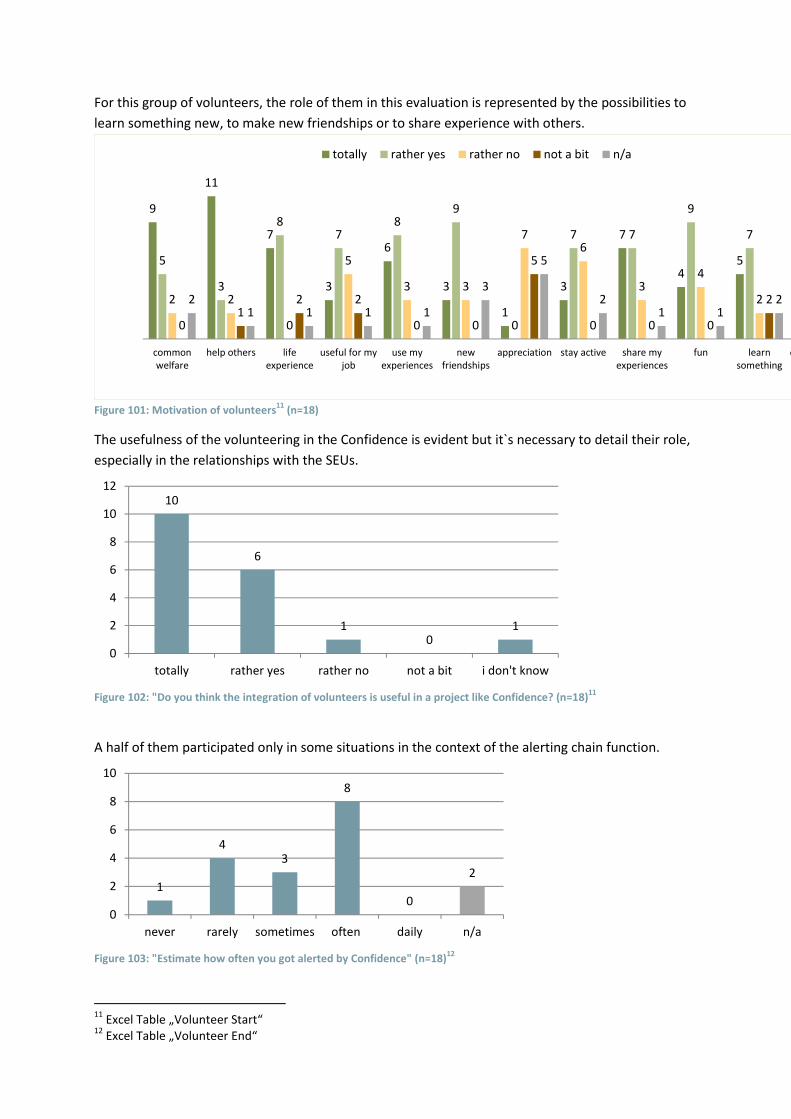
For this group of volunteers, the role of them in this evaluation is represented by the possibilities to
learn something new, to make new friendships or to share experience with others.
Figure 101: Motivation of volunteers11
(n=18)
The usefulness of the volunteering in the Confidence is evident but it`s necessary to detail their role,
especially in the relationships with the SEUs.
Figure 102: "Do you think the integration of volunteers is useful in a project like Confidence? (n=18)
11
A half of them participated only in some situations in the context of the alerting chain function.
Figure 103: "Estimate how often you got alerted by Confidence" (n=18)
12
11
Excel Table „Volunteer Start“ 12
Excel Table „Volunteer End“
9
11
7
3
6
3
1
3
7
455
3
87
89
0
7 7
9
7
2 2
0
5
3 3
76
34
2
01
2 2
0 0
5
0 0 0
221 1 1 1
3
5
21 1
2
common
welfare
help others life
experience
useful for my
job
use my
experiences
new
friendships
appreciation stay active share my
experiences
fun learn
something
campaign for
totally rather yes rather no not a bit n/a
10
6
10
1
0
2
4
6
8
10
12
totally rather yes rather no not a bit i don't know
1
43
8
0
2
0
2
4
6
8
10
never rarely sometimes often daily n/a
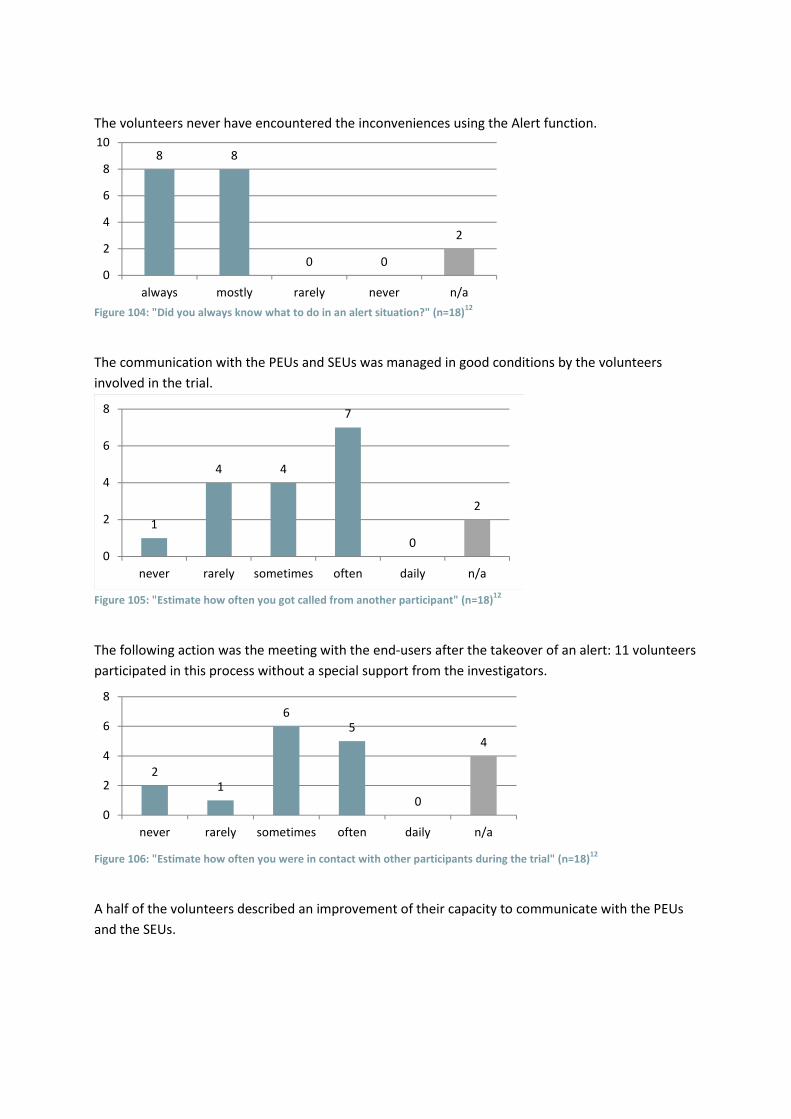
The volunteers never have encountered the inconveniences using the Alert function.
Figure 104: "Did you always know what to do in an alert situation?" (n=18)
12
The communication with the PEUs and SEUs was managed in good conditions by the volunteers
involved in the trial.
Figure 105: "Estimate how often you got called from another participant" (n=18)
12
The following action was the meeting with the end-users after the takeover of an alert: 11 volunteers
participated in this process without a special support from the investigators.
Figure 106: "Estimate how often you were in contact with other participants during the trial" (n=18)
12
A half of the volunteers described an improvement of their capacity to communicate with the PEUs
and the SEUs.
8 8
0 0
2
0
2
4
6
8
10
always mostly rarely never n/a
1
4 4
7
0
2
0
2
4
6
8
never rarely sometimes often daily n/a
2
1
6
5
0
4
0
2
4
6
8
never rarely sometimes often daily n/a
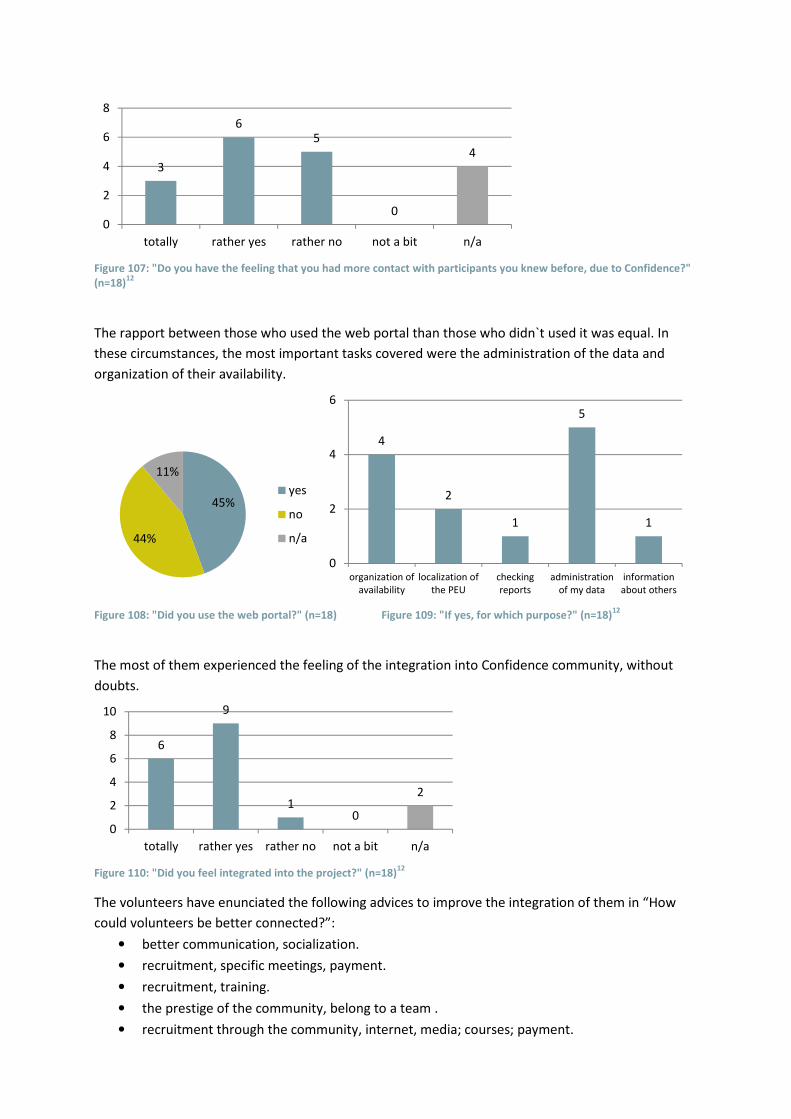
Figure 107: "Do you have the feeling that you had more contact with participants you knew before, due to Confidence?"
(n=18)12
The rapport between those who used the web portal than those who didn`t used it was equal. In
these circumstances, the most important tasks covered were the administration of the data and
organization of their availability.
Figure 108: "Did you use the web portal?" (n=18) Figure 109: "If yes, for which purpose?" (n=18)
12
The most of them experienced the feeling of the integration into Confidence community, without
doubts.
Figure 110: "Did you feel integrated into the project?" (n=18)
12
The volunteers have enunciated the following advices to improve the integration of them in “How
could volunteers be better connected?”:
• better communication, socialization.
• recruitment, specific meetings, payment.
• recruitment, training.
• the prestige of the community, belong to a team .
• recruitment through the community, internet, media; courses; payment.
3
65
0
4
0
2
4
6
8
totally rather yes rather no not a bit n/a
45%
44%
11%
yes
no
n/a
4
2
1
5
1
0
2
4
6
organization of
availability
localization of
the PEU
checking
reports
administration
of my data
information
about others
6
9
10
2
0
2
4
6
8
10
totally rather yes rather no not a bit n/a
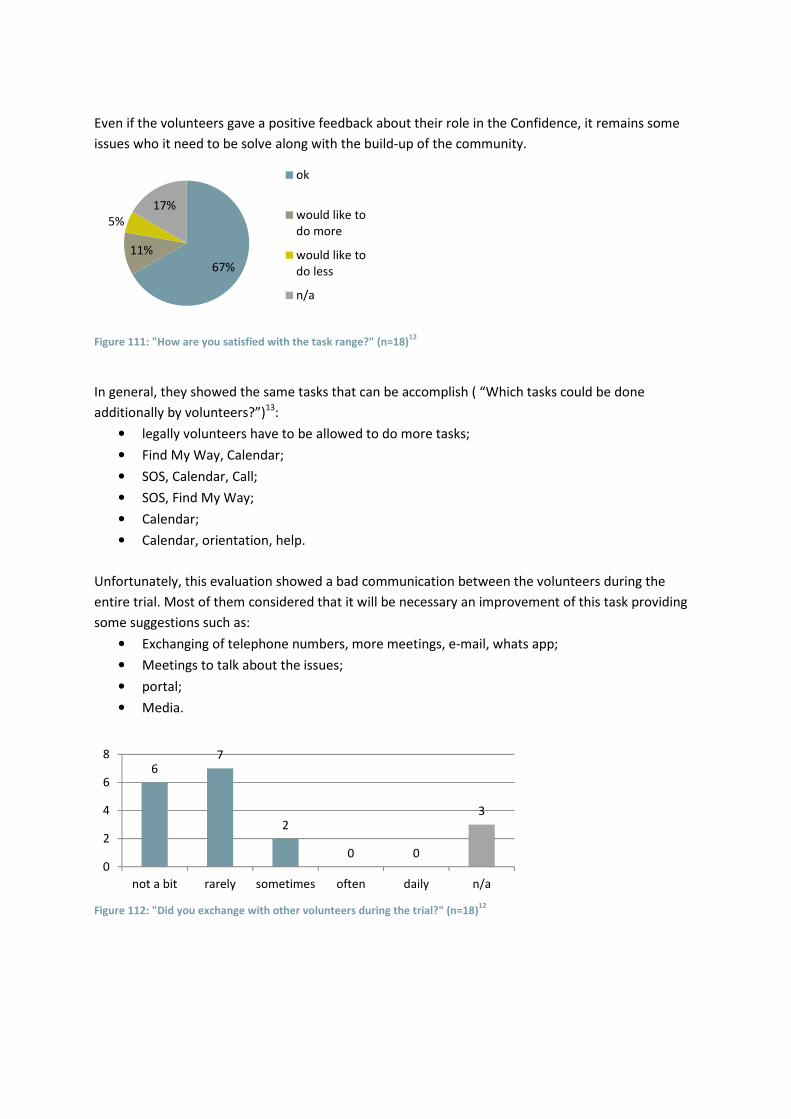
Even if the volunteers gave a positive feedback about their role in the Confidence, it remains some
issues who it need to be solve along with the build-up of the community.
Figure 111: "How are you satisfied with the task range?" (n=18)
12
In general, they showed the same tasks that can be accomplish ( “Which tasks could be done
additionally by volunteers?”)13
:
• legally volunteers have to be allowed to do more tasks;
• Find My Way, Calendar;
• SOS, Calendar, Call;
• SOS, Find My Way;
• Calendar;
• Calendar, orientation, help.
Unfortunately, this evaluation showed a bad communication between the volunteers during the
entire trial. Most of them considered that it will be necessary an improvement of this task providing
some suggestions such as:
• Exchanging of telephone numbers, more meetings, e-mail, whats app;
• Meetings to talk about the issues;
• portal;
• Media.
Figure 112: "Did you exchange with other volunteers during the trial?" (n=18)
12
67%
11%
5%
17%
ok
would like to
do more
would like to
do less
n/a
67
2
0 0
3
0
2
4
6
8
not a bit rarely sometimes often daily n/a
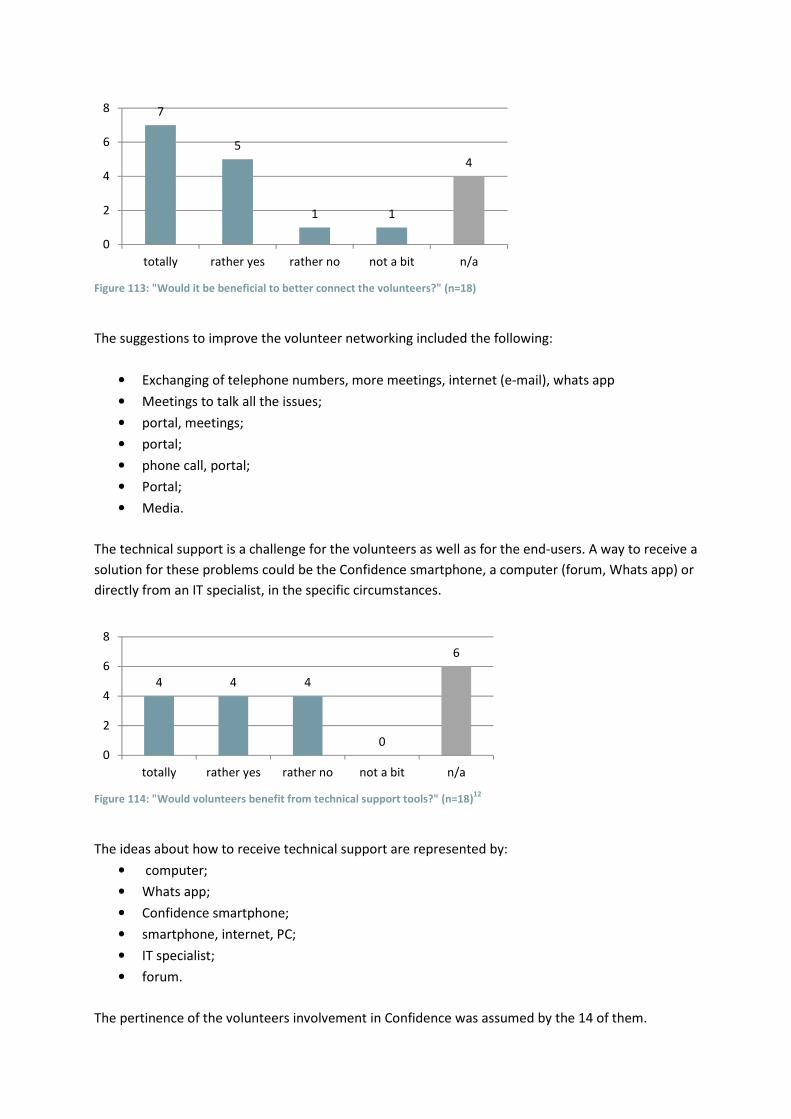
Figure 113: "Would it be beneficial to better connect the volunteers?" (n=18)
The suggestions to improve the volunteer networking included the following:
• Exchanging of telephone numbers, more meetings, internet (e-mail), whats app
• Meetings to talk all the issues;
• portal, meetings;
• portal;
• phone call, portal;
• Portal;
• Media.
The technical support is a challenge for the volunteers as well as for the end-users. A way to receive a
solution for these problems could be the Confidence smartphone, a computer (forum, Whats app) or
directly from an IT specialist, in the specific circumstances.
Figure 114: "Would volunteers benefit from technical support tools?" (n=18)
12
The ideas about how to receive technical support are represented by:
• computer;
• Whats app;
• Confidence smartphone;
• smartphone, internet, PC;
• IT specialist;
• forum.
The pertinence of the volunteers involvement in Confidence was assumed by the 14 of them.
7
5
1 1
4
0
2
4
6
8
totally rather yes rather no not a bit n/a
4 4 4
0
6
0
2
4
6
8
totally rather yes rather no not a bit n/a
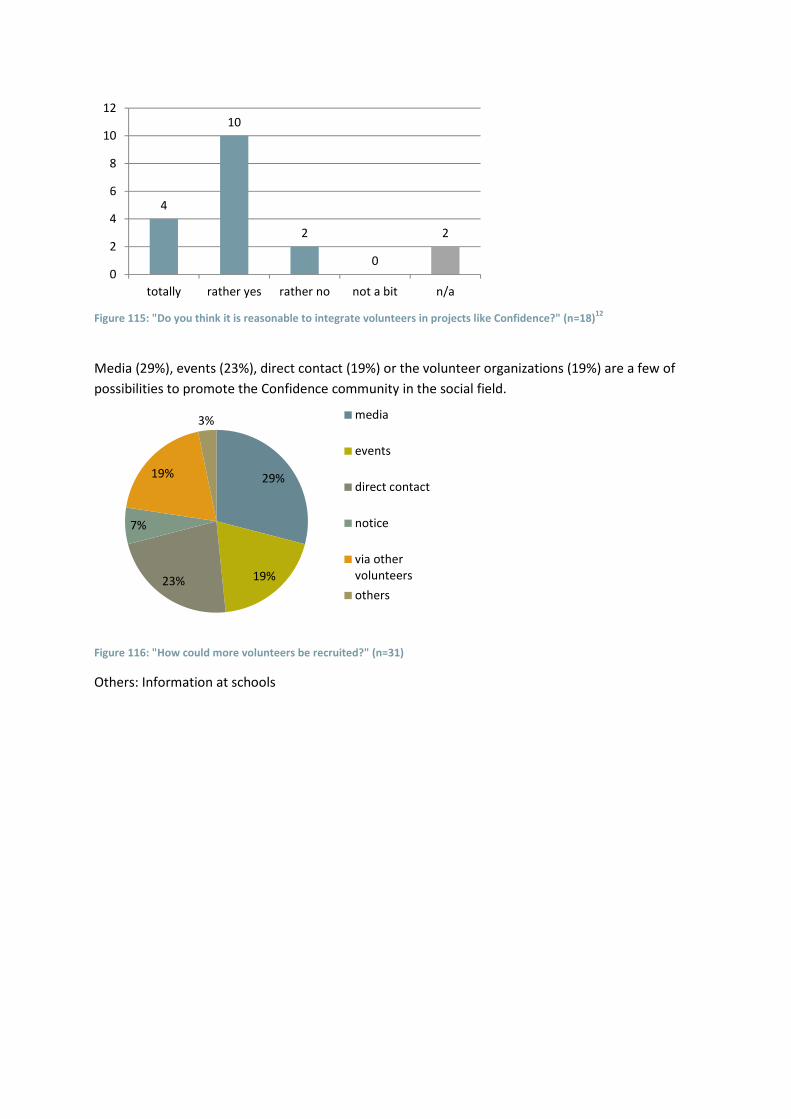
Figure 115: "Do you think it is reasonable to integrate volunteers in projects like Confidence?" (n=18)
12
Media (29%), events (23%), direct contact (19%) or the volunteer organizations (19%) are a few of
possibilities to promote the Confidence community in the social field.
Figure 116: "How could more volunteers be recruited?" (n=31)
Others: Information at schools
4
10
2
0
2
0
2
4
6
8
10
12
totally rather yes rather no not a bit n/a
29%
19%23%
7%
19%
3% media
events
direct contact
notice
via other
volunteers
others

Literature
[1] Lohrmann C. (2004): Die Pflegeabhängigkeitsskala. In: Bartholomeyczik S., Halek S. (2004):
Assessmentinstrumente in der Pflege. Hannover, Schlütersche, 55-60.
[2] After Scenario Questionnaire (ASQ): Lewis, J.R. (1993). Computer Usability Satisfaction
Questionnaires: Psychometric Evaluation and Instruction for Use. IBM Technical Report 54.786.
[3] Post-Study System Questionnaire (PSSUQ): Lewis, J.R. (1993). Computer Usability Satisfaction
Questionnaires: Psychometric Evaluation and Instruction for Use. IBM Technical Repor 54.786.
Related Documents