Cytokines Interleukin-1 and Tumor Necrosis Factor- Regulate Different Transcriptional and Alternative Splicing Networks in Primary -Cells Fernanda Ortis, 1 Najib Naamane, 1 Daisy Flamez, 1 Laurence Ladrie `re, 1 Fabrice Moore, 1 Daniel A. Cunha, 1 Maikel L. Colli, 1 Thomas Thykjaer, 2 Kasper Thorsen, 3 Torben F. Ørntoft, 2,3 and Decio L. Eizirik 1 OBJECTIVE—Cytokines contribute to pancreatic -cell death in type 1 diabetes. This effect is mediated by complex gene networks that remain to be characterized. We presently utilized array analysis to define the global expression pattern of genes, including spliced variants, modified by the cytokines interleukin (IL)-1 interferon (IFN)- and tumor necrosis factor (TNF)- IFN- in primary rat -cells. RESEARCH DESIGN AND METHODS—Fluorescence-acti- vated cell sorter–purified rat -cells were exposed to IL-1 IFN- or TNF- IFN- for 6 or 24 h, and global gene expression was analyzed by microarray. Key results were confirmed by RT-PCR, and small-interfering RNAs were used to investigate the mechanistic role of novel and relevant transcription factors identified by pathway analysis. RESULTS—Nearly 16,000 transcripts were detected as present in -cells, with temporal differences in the number of genes modulated by IL-1 IFN or TNF- IFN-. These cytokine combinations induced differential expression of inflammatory response genes, which is related to differential induction of IFN regulatory factor-7. Both treatments decreased the expression of genes involved in the maintenance of -cell phenotype and growth/regeneration. Cytokines induced hypoxia-inducible fac- tor-, which in this context has a proapoptotic role. Cytokines also modified the expression of 20 genes involved in RNA splicing, and exon array analysis showed cytokine-induced changes in alternative splicing of 50% of the cytokine-modified genes. CONCLUSIONS—The present study doubles the number of known genes expressed in primary -cells, modified or not by cytokines, and indicates the biological role for several novel cytokine-modified pathways in -cells. It also shows that cyto- kines modify alternative splicing in -cells, opening a new avenue of research for the field. Diabetes 59:358–374, 2010 T ype 1 diabetes is an autoimmune disease char- acterized by a progressive and selective destruc- tion of the pancreatic -cells. During insulitis, activated macrophages and T-cells release cyto- kines such as interleukin (IL)-1, tumor necrosis factor (TNF)-, and interferon (IFN)- in the vicinity of the -cells, contributing for -cell dysfunction and apoptosis (1,2). Expression of TNF- and IL-1 was observed in pancreas of patients with recent type 1 diabetes onset and in animal models of the disease (1–3), prompting clinical trials based on the use of blockers of TNF- (4) or IL-1 (5) to prevent type 1 diabetes. In vitro exposure of rodent or human -cells to IL-1 IFN- or TNF- IFN-, but not to any of these cytokines alone, triggers -cell apoptosis (1,6). IL-1 IFN- affects the expression of several gene networks in -cells, modu- lating pro- and antiapoptotic pathways, expression of cytokines and chemokines, and decreasing expression of genes involved in -cell function (2,6 –10). Less is known about the genes induced by TNF-; both cytokines induce the key transcription factor nuclear factor (NF)-B (11), but they affect kinase cascade pathways differently, such as IB kinase, with the potential to trigger a differential gene expression outcome (11,12). We have previously addressed this issue by using a target microarray, the Apochip (13), to compare IL-1– and TNF-–induced genes. The findings obtained indicated some differences between these cytokines, mostly related to intensity of gene expression (12). These observations, however, were biased by the choice and limited number of probes in- cluded in the Apochip. Moreover, neither the Apochip nor usually utilized cDNA arrays (7–9) have the ability to identify splice variants of genes. This is a significant limitation, since recent data suggest that regulation of alternative splicing is of major importance for regulation of proteomic diversity and for cell physiology/pathology (14 –16). Cytokine composition and its respective concentrations may vary during insulitis, depending on the timing, degree of islet infiltration, immune cells present, and the pancre- atic -cell responses to the immune assault (10). This may explain why blocking TNF- or IL-1 at different stages of the pre-diabetic period may be more or less effective in preventing diabetes in rodent models (1,17), suggesting that the contribution of the different cytokines and their downstream signaling pathways may also vary between individual type 1 diabetic patients. This reinforces the need for understanding separately and in detail the gene From the 1 Laboratory of Experimental Medicine, Universite ´ Libre de Brux- elles, Brussels, Belgium; 2 CMO Aros Applied Biotechnology A/S, Science Park Skejby Brendstrupgaardsvej, Aarhus, Denmark; and the 3 Department of Molecular Medicine, Aarhus University Hospital, Aarhus, Denmark. Corresponding author: Decio L. Eizirik, [email protected]. Received 5 August 2009 and accepted 28 October 2009. Published ahead of print at http://diabetes.diabetesjournals.org on 23 November 2009. DOI: 10.2337/db09-1159. F.O. and N.N. contributed equally to this article. © 2010 by the American Diabetes Association. Readers may use this article as long as the work is properly cited, the use is educational and not for profit, and the work is not altered. See http://creativecommons.org/licenses/by -nc-nd/3.0/ for details. The costs of publication of this article were defrayed in part by the payment of page charges. This article must therefore be hereby marked “advertisement” in accordance with 18 U.S.C. Section 1734 solely to indicate this fact. See accompanying commentary, p. 335. ORIGINAL ARTICLE 358 DIABETES, VOL. 59, FEBRUARY 2010 diabetes.diabetesjournals.org

Welcome message from author
This document is posted to help you gain knowledge. Please leave a comment to let me know what you think about it! Share it to your friends and learn new things together.
Transcript
Cytokines Interleukin-1� and Tumor Necrosis Factor-�Regulate Different Transcriptional and AlternativeSplicing Networks in Primary �-CellsFernanda Ortis,
1Najib Naamane,
1Daisy Flamez,
1Laurence Ladriere,
1Fabrice Moore,
1
Daniel A. Cunha,1
Maikel L. Colli,1
Thomas Thykjaer,2
Kasper Thorsen,3
Torben F. Ørntoft,2,3
and Decio L. Eizirik1
OBJECTIVE—Cytokines contribute to pancreatic �-cell deathin type 1 diabetes. This effect is mediated by complex genenetworks that remain to be characterized. We presently utilizedarray analysis to define the global expression pattern of genes,including spliced variants, modified by the cytokines interleukin(IL)-1� � interferon (IFN)-� and tumor necrosis factor (TNF)-� �IFN-� in primary rat �-cells.
RESEARCH DESIGN AND METHODS—Fluorescence-acti-vated cell sorter–purified rat �-cells were exposed to IL-1� �IFN-� or TNF-� � IFN-� for 6 or 24 h, and global gene expressionwas analyzed by microarray. Key results were confirmed byRT-PCR, and small-interfering RNAs were used to investigate themechanistic role of novel and relevant transcription factorsidentified by pathway analysis.
RESULTS—Nearly 16,000 transcripts were detected as presentin �-cells, with temporal differences in the number of genesmodulated by IL-1� � IFN� or TNF-� � IFN-�. These cytokinecombinations induced differential expression of inflammatoryresponse genes, which is related to differential induction of IFNregulatory factor-7. Both treatments decreased the expression ofgenes involved in the maintenance of �-cell phenotype andgrowth/regeneration. Cytokines induced hypoxia-inducible fac-tor-�, which in this context has a proapoptotic role. Cytokinesalso modified the expression of �20 genes involved in RNAsplicing, and exon array analysis showed cytokine-inducedchanges in alternative splicing of �50% of the cytokine-modifiedgenes.
CONCLUSIONS—The present study doubles the number ofknown genes expressed in primary �-cells, modified or not bycytokines, and indicates the biological role for several novelcytokine-modified pathways in �-cells. It also shows that cyto-kines modify alternative splicing in �-cells, opening a newavenue of research for the field. Diabetes 59:358–374, 2010
Type 1 diabetes is an autoimmune disease char-acterized by a progressive and selective destruc-tion of the pancreatic �-cells. During insulitis,activated macrophages and T-cells release cyto-
kines such as interleukin (IL)-1�, tumor necrosis factor(TNF)-�, and interferon (IFN)-� in the vicinity of the�-cells, contributing for �-cell dysfunction and apoptosis(1,2). Expression of TNF-� and IL-1� was observed inpancreas of patients with recent type 1 diabetes onset andin animal models of the disease (1–3), prompting clinicaltrials based on the use of blockers of TNF-� (4) or IL-1�(5) to prevent type 1 diabetes.
In vitro exposure of rodent or human �-cells to IL-1� �IFN-� or TNF-� � IFN-�, but not to any of these cytokinesalone, triggers �-cell apoptosis (1,6). IL-1� � IFN-� affectsthe expression of several gene networks in �-cells, modu-lating pro- and antiapoptotic pathways, expression ofcytokines and chemokines, and decreasing expression ofgenes involved in �-cell function (2,6–10). Less is knownabout the genes induced by TNF-�; both cytokines inducethe key transcription factor nuclear factor (NF)-�B (11),but they affect kinase cascade pathways differently, suchas I�B kinase, with the potential to trigger a differentialgene expression outcome (11,12). We have previouslyaddressed this issue by using a target microarray, theApochip (13), to compare IL-1�– and TNF-�–inducedgenes. The findings obtained indicated some differencesbetween these cytokines, mostly related to intensity ofgene expression (12). These observations, however, werebiased by the choice and limited number of probes in-cluded in the Apochip. Moreover, neither the Apochip norusually utilized cDNA arrays (7–9) have the ability toidentify splice variants of genes. This is a significantlimitation, since recent data suggest that regulation ofalternative splicing is of major importance for regulationof proteomic diversity and for cell physiology/pathology(14–16).
Cytokine composition and its respective concentrationsmay vary during insulitis, depending on the timing, degreeof islet infiltration, immune cells present, and the pancre-atic �-cell responses to the immune assault (10). This mayexplain why blocking TNF-� or IL-1� at different stages ofthe pre-diabetic period may be more or less effective inpreventing diabetes in rodent models (1,17), suggestingthat the contribution of the different cytokines and theirdownstream signaling pathways may also vary betweenindividual type 1 diabetic patients. This reinforces theneed for understanding separately and in detail the gene
From the 1Laboratory of Experimental Medicine, Universite Libre de Brux-elles, Brussels, Belgium; 2CMO Aros Applied Biotechnology A/S, SciencePark Skejby Brendstrupgaardsvej, Aarhus, Denmark; and the 3Departmentof Molecular Medicine, Aarhus University Hospital, Aarhus, Denmark.
Corresponding author: Decio L. Eizirik, [email protected] 5 August 2009 and accepted 28 October 2009. Published ahead of
print at http://diabetes.diabetesjournals.org on 23 November 2009. DOI:10.2337/db09-1159.
F.O. and N.N. contributed equally to this article.© 2010 by the American Diabetes Association. Readers may use this article as
long as the work is properly cited, the use is educational and not for profit,and the work is not altered. See http://creativecommons.org/licenses/by-nc-nd/3.0/ for details.
The costs of publication of this article were defrayed in part by the payment of page
charges. This article must therefore be hereby marked “advertisement” in accordance
with 18 U.S.C. Section 1734 solely to indicate this fact.
See accompanying commentary, p. 335.
ORIGINAL ARTICLE
358 DIABETES, VOL. 59, FEBRUARY 2010 diabetes.diabetesjournals.org
networks downstream of IL-1� � IFN-� and TNF-� �IFN-�, with the ultimate goal of devising targeted andindividualized therapies to preserve �-cells in early type 1diabetes. We have presently addressed this question byusing primary rat �-cells treated for 6 or 24 h withcombinations of IL-1� � IFN-� and TNF-� � IFN-� andperforming array analysis using first the latest Affymetrixmicroarray, covering �28,000 genes, and then the Af-fymetrix exon-array, covering �850,000 exons and havingthe potential to identify most splice variants present in acell. This was followed by global analysis of gene expres-sion using Ingenuity Pathway Analysis (IPA) software,which indicated networks of special interest for subse-quent studies. The data obtained doubles the number ofknown genes expressed in primary rat �-cells, modified ornot by cytokines, and identifies several novel cytokine-modified pathways in �-cells, including cytokines/chemo-kines, Krebs cycle genes, hormone receptors, and hypoxia-inducible factor (HIF)-1�–regulated genes. It alsoindicates that cytokines modify alternative splicing in�-cells, opening a new avenue of research in the field.
RESEARCH DESIGN AND METHODS
Cell culture and cytokine exposure; viability and Western blot assay; nitric oxideand chemokine (CC-motif) ligand (CCL) 5 measurement; sample preparation forarray analysis; real-time RT-PCR and normal PCR; immunofluorescence; pro-moter in silico analysis and promoter reporter assay are available at the onlineappendix Supplementary Methods at http://diabetes.diabetesjournals.org/cgi/content/full/db09-1159/DC1.Gene expression array data analysis. The GeneChip Rat Genome 230 2.0arrays (Affymetrix), containing 31,099 probesets representing �28,000 ratgenes was used in the study. The GC-Robust MultiChip Average (GCRMA) (18)was used, as part of the GCRMA package in the Bioconductor site (http://www.bioconductor.org), to preprocess the raw data (CEL files). For theanalysis, see Supplementary Methods. Pathway analysis was done by IPA 5.5software.Exon-array data analysis. The CEL files corresponding to the GeneChip RatExon 1.0 ST Arrays (Affymetrix) were imported and analyzed by the Array-Assist Exon software (Stratagene Software Solutions), as described in Sup-plementary Methods.RNA interference. Small-interfering RNA (siRNA) against activating factor(ATF) 4, HIF-1�, and IFN regulatory factor (IRF)-7 (supplementary Table 2),were used to knock down expression of the respective target genes. AllstarsNegative Control siRNA (Qiagen, Venlo, Netherlands) was used as a negativecontrol. Transfection using DharmaFECT1 (Thermo Scientific, Chicago, IL)was performed as previously described and validated (19).Statistical analysis. Comparisons between groups were carried out either bypaired t test or by ANOVA followed by t tests with Bonferroni correction asrequired. A P � 0.05 was considered as statistically significant. Arraystatistical analysis is described in Supplementary Methods.
RESULTS
Effect of IL-1� � IFN-� or TNF-� � IFN-� on theviability, nitric oxide production, and gene expres-sion of rat �-cells. �-Cells were exposed to IL-1� �IFN-� or TNF-� � IFN-� and collected at 6 and 24 h forarray analysis. Viability was not affected by the cytokinetreatment after 24 h (supplementary Fig. 1A), but therewas a twofold increase in apoptosis after 72 h (supplemen-tary Fig. 1A) without significant changes in the percentageof necrotic cells (data not shown). Both cytokine combi-nations increased nitric oxide (NO) production after 24 hof exposure (supplementary Fig. 1B), with higher induc-tion by IL-1� � IFN-� as compared with TNF-� � IFN-�.These results are similar to our previous observations(12), confirming biological activity of the cytokines. In thearray analysis, nearly 16,000 probe sets, corresponding to7,991 genes, were detected as present in control and/orcytokine-treated �-cells (supplementary Table 3). TNF-� �
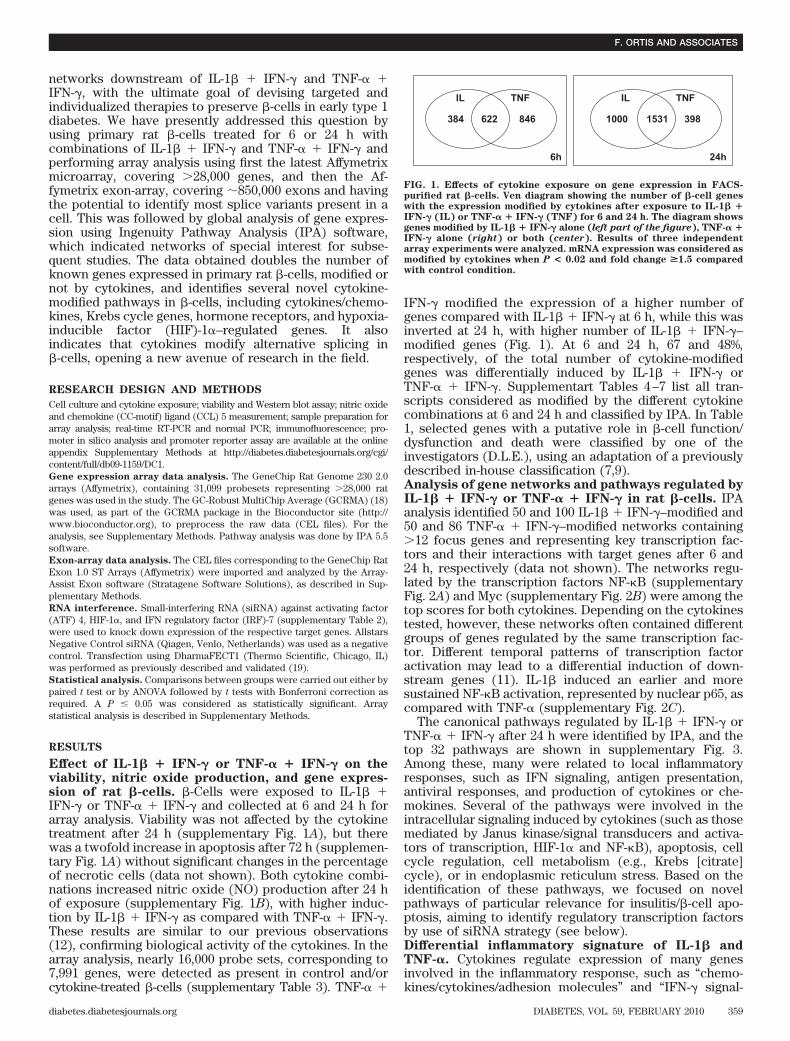
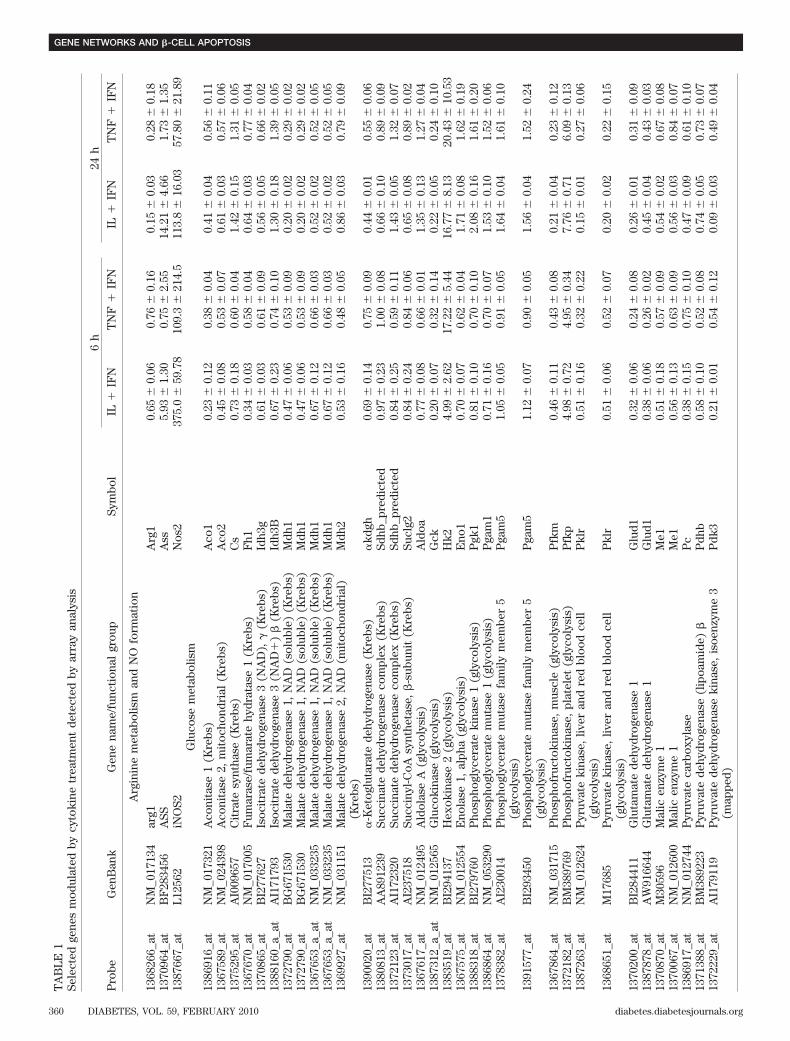
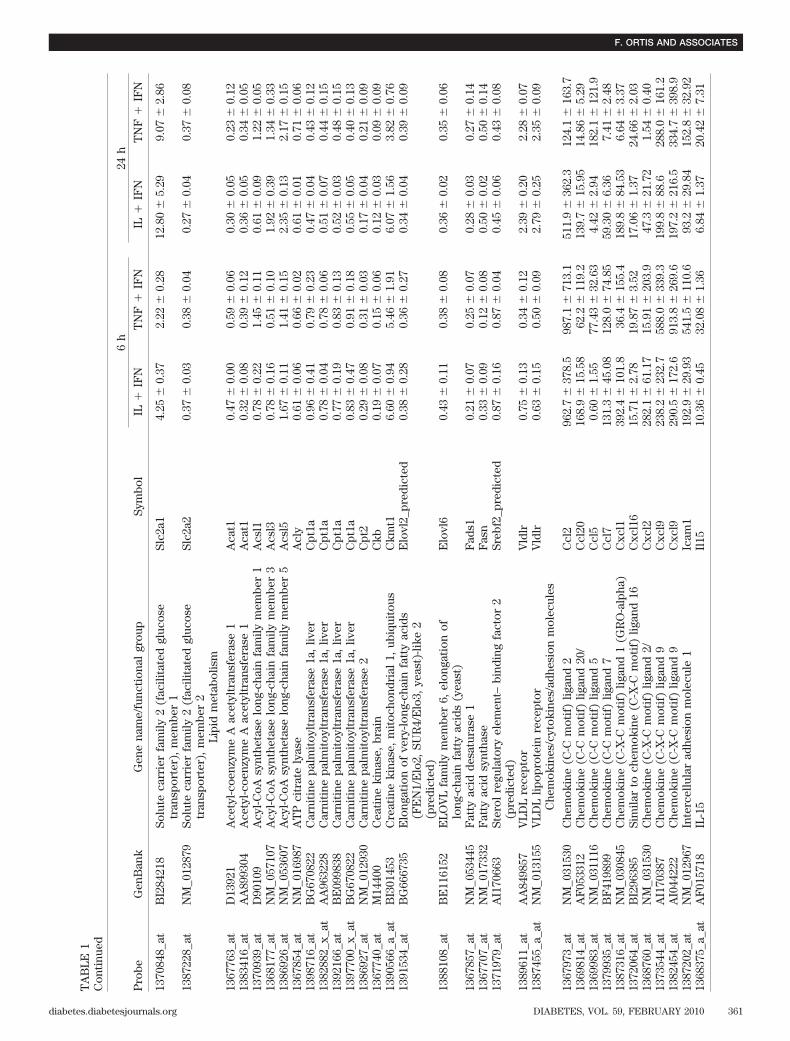
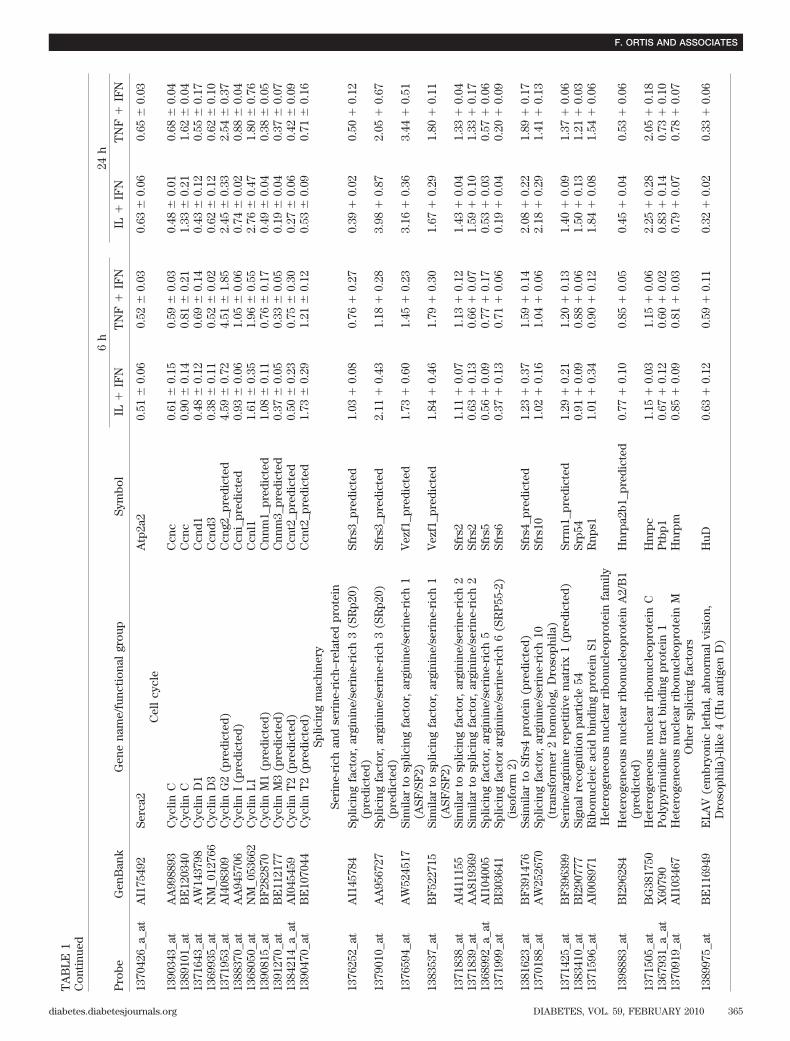
IFN-� modified the expression of a higher number ofgenes compared with IL-1� � IFN-� at 6 h, while this wasinverted at 24 h, with higher number of IL-1� � IFN-�–modified genes (Fig. 1). At 6 and 24 h, 67 and 48%,respectively, of the total number of cytokine-modifiedgenes was differentially induced by IL-1� � IFN-� orTNF-� � IFN-�. Supplementart Tables 4–7 list all tran-scripts considered as modified by the different cytokinecombinations at 6 and 24 h and classified by IPA. In Table1, selected genes with a putative role in �-cell function/dysfunction and death were classified by one of theinvestigators (D.L.E.), using an adaptation of a previouslydescribed in-house classification (7,9).Analysis of gene networks and pathways regulated byIL-1� � IFN-� or TNF-� � IFN-� in rat �-cells. IPAanalysis identified 50 and 100 IL-1� � IFN-�–modified and50 and 86 TNF-� � IFN-�–modified networks containing�12 focus genes and representing key transcription fac-tors and their interactions with target genes after 6 and24 h, respectively (data not shown). The networks regu-lated by the transcription factors NF-�B (supplementaryFig. 2A) and Myc (supplementary Fig. 2B) were among thetop scores for both cytokines. Depending on the cytokinestested, however, these networks often contained differentgroups of genes regulated by the same transcription fac-tor. Different temporal patterns of transcription factoractivation may lead to a differential induction of down-stream genes (11). IL-1� induced an earlier and moresustained NF-�B activation, represented by nuclear p65, ascompared with TNF-� (supplementary Fig. 2C).
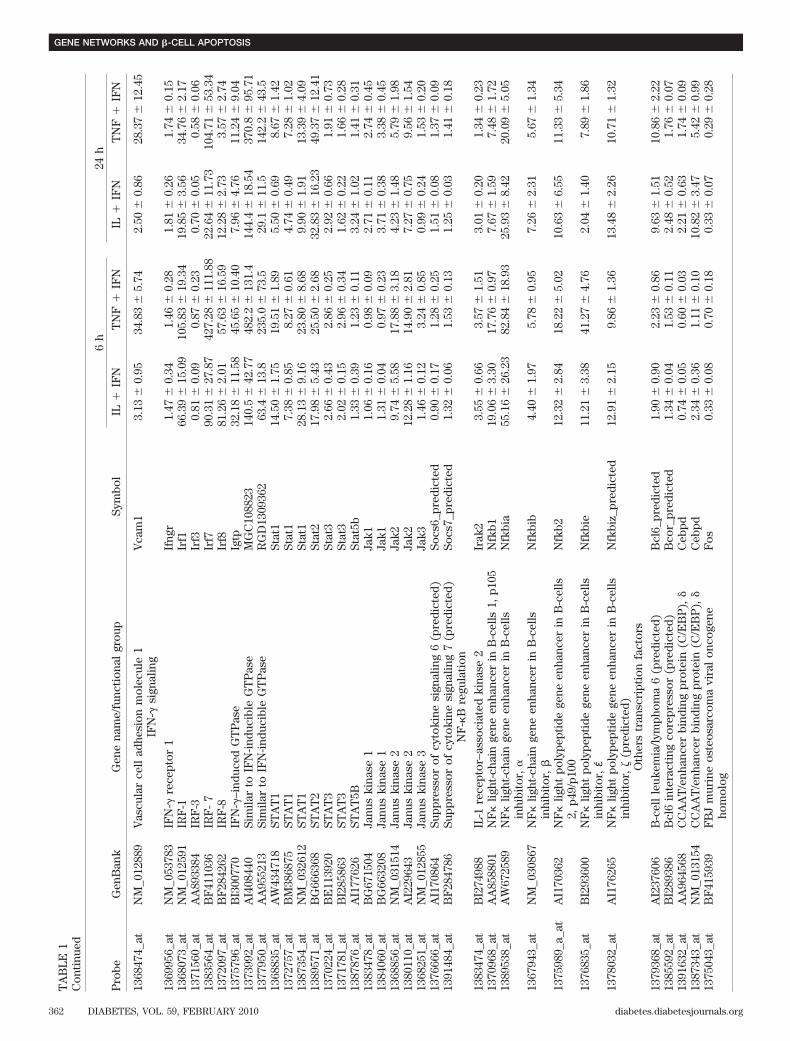
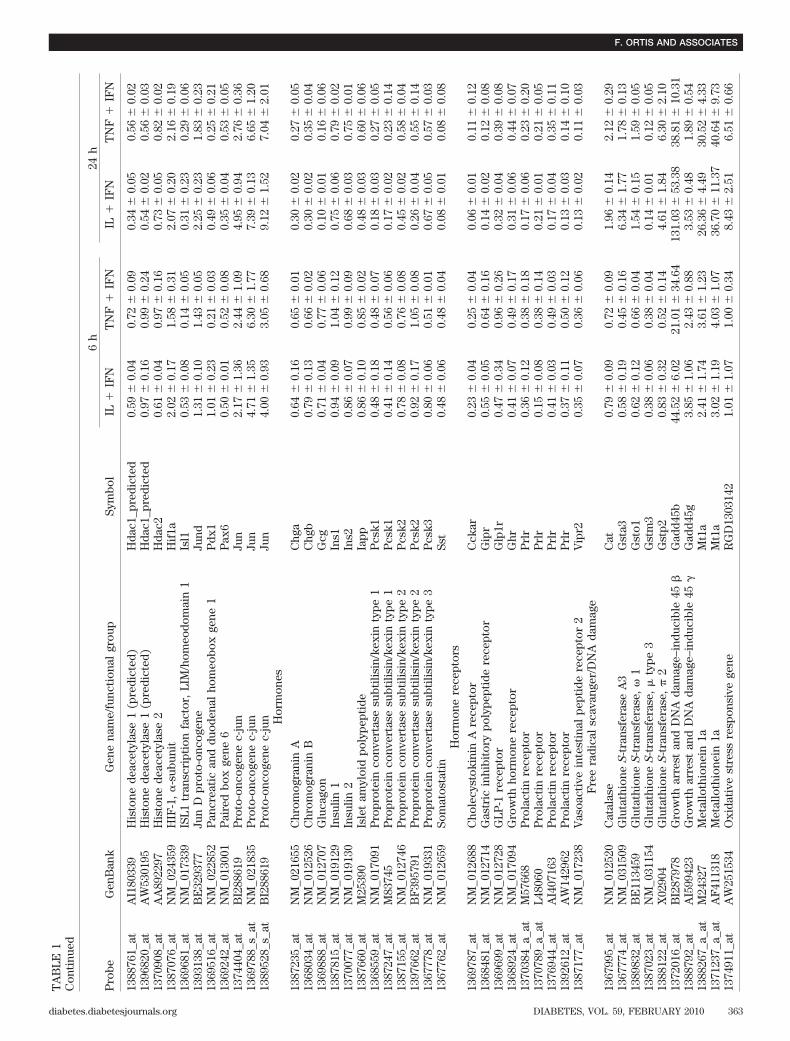
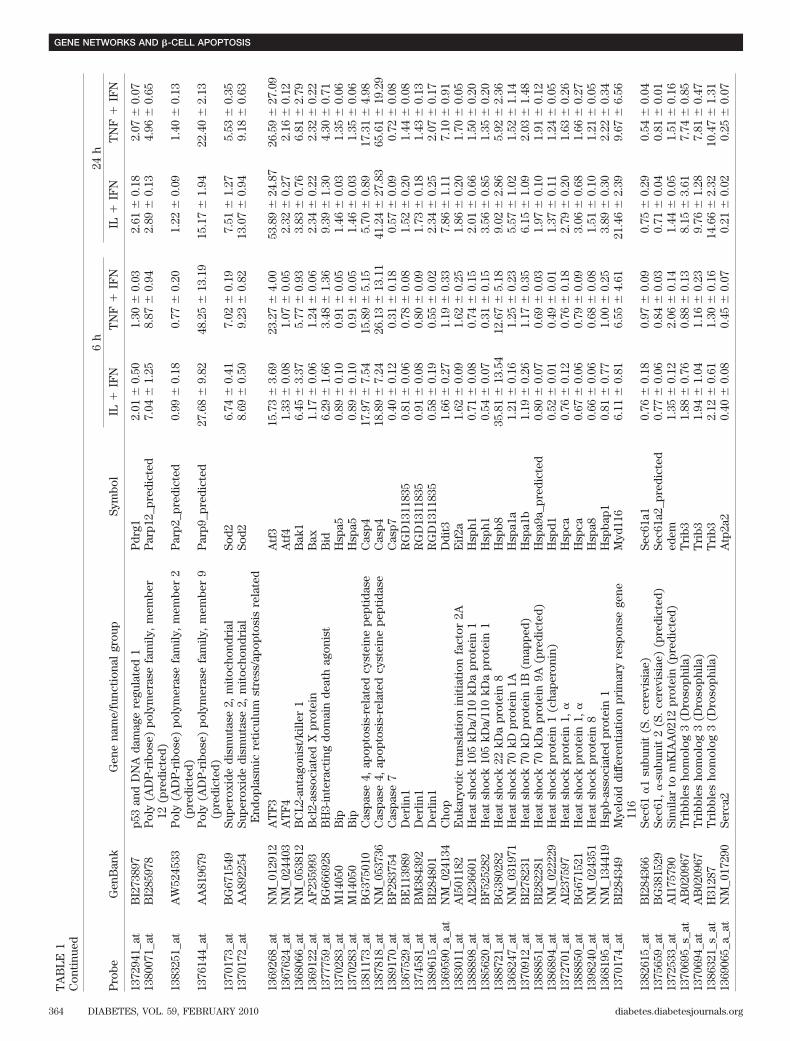
The canonical pathways regulated by IL-1� � IFN-� orTNF-� � IFN-� after 24 h were identified by IPA, and thetop 32 pathways are shown in supplementary Fig. 3.Among these, many were related to local inflammatoryresponses, such as IFN signaling, antigen presentation,antiviral responses, and production of cytokines or che-mokines. Several of the pathways were involved in theintracellular signaling induced by cytokines (such as thosemediated by Janus kinase/signal transducers and activa-tors of transcription, HIF-1� and NF-�B), apoptosis, cellcycle regulation, cell metabolism (e.g., Krebs [citrate]cycle), or in endoplasmic reticulum stress. Based on theidentification of these pathways, we focused on novelpathways of particular relevance for insulitis/�-cell apo-ptosis, aiming to identify regulatory transcription factorsby use of siRNA strategy (see below).Differential inflammatory signature of IL-1� andTNF-�. Cytokines regulate expression of many genesinvolved in the inflammatory response, such as “chemo-kines/cytokines/adhesion molecules” and “IFN-� signal-
384 622 846
IL TNF
6h
1000 1531 398
IL TNF
24h
FIG. 1. Effects of cytokine exposure on gene expression in FACS-purified rat �-cells. Ven diagram showing the number of �-cell geneswith the expression modified by cytokines after exposure to IL-1� �IFN-� (IL) or TNF-� � IFN-� (TNF) for 6 and 24 h. The diagram showsgenes modified by IL-1� � IFN-� alone (left part of the figure), TNF-� �IFN-� alone (right) or both (center). Results of three independentarray experiments were analyzed. mRNA expression was considered asmodified by cytokines when P < 0.02 and fold change >1.5 comparedwith control condition.
F. ORTIS AND ASSOCIATES
diabetes.diabetesjournals.org DIABETES, VOL. 59, FEBRUARY 2010 359
TA
BLE
1Se
lect
edge
nes
mod
ulat
edby
cyto
kine
trea
tmen
tde
tect
edby
arra
yan
alys
is
Pro
beG
enB
ank
Gen
ena
me/
func
tion
algr
oup
Sym
bol
6h
24h
IL�
IFN
TN
F�
IFN
IL�
IFN
TN
F�
IFN
Arg
inin
em
etab
olis
man
dN
Ofo
rmat
ion
1368
266_
atN
M_0
1713
4ar
g1A
rg1
0.65
�0.
060.
76�
0.16
0.15
�0.
030.
28�
0.18
1370
964_
atB
F28
3456
ASS
Ass
5.93
�1.
300.
75�
2.55
14.2
1�
4.66
1.73
�1.
3513
8766
7_at
L125
62iN
OS2
Nos
237
5.0
�59
.78
109.
3�
214.
511
3.8
�16
.03
57.8
0�
21.8
9G
luco
sem
etab
olis
m
1386
916_
atN
M_0
1732
1A
coni
tase
1(K
rebs
)A
co1
0.23
�0.
120.
38�
0.04
0.41
�0.
040.
56�
0.11
1367
589_
atN
M_0
2439
8A
coni
tase
2,m
itoc
hond
rial
(Kre
bs)
Aco
20.
45�
0.08
0.53
�0.
070.
61�
0.03
0.57
�0.
0613
7529
5_at
AI0
0965
7C
itra
tesy
ntha
se(K
rebs
)C
s0.
73�
0.18
0.60
�0.
041.
42�
0.15
1.31
�0.
0513
6767
0_at
NM
_017
005
Fum
aras
e/fu
mar
ate
hydr
atas
e1
(Kre
bs)
Fh1
0.34
�0.
030.
58�
0.04
0.64
�0.
030.
77�
0.04
1370
865_
atB
I277
627
Isoc
itra
tede
hydr
ogen
ase
3(N
AD
),�
(Kre
bs)
Idh3
g0.
61�
0.03
0.61
�0.
090.
56�
0.05
0.66
�0.
0213
8816
0_a_
atA
I171
793
Isoc
itra
tede
hydr
ogen
ase
3(N
AD
�)
�(K
rebs
)Id
h3B
0.67
�0.
230.
74�
0.10
1.30
�0.
181.
39�
0.05
1372
790_
atB
G67
1530
Mal
ate
dehy
drog
enas
e1,
NA
D(s
olub
le)
(Kre
bs)
Mdh
10.
47�
0.06
0.53
�0.
090.
20�
0.02
0.29
�0.
0213
7279
0_at
BG
6715
30M
alat
ede
hydr
ogen
ase
1,N
AD
(sol
uble
)(K
rebs
)M
dh1
0.47
�0.
060.
53�
0.09
0.20
�0.
020.
29�
0.02
1367
653_
a_at
NM
_033
235
Mal
ate
dehy
drog
enas
e1,
NA
D(s
olub
le)
(Kre
bs)
Mdh
10.
67�
0.12
0.66
�0.
030.
52�
0.02
0.52
�0.
0513
6765
3_a_
atN
M_0
3323
5M
alat
ede
hydr
ogen
ase
1,N
AD
(sol
uble
)(K
rebs
)M
dh1
0.67
�0.
120.
66�
0.03
0.52
�0.
020.
52�
0.05
1369
927_
atN
M_0
3115
1M
alat
ede
hydr
ogen
ase
2,N
AD
(mit
ocho
ndri
al)
(Kre
bs)
Mdh
20.
53�
0.16
0.48
�0.
050.
86�
0.03
0.79
�0.
09
1390
020_
atB
I277
513
�-K
etog
luta
rate
dehy
drog
enas
e(K
rebs
)�
kdgh
0.69
�0.
140.
75�
0.09
0.44
�0.
010.
55�
0.06
1380
813_
atA
A89
1239
Succ
inat
ede
hydr
ogen
ase
com
plex
(Kre
bs)
Sdhb
_pre
dict
ed0.
97�
0.23
1.00
�0.
080.
66�
0.10
0.89
�0.
0913
7212
3_at
AI1
7232
0Su
ccin
ate
dehy
drog
enas
eco
mpl
ex(K
rebs
)Sd
hb_p
redi
cted
0.84
�0.
250.
59�
0.11
1.43
�0.
051.
32�
0.07
1373
017_
atA
I237
518
Succ
inyl
-CoA
synt
heta
se,
�-s
ubun
it(K
rebs
)Su
clg2
0.84
�0.
240.
84�
0.06
0.65
�0.
080.
89�
0.02
1367
617_
atN
M_0
1249
5A
ldol
ase
A(g
lyco
lysi
s)A
ldoa
0.77
�0.
080.
66�
0.01
1.35
�0.
131.
27�
0.04
1387
312_
a_at
NM
_012
565
Glu
coki
nase
(gly
coly
sis)
Gck
0.20
�0.
070.
32�
0.14
0.22
�0.
050.
24�
0.10
1383
519_
atB
I294
137
Hex
okin
ase
2(g
lyco
lysi
s)H
k24.
99�
2.62
17.2
2�
5.44
16.7
7�
8.13
20.4
3�
10.5
313
6757
5_at
NM
_012
554
Eno
lase
1,al
pha
(gly
coly
sis)
Eno
10.
70�
0.07
0.62
�0.
041.
71�
0.08
1.62
�0.
1913
8831
8_at
BI2
7976
0P
hosp
hogl
ycer
ate
kina
se1
(gly
coly
sis)
Pgk
10.
81�
0.10
0.70
�0.
102.
08�
0.16
1.61
�0.
2013
8686
4_at
NM
_053
290
Pho
spho
glyc
erat
em
utas
e1
(gly
coly
sis)
Pga
m1
0.71
�0.
160.
70�
0.07
1.53
�0.
101.
52�
0.06
1378
382_
atA
I230
014
Pho
spho
glyc
erat
em
utas
efa
mily
mem
ber
5(g
lyco
lysi
s)P
gam
51.
05�
0.05
0.91
�0.
051.
64�
0.04
1.61
�0.
10
1391
577_
atB
I293
450
Pho
spho
glyc
erat
em
utas
efa
mily
mem
ber
5(g
lyco
lysi
s)P
gam
51.
12�
0.07
0.90
�0.
051.
56�
0.04
1.52
�0.
24
1367
864_
atN
M_0
3171
5P
hosp
hofr
ucto
kina
se,
mus
cle
(gly
coly
sis)
Pfk
m0.
46�
0.11
0.43
�0.
080.
21�
0.04
0.23
�0.
1213
7218
2_at
BM
3897
69P
hosp
hofr
ucto
kina
se,
plat
elet
(gly
coly
sis)
Pfk
p4.
98�
0.72
4.95
�0.
347.
76�
0.71
6.09
�0.
1313
8726
3_at
NM
_012
624
Pyr
uvat
eki
nase
,liv
eran
dre
dbl
ood
cell
(gly
coly
sis)
Pkl
r0.
51�
0.16
0.32
�0.
220.
15�
0.01
0.27
�0.
06
1368
651_
atM
1768
5P
yruv
ate
kina
se,
liver
and
red
bloo
dce
ll(g
lyco
lysi
s)P
klr
0.51
�0.
060.
52�
0.07
0.20
�0.
020.
22�
0.15
1370
200_
atB
I284
411
Glu
tam
ate
dehy
drog
enas
e1
Glu
d10.
32�
0.06
0.24
�0.
080.
26�
0.01
0.31
�0.
0913
8787
8_at
AW
9166
44G
luta
mat
ede
hydr
ogen
ase
1G
lud1
0.38
�0.
060.
26�
0.02
0.45
�0.
040.
43�
0.03
1370
870_
atM
3059
6M
alic
enzy
me
1M
e10.
51�
0.18
0.57
�0.
090.
54�
0.02
0.67
�0.
0813
7006
7_at
NM
_012
600
Mal
icen
zym
e1
Me1
0.56
�0.
130.
63�
0.09
0.56
�0.
030.
84�
0.07
1386
917_
atN
M_0
1274
4P
yruv
ate
carb
oxyl
ase
Pc
0.38
�0.
150.
75�
0.10
0.47
�0.
090.
61�
0.10
1371
388_
atB
M38
9223
Pyr
uvat
ede
hydr
ogen
ase
(lip
oam
ide)
�P
dhb
0.58
�0.
100.
52�
0.08
0.74
�0.
050.
73�
0.07
1372
229_
atA
I179
119
Pyr
uvat
ede
hydr
ogen
ase
kina
se,
isoe
nzym
e3
(map
ped)
Pdk
30.
21�
0.01
0.54
�0.
120.
09�
0.03
0.49
�0.
04
GENE NETWORKS AND �-CELL APOPTOSIS
360 DIABETES, VOL. 59, FEBRUARY 2010 diabetes.diabetesjournals.org
TA
BLE
1C
onti
nued
Pro
beG
enB
ank
Gen
ena
me/
func
tion
algr
oup
Sym
bol
6h
24h
IL�
IFN
TN
F�
IFN
IL�
IFN
TN
F�
IFN
1370
848_
atB
I284
218
Solu
teca
rrie
rfa
mily
2(f
acili
tate
dgl
ucos
etr
ansp
orte
r),
mem
ber
1Sl
c2a1
4.25
�0.
372.
22�
0.28
12.8
0�
5.29
9.07
�2.
86
1387
228_
atN
M_0
1287
9So
lute
carr
ier
fam
ily2
(fac
ilita
ted
gluc
ose
tran
spor
ter)
,m
embe
r2
Slc2
a20.
37�
0.03
0.38
�0.
040.
27�
0.04
0.37
�0.
08
Lipi
dm
etab
olis
m
1367
763_
atD
1392
1A
cety
l-coe
nzym
eA
acet
yltr
ansf
eras
e1
Aca
t10.
47�
0.00
0.59
�0.
060.
30�
0.05
0.23
�0.
1213
8341
6_at
AA
8993
04A
cety
l-coe
nzym
eA
acet
yltr
ansf
eras
e1
Aca
t10.
32�
0.08
0.39
�0.
120.
36�
0.05
0.34
�0.
0513
7093
9_at
D90
109
Acy
l-CoA
synt
heta
selo
ng-c
hain
fam
ilym
embe
r1
Acs
l10.
78�
0.22
1.45
�0.
110.
61�
0.09
1.22
�0.
0513
6817
7_at
NM
_057
107
Acy
l-CoA
synt
heta
selo
ng-c
hain
fam
ilym
embe
r3
Acs
l30.
78�
0.16
0.51
�0.
101.
92�
0.39
1.34
�0.
3313
8692
6_at
NM
_053
607
Acy
l-CoA
synt
heta
selo
ng-c
hain
fam
ilym
embe
r5
Acs
l51.
67�
0.11
1.41
�0.
152.
35�
0.13
2.17
�0.
1513
6785
4_at
NM
_016
987
AT
Pci
trat
ely
ase
Acl
y0.
61�
0.06
0.66
�0.
020.
61�
0.01
0.71
�0.
0613
9871
6_at
BG
6708
22C
arni
tine
palm
itoy
ltra
nsfe
rase
1a,
liver
Cpt
1a0.
96�
0.41
0.79
�0.
230.
47�
0.04
0.43
�0.
1213
8288
2_x_
atA
A96
3228
Car
niti
nepa
lmit
oylt
rans
fera
se1a
,liv
erC
pt1a
0.78
�0.
040.
78�
0.06
0.51
�0.
070.
44�
0.15
1392
166_
atB
E09
9838
Car
niti
nepa
lmit
oylt
rans
fera
se1a
,liv
erC
pt1a
0.77
�0.
190.
83�
0.13
0.52
�0.
030.
48�
0.15
1397
700_
x_at
BG
6708
22C
arni
tine
palm
itoy
ltra
nsfe
rase
1a,
liver
Cpt
1a0.
83�
0.47
0.91
�0.
180.
55�
0.05
0.40
�0.
1313
8692
7_at
NM
_012
930
Car
niti
nepa
lmit
oylt
rans
fera
se2
Cpt
20.
29�
0.08
0.31
�0.
030.
17�
0.04
0.21
�0.
0913
6774
0_at
M14
400
Cea
tine
kina
se,
brai
nC
kb0.
19�
0.07
0.15
�0.
060.
12�
0.03
0.09
�0.
0913
9056
6_a_
atB
I301
453
Cre
atin
eki
nase
,m
itoc
hond
rial
1,ub
iqui
tous
Ckm
t16.
60�
0.94
5.46
�1.
916.
07�
1.56
3.82
�0.
7613
9153
4_at
BG
6667
35E
long
atio
nof
very
-long
-cha
infa
tty
acid
s(F
EN
1/E
lo2,
SUR
4/E
lo3,
yeas
t)-li
ke2
(pre
dict
ed)
Elo
vl2_
pred
icte
d0.
38�
0.28
0.36
�0.
270.
34�
0.04
0.39
�0.
09
1388
108_
atB
E11
6152
ELO
VL
fam
ilym
embe
r6,
elon
gati
onof
long
-cha
infa
tty
acid
s(y
east
)E
lovl
60.
43�
0.11
0.38
�0.
080.
36�
0.02
0.35
�0.
06
1367
857_
atN
M_0
5344
5F
atty
acid
desa
tura
se1
Fad
s10.
21�
0.07
0.25
�0.
070.
28�
0.03
0.27
�0.
1413
6770
7_at
NM
_017
332
Fat
tyac
idsy
ntha
seF
asn
0.33
�0.
090.
12�
0.08
0.50
�0.
020.
50�
0.14
1371
979_
atA
I170
663
Ster
olre
gula
tory
elem
ent–
bind
ing
fact
or2
(pre
dict
ed)
Sreb
f2_p
redi
cted
0.87
�0.
160.
87�
0.04
0.45
�0.
060.
43�
0.08
1389
611_
atA
A84
9857
VLD
Lre
cept
orV
ldlr
0.75
�0.
130.
34�
0.12
2.39
�0.
202.
28�
0.07
1387
455_
a_at
NM
_013
155
VLD
Llip
opro
tein
rece
ptor
Vld
lr0.
63�
0.15
0.50
�0.
092.
79�
0.25
2.35
�0.
09C
hem
okin
es/c
ytok
ines
/adh
esio
nm
olec
ules
1367
973_
atN
M_0
3153
0C
hem
okin
e(C
-Cm
otif
)lig
and
2C
cl2
962.
7�
378.
598
7.1
�71
3.1
511.
9�
362.
312
4.1
�16
3.7
1369
814_
atA
F05
3312
Che
mok
ine
(C-C
mot
if)
ligan
d20
/C
cl20
168.
9�
15.5
862
.2�
119.
213
9.7
�15
.95
14.8
6�
5.29
1369
983_
atN
M_0
3111
6C
hem
okin
e(C
-Cm
otif
)lig
and
5C
cl5
0.60
�1.
5577
.43
�32
.63
4.42
�2.
9418
2.1
�12
1.9
1379
935_
atB
F41
9899
Che
mok
ine
(C-C
mot
if)
ligan
d7
Ccl
713
1.3
�45
.08
128.
0�
74.8
559
.30
�6.
367.
41�
2.48
1387
316_
atN
M_0
3084
5C
hem
okin
e(C
-X-C
mot
if)
ligan
d1
(GR
O-a
lpha
)C
xcl1
392.
4�
101.
836
.4�
155.
418
9.8
�84
.53
6.64
�3.
3713
7206
4_at
BI2
9638
5Si
mila
rto
chem
okin
e(C
-X-C
mot
if)
ligan
d16
Cxc
l16
15.7
1�
2.78
19.8
7�
3.52
17.0
6�
1.37
24.6
6�
2.03
1368
760_
atN
M_0
3153
0C
hem
okin
e(C
-X-C
mot
if)
ligan
d2/
Cxc
l228
2.1
�61
.17
15.9
1�
203.
947
.3�
21.7
21.
54�
0.40
1373
544_
atA
I170
387
Che
mok
ine
(C-X
-Cm
otif
)lig
and
9C
xcl9
238.
2�
232.
758
8.0
�33
9.3
199.
8�
88.6
288.
0�
161.
213
8245
4_at
AI0
4422
2C
hem
okin
e(C
-X-C
mot
if)
ligan
d9
Cxc
l929
0.5
�17
2.6
913.
8�
269.
619
7.2
�21
6.5
334.
7�
398.
913
8720
2_at
NM
_012
967
Inte
rcel
lula
rad
hesi
onm
olec
ule
1Ic
am1
192.
9�
29.9
354
1.5
�11
0.6
93.2
�29
.84
152.
8�
32.9
213
6837
5_a_
atA
F01
5718
IL-1
5Il
1510
.36
�0.
4532
.08
�1.
366.
84�
1.37
20.4
2�
7.31
F. ORTIS AND ASSOCIATES
diabetes.diabetesjournals.org DIABETES, VOL. 59, FEBRUARY 2010 361
TA
BLE
1C
onti
nued
Pro
beG
enB
ank
Gen
ena
me/
func
tion
algr
oup
Sym
bol
6h
24h
IL�
IFN
TN
F�
IFN
IL�
IFN
TN
F�
IFN
1368
474_
atN
M_0
1288
9V
ascu
lar
cell
adhe
sion
mol
ecul
e1
Vca
m1
3.13
�0.
9534
.83
�5.
742.
50�
0.86
28.3
7�
12.4
5IF
N-�
sign
alin
g
1369
956_
atN
M_0
5378
3IF
N-�
rece
ptor
1If
ngr
1.47
�0.
341.
46�
0.28
1.81
�0.
261.
74�
0.15
1368
073_
atN
M_0
1259
1IR
F-1
Irf1
66.3
9�
15.0
910
5.83
�19
.34
19.8
5�
3.56
34.7
6�
2.17
1371
560_
atA
A89
3384
IRF
-3Ir
f30.
81�
0.09
0.87
�0.
230.
70�
0.05
0.58
�0.
0613
8356
4_at
BF
4110
36IR
F-
7Ir
f790
.31
�27
.87
427.
28�
111.
8822
.64
�11
.73
104.
71�
53.3
413
7209
7_at
BF
2842
62IR
F-8
Irf8
81.2
6�
2.01
57.6
3�
16.5
912
.28
�2.
733.
57�
2.74
1375
796_
atB
I300
770
IFN
-�–i
nduc
edG
TP
ase
Igtp
32.1
8�
11.5
845
.65
�10
.40
7.96
�4.
7611
.24
�9.
0413
7399
2_at
AI4
0844
0Si
mila
rto
IFN
-indu
cibl
eG
TP
ase
MG
C10
8823
140.
5�
42.7
748
2.2
�13
1.4
144.
4�
18.5
437
0.8
�95
.71
1377
950_
atA
A95
5213
Sim
ilar
toIF
N-in
duci
ble
GT
Pas
eR
GD
1309
362
63.4
�13
.823
5.0
�73
.529
.1�
11.5
142.
2�
43.5
1368
835_
atA
W43
4718
STA
T1
Stat
114
.50
�1.
7519
.51
�1.
895.
50�
0.69
8.67
�1.
4213
7275
7_at
BM
3868
75ST
AT
1St
at1
7.38
�0.
858.
27�
0.61
4.74
�0.
497.
28�
1.02
1387
354_
atN
M_0
3261
2ST
AT
1St
at1
28.1
3�
9.16
23.8
0�
8.68
9.90
�1.
9113
.39
�4.
0913
8957
1_at
BG
6663
68ST
AT
2St
at2
17.9
8�
5.43
25.5
0�
2.68
32.8
3�
16.2
349
.37
�12
.41
1370
224_
atB
E11
3920
STA
T3
Stat
32.
66�
0.43
2.86
�0.
252.
92�
0.66
1.91
�0.
7313
7178
1_at
BI2
8586
3ST
AT
3St
at3
2.02
�0.
152.
96�
0.34
1.62
�0.
221.
66�
0.28
1387
876_
atA
I177
626
STA
T5B
Stat
5b1.
33�
0.39
1.23
�0.
113.
24�
1.02
1.41
�0.
3113
8347
8_at
BG
6715
04Ja
nus
kina
se1
Jak1
1.06
�0.
160.
98�
0.09
2.71
�0.
112.
74�
0.45
1384
060_
atB
G66
3208
Janu
ski
nase
1Ja
k11.
31�
0.04
0.97
�0.
233.
71�
0.38
3.38
�0.
4513
6885
6_at
NM
_031
514
Janu
ski
nase
2Ja
k29.
74�
5.58
17.8
8�
3.18
4.23
�1.
485.
79�
1.98
1380
110_
atA
I229
643
Janu
ski
nase
2Ja
k212
.28
�1.
1614
.90
�2.
817.
27�
0.75
9.56
�1.
5413
6825
1_at
NM
_012
855
Janu
ski
nase
3Ja
k31.
46�
0.12
3.24
�0.
850.
99�
0.24
1.53
�0.
2013
7666
6_at
AI1
7086
4Su
ppre
ssor
ofcy
toki
nesi
gnal
ing
6(p
redi
cted
)So
cs6_
pred
icte
d0.
90�
0.17
1.28
�0.
251.
51�
0.08
1.37
�0.
0913
9148
4_at
BF
2847
86Su
ppre
ssor
ofcy
toki
nesi
gnal
ing
7(p
redi
cted
)So
cs7_
pred
icte
d1.
32�
0.06
1.53
�0.
131.
25�
0.03
1.41
�0.
18N
F-�
Bre
gula
tion
1383
474_
atB
I274
988
IL-1
rece
ptor
–ass
ocia
ted
kina
se2
Irak
23.
55�
0.66
3.57
�1.
513.
01�
0.20
1.34
�0.
2313
7096
8_at
AA
8588
01N
F�
light
-cha
inge
neen
hanc
erin
B-c
ells
1,p1
05N
fkb1
19.0
6�
3.30
17.7
6�
0.97
7.67
�1.
597.
48�
1.72
1389
538_
atA
W67
2589
NF
�lig
ht-c
hain
gene
enha
ncer
inB
-cel
lsin
hibi
tor,
�N
fkbi
a55
.16
�26
.23
82.8
4�
18.9
325
.93
�8.
4220
.09
�5.
05
1367
943_
atN
M_0
3086
7N
F�
light
-cha
inge
neen
hanc
erin
B-c
ells
inhi
bito
r,�
Nfk
bib
4.40
�1.
975.
78�
0.95
7.26
�2.
315.
67�
1.34
1375
989_
a_at
AI1
7036
2N
F�
light
poly
pept
ide
gene
enha
ncer
inB
-cel
ls2,
p49/
p100
Nfk
b212
.32
�2.
8418
.22
�5.
0210
.63
�6.
5511
.33
�5.
34
1376
835_
atB
I293
600
NF
�lig
htpo
lype
ptid
ege
neen
hanc
erin
B-c
ells
inhi
bito
r,ε
Nfk
bie
11.2
1�
3.38
41.2
7�
4.76
2.04
�1.
407.
89�
1.86
1378
032_
atA
I176
265
NF
�lig
htpo
lype
ptid
ege
neen
hanc
erin
B-c
ells
inhi
bito
r,
(pre
dict
ed)
Nfk
biz_
pred
icte
d12
.91
�2.
159.
86�
1.36
13.4
8�
2.26
10.7
1�
1.32
Oth
ers
tran
scri
ptio
nfa
ctor
s
1379
368_
atA
I237
606
B-c
ell
leuk
emia
/lym
phom
a6
(pre
dict
ed)
Bcl
6_pr
edic
ted
1.90
�0.
902.
23�
0.86
9.63
�1.
5110
.86
�2.
2213
8559
2_at
BI2
8938
6B
cl6
inte
ract
ing
core
pres
sor
(pre
dict
ed)
Bco
r_pr
edic
ted
1.34
�0.
041.
53�
0.11
2.48
�0.
521.
76�
0.07
1391
632_
atA
A96
4568
CC
AA
T/e
nhan
cer
bind
ing
prot
ein
(C/E
BP
),
Ceb
pd0.
74�
0.05
0.60
�0.
032.
21�
0.63
1.74
�0.
0913
8734
3_at
NM
_013
154
CC
AA
T/e
nhan
cer
bind
ing
prot
ein
(C/E
BP
),
Ceb
pd2.
34�
0.36
1.11
�0.
1010
.82
�3.
475.
42�
0.99
1375
043_
atB
F41
5939
FB
Jm
urin
eos
teos
arco
ma
vira
lon
coge
neho
mol
ogF
os0.
33�
0.08
0.70
�0.
180.
33�
0.07
0.29
�0.
28
GENE NETWORKS AND �-CELL APOPTOSIS
362 DIABETES, VOL. 59, FEBRUARY 2010 diabetes.diabetesjournals.org
TA
BLE
1C
onti
nued
Pro
beG
enB
ank
Gen
ena
me/
func
tion
algr
oup
Sym
bol
6h
24h
IL�
IFN
TN
F�
IFN
IL�
IFN
TN
F�
IFN
1388
761_
atA
I180
339
His
tone
deac
etyl
ase
1(p
redi
cted
)H
dac1
_pre
dict
ed0.
59�
0.04
0.72
�0.
090.
34�
0.05
0.56
�0.
0213
9682
0_at
AW
5301
95H
isto
nede
acet
ylas
e1
(pre
dict
ed)
Hda
c1_p
redi
cted
0.97
�0.
160.
99�
0.24
0.54
�0.
020.
56�
0.03
1370
908_
atA
A89
2297
His
tone
deac
etyl
ase
2H
dac2
0.61
�0.
040.
97�
0.16
0.73
�0.
050.
82�
0.02
1387
076_
atN
M_0
2435
9H
IF-1
,�
-sub
unit
Hif
1a2.
02�
0.17
1.58
�0.
312.
07�
0.20
2.16
�0.
1913
6968
1_at
NM
_017
339
ISL1
tran
scri
ptio
nfa
ctor
,LI
M/h
omeo
dom
ain
1Is
l10.
53�
0.08
0.14
�0.
050.
31�
0.23
0.29
�0.
0613
9313
8_at
BE
3293
77Ju
nD
prot
o-on
coge
neJu
nd1.
31�
0.10
1.43
�0.
052.
25�
0.23
1.83
�0.
2313
6951
6_at
NM
_022
852
Pan
crea
tic
and
duod
enal
hom
eobo
xge
ne1
Pdx
11.
01�
0.23
0.21
�0.
030.
49�
0.06
0.25
�0.
2113
6924
2_at
NM
_013
001
Pai
red
box
gene
6P
ax6
0.50
�0.
010.
52�
0.08
0.35
�0.
040.
53�
0.05
1374
404_
atB
I288
619
Pro
to-o
ncog
ene
c-ju
nJu
n2.
17�
1.36
2.44
�1.
094.
95�
0.94
2.76
�0.
3613
6978
8_s_
atN
M_0
2183
5P
roto
-onc
ogen
ec-
jun
Jun
4.71
�1.
356.
30�
1.77
7.39
�0.
136.
65�
1.20
1389
528_
s_at
BI2
8861
9P
roto
-onc
ogen
ec-
jun
Jun
4.00
�0.
933.
05�
0.68
9.12
�1.
527.
04�
2.01
Hor
mon
es
1387
235_
atN
M_0
2165
5C
hrom
ogra
nin
AC
hga
0.64
�0.
160.
65�
0.01
0.30
�0.
020.
27�
0.05
1368
034_
atN
M_0
1252
6C
hrom
ogra
nin
BC
hgb
0.79
�0.
130.
66�
0.02
0.30
�0.
020.
35�
0.04
1369
888_
atN
M_0
1270
7G
luca
gon
Gcg
0.71
�0.
040.
77�
0.06
0.10
�0.
010.
16�
0.06
1387
815_
atN
M_0
1912
9In
sulin
1In
s10.
94�
0.09
1.04
�0.
120.
75�
0.06
0.79
�0.
0213
7007
7_at
NM
_019
130
Insu
lin2
Ins2
0.86
�0.
070.
99�
0.09
0.68
�0.
030.
75�
0.01
1387
660_
atM
2539
0Is
let
amyl
oid
poly
pept
ide
Iapp
0.86
�0.
100.
85�
0.02
0.48
�0.
030.
60�
0.06
1368
559_
atN
M_0
1709
1P
ropr
otei
nco
nver
tase
subt
ilisi
n/ke
xin
type
1P
csk1
0.48
�0.
180.
48�
0.07
0.18
�0.
030.
27�
0.05
1387
247_
atM
8374
5P
ropr
otei
nco
nver
tase
subt
ilisi
n/ke
xin
type
1P
csk1
0.41
�0.
140.
56�
0.06
0.17
�0.
020.
23�
0.14
1387
155_
atN
M_0
1274
6P
ropr
otei
nco
nver
tase
subt
ilisi
n/ke
xin
type
2P
csk2
0.78
�0.
080.
76�
0.08
0.45
�0.
020.
58�
0.04
1397
662_
atB
F39
5791
Pro
prot
ein
conv
erta
sesu
btili
sin/
kexi
nty
pe2
Pcs
k20.
92�
0.17
1.05
�0.
080.
26�
0.04
0.55
�0.
1413
6777
8_at
NM
_019
331
Pro
prot
ein
conv
erta
sesu
btili
sin/
kexi
nty
pe3
Pcs
k30.
80�
0.06
0.51
�0.
010.
67�
0.05
0.57
�0.
0313
6776
2_at
NM
_012
659
Som
atos
tati
nSs
t0.
48�
0.06
0.48
�0.
040.
08�
0.01
0.08
�0.
08H
orm
one
rece
ptor
s
1369
787_
atN
M_0
1268
8C
hole
cyst
okin
inA
rece
ptor
Cck
ar0.
23�
0.04
0.25
�0.
040.
06�
0.01
0.11
�0.
1213
6848
1_at
NM
_012
714
Gas
tric
inhi
bito
rypo
lype
ptid
ere
cept
orG
ipr
0.55
�0.
050.
64�
0.16
0.14
�0.
020.
12�
0.08
1369
699_
atN
M_0
1272
8G
LP-1
rece
ptor
Glp
1r0.
47�
0.34
0.96
�0.
260.
32�
0.04
0.39
�0.
0813
6892
4_at
NM
_017
094
Gro
wth
horm
one
rece
ptor
Ghr
0.41
�0.
070.
49�
0.17
0.31
�0.
060.
44�
0.07
1370
384_
a_at
M57
668
Pro
lact
inre
cept
orP
rlr
0.36
�0.
120.
38�
0.18
0.17
�0.
060.
23�
0.20
1370
789_
a_at
L480
60P
rola
ctin
rece
ptor
Prl
r0.
15�
0.08
0.38
�0.
140.
21�
0.01
0.21
�0.
0513
7694
4_at
AI4
0716
3P
rola
ctin
rece
ptor
Prl
r0.
41�
0.03
0.49
�0.
030.
17�
0.04
0.35
�0.
1113
9261
2_at
AW
1429
62P
rola
ctin
rece
ptor
Prl
r0.
37�
0.11
0.50
�0.
120.
13�
0.03
0.14
�0.
1013
8717
7_at
NM
_017
238
Vas
oact
ive
inte
stin
alpe
ptid
ere
cept
or2
Vip
r20.
35�
0.07
0.36
�0.
060.
13�
0.02
0.11
�0.
03F
ree
radi
cal
scav
ange
r/D
NA
dam
age
1367
995_
atN
M_0
1252
0C
atal
ase
Cat
0.79
�0.
090.
72�
0.09
1.96
�0.
142.
12�
0.29
1367
774_
atN
M_0
3150
9G
luta
thio
neS
-tra
nsfe
rase
A3
Gst
a30.
58�
0.19
0.45
�0.
166.
34�
1.77
1.78
�0.
1313
8983
2_at
BE
1134
59G
luta
thio
neS
-tra
nsfe
rase
,�
1G
sto1
0.62
�0.
120.
66�
0.04
1.54
�0.
151.
59�
0.05
1387
023_
atN
M_0
3115
4G
luta
thio
neS
-tra
nsfe
rase
,�
type
3G
stm
30.
38�
0.06
0.38
�0.
040.
14�
0.01
0.12
�0.
0513
8812
2_at
X02
904
Glu
tath
ione
S-t
rans
fera
se,
2
Gst
p20.
83�
0.32
0.52
�0.
144.
61�
1.84
6.30
�2.
1013
7201
6_at
BI2
8797
8G
row
thar
rest
and
DN
Ada
mag
e–in
duci
ble
45�
Gad
d45b
44.5
2�
6.02
21.0
1�
34.6
413
1.03
�53
.38
38.8
1�
10.3
113
8879
2_at
AI5
9942
3G
row
thar
rest
and
DN
Ada
mag
e–in
duci
ble
45�
Gad
d45g
3.85
�1.
062.
43�
0.88
3.53
�0.
481.
89�
0.54
1388
267_
a_at
M24
327
Met
allo
thio
nein
1aM
t1a
2.41
�1.
743.
61�
1.23
26.3
6�
4.49
30.5
2�
4.33
1371
237_
a_at
AF
4113
18M
etal
loth
ione
in1a
Mt1
a3.
02�
1.19
4.03
�1.
0736
.70
�11
.37
40.6
4�
9.73
1374
911_
atA
W25
1534
Oxi
dati
vest
ress
resp
onsi
vege
neR
GD
1303
142
1.01
�1.
071.
00�
0.34
8.43
�2.
516.
51�
0.66
F. ORTIS AND ASSOCIATES
diabetes.diabetesjournals.org DIABETES, VOL. 59, FEBRUARY 2010 363
TA
BLE
1C
onti
nued
Pro
beG
enB
ank
Gen
ena
me/
func
tion
algr
oup
Sym
bol
6h
24h
IL�
IFN
TN
F�
IFN
IL�
IFN
TN
F�
IFN
1372
941_
atB
I273
897
p53
and
DN
Ada
mag
ere
gula
ted
1P
drg1
2.01
�0.
501.
30�
0.03
2.61
�0.
182.
07�
0.07
1380
071_
atB
I285
978
Pol
y(A
DP
-rib
ose)
poly
mer
ase
fam
ily,
mem
ber
12(p
redi
cted
)P
arp1
2_pr
edic
ted
7.04
�1.
258.
87�
0.94
2.89
�0.
134.
96�
0.65
1383
251_
atA
W52
4533
Pol
y(A
DP
-rib
ose)
poly
mer
ase
fam
ily,
mem
ber
2(p
redi
cted
)P
arp2
_pre
dict
ed0.
99�
0.18
0.77
�0.
201.
22�
0.09
1.40
�0.
13
1376
144_
atA
A81
9679
Pol
y(A
DP
-rib
ose)
poly
mer
ase
fam
ily,
mem
ber
9(p
redi
cted
)P
arp9
_pre
dict
ed27
.68
�9.
8248
.25
�13
.19
15.1
7�
1.94
22.4
0�
2.13
1370
173_
atB
G67
1549
Supe
roxi
dedi
smut
ase
2,m
itoc
hond
rial
Sod2
6.74
�0.
417.
02�
0.19
7.51
�1.
275.
53�
0.35
1370
172_
atA
A89
2254
Supe
roxi
dedi
smut
ase
2,m
itoc
hond
rial
Sod2
8.69
�0.
509.
23�
0.82
13.0
7�
0.94
9.18
�0.
63E
ndop
lasm
icre
ticu
lum
stre
ss/a
popt
osis
rela
ted
1369
268_
atN
M_0
1291
2A
TF
3A
tf3
15.7
3�
3.69
23.2
7�
4.00
53.8
9�
24.8
726
.59
�27
.09
1367
624_
atN
M_0
2440
3A
TF
4A
tf4
1.33
�0.
081.
07�
0.05
2.32
�0.
272.
16�
0.12
1368
066_
atN
M_0
5381
2B
CL2
-ant
agon
ist/
kille
r1
Bak
16.
45�
3.37
5.77
�0.
933.
83�
0.76
6.81
�2.
7913
6912
2_at
AF
2359
93B
cl2-
asso
ciat
edX
prot
ein
Bax
1.17
�0.
061.
24�
0.06
2.34
�0.
222.
32�
0.22
1377
759_
atB
G66
6928
BH
3-in
tera
ctin
gdo
mai
nde
ath
agon
ist
Bid
6.29
�1.
663.
48�
1.36
9.39
�1.
304.
30�
0.71
1370
283_
atM
1405
0B
ipH
spa5
0.89
�0.
100.
91�
0.05
1.46
�0.
031.
35�
0.06
1370
283_
atM
1405
0B
ipH
spa5
0.89
�0.
100.
91�
0.05
1.46
�0.
031.
35�
0.06
1381
173_
atB
G37
5010
Cas
pase
4,ap
opto
sis-
rela
ted
cyst
eine
pept
idas
eC
asp4
17.9
7�
7.54
15.8
9�
5.15
5.70
�0.
8917
.31
�4.
9813
8781
8_at
NM
_053
736
Cas
pase
4,ap
opto
sis-
rela
ted
cyst
eine
pept
idas
eC
asp4
18.8
9�
7.24
26.1
3�
13.1
141
.24
�27
.83
65.6
1�
19.2
913
8917
0_at
BF
2837
54C
aspa
se7
Cas
p70.
40�
0.12
0.31
�0.
180.
57�
0.09
0.72
�0.
0813
6752
9_at
BE
1139
89D
erlin
1R
GD
1311
835
0.81
�0.
060.
78�
0.08
1.52
�0.
201.
44�
0.08
1374
581_
atB
M38
4392
Der
lin1
RG
D13
1183
50.
91�
0.08
0.80
�0.
091.
73�
0.18
1.43
�0.
1313
8961
5_at
BI2
8480
1D
erlin
1R
GD
1311
835
0.58
�0.
190.
55�
0.02
2.34
�0.
252.
07�
0.17
1369
590_
a_at
NM
_024
134
Cho
pD
dit3
1.66
�0.
271.
19�
0.33
7.86
�1.
117.
10�
0.91
1383
011_
atA
I501
182
Euk
aryo
tic
tran
slat
ion
init
iati
onfa
ctor
2AE
if2a
1.62
�0.
091.
62�
0.25
1.86
�0.
201.
70�
0.05
1388
898_
atA
I236
601
Hea
tsh
ock
105
kDa/
110
kDa
prot
ein
1H
sph1
0.71
�0.
080.
74�
0.15
2.01
�0.
661.
50�
0.20
1385
620_
atB
F52
5282
Hea
tsh
ock
105
kDa/
110
kDa
prot
ein
1H
sph1
0.54
�0.
070.
31�
0.15
3.56
�0.
851.
35�
0.20
1388
721_
atB
G38
0282
Hea
tsh
ock
22kD
apr
otei
n8
Hsp
b835
.81
�13
.54
12.6
7�
5.18
9.02
�2.
865.
92�
2.36
1368
247_
atN
M_0
3197
1H
eat
shoc
k70
kDpr
otei
n1A
Hsp
a1a
1.21
�0.
161.
25�
0.23
5.57
�1.
021.
52�
1.14
1370
912_
atB
I278
231
Hea
tsh
ock
70kD
prot
ein
1B(m
appe
d)H
spa1
b1.
19�
0.26
1.17
�0.
356.
15�
1.09
2.03
�1.
4813
8885
1_at
BI2
8228
1H
eat
shoc
k70
kDa
prot
ein
9A(p
redi
cted
)H
spa9
a_pr
edic
ted
0.80
�0.
070.
69�
0.03
1.97
�0.
101.
91�
0.12
1386
894_
atN
M_0
2222
9H
eat
shoc
kpr
otei
n1
(cha
pero
nin)
Hsp
d10.
52�
0.01
0.49
�0.
011.
37�
0.11
1.24
�0.
0513
7270
1_at
AI2
3759
7H
eat
shoc
kpr
otei
n1,
�H
spca
0.76
�0.
120.
76�
0.18
2.79
�0.
201.
63�
0.26
1388
850_
atB
G67
1521
Hea
tsh
ock
prot
ein
1,�
Hsp
ca0.
67�
0.06
0.79
�0.
093.
06�
0.68
1.66
�0.
2713
9824
0_at
NM
_024
351
Hea
tsh
ock
prot
ein
8H
spa8
0.66
�0.
060.
68�
0.08
1.51
�0.
101.
21�
0.05
1368
195_
atN
M_1
3441
9H
spb-
asso
ciat
edpr
otei
n1
Hsp
bap1
0.81
�0.
771.
00�
0.25
3.89
�0.
302.
22�
0.34
1370
174_
atB
I284
349
Mye
loid
diff
eren
tiat
ion
prim
ary
resp
onse
gene
116
Myd
116
6.11
�0.
816.
55�
4.61
21.4
6�
2.39
9.67
�6.
56
1382
615_
atB
I284
366
Sec6
1�
1su
buni
t(S
.ce
revi
siae
)Se
c61a
10.
76�
0.18
0.97
�0.
090.
75�
0.29
0.54
�0.
0413
7565
9_at
BG
3815
29Se
c61,
�-s
ubun
it2
(S.
cere
visi
ae)
(pre
dict
ed)
Sec6
1a2_
pred
icte
d0.
77�
0.06
0.84
�0.
030.
71�
0.04
0.81
�0.
0113
7253
3_at
AI1
7579
0Si
mila
rto
mK
IAA
0212
prot
ein
(pre
dict
ed)
edem
1.35
�0.
122.
06�
0.14
1.44
�0.
051.
51�
0.16
1370
695_
s_at
AB
0209
67T
ribb
les
hom
olog
3(D
roso
phila
)T
rib3
1.88
�0.
760.
88�
0.13
8.15
�3.
617.
74�
0.85
1370
694_
atA
B02
0967
Tri
bble
sho
mol
og3
(Dro
soph
ila)
Tri
b31.
94�
1.04
1.16
�0.
239.
76�
1.28
7.81
�0.
4713
8632
1_s_
atH
3128
7T
ribb
les
hom
olog
3(D
roso
phila
)T
rib3
2.12
�0.
611.
30�
0.16
14.6
6�
2.32
10.4
7�
1.31
1369
065_
a_at
NM
_017
290
Serc
a2A
tp2a
20.
40�
0.08
0.45
�0.
070.
21�
0.02
0.25
�0.
07
GENE NETWORKS AND �-CELL APOPTOSIS
364 DIABETES, VOL. 59, FEBRUARY 2010 diabetes.diabetesjournals.org
TA
BLE
1C
onti
nued
Pro
beG
enB
ank
Gen
ena
me/
func
tion
algr
oup
Sym
bol
6h
24h
IL�
IFN
TN
F�
IFN
IL�
IFN
TN
F�
IFN
1370
426_
a_at
AI1
7549
2Se
rca2
Atp
2a2
0.51
�0.
060.
52�
0.03
0.63
�0.
060.
65�
0.03
Cel
lcy
cle
1390
343_
atA
A99
8893
Cyc
linC
Ccn
c0.
61�
0.15
0.59
�0.
030.
48�
0.01
0.68
�0.
0413
8910
1_at
BE
1203
40C
yclin
CC
cnc
0.90
�0.
140.
81�
0.21
1.33
�0.
211.
62�
0.04
1371
643_
atA
W14
3798
Cyc
linD
1C
cnd1
0.48
�0.
120.
69�
0.14
0.43
�0.
120.
55�
0.17
1369
935_
atN
M_0
1276
6C
yclin
D3
Ccn
d30.
38�
0.11
0.52
�0.
020.
62�
0.12
0.62
�0.
1013
7195
3_at
AI4
0830
9C
yclin
G2
(pre
dict
ed)
Ccn
g2_p
redi
cted
4.59
�0.
724.
51�
1.85
2.45
�0.
332.
54�
0.37
1388
370_
atA
A94
5706
Cyc
linI
(pre
dict
ed)
Ccn
i_pr
edic
ted
0.93
�0.
061.
05�
0.06
0.74
�0.
020.
88�
0.04
1368
050_
atN
M_0
5366
2C
yclin
L1C
cnl1
1.61
�0.
351.
96�
0.55
2.76
�0.
471.
80�
0.76
1390
815_
atB
F28
2870
Cyc
linM
1(p
redi
cted
)C
nnm
1_pr
edic
ted
1.08
�0.
110.
76�
0.17
0.49
�0.
040.
38�
0.05
1391
270_
atB
E11
2177
Cyc
linM
3(p
redi
cted
)C
nnm
3_pr
edic
ted
0.37
�0.
050.
33�
0.05
0.19
�0.
040.
37�
0.07
1384
214_
a_at
AI0
4545
9C
yclin
T2
(pre
dict
ed)
Ccn
t2_p
redi
cted
0.50
�0.
230.
75�
0.30
0.27
�0.
060.
42�
0.09
1390
470_
atB
E10
7044
Cyc
linT
2(p
redi
cted
)C
cnt2
_pre
dict
ed1.
73�
0.29
1.21
�0.
120.
53�
0.09
0.71
�0.
16Sp
licin
gm
achi
nery
Seri
ne-r
ich
and
seri
ne-r
ich–
rela
ted
prot
ein
1376
252_
atA
I145
784
Splic
ing
fact
or,
argi
nine
/ser
ine-
rich
3(S
Rp2
0)(p
redi
cted
)Sf
rs3_
pred
icte
d1.
03�
0.08
0.76
�0.
270.
39�
0.02
0.50
�0.
12
1379
010_
atA
A95
6727
Splic
ing
fact
or,
argi
nine
/ser
ine-
rich
3(S
Rp2
0)(p
redi
cted
)Sf
rs3_
pred
icte
d2.
11�
0.43
1.18
�0.
283.
98�
0.87
2.05
�0.
67
1376
594_
atA
W52
4517
Sim
ilar
tosp
licin
gfa
ctor
,ar
gini
ne/s
erin
e-ri
ch1
(ASF
/SF
2)V
ezf1
_pre
dict
ed1.
73�
0.60
1.45
�0.
233.
16�
0.36
3.44
�0.
51
1383
537_
atB
F52
2715
Sim
ilar
tosp
licin
gfa
ctor
,ar
gini
ne/s
erin
e-ri
ch1
(ASF
/SF
2)V
ezf1
_pre
dict
ed1.
84�
0.46
1.79
�0.
301.
67�
0.29
1.80
�0.
11
1371
838_
atA
I411
155
Sim
ilar
tosp
licin
gfa
ctor
,ar
gini
ne/s
erin
e-ri
ch2
Sfrs
21.
11�
0.07
1.13
�0.
121.
43�
0.04
1.33
�0.
0413
7183
9_at
AA
8193
69Si
mila
rto
splic
ing
fact
or,
argi
nine
/ser
ine-
rich
2Sf
rs2
0.63
�0.
130.
66�
0.07
1.59
�0.
101.
33�
0.17
1368
992_
a_at
AI1
0400
5Sp
licin
gfa
ctor
,ar
gini
ne/s
erin
e-ri
ch5
Sfrs
50.
56�
0.09
0.77
�0.
170.
53�
0.03
0.57
�0.
0613
7199
9_at
BI3
0364
1Sp
licin
gfa
ctor
argi
nine
/ser
ine-
rich
6(S
RP
55-2
)(i
sofo
rm2)
Sfrs
60.
37�
0.13
0.71
�0.
060.
19�
0.04
0.20
�0.
09
1381
623_
atB
F39
1476
Ssim
ilar
toSf
rs4
prot
ein
(pre
dict
ed)
Sfrs
4_pr
edic
ted
1.23
�0.
371.
59�
0.14
2.08
�0.
221.
89�
0.17
1370
188_
atA
W25
2670
Splic
ing
fact
or,
argi
nine
/ser
ine-
rich
10(t
rans
form
er2
hom
olog
,D
roso
phila
)Sf
rs10
1.02
�0.
161.
04�
0.06
2.18
�0.
291.
41�
0.13
1371
425_
atB
F39
6399
Seri
ne/a
rgin
ine
repe
titi
vem
atri
x1
(pre
dict
ed)
Srrm
1_pr
edic
ted
1.29
�0.
211.
20�
0.13
1.40
�0.
091.
37�
0.06
1383
410_
atB
I290
777
Sign
alre
cogn
itio
npa
rtic
le54
Srp5
40.
91�
0.09
0.88
�0.
061.
50�
0.13
1.21
�0.
0313
7159
6_at
AI0
0897
1R
ibon
ucle
icac
idbi
ndin
gpr
otei
nS1
Rnp
s11.
01�
0.34
0.90
�0.
121.
84�
0.08
1.54
�0.
06H
eter
ogen
eous
nucl
ear
ribo
nucl
eopr
otei
nfa
mily
1398
883_
atB
I296
284
Het
erog
eneo
usnu
clea
rri
bonu
cleo
prot
ein
A2/
B1
(pre
dict
ed)
Hnr
pa2b
1_pr
edic
ted
0.77
�0.
100.
85�
0.05
0.45
�0.
040.
53�
0.06
1371
505_
atB
G38
1750
Het
erog
eneo
usnu
clea
rri
bonu
cleo
prot
ein
CH
nrpc
1.15
�0.
031.
15�
0.06
2.25
�0.
282.
05�
0.18
1367
931_
a_at
X60
790
Pol
ypyr
imid
ine
trac
tbi
ndin
gpr
otei
n1
Ptb
p10.
67�
0.12
0.60
�0.
020.
83�
0.14
0.73
�0.
1013
7091
9_at
AI1
0346
7H
eter
ogen
eous
nucl
ear
ribo
nucl
eopr
otei
nM
Hnr
pm0.
85�
0.09
0.81
�0.
030.
79�
0.07
0.78
�0.
07O
ther
splic
ing
fact
ors
1389
975_
atB
E11
6949
ELA
V(e
mbr
yoni
cle
thal
,ab
norm
alvi
sion
,D
roso
phila
)-lik
e4
(Hu
anti
gen
D)
HuD
0.63
�0.
120.
59�
0.11
0.32
�0.
020.
33�
0.06
F. ORTIS AND ASSOCIATES
diabetes.diabetesjournals.org DIABETES, VOL. 59, FEBRUARY 2010 365
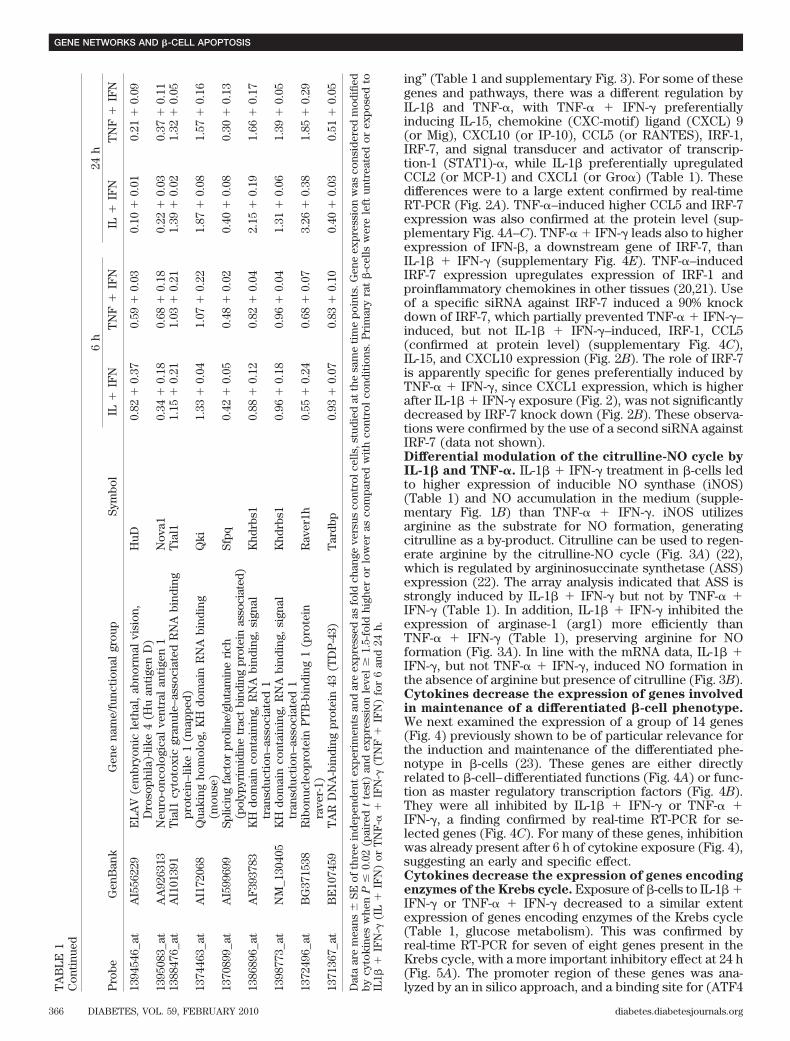
ing” (Table 1 and supplementary Fig. 3). For some of thesegenes and pathways, there was a different regulation byIL-1� and TNF-�, with TNF-� � IFN-� preferentiallyinducing IL-15, chemokine (CXC-motif) ligand (CXCL) 9(or Mig), CXCL10 (or IP-10), CCL5 (or RANTES), IRF-1,IRF-7, and signal transducer and activator of transcrip-tion-1 (STAT1)-�, while IL-1� preferentially upregulatedCCL2 (or MCP-1) and CXCL1 (or Gro�) (Table 1). Thesedifferences were to a large extent confirmed by real-timeRT-PCR (Fig. 2A). TNF-�–induced higher CCL5 and IRF-7expression was also confirmed at the protein level (sup-plementary Fig. 4A–C). TNF-� � IFN-� leads also to higherexpression of IFN-�, a downstream gene of IRF-7, thanIL-1� � IFN-� (supplementary Fig. 4E). TNF-�–inducedIRF-7 expression upregulates expression of IRF-1 andproinflammatory chemokines in other tissues (20,21). Useof a specific siRNA against IRF-7 induced a 90% knockdown of IRF-7, which partially prevented TNF-� � IFN-�–induced, but not IL-1� � IFN-�–induced, IRF-1, CCL5(confirmed at protein level) (supplementary Fig. 4C),IL-15, and CXCL10 expression (Fig. 2B). The role of IRF-7is apparently specific for genes preferentially induced byTNF-� � IFN-�, since CXCL1 expression, which is higherafter IL-1� � IFN-� exposure (Fig. 2), was not significantlydecreased by IRF-7 knock down (Fig. 2B). These observa-tions were confirmed by the use of a second siRNA againstIRF-7 (data not shown).Differential modulation of the citrulline-NO cycle byIL-1� and TNF-�. IL-1� � IFN-� treatment in �-cells ledto higher expression of inducible NO synthase (iNOS)(Table 1) and NO accumulation in the medium (supple-mentary Fig. 1B) than TNF-� � IFN-�. iNOS utilizesarginine as the substrate for NO formation, generatingcitrulline as a by-product. Citrulline can be used to regen-erate arginine by the citrulline-NO cycle (Fig. 3A) (22),which is regulated by argininosuccinate synthetase (ASS)expression (22). The array analysis indicated that ASS isstrongly induced by IL-1� � IFN-� but not by TNF-� �IFN-� (Table 1). In addition, IL-1� � IFN-� inhibited theexpression of arginase-1 (arg1) more efficiently thanTNF-� � IFN-� (Table 1), preserving arginine for NOformation (Fig. 3A). In line with the mRNA data, IL-1� �IFN-�, but not TNF-� � IFN-�, induced NO formation inthe absence of arginine but presence of citrulline (Fig. 3B).Cytokines decrease the expression of genes involvedin maintenance of a differentiated �-cell phenotype.We next examined the expression of a group of 14 genes(Fig. 4) previously shown to be of particular relevance forthe induction and maintenance of the differentiated phe-notype in �-cells (23). These genes are either directlyrelated to �-cell–differentiated functions (Fig. 4A) or func-tion as master regulatory transcription factors (Fig. 4B).They were all inhibited by IL-1� � IFN-� or TNF-� �IFN-�, a finding confirmed by real-time RT-PCR for se-lected genes (Fig. 4C). For many of these genes, inhibitionwas already present after 6 h of cytokine exposure (Fig. 4),suggesting an early and specific effect.Cytokines decrease the expression of genes encodingenzymes of the Krebs cycle. Exposure of �-cells to IL-1� �IFN-� or TNF-� � IFN-� decreased to a similar extentexpression of genes encoding enzymes of the Krebs cycle(Table 1, glucose metabolism). This was confirmed byreal-time RT-PCR for seven of eight genes present in theKrebs cycle, with a more important inhibitory effect at 24 h(Fig. 5A). The promoter region of these genes was ana-lyzed by an in silico approach, and a binding site for (ATF4T
AB
LE1
Con
tinu
ed
Pro
beG
enB
ank
Gen
ena
me/
func
tion
algr
oup
Sym
bol
6h
24h
IL�
IFN
TN
F�
IFN
IL�
IFN
TN
F�
IFN
1394
546_
atA
I556
229
ELA
V(e
mbr
yoni
cle
thal
,ab
norm
alvi
sion
,D
roso
phila
)-lik
e4
(Hu
anti
gen
D)
HuD
0.82
�0.
370.
59�
0.03
0.10
�0.
010.
21�
0.09
1395
083_
atA
A92
6313
Neu
ro-o
ncol
ogic
alve
ntra
lan
tige
n1
Nov
a10.
34�
0.18
0.68
�0.
180.
22�
0.03
0.37
�0.
1113
8847
6_at
AI1
0139
1T
ial1
cyto
toxi
cgr
anul
e–as
soci
ated
RN
Abi
ndin
gpr
otei
n–lik
e1
(map
ped)
Tia
l11.
15�
0.21
1.03
�0.
211.
39�
0.02
1.32
�0.
05
1374
463_
atA
I172
068
Qua
king
hom
olog
,K
Hdo
mai
nR
NA
bind
ing
(mou
se)
Qki
1.33
�0.
041.
07�
0.22
1.87
�0.
081.
57�
0.16
1370
899_
atA
I599
699
Splic
ing
fact
orpr
olin
e/gl
utam
ine
rich
(pol
ypyr
imid
ine
trac
tbi
ndin
gpr
otei
nas
soci
ated
)Sf
pq0.
42�
0.05
0.48
�0.
020.
40�
0.08
0.30
�0.
13
1386
896_
atA
F39
3783
KH
dom
ain
cont
aini
ng,
RN
Abi
ndin
g,si
gnal
tran
sduc
tion
–ass
ocia
ted
1K
hdrb
s10.
88�
0.12
0.82
�0.
042.
15�
0.19
1.66
�0.
17
1398
773_
atN
M_1
3040
5K
Hdo
mai
nco
ntai
ning
,R
NA
bind
ing,
sign
altr
ansd
ucti
on–a
ssoc
iate
d1
Khd
rbs1
0.96
�0.
180.
96�
0.04
1.31
�0.
061.
39�
0.05
1372
496_
atB
G37
1538
Rib
onuc
leop
rote
inP
TB
-bin
ding
1(p
rote
inra
ver-
1)R
aver
1h0.
55�
0.24
0.68
�0.
073.
26�
0.38
1.85
�0.
29
1371
367_
atB
E10
7459
TA
RD
NA
-bin
ding
prot
ein
43(T
DP
-43)
Tar
dbp
0.93
�0.
070.
83�
0.10
0.40
�0.
030.
51�
0.05
Dat
aar
em
eans
�SE
ofth
ree
inde
pend
ent
expe
rim
ents
and
are
expr
esse
das
fold
chan
geve
rsus
cont
rolc
ells
,stu
died
atth
esa
me
tim
epo
ints
.Gen
eex
pres
sion
was
cons
ider
edm
odifi
edby
cyto
kine
sw
hen
P�
0.02
(pai
red
tte
st)
and
expr
essi
onle
vel
�1.
5-fo
ldhi
gher
orlo
wer
asco
mpa
red
wit
hco
ntro
lco
ndit
ions
.P
rim
ary
rat
�-c
ells
wer
ele
ftun
trea
ted
orex
pose
dto
IL1�
�IF
N-�
(IL
�IF
N)
orT
NF
-��
IFN
-�(T
NF
�IF
N)
for
6an
d24
h.
GENE NETWORKS AND �-CELL APOPTOSIS
366 DIABETES, VOL. 59, FEBRUARY 2010 diabetes.diabetesjournals.org
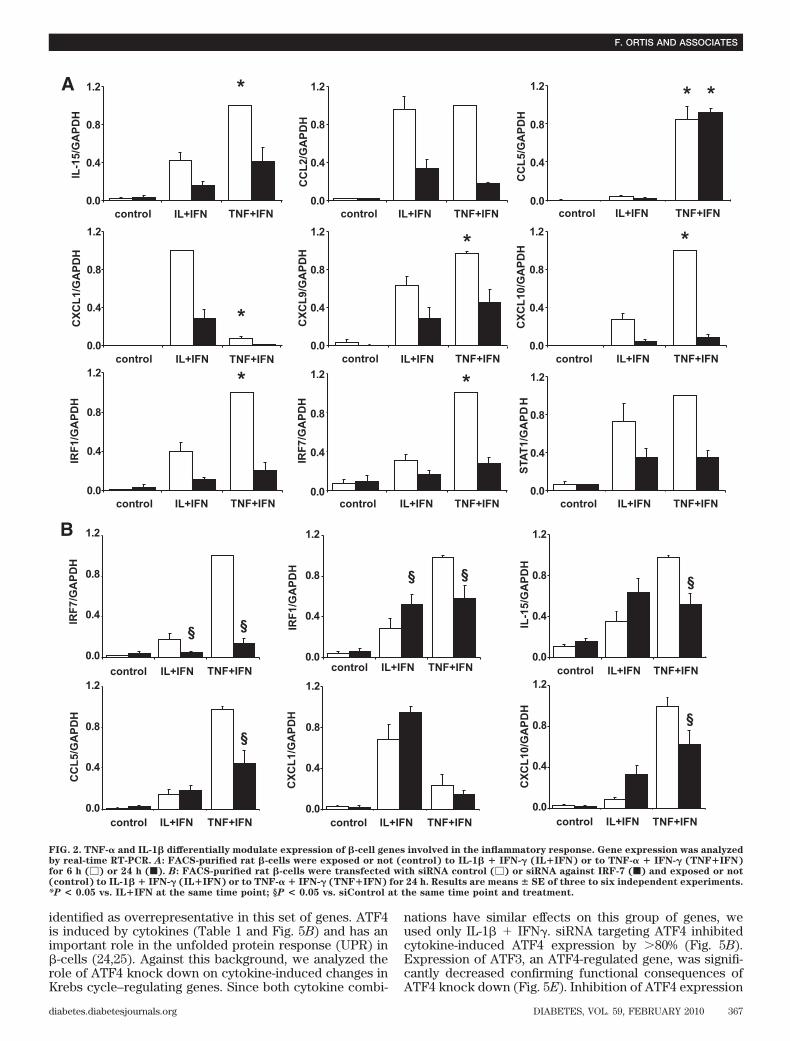
identified as overrepresentative in this set of genes. ATF4is induced by cytokines (Table 1 and Fig. 5B) and has animportant role in the unfolded protein response (UPR) in�-cells (24,25). Against this background, we analyzed therole of ATF4 knock down on cytokine-induced changes inKrebs cycle–regulating genes. Since both cytokine combi-
nations have similar effects on this group of genes, weused only IL-1� � IFN�. siRNA targeting ATF4 inhibitedcytokine-induced ATF4 expression by �80% (Fig. 5B).Expression of ATF3, an ATF4-regulated gene, was signifi-cantly decreased confirming functional consequences ofATF4 knock down (Fig. 5E). Inhibition of ATF4 expression
*
control IL+IFN TNF+IFN
CC
L2/G
APD
H
control IL+IFN TNF+IFN
CXC
L1/G
APD
H
control IL+IFN TNF+IFN
IL-1
5/G
APD
H
control IL+IFN TNF+IFN
CXC
L10/
GA
PDH
control IL+IFN TNF+IFN
CXC
L9/G
APD
H
control IL+IFN TNF+IFN
CC
L5/G
APD
Hcontrol IL+IFN TNF+IFN
IRF1
/GA
PDH
*
**
* *
* *
control IL+IFN TNF+IFN
IRF7
/GA
PDH
control IL+IFN TNF+IFN
STAT
1/G
APD
H
A
B
control IL+IFN TNF+IFN
IRF7
/GA
PDH
control IL+IFN TNF+IFN
IRF1
/GA
PDH
control IL+IFN TNF+IFN
CC
L5/G
APD
H
0.0
0.4
0.8
1.2
0.0
0.4
0.8
1.2
0.0
0.4
0.8
1.2
0.0
0.4
0.8
1.2
0.0
0.4
0.8
1.2
0.0
0.4
0.8
1.2
0.0
0.4
0.8
1.2
0.0
0.4
0.8
1.2
0.0
0.4
0.8
1.2
0.0
0.4
0.8
1.2
0.0
0.4
0.8
1.2
0.0
0.4
0.8
1.2control IL+IFN TNF+IFN
IL-1
5/G
APD
H
0.0
0.4
0.8
1.2
control IL+IFN TNF+IFN
CXC
L10/
GA
PDH
0.0
0.4
0.8
1.2
0.0
0.4
0.8
1.2
control IL+IFN TNF+IFN
CXC
L1/G
APD
H
§ §
§ § §
§§
FIG. 2. TNF-� and IL-1� differentially modulate expression of �-cell genes involved in the inflammatory response. Gene expression was analyzedby real-time RT-PCR. A: FACS-purified rat �-cells were exposed or not (control) to IL-1� � IFN-� (IL�IFN) or to TNF-� � IFN-� (TNF�IFN)for 6 h (�) or 24 h (f). B: FACS-purified rat �-cells were transfected with siRNA control (�) or siRNA against IRF-7 (f) and exposed or not(control) to IL-1� � IFN-� (IL�IFN) or to TNF-� � IFN-� (TNF�IFN) for 24 h. Results are means � SE of three to six independent experiments.*P < 0.05 vs. IL�IFN at the same time point; §P < 0.05 vs. siControl at the same time point and treatment.
F. ORTIS AND ASSOCIATES
diabetes.diabetesjournals.org DIABETES, VOL. 59, FEBRUARY 2010 367
partially prevented the inhibitory effects of cytokines onthe expression of the two Krebs cycles genes analyzed,namely malate dehydrogenase and �-ketoglutarate dehy-drogenase (Fig. 5C). ATF4 knock down was confirmed atthe functional level by Western blot for ATF3, a down-stream gene of ATF4. Cytokine-induced expression ofATF3 was prevented by ATF4 knock down, at a similarlevel of the inhibition observed when a siATF3 was used(Fig. 5E).Cytokines decrease the expression of incretin andhormone receptors at least in part via activation ofHIF-1�. IL-1� � IFN� and TNF-� � IFN� inhibited theexpression of key hormone receptors in rat �-cells (Table1). This was confirmed by real-time RT-PCR for thereceptors of glucagon-like peptide (GLP)-1, prolactin(PRL), growth hormone (GH), and cholecystokinin A(CCKA) (Fig. 6A). Cytokine-induced inhibition was in therange of 50–90% and more marked after 24 h (Fig. 6A).Analysis of the promoter region of these genes found acommon binding site for the transcription factor HIF-1(26,27). Cytokines upregulated transcriptional activity(Fig. 6B) and mRNA expression (Table 1 and Fig. 6C) ofHIF-1�, the regulatory HIF-1 subunit (26). This could inpart be explained by cytokine activation of AKT (supple-mentray Fig. 5C). HIF-1� knock down inhibited by 75%cytokine-induced HIF-1� expression (Fig. 6D) and by 60%HIF transcriptional activity (supplementary Fig. 5A and B).Knock down of HIF-1� partially prevented cytokine-in-duced apoptosis in �-cells (Fig. 6D) and inhibition of tworeceptors analyzed, GLP-1 receptor (R) and PRLR (Fig.6E). This partial effect of HIF-1� knock down in GLP-1Rand PRLR expression suggest that other transcriptionfactors may be involved in this process, as supported bythe in silico identification of other relevant candidatetranscription factors (supplementary Table 8).
Cytokines regulate the splicing machinery and alter-native splicing in primary �-cells. A large number ofcytokine-modified genes are involved in alternative splic-ing (Table 1, splicing machinery). To determine whetherthis triggers modifications in the splice variants present in�-cells, 24-h cytokine-treated samples from the three�-cell–independent preparation/experiments used in theinitial array analysis (Fig. 1 and Table 1) were pooled aspreviously described (7,9) and analyzed for the presenceof splice variants using the rat exon-array from Affymetrix.Cytokine treatment led to important changes in alternativesplicing, with IL-1� � IFN� potentially modulating differ-ential splicing of 2,651 genes (21% of the total number ofthe expressed genes) (supplementary Table 9, Fig. 7A).From these, only 396 were also modified at the expressionlevel. These findings suggest that �50% of IL-1� � IFN-�–modulated genes undergo alternative splicing. For TNF-� �IFN-�, there was induction of alternative splicing in 2,206genes (19%), with only 207 of these being also modified atexpression level (supplementary Table 10, Fig. 7A). Thespliced genes were classified according with their putativemolecular function as shown in supplementary Tables 11and 12. Alternative splicing was confirmed for three genesanalyzed by RT-PCR (Fig. 7), namely iNOS and ASS, whichparticipate in the citrulline-NO cycle (Fig. 3A) and theNF-�B subunit p100/p52 (NF-�B2). iNOS was not detectedin control cells, but it was induced by cytokines, and therewas a difference in the size of the amplified region after 6and 24 h of cytokine treatment (Fig. 7C). At 6 h, there wasamplification of two bands of 1,237 and 1,137 bp, thesecond one corresponding to iNOS lacking exon 8 or 9 (bysequencing analysis of the PCR product we confirmed thatexon 8 is missing (data not shown), while at 24 h themajority of the amplified bands contained exon 8 (Fig. 7C).This confirms that posttranscriptional processing of iNOSis differentially modified by cytokines at different timepoints. Using the same approach, we observed that cyto-kines decreased utilization of exon 1 from ASS while itincreased utilization of exon 22 from NF-�B2 (Fig. 7C).
DISCUSSION
We have presently used state-of-the-art array analysis offluorescence-activated cell sorter–purified �-cells to unveilthe global pattern of genes modified by the inflammatorycytokines IL-1� � IFN-� and TNF-� � IL-1�. The use ofprimary and pure cell preparations (�90% �-cells) is ofspecial relevance, since it enabled us to obtain a broadpicture of �-cell responses to proapoptotic inflammatorymediators without the confounding signals generated byother endocrine and nonendocrine islet cells. We cannot,however, discard that interactions between �-cells andothers cells in the islets, and with infiltrating mononuclearcells during insulitis, will lead to changes in �-cell geneexpression that are not detected by the present model. Thearray data were evaluated by both nonbiased pathwayanalysis (IPA) and investigator-based analysis. Selectedpathways were chosen for additional studies, with specialemphasis on the role of novel transcription factors.Prompted by the observation of cytokine-induced changesin a large number of genes involved in alternative splicing,an exon-array analysis was performed to evaluate thepresence of splicing variants in �-cells. The following aremain novel observations of the study. 1) Nearly 8,000genes were detected as present in �-cell, with 96% confir-mation of selected cytokine-modified genes by real-time
Ass
Citrulline
Arginine
Citrulline+NO
iNOS
Urea+ornithine
arg1
A
B
*
0
2
4
6
8
10
12
control IL+IFN TNF+IFN
pM n
itrite
/105
cel
ls
FIG. 3. Differential usage of the NO synthesis pathway by IL-1� andTNF-�. A: Schematic view of the NO synthesis pathway. Ellipticalshapes represent enzymes. B: Synthesis of NO by rat primary �-cellscultured in arginine-citrulline–free medium (o) or in medium contain-ing 1 mmol/l citrulline (�) and exposed to IL-1� � IFN-� (IL�IFN) orTNF-� � IFN-� (TNF�IFN) for 48 h. Results are mean of five indepen-dent experiments. *P < 0.05 vs. arginine-citrulline–free medium.
GENE NETWORKS AND �-CELL APOPTOSIS
368 DIABETES, VOL. 59, FEBRUARY 2010 diabetes.diabetesjournals.org
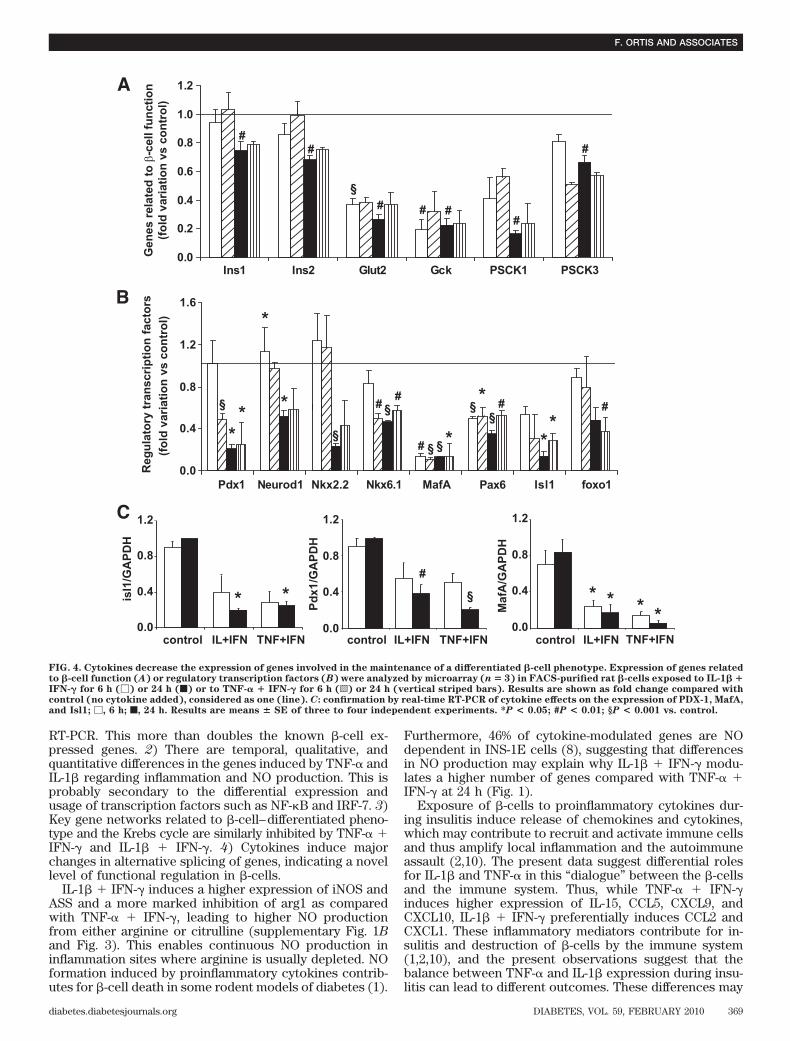
RT-PCR. This more than doubles the known �-cell ex-pressed genes. 2) There are temporal, qualitative, andquantitative differences in the genes induced by TNF-� andIL-1� regarding inflammation and NO production. This isprobably secondary to the differential expression andusage of transcription factors such as NF-�B and IRF-7. 3)Key gene networks related to �-cell–differentiated pheno-type and the Krebs cycle are similarly inhibited by TNF-� �IFN-� and IL-1� � IFN-�. 4) Cytokines induce majorchanges in alternative splicing of genes, indicating a novellevel of functional regulation in �-cells.
IL-1� � IFN-� induces a higher expression of iNOS andASS and a more marked inhibition of arg1 as comparedwith TNF-� � IFN-�, leading to higher NO productionfrom either arginine or citrulline (supplementary Fig. 1Band Fig. 3). This enables continuous NO production ininflammation sites where arginine is usually depleted. NOformation induced by proinflammatory cytokines contrib-utes for �-cell death in some rodent models of diabetes (1).
Furthermore, 46% of cytokine-modulated genes are NOdependent in INS-1E cells (8), suggesting that differencesin NO production may explain why IL-1� � IFN-� modu-lates a higher number of genes compared with TNF-� �IFN-� at 24 h (Fig. 1).
Exposure of �-cells to proinflammatory cytokines dur-ing insulitis induce release of chemokines and cytokines,which may contribute to recruit and activate immune cellsand thus amplify local inflammation and the autoimmuneassault (2,10). The present data suggest differential rolesfor IL-1� and TNF-� in this “dialogue” between the �-cellsand the immune system. Thus, while TNF-� � IFN-�induces higher expression of IL-15, CCL5, CXCL9, andCXCL10, IL-1� � IFN-� preferentially induces CCL2 andCXCL1. These inflammatory mediators contribute for in-sulitis and destruction of �-cells by the immune system(1,2,10), and the present observations suggest that thebalance between TNF-� and IL-1� expression during insu-litis can lead to different outcomes. These differences may
1.2 1.2
0.8
0.0
0.4* * * * * *
Reg
ulat
ory
tran
scrip
tion
fact
ors
(fold
var
iatio
n vs
con
trol
)G
enes
rela
ted
to β
-cel
l fun
ctio
n(fo
ld v
aria
tion
vs c
ontr
ol)
0.0
0.2
0.4
0.6
0.8
1.0
1.2
Ins1 Ins2 Glut2 Gck PSCK1 PSCK3
##
##
#
##
0.0
0.4
0.8
1.2
1.6
Pdx1 Neurod1 Nkx2.2 Nkx6.1 MafA Pax6 Isl1 foxo1
#
# *
*
*
*
###
**
**
A
B
C
0.0
0.4
0.8
control IL+IFN TNF+IFN
isl1
/GA
PDH
control IL+IFN TNF+IFN
Maf
A/G
APD
H
0.0
0.4
0.8
1.2
control IL+IFN TNF+IFN
Pdx1
/GA
PDH
#
§§
§§
§
§
§
§
§
FIG. 4. Cytokines decrease the expression of genes involved in the maintenance of a differentiated �-cell phenotype. Expression of genes relatedto �-cell function (A) or regulatory transcription factors (B) were analyzed by microarray (n � 3) in FACS-purified rat �-cells exposed to IL-1� �IFN-� for 6 h (�) or 24 h (f) or to TNF-� � IFN-� for 6 h (o) or 24 h (vertical striped bars). Results are shown as fold change compared withcontrol (no cytokine added), considered as one (line). C: confirmation by real-time RT-PCR of cytokine effects on the expression of PDX-1, MafA,and Isl1; �, 6 h; f, 24 h. Results are means � SE of three to four independent experiments. *P < 0.05; #P < 0.01; §P < 0.001 vs. control.
F. ORTIS AND ASSOCIATES
diabetes.diabetesjournals.org DIABETES, VOL. 59, FEBRUARY 2010 369
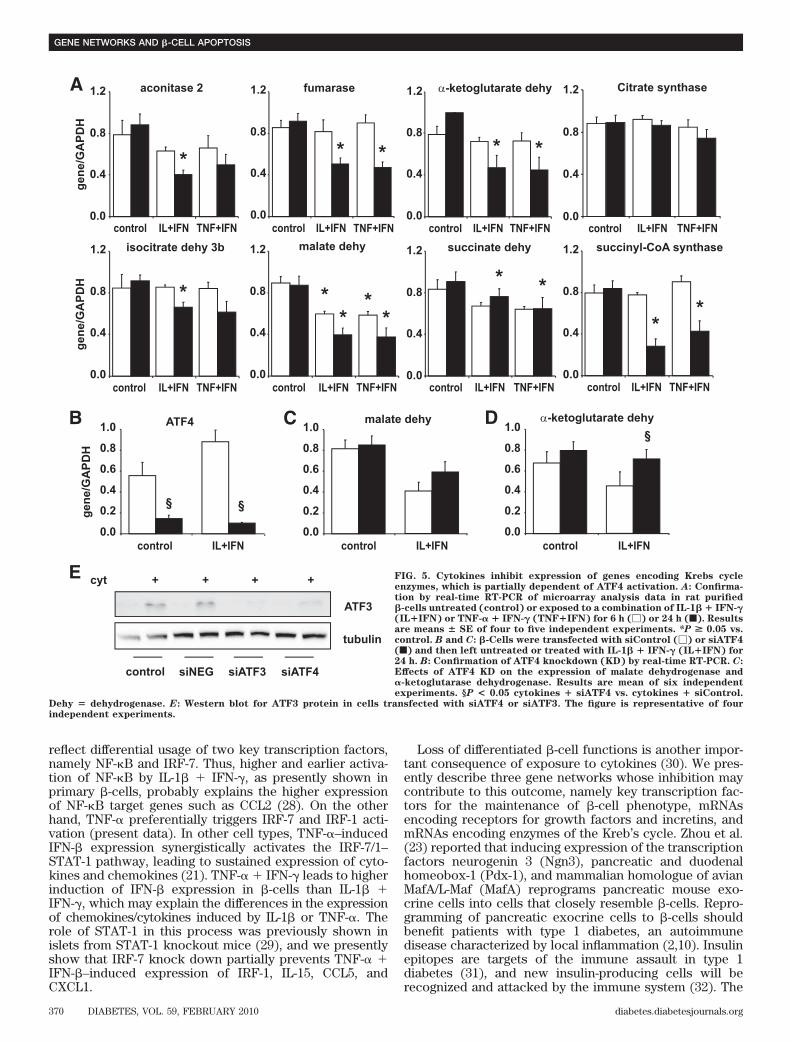
reflect differential usage of two key transcription factors,namely NF-�B and IRF-7. Thus, higher and earlier activa-tion of NF-�B by IL-1� � IFN-�, as presently shown inprimary �-cells, probably explains the higher expressionof NF-�B target genes such as CCL2 (28). On the otherhand, TNF-� preferentially triggers IRF-7 and IRF-1 acti-vation (present data). In other cell types, TNF-�–inducedIFN-� expression synergistically activates the IRF-7/1–STAT-1 pathway, leading to sustained expression of cyto-kines and chemokines (21). TNF-� � IFN-� leads to higherinduction of IFN-� expression in �-cells than IL-1� �IFN-�, which may explain the differences in the expressionof chemokines/cytokines induced by IL-1� or TNF-�. Therole of STAT-1 in this process was previously shown inislets from STAT-1 knockout mice (29), and we presentlyshow that IRF-7 knock down partially prevents TNF-� �IFN-�–induced expression of IRF-1, IL-15, CCL5, andCXCL1.
Loss of differentiated �-cell functions is another impor-tant consequence of exposure to cytokines (30). We pres-ently describe three gene networks whose inhibition maycontribute to this outcome, namely key transcription fac-tors for the maintenance of �-cell phenotype, mRNAsencoding receptors for growth factors and incretins, andmRNAs encoding enzymes of the Kreb’s cycle. Zhou et al.(23) reported that inducing expression of the transcriptionfactors neurogenin 3 (Ngn3), pancreatic and duodenalhomeobox-1 (Pdx-1), and mammalian homologue of avianMafA/L-Maf (MafA) reprograms pancreatic mouse exo-crine cells into cells that closely resemble �-cells. Repro-gramming of pancreatic exocrine cells to �-cells shouldbenefit patients with type 1 diabetes, an autoimmunedisease characterized by local inflammation (2,10). Insulinepitopes are targets of the immune assault in type 1diabetes (31), and new insulin-producing cells will berecognized and attacked by the immune system (32). The
gene
/GA
PDH
1.2
0.0
0.4
0.8
control IL+IFN TNF+IFN
*
aconitase 2
* *
0.0
0.4
0.8
1.2
control IL+IFN TNF+IFN
fumarase 1.2
*
0.0
0.4
0.8
control IL+IFN TNF+IFN
*
α-ketoglutarate dehy
0.0
0.4
0.8
1.2
control IL+IFN TNF+IFN
*
isocitrate dehy 3b
0.0
0.4
0.8
1.2
control IL+IFN TNF+IFN
**
**
malate dehy
* *
0.0
0.4
0.8
1.2
control IL+IFN TNF+IFN
succinate dehy
**
0.0
0.4
0.8
1.2
control IL+IFN TNF+IFN
succinyl-CoA synthase
gene
/GA
PDH
A
B
gene
/GA
PDH
0.0
0.2
0.4
0.6
0.8
1.0
control IL+IFN
ATF4
0.0
0.2
0.4
0.6
0.8
1.0
control IL+IFN
malate dehy
0.0
0.2
0.4
0.6
0.8
1.0
control IL+IFN
α-ketoglutarate dehy
1.2
0.0
0.4
0.8
control IL+IFN TNF+IFN
Citrate synthase
C
++ + +cyt
ATF3
tubulin
control siNEG siATF3 siATF4
E
D§
§ §
FIG. 5. Cytokines inhibit expression of genes encoding Krebs cycleenzymes, which is partially dependent of ATF4 activation. A: Confirma-tion by real-time RT-PCR of microarray analysis data in rat purified�-cells untreated (control) or exposed to a combination of IL-1� � IFN-�(IL�IFN) or TNF-� � IFN-� (TNF�IFN) for 6 h (�) or 24 h (f). Resultsare means � SE of four to five independent experiments. *P > 0.05 vs.control. B and C: �-Cells were transfected with siControl (�) or siATF4(f) and then left untreated or treated with IL-1� � IFN-� (IL�IFN) for24 h. B: Confirmation of ATF4 knockdown (KD) by real-time RT-PCR. C:Effects of ATF4 KD on the expression of malate dehydrogenase and�-ketoglutarase dehydrogenase. Results are mean of six independentexperiments. §P < 0.05 cytokines � siATF4 vs. cytokines � siControl.
Dehy � dehydrogenase. E: Western blot for ATF3 protein in cells transfected with siATF4 or siATF3. The figure is representative of fourindependent experiments.
GENE NETWORKS AND �-CELL APOPTOSIS
370 DIABETES, VOL. 59, FEBRUARY 2010 diabetes.diabetesjournals.org
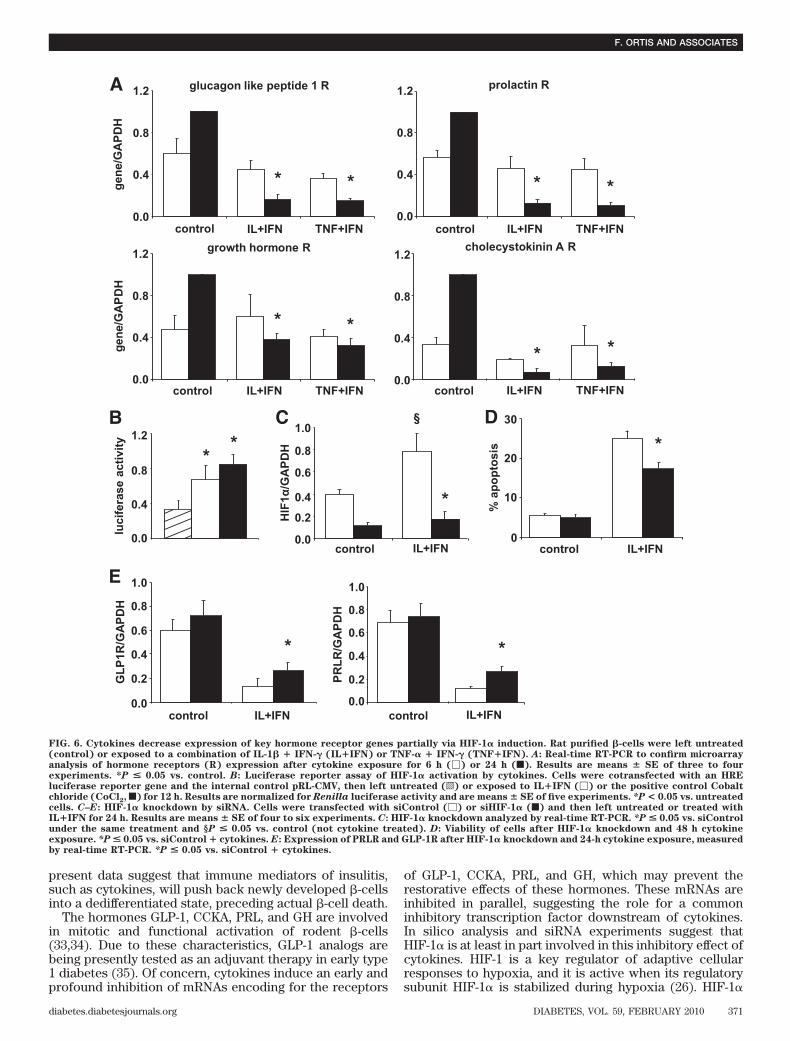
present data suggest that immune mediators of insulitis,such as cytokines, will push back newly developed �-cellsinto a dedifferentiated state, preceding actual �-cell death.
The hormones GLP-1, CCKA, PRL, and GH are involvedin mitotic and functional activation of rodent �-cells(33,34). Due to these characteristics, GLP-1 analogs arebeing presently tested as an adjuvant therapy in early type1 diabetes (35). Of concern, cytokines induce an early andprofound inhibition of mRNAs encoding for the receptors
of GLP-1, CCKA, PRL, and GH, which may prevent therestorative effects of these hormones. These mRNAs areinhibited in parallel, suggesting the role for a commoninhibitory transcription factor downstream of cytokines.In silico analysis and siRNA experiments suggest thatHIF-1� is at least in part involved in this inhibitory effect ofcytokines. HIF-1 is a key regulator of adaptive cellularresponses to hypoxia, and it is active when its regulatorysubunit HIF-1� is stabilized during hypoxia (26). HIF-1�
0
10
20
30
control IL+IFN
% a
popt
osis
0.0
0.2
0.4
0.6
0.8
1.0
control IL+IFN
PRLR
/GA
PDH
0.0
0.2
0.4
0.6
0.8
1.0
control IL+IFN
GLP
1R/G
APD
H
A
B C D
E
0.0
0.4
0.8
1.2
luci
fera
se a
ctiv
ity ** *
0.0
0.2
0.4
0.6
0.8
1.0
control IL+IFN
HIF
1α/G
APD
H
*
* *
growth hormone R
0.0
0.4
0.8
1.2
control IL+IFN TNF+IFN
* *
cholecystokinin A R
0.0
0.4
0.8
1.2
control IL+IFN TNF+IFN
* *
glucagon like peptide 1 R
0.0
0.4
0.8
1.2
control IL+IFN TNF+IFN
* *
prolactin R
0.0
0.4
0.8
1.2
control IL+IFN TNF+IFN
* *
gene
/GA
PD
Hge
ne/G
APD
H
§
FIG. 6. Cytokines decrease expression of key hormone receptor genes partially via HIF-1� induction. Rat purified �-cells were left untreated(control) or exposed to a combination of IL-1� � IFN-� (IL�IFN) or TNF-� � IFN-� (TNF�IFN). A: Real-time RT-PCR to confirm microarrayanalysis of hormone receptors (R) expression after cytokine exposure for 6 h (�) or 24 h (f). Results are means � SE of three to fourexperiments. *P < 0.05 vs. control. B: Luciferase reporter assay of HIF-1� activation by cytokines. Cells were cotransfected with an HREluciferase reporter gene and the internal control pRL-CMV, then left untreated (o) or exposed to IL�IFN (�) or the positive control Cobaltchloride (CoCl2, f) for 12 h. Results are normalized for Renilla luciferase activity and are means � SE of five experiments. *P < 0.05 vs. untreatedcells. C–E: HIF-1� knockdown by siRNA. Cells were transfected with siControl (�) or siHIF-1� (f) and then left untreated or treated withIL�IFN for 24 h. Results are means � SE of four to six experiments. C: HIF-1� knockdown analyzed by real-time RT-PCR. *P < 0.05 vs. siControlunder the same treatment and §P < 0.05 vs. control (not cytokine treated). D: Viability of cells after HIF-1� knockdown and 48 h cytokineexposure. *P < 0.05 vs. siControl � cytokines. E: Expression of PRLR and GLP-1R after HIF-1� knockdown and 24-h cytokine exposure, measuredby real-time RT-PCR. *P < 0.05 vs. siControl � cytokines.
F. ORTIS AND ASSOCIATES
diabetes.diabetesjournals.org DIABETES, VOL. 59, FEBRUARY 2010 371
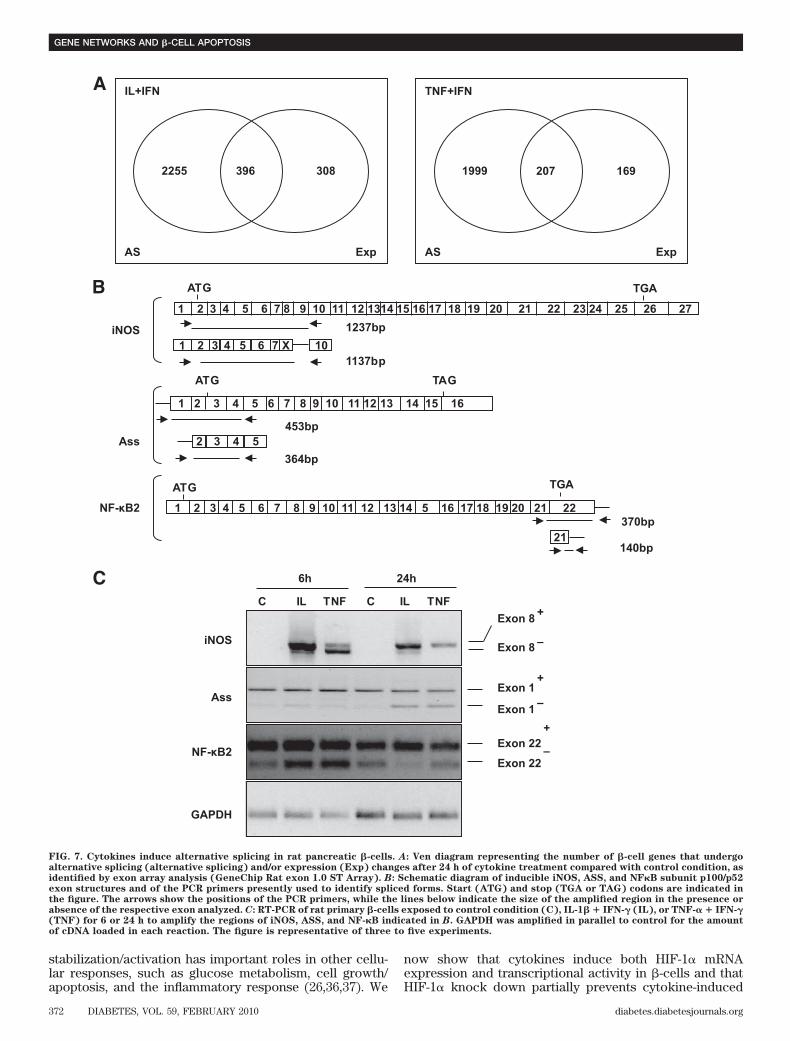
stabilization/activation has important roles in other cellu-lar responses, such as glucose metabolism, cell growth/apoptosis, and the inflammatory response (26,36,37). We
now show that cytokines induce both HIF-1� mRNAexpression and transcriptional activity in �-cells and thatHIF-1� knock down partially prevents cytokine-induced
1 2 3 4 5 6 7 8 9 10 11 12 13 14 15 16
1 2 3 4 5 6 7 8 9 10 11 12 1314 15 16 17 18 19 20 21 22 23 24 25 26 27
54321
ATG TGA
6 7 10X
Ass
iNOS
GAPDH
Exon 1 +
Exon 1
Exon 8 +
Exon 8 –
–
–Exon 22 +
Exon 22
ATG TAG
5432
1237bp
1137bp
iNOS
453bp
364bpAss
1 2 3 4 5 6 7 8 9 10 11 12 13 14 5 16 17 18 19 20 21 22
ATG TGA
370bp
140bp21
NF-κB2
NF-κB2
A
B
C IL TNF C IL TNF
6h 24h
1999 207 169
AS Exp
TNF+IFN
2255 396 308
AS Exp
IL+IFN
C
FIG. 7. Cytokines induce alternative splicing in rat pancreatic �-cells. A: Ven diagram representing the number of �-cell genes that undergoalternative splicing (alternative splicing) and/or expression (Exp) changes after 24 h of cytokine treatment compared with control condition, asidentified by exon array analysis (GeneChip Rat exon 1.0 ST Array). B: Schematic diagram of inducible iNOS, ASS, and NF�B subunit p100/p52exon structures and of the PCR primers presently used to identify spliced forms. Start (ATG) and stop (TGA or TAG) codons are indicated inthe figure. The arrows show the positions of the PCR primers, while the lines below indicate the size of the amplified region in the presence orabsence of the respective exon analyzed. C: RT-PCR of rat primary �-cells exposed to control condition (C), IL-1� � IFN-� (IL), or TNF-� � IFN-�(TNF) for 6 or 24 h to amplify the regions of iNOS, ASS, and NF-�B indicated in B. GAPDH was amplified in parallel to control for the amountof cDNA loaded in each reaction. The figure is representative of three to five experiments.
GENE NETWORKS AND �-CELL APOPTOSIS
372 DIABETES, VOL. 59, FEBRUARY 2010 diabetes.diabetesjournals.org
inhibition of key hormone receptors and �-cell apoptosis.This suggests a novel role for HIF-1� in �-cells, as one ofthe mediators of cytokine-induced �-cell dysfunction anddeath. Of note, prolonged �-cell exposure to high glucosetriggers HIF-1� expression (38), while constitutive HIF-1�expression in �-cells impairs glucose-stimulated insulinrelease (39).
We have previously shown that cytokine-induced NOformation in �-cells inhibits mitochondrial glucose oxida-tion via functional impairment of the enzyme aconitase(40). We presently show that cytokines also inhibit expres-sion of several mRNAs encoding enzymes of the Krebscycle. This is mediated, at least in part, via ATF4 activa-tion, as suggested by both in silico analysis and siRNA. Thetranscription factor ATF4 is part of the UPR response incytokine-treated �-cells (24,25). Endoplasmic reticulumstress may contribute to HIF-1� activation (41), potentiallylinking three cytokine-induced effects in �-cells, namelyendoplasmic reticulum stress, HIF-1� activation, and inhi-bition of the Krebs cycle. Additional experiments are nowrequired to further investigate this possibility and to clarifyhow gene networks regulating mitochondria and endoplas-mic reticulum function may provide the signaling for �-cellapoptosis.
Cytokines modulate expression of several genes relatedto the alternative splicing machinery (present data), whichis in line with recent proteomic data (42). Alternativesplicing is an important determinant of cellular function.More than 85% of the human genes may undergo alterna-tive splicing (14,43), and many of these spliced forms aretissue specific, contributing for the generation of pro-teomic diversity (43). The complex interactions requiredfor correct splicing can be disturbed by changes in theexpression of splicing factors and cellular energy stores(15,44). By exon-array analysis, we presently observedthat cytokines modulate the expression of splicing vari-ants in �-cells, with potentially 20% of the detected genesshowing alternative splicing. This findings must be inter-preted with caution, since they represent a pool of threeexperiments that precludes adequate statistical analysis.In addition, this methodology can lead to false positivedetection (45). Here, for at least three of the modifiedgenes (iNOS ASS, and NF-�B2) there was independentconfirmation by RT-PCR. Cytokine-induced iNOS splicingvariants may provide another level of regulation of iNOSactivity in a tissue-specific way (46). Many of the presentlyidentified genes are modified only at the splicing level,without changes in expression. This indicates a new levelof complexity in the effects of cytokines (and potentially ofother modulators of �-cell function and survival) that mustbe taken into account in future studies. The functionalimpact of these diverse splice variants in �-cells remain tobe investigated, but data available from other tissuesindicate that it is huge, increasing the number of moleculespecies that are involved in normal regulation of cell ordisease susceptibility (14–16,43,47,48). Interestingly, splic-ing may also have a role in the augmentation of autoimu-nity in type 1 diabetes (49).
In conclusion, the present study doubles the number ofknown genes modified by cytokines in primary rat �-cellsand suggests temporal, qualitative, and quantitative differ-ences between the effects of TNF-� � IFN-� and IL-1� �IFN-�. Cytokines decrease the expression of genes relatedto �-cell function and growth/regeneration, indicating thatimmune mediators of insulitis can push back newlyformed �-cells into a dedifferentiated state. Interestingly,
cytokines modify alternative splicing in �-cells, indicatinga new level of complexity in the �-cell responses toimmune-mediated damage.
ACKNOWLEDGMENTS
This work has been supported by grants from the Euro-pean Union (Projects Savebeta and Naimit in the Frame-work Programs 6 and 7 of the European Community); theFNRS (Fonds National de la Recherche Scientifique) andARC (Actions de Recherche Concertee de la CommunauteFrancaise), Belgium; the Belgium Program on Interuniver-sity Poles of Attraction initiated by the Belgian state (IUAPP5/17 and P6/40); and the Expert Center Grant 2008.40.001from the Dutch Diabetes Research Foundation. M.L.C. isthe recipient of a scholarship from CAPES (BrazilianCoordination for the Improvement of Higher EducationPersonnel). F.M. is the recipient of a Postdoctoral Fellow-ship from FNRS, Belgium. No potential conflicts of interestrelevant to this article were reported.
We thank the personnel from Laboratory of Experimen-tal Medicine–Universite Libre de Bruxelles, M.A. Neef, G.Vandenbroeck, M. Urbain, J. Schoonheydt, R. Leeman, S.Mertens, R. Makhnas, and A.E. Musaya for excellenttechnical support.
REFERENCES
1. Eizirik DL, Mandrup-Poulsen T. A choice of death-the signal-transductionof immune-mediated �-cell apoptosis. Diabetologia 2001;44:2115–2133
2. Kaminitz A, Stein J, Yaniv I, Askenasy N. The vicious cycle of apoptotic�-cell death in type 1 diabetes. Immunol Cell Biol 2007;85:582–589
3. Uno S, Imagawa A, Okita K, Sayama K, Moriwaki M, Iwahashi H, YamagataK, Tamura S, Matsuzawa Y, Hanafusa T, Miyagawa J, Shimomura I.Macrophages and dendritic cells infiltrating islets with or without �-cellsproduce tumour necrosis factor-� in patients with recent-onset type 1diabetes. Diabetologia 2007;50:596–601
4. Mastrandrea L, Yu J, Behrens T, Buchlis J, Albini C, Fourtner S, Quattrin T.Etanercept treatment in children with new-onset type 1 diabetes: pilotrandomized, placebo-controlled, double-blind study. Diabetes Care 2009;32:1244–1249
5. Pickersgill LM, Mandrup-Poulsen TR. The anti-interleukin-1 in type 1diabetes action trial-background and rationale. Diabetes Metab Res Rev2009;25:321–324
6. Eizirik DL, Moore F, Flamez D, Ortis F. Use of a systems biology approachto understand pancreatic �-cell death in type 1 diabetes. Biochem SocTrans 2008;36:321–327
7. Cardozo AK, Kruhoffer M, Leeman R, Orntoft T, Eizirik DL. Identificationof novel cytokine-induced genes in pancreatic �-cells by high-densityoligonucleotide arrays. Diabetes 2001;50:909–920
8. Kutlu B, Cardozo AK, Darville MI, Kruhoffer M, Magnusson N, Orntoft T,Eizirik DL. Discovery of gene networks regulating cytokine-induced dys-function and apoptosis in insulin-producing INS-1 cells. Diabetes 2003;52:2701–2719
9. Cardozo AK, Heimberg H, Heremans Y, Leeman R, Kutlu B, Kruhoffer M,Orntoft T, Eizirik DL. A comprehensive analysis of cytokine-induced andnuclear factor-�B-dependent genes in primary rat pancreatic �-cells. J BiolChem 2001;276:48879–48886
10. Eizirik DL, Colli ML, Ortis F. The role of inflammation in insulitis and �-cellloss in type 1 diabetes. Nat Rev Endocrinol 2009;5:219–226
11. Ortis F, Cardozo AK, Crispim D, Storling J, Mandrup-Poulsen T, Eizirik DL.Cytokine-induced pro-apoptotic gene expression in insulin-producing cellsis related to rapid, sustained and non-oscillatory NF-�B activation. MolEndocrinol 2006;20:1867–1879
12. Ortis F, Pirot P, Naamane N, Kreins AY, Rasschaert J, Moore F, Theatre E,Verhaeghe C, Magnusson N, Chariot A, Orntoft T, Eizirik DL. TNF-� andIL-1� induction of NF-�B and its downstream genes has a pro-apoptoticrole in pancreatic �-cells. Diabetologia 2008;51:1213–1225
13. Magnusson NE, Cardozo AK, Kruhoffer M, Eizirik DL, Orntoft TF, JensenJL. Construction and validation of the APOCHIP, a spotted oligo-microar-ray for the study of �-cell apoptosis. BMC Bioinformatics 2005;6:311
14. Pan Q, Shai O, Lee LJ, Frey BJ, Blencowe BJ. Deep surveying of alternativesplicing complexity in the human transcriptome by high-throughput se-quencing. Nat Genet 2008;40:1413–1415
F. ORTIS AND ASSOCIATES
diabetes.diabetesjournals.org DIABETES, VOL. 59, FEBRUARY 2010 373
15. Blencowe BJ. Alternative splicing: new insights from global analyses. Cell2006;126:37–47
16. Colobran R, Pujol-Borrell R, Armengol MP, Juan M. The chemokinenetwork: II. on how polymorphisms and alternative splicing increase thenumber of molecular species and configure intricate patterns of diseasesusceptibility. Clin Exp Immunol 2007;150:1–12
17. Thomas HE, McKenzie MD, Angstetra E, Campbell PD, Kay TW. �-Cellapoptosis in diabetes. Apoptosis 2009;14:1389–1404
18. Wu Z, Irizarry RA, Gentleman R, Martinez-Murillo F, Spencer F. A modelbased background adjustment for oligonucleotide expression array. J AmStat Assoc 2004;99:909–917
19. Moore F, Colli ML, Cnop M, Esteve MI, Cardozo AK, Cunha DA, Bugliani M,Marchetti P, Eizirik DL. PTPN2, a candidate gene for type 1 diabetes,modulates interferon-�–induced pancreatic �-cell apoptosis. Diabetes2009;58:1283–1291
20. Sgarbanti M, Marsili G, Remoli AL, Orsatti R, Battistini A. IRF-7: new rolein the regulation of genes involved in adaptive immunity. Ann N Y Acad Sci2007;1095:325–333
21. Yarilina A, Park-Min KH, Antoniv T, Hu X, Ivashkiv LB. TNF activates anIRF1-dependent autocrine loop leading to sustained expression of chemo-kines and STAT1-dependent type I interferon-response genes. Nat Immu-nol 2008;9:378–387
22. Flodstrom M, Niemann A, Bedoya FJ, Morris SM Jr, Eizirik DL. Expressionof the citrulline-nitric oxide cycle in rodent and human pancreatic �-cells:induction of argininosuccinate synthetase by cytokines. Endocrinology1995;136:3200–3206
23. Zhou Q, Brown J, Kanarek A, Rajagopal J, Melton DA: In vivo reprogram-ming of adult pancreatic exocrine cells to �-cells. Nature 2008;1476–4687
24. Eizirik DL, Cardozo AK, Cnop M. The role for endoplasmic reticulum stressin diabetes mellitus. Endocr Rev 2008;29:42–61
25. Cardozo AK, Ortis F, Storling J, Feng YM, Rasschaert J, Tonnesen M, VanEylen F, Mandrup-Poulsen T, Herchuelz A, Eizirik DL. Cytokines down-regulate the sarcoendoplasmic reticulum pump Ca2� ATPase 2b anddeplete endoplasmic reticulum Ca2�, leading to induction of endoplasmicreticulum stress in pancreatic �-cells. Diabetes 2005;54:452–461
26. Ke Q, Costa M. Hypoxia-inducible factor-1 (HIF-1). Mol Pharmacol 2006;70:1469–1480
27. O’Hagan KA, Cocchiglia S, Zhdanov AV, Tambuwala MM, Cummins EP,Monfared M, Agbor TA, Garvey JF, Papkovsky DB, Taylor CT, Allan BB.PGC-1� is coupled to HIF-1�-dependent gene expression by increasingmitochondrial oxygen consumption in skeletal muscle cells. Proc NatlAcad Sci U S A 2009;106:2188–2193
28. Kutlu B, Darville MI, Cardozo AK, Eizirik DL. Molecular regulation ofmonocyte chemoattractant protein-1 expression in pancreatic �-cells.Diabetes 2003;52:348–355
29. Gysemans CA, Ladriere L, Callewaert H, Rasschaert J, Flamez D, Levy DE,Matthys P, Eizirik DL, Mathieu C. Disruption of the �-interferon signalingpathway at the level of signal transducer and activator of transcription-1prevents immune destruction of �-cells. Diabetes 2005;54:2396–2403
30. Cnop M, Welsh N, Jonas JC, Jorns A, Lenzen S, Eizirik DL. Mechanisms ofpancreatic �-cell death in type 1 and type 2 diabetes: many differences, fewsimilarities. Diabetes 2005;54(Suppl. 2):S97–S107
31. Kent SC, Chen Y, Bregoli L, Clemmings SM, Kenyon NS, Ricordi C, HeringBJ, Hafler DA. Expanded T cells from pancreatic lymph nodes of type 1diabetic subjects recognize an insulin epitope. Nature 2005;435:224–228
32. Sibley RK, Sutherland DE, Goetz F, Michael AF. Recurrent diabetesmellitus in the pancreas iso- and allograft: a light and electron microscopic
and immunohistochemical analysis of four cases. Lab Invest 1985;53:132–144
33. Nielsen JH, Svensson C, Galsgaard ED, Moldrup A, Billestrup N. �-Cellproliferation and growth factors. J Mol Med 1999;77:62–66
34. Ahren B: Potentiators and inhibitors of insulin secretion. In Advances in
Molecular Cell Biology. Vol. 29. Bittar EE, Howel SL, Eds. Greenwich, CT,Jay Press, 1999, p. 191–202
35. Suarez-Pinzon WL, Power RF, Yan Y, Wasserfall C, Atkinson M, Rabino-vitch A. Combination therapy with glucagon-like peptide-1 and gastrinrestores normoglycemia in diabetic NOD mice. Diabetes 2008;57:3281–3288
36. Dehne N, Brune B. HIF-1 in the inflammatory microenvironment. Exp CellRes 2009;315:1791–1797
37. Piret JP, Mottet D, Raes M, Michiels C. Is HIF-1� a pro- or an anti-apoptoticprotein? Biochem Pharmacol 2002;64:889–892
38. Bensellam M, Jonas J-C. High glucose activates hypoxia inducible factors1 and 2 in cultured rat islets and INS-1E cell monolayers. In Proceedings of
the 44th Annual Meeting of the European Association for the Study of
Diabetes, Rome, Italy, 7–11 September 200839. Gribble FM. Intolerant of glucose and gasping for oxygen. J Clin Invest
2009;15:247–24940. Welsh N, Eizirik DL, Bendtzen K, Sandler S. Interleukin-1 �-induced nitric
oxide production in isolated rat pancreatic islets requires gene transcrip-tion and may lead to inhibition of the Krebs cycle enzyme aconitase.Endocrinology 1991;129:3167–3173
41. Werno C, Zhou J, Brune B. A23187, ionomycin and thapsigargin upregulatemRNA of HIF-1� via endoplasmic reticulum stress rather than a rise inintracellular calcium. J Cell Physiol 2008;215:708–714
42. D’Hertog W, Overbergh L, Lage K, Ferreira GB, Maris M, Gysemans C,Flamez D, Cardozo AK, Van den Bergh G, Schoofs L, Arckens L, Moreau Y,Hansen DA, Eizirik DL, Waelkens E, Mathieu C. Proteomics analysis ofcytokine-induced dysfunction and death in insulin-producing INS-1E cells:new insights into the pathways involved. Mol Cell Proteomics 2007;6:2180–2199
43. Wang ET, Sandberg R, Luo S, Khrebtukova I, Zhang L, Mayr C, KingsmoreSF, Schroth GP, Burge CB. Alternative isoform regulation in human tissuetranscriptomes. Nature 2008;456:470–476
44. Long JC, Caceres JF. The SR protein family of splicing factors: masterregulators of gene expression. Biochem J 2009;417:15–27
45. Gaidatzis D, Jacobeit K, Oakeley EJ, Stadler MB: Overestimation ofalternative splicing caused by variable probe characteristics in exonarrays. Nucleic Acid Res 2009;37:e107
46. Eissa NT, Strauss AJ, Haggerty CM, Choo EK, Chu SC, Moss J. Alternativesplicing of human inducible nitric-oxide synthase mRNA. tissue-specificregulation and induction by cytokines. J Biol Chem 1996;271:27184–27187
47. Gardina PJ, Clark TA, Shimada B, Staples MK, Yang Q, Veitch J, SchweitzerA, Awad T, Sugnet C, Dee S, Davies C, Williams A, Turpaz Y. Alternativesplicing and differential gene expression in colon cancer detected by awhole genome exon array. BMC Genomics 2006;7:325
48. Zhang W, Duan S, Bleibel WK, Wisel SA, Huang RS, Wu X, He L, Clark TA,Chen TX, Schweitzer AC, Blume JE, Dolan ME, Cox NJ. Identification ofcommon genetic variants that account for transcript isoform variationbetween human populations. Hum Genet 2009;125:81–93
49. Diez J, Park Y, Zeller M, Brown D, Garza D, Ricordi C, Hutton J, EisenbarthGS, Pugliese A. Differential splicing of the IA-2 mRNA in pancreas andlymphoid organs as a permissive genetic mechanism for autoimmunityagainst the IA-2 type 1 diabetes autoantigen. Diabetes 2001;50:895–900
GENE NETWORKS AND �-CELL APOPTOSIS
374 DIABETES, VOL. 59, FEBRUARY 2010 diabetes.diabetesjournals.org
Related Documents