Cytokine Responses to Schistosoma mansoni and Schistosoma haematobium in Relation to Infection in a Co-endemic Focus in Northern Senegal Lynn Meurs 1 *, Moustapha Mbow 1,2,3 , Nele Boon 1,4 , Kim Vereecken 1 , Abena Serwaa Amoah 3,5 , Lucja A. Labuda 3,6,7 , Tandakha Ndiaye Die `ye 2 , Souleymane Mboup 2 , Maria Yazdanbakhsh 3 , Katja Polman 1 1 Department of Biomedical Sciences, Institute of Tropical Medicine, Antwerp, Belgium, 2 Laboratory of Bacteriology and Virology, Aristide Le Dantec Teaching Hospital, Dakar, Senegal, 3 Department of Parasitology, Leiden University Medical Center, Leiden, The Netherlands, 4 Laboratory of Biodiversity and Evolutionary Genomics, University of Leuven, Leuven, Belgium, 5 Department of Parasitology, Noguchi Memorial Institute for Medical Research, University of Ghana, Legon, Accra, Ghana, 6 Centre de Recherches Me ´dicales de Lambare ´ne ´ (CERMEL), Lambare ´ne ´, Gabon, 7 Institute of Tropical Medicine, University of Tu ¨ bingen, Tu ¨ bingen, Germany Abstract Background: In Africa, many areas are co-endemic for the two major Schistosoma species, S. mansoni and S. haematobium. Epidemiological studies have suggested that host immunological factors may play an important role in co-endemic areas. As yet, little is known about differences in host immune responses and possible immunological interactions between S. mansoni and S. haematobium in humans. The aim of this study was to analyze host cytokine responses to antigens from either species in a population from a co-endemic focus, and relate these to S. mansoni and S. haematobium infection. Methodology: Whole blood cytokine responses were investigated in a population in the north of Senegal (n = 200). Blood was stimulated for 72 h with schistosomal egg and adult worm antigens of either Schistosoma species. IL-10, IL-5, IFN-c, TNF-a, and IL-2 production was determined in culture supernatants. A multivariate (i.e. multi-response) approach was used to allow a joint analysis of all cytokines in relation to Schistosoma infection. Principal Findings: Schistosoma haematobium egg and worm antigens induced higher cytokine production, suggesting that S. haematobium may be more immunogenic than S. mansoni. However, both infections were strongly associated with similar, modified Th2 cytokine profiles. Conclusions/Significance: This study is the first to compare S. mansoni and S. haematobium cytokine responses in one population residing in a co-endemic area. These findings are in line with previous epidemiological studies that also suggested S. haematobium egg and worm stages to be more immunogenic than those of S. mansoni. Citation: Meurs L, Mbow M, Boon N, Vereecken K, Amoah AS, et al. (2014) Cytokine Responses to Schistosoma mansoni and Schistosoma haematobium in Relation to Infection in a Co-endemic Focus in Northern Senegal. PLoS Negl Trop Dis 8(8): e3080. doi:10.1371/journal.pntd.0003080 Editor: Mike Doenhoff, University of Nottingham, United Kingdom Received October 25, 2013; Accepted June 27, 2014; Published August 7, 2014 Copyright: ß 2014 Meurs et al. This is an open-access article distributed under the terms of the Creative Commons Attribution License, which permits unrestricted use, distribution, and reproduction in any medium, provided the original author and source are credited. Funding: This work was funded by the European Union’s sixth framework programme (INCO-CT-2006-032405, http://cordis.europa.eu/fp6/) and the Flemish Inter-University Council (VLADOC to NB, http://www.vliruos.be/en/). The funders had no role in study design, data collection and analysis, decision to publish, or preparation of the manuscript. Competing Interests: The authors have declared that no competing interests exist. * Email: [email protected] Introduction Schistosomiasis is a parasitic disease of major public health importance. Schistosoma mansoni and S. haematobium are the main human species. Both species are endemic in Africa, where their distributions show a great overlap [1]. Schistosomes are known to down-regulate host immune responses and to induce so- called modified Th2 responses. The exact phenotype of the induced response depends on a complex immunological ‘dialogue’ that involves cytokines and immune cells of Th2, but also Th1, Th17 and regulatory components of the immune system [2]. So far, little is known about differences in host immune responses to schistosomes and possible immunological interactions between S. mansoni and S. haematobium in humans. Yet, epidemiological studies have suggested that host immunological factors may play an important role in co-endemic areas. Interspecies differences in immunogenicity for example, may explain why infection-age curves and morbidity patterns differ between S. mansoni and S. haematobium. Also, immunological interspecies differences and/or immunological interactions be- tween S. mansoni and S. haematobium may explain differences in morbidity levels between single and mixed Schistosoma infections. Cheever et al. reported a more pronounced reduction of S. haematobium than S. mansoni worm loads with age [3]. Similarly, in a mixed focus in northern Senegal, we found the age-infection curve of S. haematobium to decline more steeply after adolescence than that of S. mansoni [4], indicating that protective immunity against S. haematobium may develop more rapidly. In addition, we found that mixed S. mansoni and S. haematobium infection as compared with single S. haematobium infection tended to decrease PLOS Neglected Tropical Diseases | www.plosntds.org 1 August 2014 | Volume 8 | Issue 8 | e3080

Welcome message from author
This document is posted to help you gain knowledge. Please leave a comment to let me know what you think about it! Share it to your friends and learn new things together.
Transcript

Cytokine Responses to Schistosoma mansoni andSchistosoma haematobium in Relation to Infection in aCo-endemic Focus in Northern SenegalLynn Meurs1*, Moustapha Mbow1,2,3, Nele Boon1,4, Kim Vereecken1, Abena Serwaa Amoah3,5,
Lucja A. Labuda3,6,7, Tandakha Ndiaye Dieye2, Souleymane Mboup2, Maria Yazdanbakhsh3,
Katja Polman1
1 Department of Biomedical Sciences, Institute of Tropical Medicine, Antwerp, Belgium, 2 Laboratory of Bacteriology and Virology, Aristide Le Dantec Teaching Hospital,
Dakar, Senegal, 3 Department of Parasitology, Leiden University Medical Center, Leiden, The Netherlands, 4 Laboratory of Biodiversity and Evolutionary Genomics,
University of Leuven, Leuven, Belgium, 5 Department of Parasitology, Noguchi Memorial Institute for Medical Research, University of Ghana, Legon, Accra, Ghana, 6 Centre
de Recherches Medicales de Lambarene (CERMEL), Lambarene, Gabon, 7 Institute of Tropical Medicine, University of Tubingen, Tubingen, Germany
Abstract
Background: In Africa, many areas are co-endemic for the two major Schistosoma species, S. mansoni and S. haematobium.Epidemiological studies have suggested that host immunological factors may play an important role in co-endemic areas.As yet, little is known about differences in host immune responses and possible immunological interactions between S.mansoni and S. haematobium in humans. The aim of this study was to analyze host cytokine responses to antigens fromeither species in a population from a co-endemic focus, and relate these to S. mansoni and S. haematobium infection.
Methodology: Whole blood cytokine responses were investigated in a population in the north of Senegal (n = 200). Bloodwas stimulated for 72 h with schistosomal egg and adult worm antigens of either Schistosoma species. IL-10, IL-5, IFN-c,TNF-a, and IL-2 production was determined in culture supernatants. A multivariate (i.e. multi-response) approach was usedto allow a joint analysis of all cytokines in relation to Schistosoma infection.
Principal Findings: Schistosoma haematobium egg and worm antigens induced higher cytokine production, suggestingthat S. haematobium may be more immunogenic than S. mansoni. However, both infections were strongly associated withsimilar, modified Th2 cytokine profiles.
Conclusions/Significance: This study is the first to compare S. mansoni and S. haematobium cytokine responses in onepopulation residing in a co-endemic area. These findings are in line with previous epidemiological studies that alsosuggested S. haematobium egg and worm stages to be more immunogenic than those of S. mansoni.
Citation: Meurs L, Mbow M, Boon N, Vereecken K, Amoah AS, et al. (2014) Cytokine Responses to Schistosoma mansoni and Schistosoma haematobium in Relationto Infection in a Co-endemic Focus in Northern Senegal. PLoS Negl Trop Dis 8(8): e3080. doi:10.1371/journal.pntd.0003080
Editor: Mike Doenhoff, University of Nottingham, United Kingdom
Received October 25, 2013; Accepted June 27, 2014; Published August 7, 2014
Copyright: � 2014 Meurs et al. This is an open-access article distributed under the terms of the Creative Commons Attribution License, which permitsunrestricted use, distribution, and reproduction in any medium, provided the original author and source are credited.
Funding: This work was funded by the European Union’s sixth framework programme (INCO-CT-2006-032405, http://cordis.europa.eu/fp6/) and the FlemishInter-University Council (VLADOC to NB, http://www.vliruos.be/en/). The funders had no role in study design, data collection and analysis, decision to publish, orpreparation of the manuscript.
Competing Interests: The authors have declared that no competing interests exist.
* Email: [email protected]
Introduction
Schistosomiasis is a parasitic disease of major public health
importance. Schistosoma mansoni and S. haematobium are the
main human species. Both species are endemic in Africa, where
their distributions show a great overlap [1]. Schistosomes are
known to down-regulate host immune responses and to induce so-
called modified Th2 responses. The exact phenotype of the
induced response depends on a complex immunological ‘dialogue’
that involves cytokines and immune cells of Th2, but also Th1,
Th17 and regulatory components of the immune system [2].
So far, little is known about differences in host immune
responses to schistosomes and possible immunological interactions
between S. mansoni and S. haematobium in humans. Yet,
epidemiological studies have suggested that host immunological
factors may play an important role in co-endemic areas.
Interspecies differences in immunogenicity for example, may
explain why infection-age curves and morbidity patterns differ
between S. mansoni and S. haematobium. Also, immunological
interspecies differences and/or immunological interactions be-
tween S. mansoni and S. haematobium may explain differences in
morbidity levels between single and mixed Schistosoma infections.
Cheever et al. reported a more pronounced reduction of S.haematobium than S. mansoni worm loads with age [3]. Similarly,
in a mixed focus in northern Senegal, we found the age-infection
curve of S. haematobium to decline more steeply after adolescence
than that of S. mansoni [4], indicating that protective immunity
against S. haematobium may develop more rapidly. In addition, we
found that mixed S. mansoni and S. haematobium infection as
compared with single S. haematobium infection tended to decrease
PLOS Neglected Tropical Diseases | www.plosntds.org 1 August 2014 | Volume 8 | Issue 8 | e3080

the risk of S. haematobium-specific urinary tract pathology [5].
This appeared mainly due to ectopically excreted, possible hybrid
eggs [6]. Others also found S. mansoni to affect S. haematobium-
specific morbidity and vice versa [7,8], indicating that the two
infections may have different effects on the egg-induced immune
responses that provoke morbidity.
The present study set out to compare Schistosoma-specific
cytokine responses induced by S. mansoni and S. haematobiumantigens, and to relate these to Schistosoma infection in a S.mansoni and S. haematobium co-endemic area. Schistosomainfection status (single and mixed) and infection intensities as well
as Schistosoma-specific cytokine responses were determined in
residents from a co-endemic focus in northern Senegal. A
multivariate (i.e. multi-response) approach was used to allow a
joint analysis of multiple cytokine responses (interleukin (IL)-10,
IL-5, interferon (IFN)-c, tumor necrosis factor (TNF)-a, and IL-2)
[9].
Materials and Methods
Ethics statementThis study was part of a larger investigation on the epidemi-
ology of schistosomiasis and innate immune responses (SCHIS-
TOINIR) for which approval was obtained from the review board
of the Institute of Tropical Medicine, the ethical committee of the
Antwerp University Hospital and ‘Le Comite National d’Ethique
de la Recherche en Sante’ in Dakar. Informed and written consent
was obtained from all participants prior to inclusion into the study.
For minors, informed and written consent was obtained from their
legal guardians.
All community members were offered praziquantel (40 mg/kg)
and mebendazole (500 mg) treatment after the study according to
WHO guidelines [10].
Study areaThis study was conducted in Ndieumeul and Diokhor Tack, two
neighboring communities on the Nouk Pomo peninsula in Lake
Guiers. Details on the study area have been described elsewhere
[4,5]. Between July 2009 and March 2010, parasitological data
were collected from 857 individuals [4]. A random subsample of
200 subjects was followed up immunologically. These subjects
were between 5 and 53 years of age. Individuals who had lived in
an urban area in the 5 years preceding the study (n = 7), had taken
praziquantel within the last year (n = 2), or had clinical signs of
malaria (recruited upon recovery), and pregnant women (n = 18)
were excluded from the immunological study.
ParasitologyTwo feces and two urine samples were collected from each
participant on consecutive days. Infection with Schistosoma spp.
was determined quantitatively (by Kato-Katz and urine filtration),
and infection with soil-transmitted helminths (STHs) Ascarislumbricoides, Trichuris trichiura and hookworm, was assessed
qualitatively (by Kato-Katz), as described elsewhere [4]. Aliquots
of the first fecal samples were preserved in ethanol to confirm
microscopy results by multiplex PCR (A. lumbricoides, hookworm
and Strongyloides stercoralis) (n = 198) [11]. Infection with
Plasmodium was determined by Giemsa-stained thick blood
smears.
Whole blood cultureFive hours after venipuncture, heparinized blood was diluted
1:4 in RPMI 1640 (Invitrogen) supplemented with 100 U/ml
penicillin, 100 mg/ml streptomycin, 1 mM pyruvate and 2 mM
glutamate (all from Sigma). This mixture (200 ml sample volume)
was incubated in 96-well round bottom plates (Nunc) at 37uCunder 5% CO2 atmosphere for 72 h, together with one of four
schistosomal water-soluble antigen preparations at a final concen-
tration of 10 mg protein/ml:
1) Schistosoma egg antigen (SEA) derived from S. mansoni(SEAm);
2) SEA from S. haematobium (SEAh);
3) Adult worm antigen (AWA) from S. mansoni (AWAm); or
4) AWA from S. haematobium (AWAh).
Medium (see above) without stimulus was used as a negative
control. After harvesting, supernatants were stored at 280uC.
Schistosoma eggs and adult worms were isolated from either S.mansoni- or S. haematobium-infected golden hamsters. SEAm,
SEAh, AWAm and AWAh were prepared from this material using
identical procedures. In brief, eggs or worms were freeze-dried and
then homogenized in phosphate-buffered saline (PBS) with 10% n-
octyl-b-D-glucopyranoside. Subsequently, this mixture was soni-
cated, frozen, thawed and washed with PBS. The resulting pellet
was dialyzed and filter-sterilized. While AWAm and AWAh
batches were lipopolysaccharide (LPS)-free, SEAm and SEAh
antigens contained equivalent amounts of LPS (final concentra-
tions of 1–5 ng/ml).
Cytokine measurementIL-10, IL-5, IFN-c, TNF-a, and IL-2 in culture supernatants
were analyzed simultaneously using custom Luminex cytokine kits
(Invitrogen) according to the manufacturer’s instructions. Samples
with concentrations below the detection limit were assigned values
corresponding to half of the lowest value detected. Lowest values
detected were 0.063 pg/ml for IL-10, 0.044 pg/ml for IL-5,
0.090 pg/ml for IFN-c, 0.051 pg/ml for TNF-a, and 0.063 pg/ml
for IL-2.
Statistical analysisResults were considered significant when the p-value was ,
0.05. The Pearson Chi-square test was used to determine the
association between infection status on the one hand, and age and
Author Summary
In the developing world, over 207 million people areinfected with blood-dwelling parasitic Schistosoma worms.Schistosoma haematobium and S. mansoni are the mostwidespread species. In Africa, they often occur together inthe same area, with many people carrying both species.Yet, little is known about the differences in immuneresponse that the human host develops against these twospecies. It is also unknown whether the presence of onespecies may affect the immune response to the other. Wehere investigated 200 people from an area in the north ofSenegal where both species occur. They were examinedfor Schistosoma infections, as well as for immune respons-es to the two species. We observed that both infectionswere characterized by very similar cytokine responses.However, S. haematobium antigens induced higher levelsof cytokines than S. mansoni. This suggests that S.haematobium may give rise to stronger immune respons-es, and may help to explain differences between the twomost important Schistosoma species regarding the occur-rence of infection and morbidity.
Cytokine Responses in Co-endemic Schistosomiasis
PLOS Neglected Tropical Diseases | www.plosntds.org 2 August 2014 | Volume 8 | Issue 8 | e3080
gender on the other. Nonparametric techniques were chosen
because cytokine concentrations were not normally distributed.
Univariate statistics were used to compare single antigen-induced
responses within individuals (IBM SPSS 21.0). McNemar’s tests
were used to compare cytokine response frequencies between S.mansoni and S. haematobium antigen-induced responses within
individuals (e.g. SEAm- versus SEAh-induced responses). Similar-
ly, Wilcoxon Signed Rank tests were used to compare cytokine
response levels between S. mansoni and S. haematobium antigen-
induced responses within individuals. Multivariate (i.e. multi-
response) statistics were used to collectively analyze multiple
cytokine responses – i.e. cytokine profiles - in the study population,
and to investigate interrelationships between these responses [9].
We chose the nonparametric technique nonmetric multidimen-
sional scaling (nMDS; in R with the ‘Vegan’ package [12,13]).
This is a variant of the parametric principal component analysis
(PCA), but with fewer assumptions about the nature of the data
and the interrelationship of the variables [14]. This is important
because cytokine response levels were not normally distributed,
even after log-transformation. Also, levels of different cytokines
typically correlate with one another. Upon computation of the
cytokine profiles, associations between these cytokine profiles and
Schistosoma infection were assessed. The approach is illustrated in
Supporting Information S1. Before nMDS, cytokine concentra-
tions in the negative control were subtracted from those in
antigen-stimulated samples to obtain net cytokine responses.
Negative values were set to zero. Net cytokine responses were
normalized by log(base 10)-transformation after adding 1 pg/ml to
allow for zeroes. Schistosoma infection intensities were normalized
after adding half of the detection limit (i.e. 5 eggs per gram of feces
and 0.5 eggs per 10 ml of urine for S. mansoni and S.haematobium, respectively). One nMDS was performed for each
of the four Schistosoma-specific whole blood stimulations (either
SEAm, SEAh, AWAm or AWAh) using the ‘metaMDS’ function
[13]. Each nMDS was repeated several times to assess the
robustness of the resulting pattern [14]. The Euclidean dissimi-
larity index was used [13], and cytokine profiles - i.e. the matrix of
IL-10, IL-5, IFN-c, TNF-a, and IL-2 - were plotted in three
dimensions (3D) to adequately represent the variation in the data
[14]. Afterwards, gradients of the separate cytokine responses, on
which the nMDS was based, were fitted using the ‘envfit’ function
[13]. The same function was used to fit infection intensities onto
each 3D nMDS, and to statistically test associations of antigen-
induced cytokine profiles with Schistosoma infection intensity or
infection status, i.e. uninfected, single S. mansoni, single S.haematobium, versus mixed S. mansoni and S. haematobium
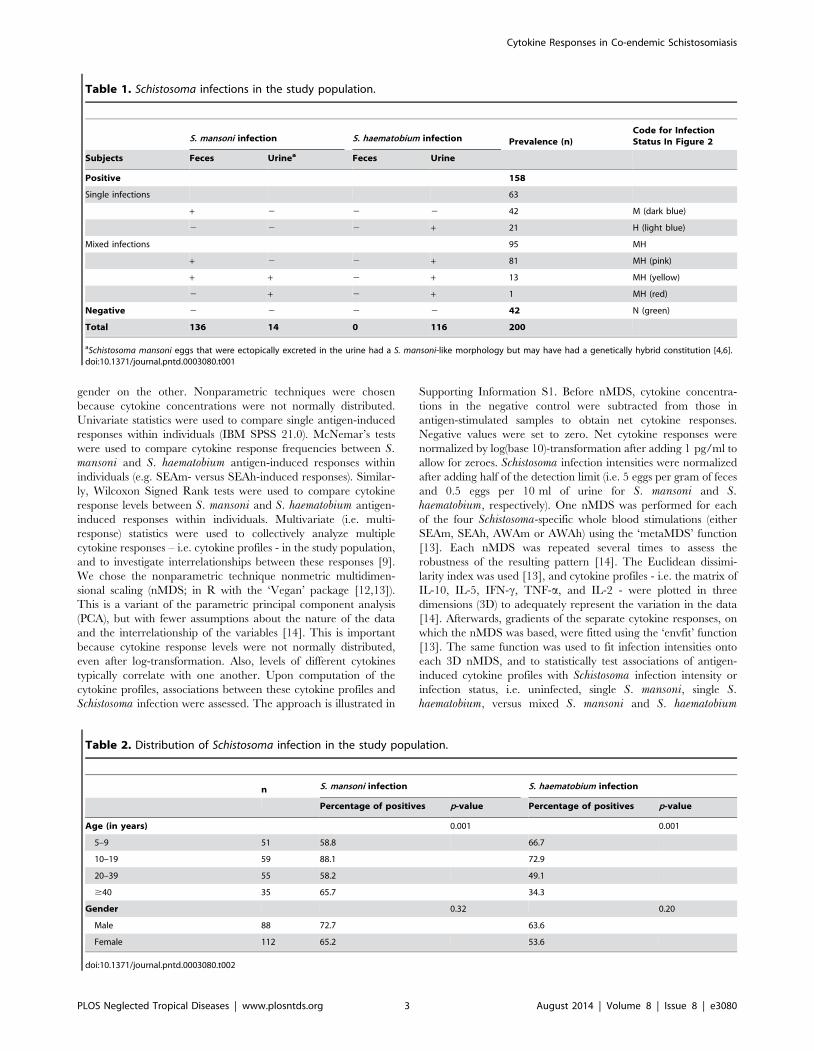
Table 1. Schistosoma infections in the study population.
S. mansoni infection S. haematobium infection Prevalence (n)Code for InfectionStatus In Figure 2
Subjects Feces Urinea Feces Urine
Positive 158
Single infections 63
+ 2 2 2 42 M (dark blue)
2 2 2 + 21 H (light blue)
Mixed infections 95 MH
+ 2 2 + 81 MH (pink)
+ + 2 + 13 MH (yellow)
2 + 2 + 1 MH (red)
Negative 2 2 2 2 42 N (green)
Total 136 14 0 116 200
aSchistosoma mansoni eggs that were ectopically excreted in the urine had a S. mansoni-like morphology but may have had a genetically hybrid constitution [4,6].doi:10.1371/journal.pntd.0003080.t001
Table 2. Distribution of Schistosoma infection in the study population.
n S. mansoni infection S. haematobium infection
Percentage of positives p-value Percentage of positives p-value
Age (in years) 0.001 0.001
5–9 51 58.8 66.7
10–19 59 88.1 72.9
20–39 55 58.2 49.1
$40 35 65.7 34.3
Gender 0.32 0.20
Male 88 72.7 63.6
Female 112 65.2 53.6
doi:10.1371/journal.pntd.0003080.t002
Cytokine Responses in Co-endemic Schistosomiasis
PLOS Neglected Tropical Diseases | www.plosntds.org 3 August 2014 | Volume 8 | Issue 8 | e3080

Cytokine Responses in Co-endemic Schistosomiasis
PLOS Neglected Tropical Diseases | www.plosntds.org 4 August 2014 | Volume 8 | Issue 8 | e3080
infection. The ‘ordiellipse’ function was used to fit average group
scores - with their 95% confidence intervals (CIs) - for different
infection statuses [13]. In contrast to individual S. mansoni- and S.haematobium-induced cytokine responses which can be compared
quantitatively within individuals as described above (univariate
statistics), qualitative differences between S. mansoni- and S.haematobium-induced cytokine profiles could only be assessed
visually by nMDS, not by formal statistical testing.
Results
Characteristics of the study populationThe study population consisted of 88 males and 112 females
with a median age of 16 (range 5–53) years. Malaria and STHs T.trichiura and hookworm were absent in this population, and A.lumbricoides and S. stercoralis rare (n = 3 and 2, respectively, with
100% concordance between microscopy and PCR). In contrast,
137 (69%) subjects were infected with S. mansoni, and 116 (58%)
with S. haematobium. Sixty percent (95/158) of all Schistosomainfections were mixed S. mansoni and S. haematobium infections
(Table 1). The distributions of S. mansoni and S. haematobiuminfections in the study population according to age and gender are
shown in Table 2. Both Schistosoma infections peaked in
adolescents (10 to 19 year-olds), but gender differences were not
statistically significant. Epidemiological patterns of infection have
been described in more detail elsewhere [4].
General cytokine profilesInsight into the different antigen-induced cytokine responses
relative to one another was obtained by nMDS. Figure 1 and 2
show the variation in multivariate cytokine responses in the study
population, with dots representing individuals. Distances between
dots approximate inter-individual dissimilarities in cytokine
responses with stress values (i.e. discrepancies) of 0.051 for SEAm,
0.041 for SEAh, 0.058 for AWAm, and 0.061 for AWAh. Red
arrows indicate increasing gradients of IL-10, IL-5, IFN-c, TNF-aand IL-2 responses, respectively. The level of a cytokine response
increases in the direction of the corresponding arrow (see also
Supporting Information S1). The length of a cytokine arrow
indicates the goodness of fit of that arrow (or cytokine gradient).
The nMDS outcomes for the first axis (nMDS1) show that for
each of the four antigen stimulations, all cytokine responses point to
the left. Individuals plotted on the left produced consistently higher
levels of all cytokines measured than those on the right. In other
words, nMDS1 indicates a gradient of high (left) to low (right)
cytokine responses. In analogy, the second axis (nMDS2), indicates
a gradient of Th1-like (IFN-c and TNF-a, top) to Th2-like (IL-5,
bottom) phenotypes for each of the antigen stimulations. In contrast
to SEA-induced IL-5, AWA-induced IL-5 was not accompanied by
production of IL-10. IL-2 levels increased with Th1 cytokines,
except for SEAm. The third axis (nMDS3) indicates a gradient of
TNF-a and IL-2 (left) to IFN-c and IL-10 (right).
In contrast to antigen-induced cytokines, spontaneously induced
levels of cytokines in the control (medium only), did not show
significant gradients, except for IL-5 on the third nMDS axis
(stress = 0.11, data not shown).
Comparison between S. mansoni- and S. haematobium-induced cytokine responses and cytokine profiles
Figure 1 and 2 indicate that S. mansoni and S. haematobiumantigens induced very similar cytokine profiles; cytokine profiles
differed more between adult (AWA) and egg (SEA) life stages of the
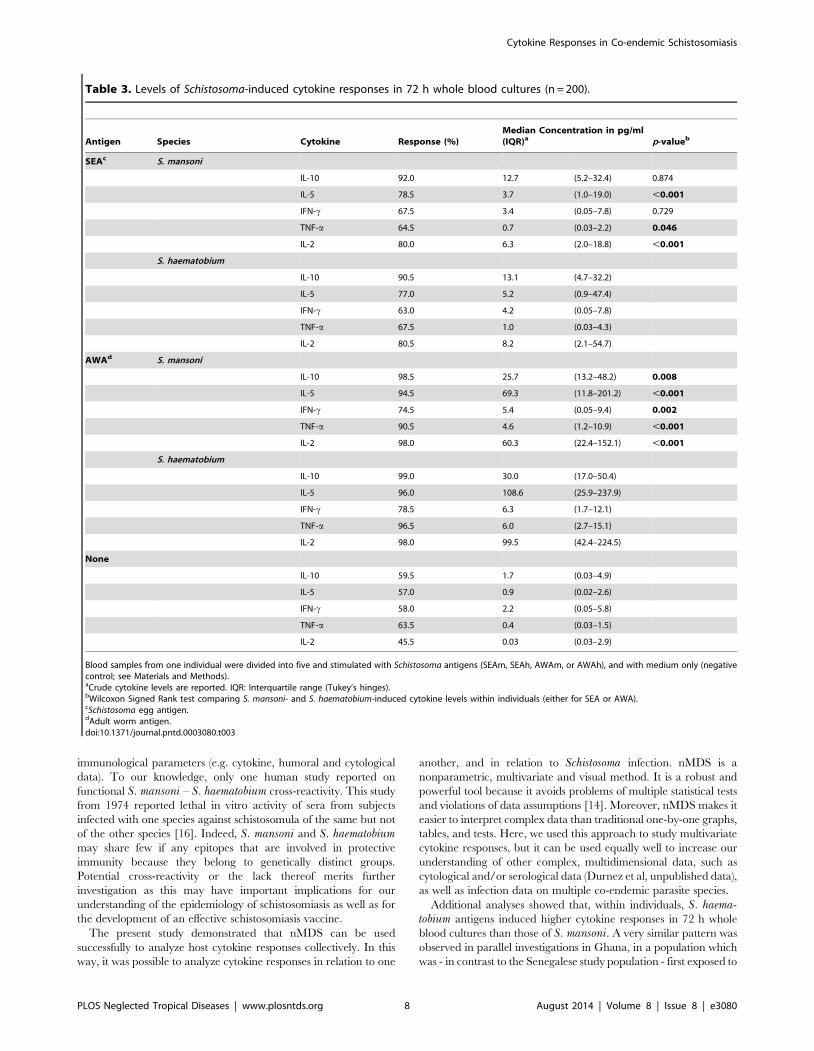
parasite than between the two Schistosoma species. Within individuals,
S. haematobium-induced cytokine response levels were higher than
those induced by S. mansoni (Table 3). This was statistically significant
for all SEA- and AWA-induced cytokine responses that were
measured, except for SEA-induced IFN-c and IL-10.
Relation between cytokine profiles and Schistosomainfection intensity
Subsequently, we related the above-described variation in
cytokine responses in the study population (i.e. plotted cytokine
profiles) to infection intensity. Table 4 shows that all associations
between Schistosoma antigen-induced cytokine profiles and infec-
tion intensity were statistically significant. In Figure 1, the
direction of the black arrows represents the increasing gradients
of S. mansoni and S. haematobium infection intensity, respectively
(see also Supporting Information S1). On the first axis, which
indicates cytokine response levels (see above), these arrows
generally point into the opposite direction of cytokine responses.
This indicates that people with elevated Schistosoma infection
intensities are more likely to have lower cytokine responses, and
vice versa. On the second axis, which indicates the Th1 versus
Th2 response phenotype (see above), infection intensity generally
increases with IL-5 and decreases with Th1 cytokines TNF-a,
IFN-c, and IL-2 (except for SEAm-induced IL-5 which decreases
with increasing infection intensity). Briefly, as infection intensity
increased, cytokine response levels decreased and the Th2
phenotype became more pronounced. The association between
infection intensity and reduced cytokine responsiveness was more
pronounced for SEA than for AWA stimulation. Schistosomainfection intensity increased with AWA-induced IL-5, but
decreased with SEA-induced IL-5 levels, indicating that people
with higher infection intensities produced more of a Th2-like
response against AWA and more of a suppressive response (i.e.
with low cytokine response levels) against SEA than people with
lower infection intensities, and vice versa.
We did not observe differences in induced cytokine profiles
between the two Schistosoma infections. Associations between
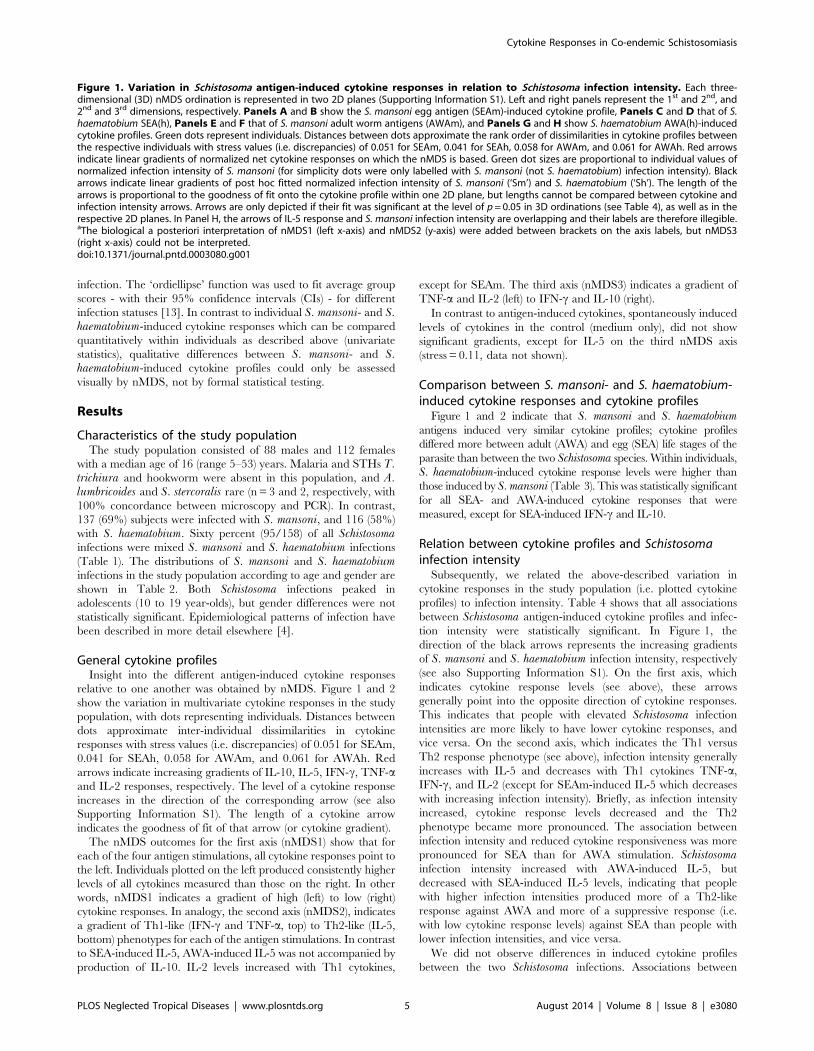
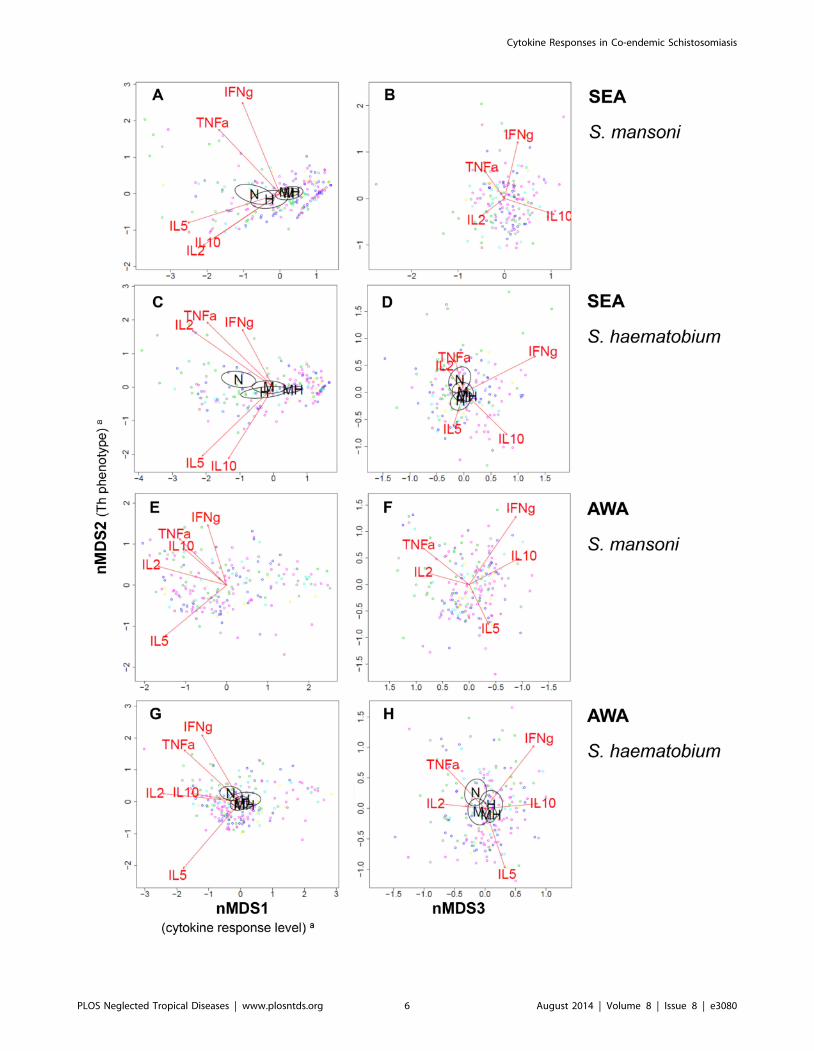
Figure 1. Variation in Schistosoma antigen-induced cytokine responses in relation to Schistosoma infection intensity. Each three-dimensional (3D) nMDS ordination is represented in two 2D planes (Supporting Information S1). Left and right panels represent the 1st and 2nd, and2nd and 3rd dimensions, respectively. Panels A and B show the S. mansoni egg antigen (SEAm)-induced cytokine profile, Panels C and D that of S.haematobium SEA(h), Panels E and F that of S. mansoni adult worm antigens (AWAm), and Panels G and H show S. haematobium AWA(h)-inducedcytokine profiles. Green dots represent individuals. Distances between dots approximate the rank order of dissimilarities in cytokine profiles betweenthe respective individuals with stress values (i.e. discrepancies) of 0.051 for SEAm, 0.041 for SEAh, 0.058 for AWAm, and 0.061 for AWAh. Red arrowsindicate linear gradients of normalized net cytokine responses on which the nMDS is based. Green dot sizes are proportional to individual values ofnormalized infection intensity of S. mansoni (for simplicity dots were only labelled with S. mansoni (not S. haematobium) infection intensity). Blackarrows indicate linear gradients of post hoc fitted normalized infection intensity of S. mansoni (‘Sm’) and S. haematobium (‘Sh’). The length of thearrows is proportional to the goodness of fit onto the cytokine profile within one 2D plane, but lengths cannot be compared between cytokine andinfection intensity arrows. Arrows are only depicted if their fit was significant at the level of p = 0.05 in 3D ordinations (see Table 4), as well as in therespective 2D planes. In Panel H, the arrows of IL-5 response and S. mansoni infection intensity are overlapping and their labels are therefore illegible.aThe biological a posteriori interpretation of nMDS1 (left x-axis) and nMDS2 (y-axis) were added between brackets on the axis labels, but nMDS3(right x-axis) could not be interpreted.doi:10.1371/journal.pntd.0003080.g001
Cytokine Responses in Co-endemic Schistosomiasis
PLOS Neglected Tropical Diseases | www.plosntds.org 5 August 2014 | Volume 8 | Issue 8 | e3080
Cytokine Responses in Co-endemic Schistosomiasis
PLOS Neglected Tropical Diseases | www.plosntds.org 6 August 2014 | Volume 8 | Issue 8 | e3080
cytokine profiles and infection intensity were comparable for S.mansoni and S. haematobium infections (Figure 1). Table 4 shows
significant correlations between cytokine profiles and Schistosomainfection intensity for homologous combinations (i.e. infection
intensity and antigen stimulation of the same species) as well as for
heterologous combinations (i.e. infection intensity of one and
antigen stimulation of the other species).
Relation between cytokine profiles and infection status(mixed versus single infections)
Schistosoma antigen-induced cytokine profiles were significantly
associated with Schistosoma infection status, except upon stimu-
lation with AWAm (Table 4). Figure 2 shows how antigen-
induced cytokine profiles differed according to infection status
(except for AWAm, which was not significantly associated with
infection status), with 95% CI ellipsoids indicating the average
nMDS scores per infection group: uninfected (‘N’), single S.mansoni (‘M’), single S. haematobium (‘H’), versus mixed (‘MH’)
Schistosoma infection group. In analogy with Figure 1, uninfected
individuals had higher cytokine responses than Schistosoma-
infected subjects, and their cytokine profiles were skewed more
towards the Th1 phenotype. On the whole, there was a gradient in
cytokine profiles from uninfected individuals, to people with single
and then mixed Schistosoma infections (Figure 2) and these profiles
were in the same direction as the gradient of infection intensity
(Figure 1). In other words, people with low cytokine responses of
the Th2 phenotype tended to have both mixed and heavier
infections, people with strong Th1 responses tended to be
uninfected, and those with an intermediate cytokine profile tended
to have both single and lighter Schistosoma infections.
For the SEAm-induced cytokine profile, there was a clear
difference (i.e. separation between ellipsoids) between S. mansoni-infected individuals (with either single or mixed S. mansoni), and
those without S. mansoni (no Schistosoma infection, or single S.haematobium infection; Figure 2A). There were no significant
differences in this cytokine profile between single and mixed S.mansoni infections, or between uninfected individuals and those
with single S. haematobium infections. This indicates that, in
contrast to S. mansoni, S. haematobium infection status was not
associated with SEAm-induced cytokine profiles. Schistosomahaematobium-induced cytokine profiles on the other hand, showed
similar relationships with S. mansoni as well as with S.haematobium infection status. Cytokine profiles of people with
single and mixed infections differed significantly from those of
uninfected people, and cytokine profiles did not appear to differ
between single S. mansoni and single S. haematobium infections.
Discussion
The objective of this study was to compare cytokine responses
induced by S. mansoni and S. haematobium antigens, and to relate
these to Schistosoma infection in a S. mansoni and S. haematobiumco-endemic area. We showed that Schistosoma infection intensity
was significantly associated with Schistosoma antigen-induced
cytokine profiles and that it may explain up to 18% of the
variation in cytokine responses observed in this population. As
Schistosoma infection intensity increased, cytokine responses
decreased and the Th2 phenotype became more pronounced.
This was exemplified by relatively higher IL-5 (and IL-10) and
relatively lower IFN-c, TNF-a and IL-2 levels. Lightly infected
and uninfected subjects on the other hand, had elevated cytokine
responses, with a Th1 phenotype. These patterns are consistent
with the modified Th2 response characteristic for schistosomiasis
[2]. nMDS also indicated that the association between infection
and the Th2 phenotype was more pronounced for AWA, while
that between infection and (reduced) cytokine responsiveness was
more pronounced for SEA. These observations fit with a previous
study by Joseph et al. describing similar immunological differences
between Schistosoma adult worm and egg life stages in a
population from a S. mansoni mono-endemic area, using more
conventional analyses [15].
Secondly, we demonstrated that increased Schistosoma infection
intensity and mixed (as compared to single) infections were
associated with similar, modified Th2, cytokine profiles. This is
probably due to the fact that subjects with mixed infections were
more likely to have higher infection intensities than those with single
infections [4]. Also, similar, modified Th2, cytokine profiles were
observed for both S. mansoni and S. haematobium infection
intensity, whether blood was stimulated with antigens from the
homo- or heterologous species. This may be indicative of
immunological cross-reactivity between species. For S. mansoni-induced cytokine profiles however, this was unlikely, because
profiles did not differ between single and mixed S. mansoni infection
groups. While S. haematobium-induced cytokine profiles did differ
between single and mixed S. haematobium infection groups, we
could not determine whether these differences were due to mixed
infection per se, or to higher S. haematobium infection intensity in
mixed as compared to single infections. Other potentially
confounding factors such as age may have been involved as well
[4], and future studies should be performed to assess their respective
roles in determining cytokine responses. To obtain more evidence
on the existence of cross-reactivity between the two major human
Schistosoma species, it is important to compare immune responses
between different co- and mono-endemic areas, using different
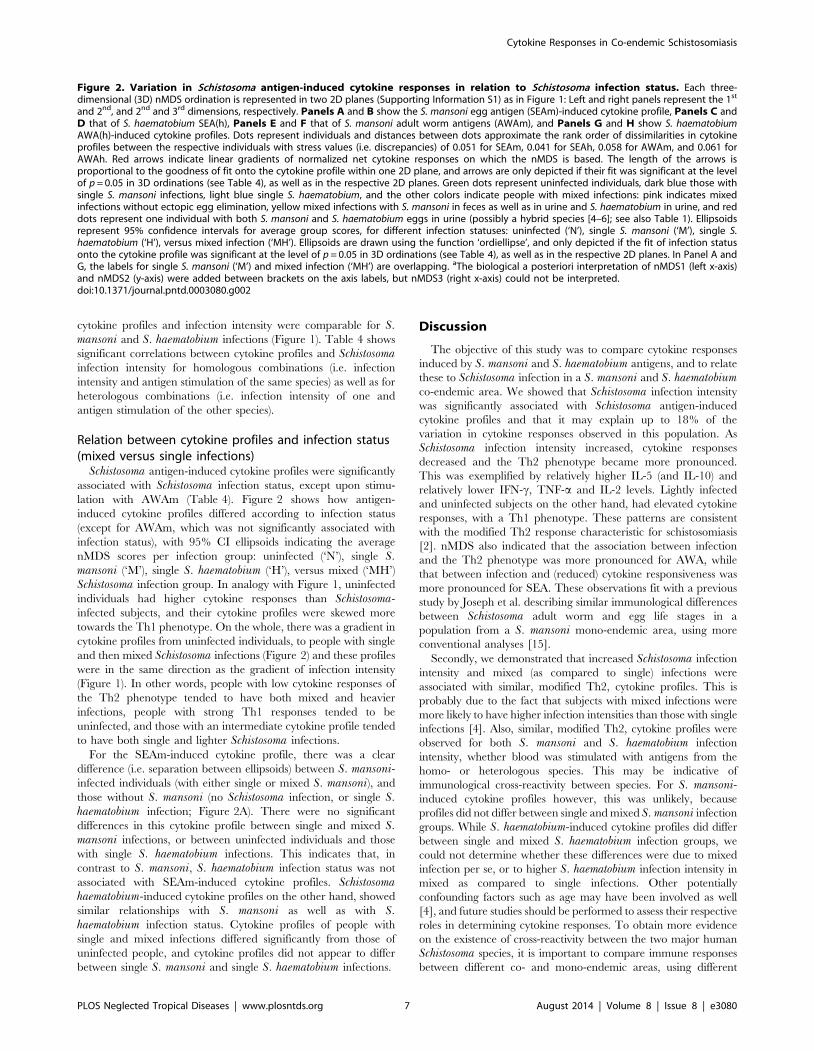
Figure 2. Variation in Schistosoma antigen-induced cytokine responses in relation to Schistosoma infection status. Each three-dimensional (3D) nMDS ordination is represented in two 2D planes (Supporting Information S1) as in Figure 1: Left and right panels represent the 1st
and 2nd, and 2nd and 3rd dimensions, respectively. Panels A and B show the S. mansoni egg antigen (SEAm)-induced cytokine profile, Panels C andD that of S. haematobium SEA(h), Panels E and F that of S. mansoni adult worm antigens (AWAm), and Panels G and H show S. haematobiumAWA(h)-induced cytokine profiles. Dots represent individuals and distances between dots approximate the rank order of dissimilarities in cytokineprofiles between the respective individuals with stress values (i.e. discrepancies) of 0.051 for SEAm, 0.041 for SEAh, 0.058 for AWAm, and 0.061 forAWAh. Red arrows indicate linear gradients of normalized net cytokine responses on which the nMDS is based. The length of the arrows isproportional to the goodness of fit onto the cytokine profile within one 2D plane, and arrows are only depicted if their fit was significant at the levelof p = 0.05 in 3D ordinations (see Table 4), as well as in the respective 2D planes. Green dots represent uninfected individuals, dark blue those withsingle S. mansoni infections, light blue single S. haematobium, and the other colors indicate people with mixed infections: pink indicates mixedinfections without ectopic egg elimination, yellow mixed infections with S. mansoni in feces as well as in urine and S. haematobium in urine, and reddots represent one individual with both S. mansoni and S. haematobium eggs in urine (possibly a hybrid species [4–6]; see also Table 1). Ellipsoidsrepresent 95% confidence intervals for average group scores, for different infection statuses: uninfected (‘N’), single S. mansoni (‘M’), single S.haematobium (‘H’), versus mixed infection (‘MH’). Ellipsoids are drawn using the function ‘ordiellipse’, and only depicted if the fit of infection statusonto the cytokine profile was significant at the level of p = 0.05 in 3D ordinations (see Table 4), as well as in the respective 2D planes. In Panel A andG, the labels for single S. mansoni (‘M’) and mixed infection (‘MH’) are overlapping. aThe biological a posteriori interpretation of nMDS1 (left x-axis)and nMDS2 (y-axis) were added between brackets on the axis labels, but nMDS3 (right x-axis) could not be interpreted.doi:10.1371/journal.pntd.0003080.g002
Cytokine Responses in Co-endemic Schistosomiasis
PLOS Neglected Tropical Diseases | www.plosntds.org 7 August 2014 | Volume 8 | Issue 8 | e3080
immunological parameters (e.g. cytokine, humoral and cytological
data). To our knowledge, only one human study reported on
functional S. mansoni – S. haematobium cross-reactivity. This study
from 1974 reported lethal in vitro activity of sera from subjects
infected with one species against schistosomula of the same but not
of the other species [16]. Indeed, S. mansoni and S. haematobiummay share few if any epitopes that are involved in protective
immunity because they belong to genetically distinct groups.
Potential cross-reactivity or the lack thereof merits further
investigation as this may have important implications for our
understanding of the epidemiology of schistosomiasis as well as for
the development of an effective schistosomiasis vaccine.
The present study demonstrated that nMDS can be used
successfully to analyze host cytokine responses collectively. In this
way, it was possible to analyze cytokine responses in relation to one
another, and in relation to Schistosoma infection. nMDS is a
nonparametric, multivariate and visual method. It is a robust and
powerful tool because it avoids problems of multiple statistical tests
and violations of data assumptions [14]. Moreover, nMDS makes it
easier to interpret complex data than traditional one-by-one graphs,
tables, and tests. Here, we used this approach to study multivariate
cytokine responses, but it can be used equally well to increase our
understanding of other complex, multidimensional data, such as
cytological and/or serological data (Durnez et al, unpublished data),
as well as infection data on multiple co-endemic parasite species.
Additional analyses showed that, within individuals, S. haema-tobium antigens induced higher cytokine responses in 72 h whole
blood cultures than those of S. mansoni. A very similar pattern was
observed in parallel investigations in Ghana, in a population which
was - in contrast to the Senegalese study population - first exposed to
Table 3. Levels of Schistosoma-induced cytokine responses in 72 h whole blood cultures (n = 200).
Antigen Species Cytokine Response (%)Median Concentration in pg/ml(IQR)a p-valueb
SEAc S. mansoni
IL-10 92.0 12.7 (5.2–32.4) 0.874
IL-5 78.5 3.7 (1.0–19.0) ,0.001
IFN-c 67.5 3.4 (0.05–7.8) 0.729
TNF-a 64.5 0.7 (0.03–2.2) 0.046
IL-2 80.0 6.3 (2.0–18.8) ,0.001
S. haematobium
IL-10 90.5 13.1 (4.7–32.2)
IL-5 77.0 5.2 (0.9–47.4)
IFN-c 63.0 4.2 (0.05–7.8)
TNF-a 67.5 1.0 (0.03–4.3)
IL-2 80.5 8.2 (2.1–54.7)
AWAd S. mansoni
IL-10 98.5 25.7 (13.2–48.2) 0.008
IL-5 94.5 69.3 (11.8–201.2) ,0.001
IFN-c 74.5 5.4 (0.05–9.4) 0.002
TNF-a 90.5 4.6 (1.2–10.9) ,0.001
IL-2 98.0 60.3 (22.4–152.1) ,0.001
S. haematobium
IL-10 99.0 30.0 (17.0–50.4)
IL-5 96.0 108.6 (25.9–237.9)
IFN-c 78.5 6.3 (1.7–12.1)
TNF-a 96.5 6.0 (2.7–15.1)
IL-2 98.0 99.5 (42.4–224.5)
None
IL-10 59.5 1.7 (0.03–4.9)
IL-5 57.0 0.9 (0.02–2.6)
IFN-c 58.0 2.2 (0.05–5.8)
TNF-a 63.5 0.4 (0.03–1.5)
IL-2 45.5 0.03 (0.03–2.9)
Blood samples from one individual were divided into five and stimulated with Schistosoma antigens (SEAm, SEAh, AWAm, or AWAh), and with medium only (negativecontrol; see Materials and Methods).aCrude cytokine levels are reported. IQR: Interquartile range (Tukey’s hinges).bWilcoxon Signed Rank test comparing S. mansoni- and S. haematobium-induced cytokine levels within individuals (either for SEA or AWA).cSchistosoma egg antigen.dAdult worm antigen.doi:10.1371/journal.pntd.0003080.t003
Cytokine Responses in Co-endemic Schistosomiasis
PLOS Neglected Tropical Diseases | www.plosntds.org 8 August 2014 | Volume 8 | Issue 8 | e3080

S. haematobium and then to both S. mansoni and S. haematobium,
and with lower prevalences of S. mansoni and higher prevalences of
S. haematobium (unpublished data, A.S. Amoah et al, and ref [4]).
This suggests that this finding does not depend on the level of
transmission or on exposure history, and that the two Schistosomaspecies may differ in their immunogenicity. This hypothesis is in line
with observations from Van Remoortere et al. who found S.mansoni to induce mainly IgM antibodies – which are thought to
inhibit protective host immune responses [17] – while S.haematobium induced both IgM and IgG antibodies against shared
carbohydrate epitopes [18]. It is therefore tempting to speculate that
lower cytokine response levels may prevent Ig class switching from
IgM to IgG for these epitopes in S. mansoni infection, while stronger
cytokine responses may promote class switching in S. haematobiuminfection. Alternatively, differences in their biochemical composi-
tion may underlie interspecies differences in both immunogenicity
and humoral immune responses. These two immunological
interspecies differences may also have contributed to earlier
epidemiological findings. Several studies observed a steeper decline
of the age-infection curve of S. haematobium as compared to S.mansoni after adolescence, indicating that protective immunity
against S. haematobium might develop more rapidly [3,4]. Secondly,
higher levels of S. haematobium- as compared to S. mansoni-specific
morbidity have been observed in co-endemic populations [5,7,8],
suggesting that the immune responses provoked by S. haematobiumeggs might be more pathogenic. It should be noted however, that
other factors may also explain these two epidemiological observa-
tions. For example, S. mansoni and S. haematobium eggs
accumulate in different organs, i.e. the liver and the urinary tract,
respectively, and these differences in anatomical context may also
explain the differences in the extent of morbidity between the two
species. More research is necessary to investigate the above-
mentioned immunological interspecies differences and their impli-
cations for epidemiological patterns of infection and morbidity in
more detail.
ConclusionIn conclusion, this is the first study to comprehensively
investigate S. mansoni- and S. haematobium-induced cytokine
responses in a S. mansoni and S. haematobium co-endemic area,
and to relate these cytokine responses to Schistosoma infection.
The present study demonstrates that nMDS can be used
successfully as a tool for the joint analysis of multiple cytokine
responses in relation to Schistosoma infection. We showed strong
associations between Schistosoma infection and Schistosoma-
induced cytokine profiles, and provided a first insight into
potential differences and interactions between human S. mansoniand S. haematobium infections. This knowledge will contribute to
an improved understanding of the mechanisms underlying
Schistosoma infection and morbidity in co-endemic populations.
Supporting Information
Supporting information S1 Schematic representation ofnonmetric multidimensional scaling.
(DOCX)
Acknowledgments
We gratefully thank the population of Ndieumeul and Diokhor Tack and
the village chiefs, Daoure Mbaye and Daouda Pene, for their hospitality
and participation in this study. This study would not have been possible
without the field workers in Richard Toll, Abdoulaye Yague, Mankeur
Diop, Moussa Wade and Ngary Sy, who assisted in the sample collection
and microscopic analysis. We would also like to thank the medical and
technical staff of the Health Centre in Richard Toll for their support,
Yvonne Kruize for providing the immunologic stimuli and preparatory
work, Rogier Achterberg, Mareen Datema and Churnalisa Doran for the
cytokine measurements in Leiden, Pierre Legendre from the University of
Montreal and Vincent Sluydts from Antwerp for their useful advice on
multivariate analyses, as well as Lies Durnez from Antwerp for critically
reviewing the statistical methods used. In addition, we would like to thank
one of the reviewers who made important contributions to our manuscript
in two Review rounds.
Author Contributions
Conceived and designed the experiments: MY KP. Performed the
experiments: LM MM KV ASA LAL. Analyzed the data: LM KP NB.
Contributed reagents/materials/analysis tools: TND SM MY KP. Wrote
the paper: LM KP.
Table 4. Association between Schistosoma infection and Schistosoma antigen-induced cytokine profiles.
Infection Antigen-induced cytokine profile
SEAm SEAh AWAm AWAh
S. mansoni infection intensity
R2 0.14 0.17 0.10 0.13
p-value 0.001 0.001 0.001 0.001
S. haematobium infection intensity
R2 0.05 0.18 0.07 0.15
p-value 0.02 0.001 0.003 0.001
Infection Status
R2 0.09 0.18 0.02 0.04
p-value 0.001 0.001 0.2 0.01
Figure 1 shows the fit of infection intensity and Figure 2 that of infection status (uninfected, single S. mansoni, single S. haematobium, versus mixed infections) ontoeach of the four Schistosoma antigen-induced cytokine profiles (either SEAm, SEAh, AWAm or AWAh), obtained by the ‘metaMDS’ and ‘envfit’ functions (see alsoSupporting Information S1) [12,13]. Here, the goodness of these fits, i.e. squared correlation coefficients (R2), are shown. The statistical significance was assessed usingpermutation tests (n = 999), and presented p-values are approximations.doi:10.1371/journal.pntd.0003080.t004
Cytokine Responses in Co-endemic Schistosomiasis
PLOS Neglected Tropical Diseases | www.plosntds.org 9 August 2014 | Volume 8 | Issue 8 | e3080
References
1. Gryseels B, Polman K, Clerinx J, Kestens L (2006) Human schistosomiasis.
Lancet 368: 1106–1118.2. Allen JE, Maizels RM (2011) Diversity and dialogue in immunity to helminths.
Nat Rev Immunol 11: 375–388.3. Cheever AW, Kamel IA, Elwi AM, Mosimann JE, Danner R (1977) Schistosoma
mansoni and S. haematobium infections in Egypt. II. Quantitative parasitological
findings at necropsy. Am J Trop Med Hyg 26: 702–716.4. Meurs L, Mbow M, Vereecken K, Menten J, Mboup S, et al. (2012)
Epidemiology of mixed Schistosoma mansoni and Schistosoma haematobiuminfections in northern Senegal. Int J Parasitol 42: 305–311.
5. Meurs L, Mbow M, Vereecken K, Menten J, Mboup S, et al. (2012) Bladder Morbidity
and Hepatic Fibrosis in Mixed Schistosoma haematobium and S. mansoni Infections: APopulation-Wide Study in Northern Senegal. PLoS Negl Trop Dis 6: e1829.
6. Huyse T, Van den Broeck F, Hellemans B, Volckaert FA, Polman K (2013)Hybridisation between the two major African schistosome species of humans.
Int J Parasitol 43: 687–689.7. Koukounari A, Donnelly CA, Sacko M, Keita AD, Landoure A, et al. (2010)
The impact of single versus mixed schistosome species infections on liver, spleen
and bladder morbidity within Malian children pre- and post-praziquanteltreatment. BMC Infect Dis 10: 227.
8. Gouvras AN, Kariuki C, Koukounari A, Norton AJ, Lange CN, et al. (2013) Theimpact of single versus mixed Schistosoma haematobium and S. mansoni infections on
morbidity profiles amongst school-children in Taveta, Kenya. Acta Trop 128: 309–317.
9. Bourke CD, Nausch N, Rujeni N, Appleby LJ, Mitchell KM, et al. (2013)Integrated analysis of innate, Th1, Th2, Th17, and regulatory cytokines
identifies changes in immune polarisation following treatment of humanschistosomiasis. J Infect Dis 208: 159–169.
10. WHO (2006) Preventive chemotherapy in human helminthiasis - Coordinateduse of anthelminthic drugs in control interventions: a manual for health
professionals and programme managers.
11. Wiria AE, Prasetyani MA, Hamid F, Wammes LJ, Lell B, et al. (2010) Does
treatment of intestinal helminth infections influence malaria? Background and
methodology of a longitudinal study of clinical, parasitological and immunolog-
ical parameters in Nangapanda, Flores, Indonesia (ImmunoSPIN Study). BMC
Infect Dis 10: 77.
12. R Core Team (2012) R: A language and environment for statistical computing.
R Foundation for Statistical Computing, Vienna, Austria. ISBN 3-900051-07-0,
http://www.R-project.org.
13. Oksanen J, Blanchet FG, Kindt R, Legendre P, Minchin PR, et al. (2013)
Vegan: Community ecology package. R package, version 2.0-7; http://CRAN.
R-project.org/package = vegan.
14. Clarke KR, Warwick RM (2001) Ordination of samples by multi-dimensional
scaling (MDS). In: Cange in marine communities: An approach to statistical
analysis and interpretation. Plymouth: Primer-E Ltd.
15. Joseph S, Jones FM, Kimani G, Mwatha JK, Kamau T, et al. (2004) Cytokine
production in whole blood cultures from a fishing community in an area of high
endemicity for Schistosoma mansoni in Uganda: the differential effect of parasite
worm and egg antigens. Infect Immun 72: 728–734.
16. Smith M, Webbe G (1974) Letter: Damage to schistosomula of Schistosomahaematobium in vitro by immune baboon and human sera and absence of cross-
reaction with Schistosoma mansoni. Trans R Soc Trop Med Hyg 68: 70–71.
17. Butterworth AE, Bensted-Smith R, Capron A, Capron M, Dalton PR, et al.
(1987) Immunity in human schistosomiasis mansoni: prevention by blocking
antibodies of the expression of immunity in young children. Parasitology 94 (Pt
2): 281–300.
18. van Remoortere A, van Dam GJ, Hokke CH, van den Eijnden DH, van Die,
et al. (2001) Profiles of immunoglobulin M (IgM) and IgG antibodies against
defined carbohydrate epitopes in sera of Schistosoma-infected individuals
determined by surface plasmon resonance. Infect Immun 69: 2396–2401.
Cytokine Responses in Co-endemic Schistosomiasis
PLOS Neglected Tropical Diseases | www.plosntds.org 10 August 2014 | Volume 8 | Issue 8 | e3080
Related Documents