Cynthia Palmer – Forecaster National Weather Service – Sacramento

Cynthia Palmer – Forecaster National Weather Service – Sacramento.
Dec 17, 2015
Welcome message from author
This document is posted to help you gain knowledge. Please leave a comment to let me know what you think about it! Share it to your friends and learn new things together.
Transcript

Cynthia Palmer – ForecasterNational Weather Service – Sacramento

Where have we been?Looking to the state
wide average:2004 – 2005 and
2005 – 2006 were quite wet and above normal
2006 – 2007 and 2007 – 2008, California experienced two dry years.

Looking to the first dry year: 2006 – 20072006 – 2007: A weak to
moderate el nino developed during the late summer and peaked in OND and NDJ then transitioned to neutral during the JFM time frame.
2006 – 2007 had a very dry January across the northern portion of the state.
2006 – 2007 is classified as a dry year across the entire state of California.
No problem with the reservoir storage following the wet years.
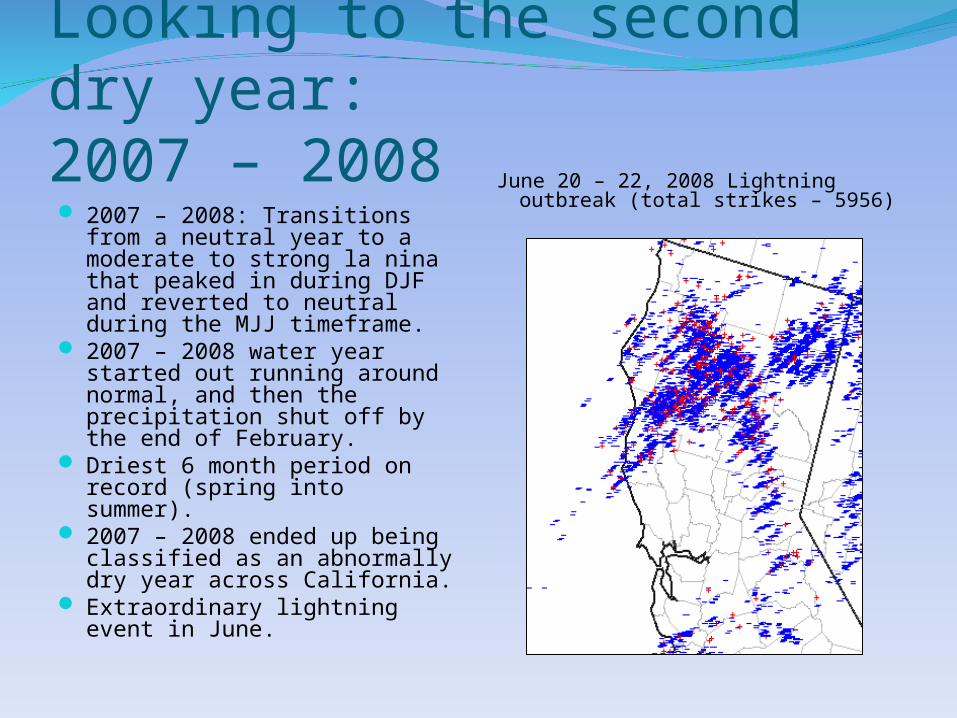
Looking to the second dry year:2007 – 2008 2007 – 2008: Transitions from a
neutral year to a moderate to strong la nina that peaked in during DJF and reverted to neutral during the MJJ timeframe.
2007 – 2008 water year started out running around normal, and then the precipitation shut off by the end of February.
Driest 6 month period on record (spring into summer).
2007 – 2008 ended up being classified as an abnormally dry year across California.
Extraordinary lightning event in June.
June 20 – 22, 2008 Lightning outbreak (total strikes – 5956)

Looking to the second dry year:2007 – 2008 PrecipitationNorthwest Coast: 63-110% of
normalCentral Coast: 71-95% of
normalNorthern Interior: 62-76% of
normalSouthern Interior: 37-75% of
normalSouthern California: 64-113%
of normalHowever, the Northern Sierra
8 Station Index was only 34.9% of normal, and had the driest spring on record.
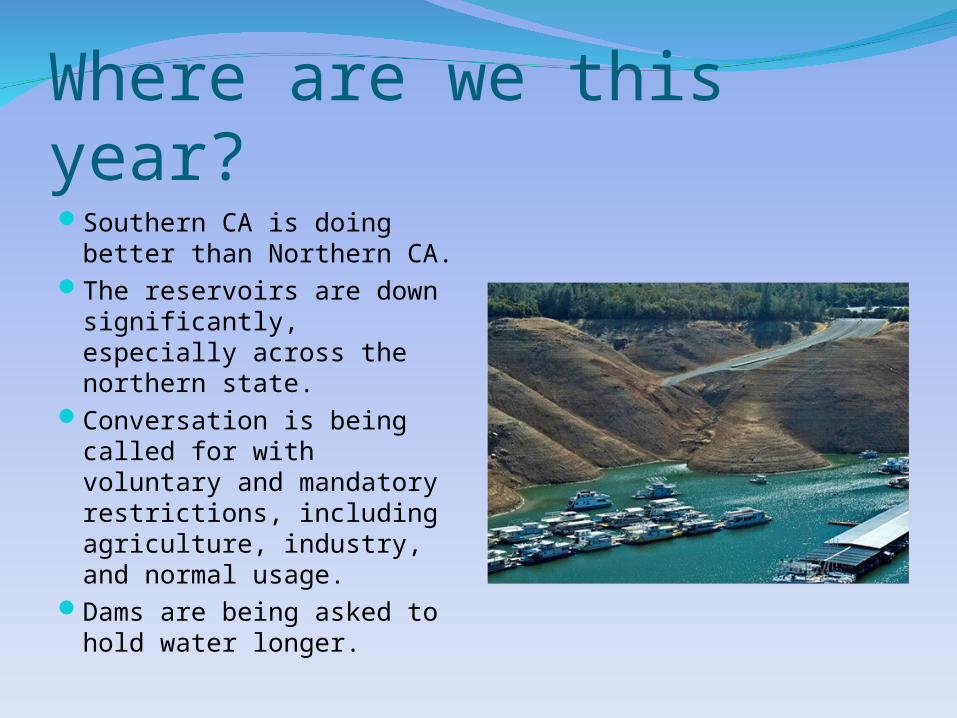
Where are we this year?Southern CA is doing
better than Northern CA.The reservoirs are down
significantly, especially across the northern state.
Conversation is being called for with voluntary and mandatory restrictions, including agriculture, industry, and normal usage.
Dams are being asked to hold water longer.
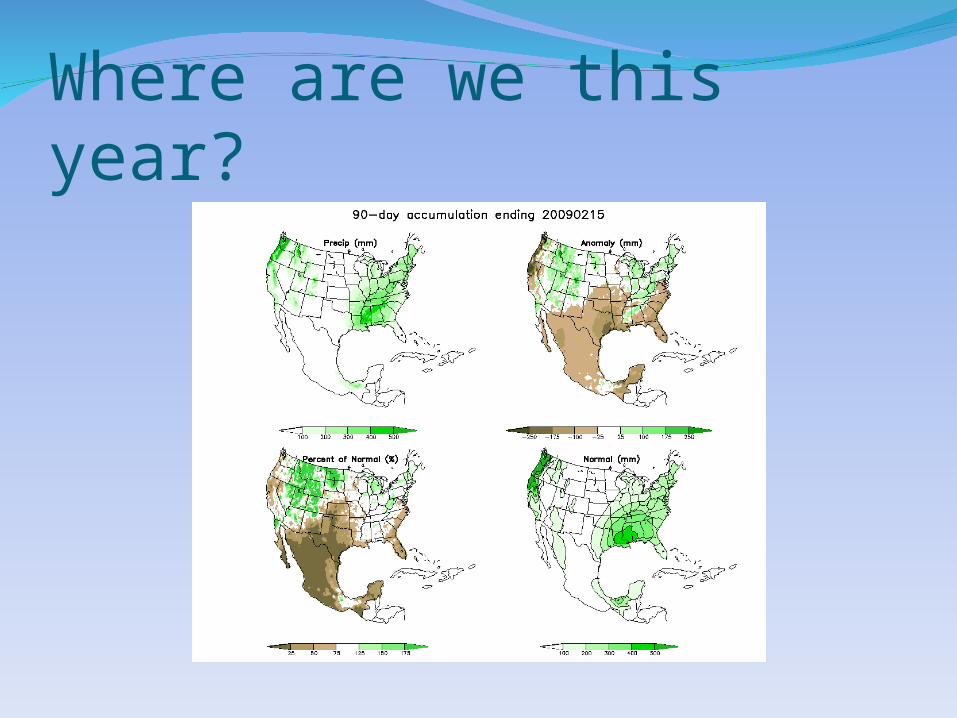
Where are we this year?

What about the most recent rains?
Butte Creek on February 23rd, courtesy KCRA

Where are we this year following the most recent rains and snows as of February 24th? Northwest Coast: 59-77% of
normal Central Coast: 75-79% of
normal Northern Interior: 69-86% of
normal Southern Interior: 84-93% of
normal Southern California: 83-
123% of normal State snow pack has
improved to 76% of normal (N=73%, C=76%, S=81%).
The Northern Sierra 8 Station Index is 86% of normal.
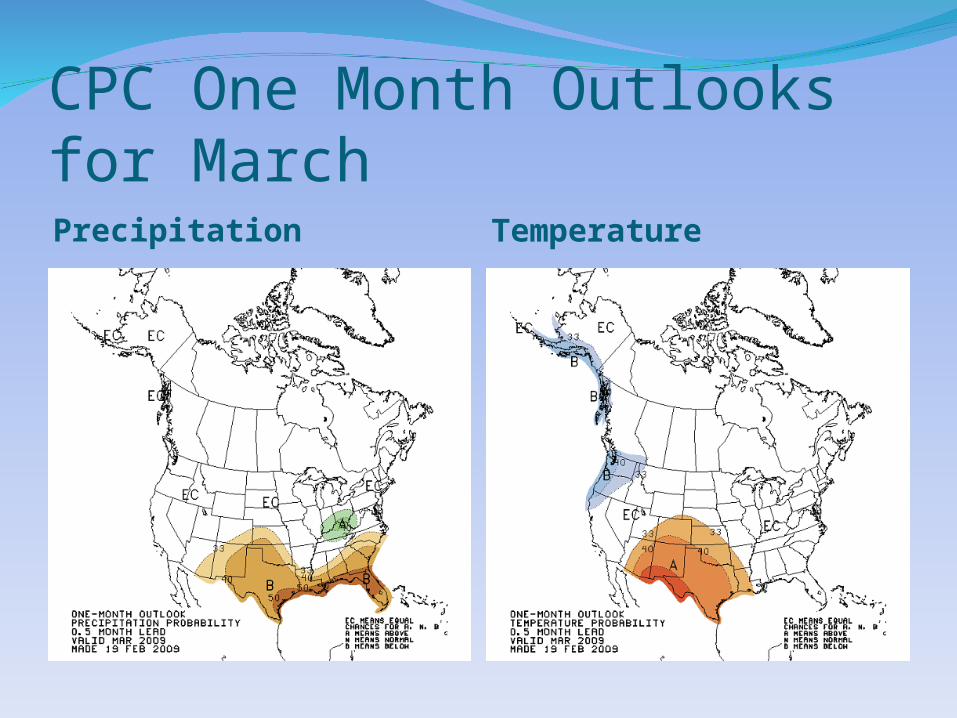
CPC One Month Outlooks for MarchPrecipitation Temperature

CPC Three Month Outlooks for March – April – MayPrecipitation Temperature
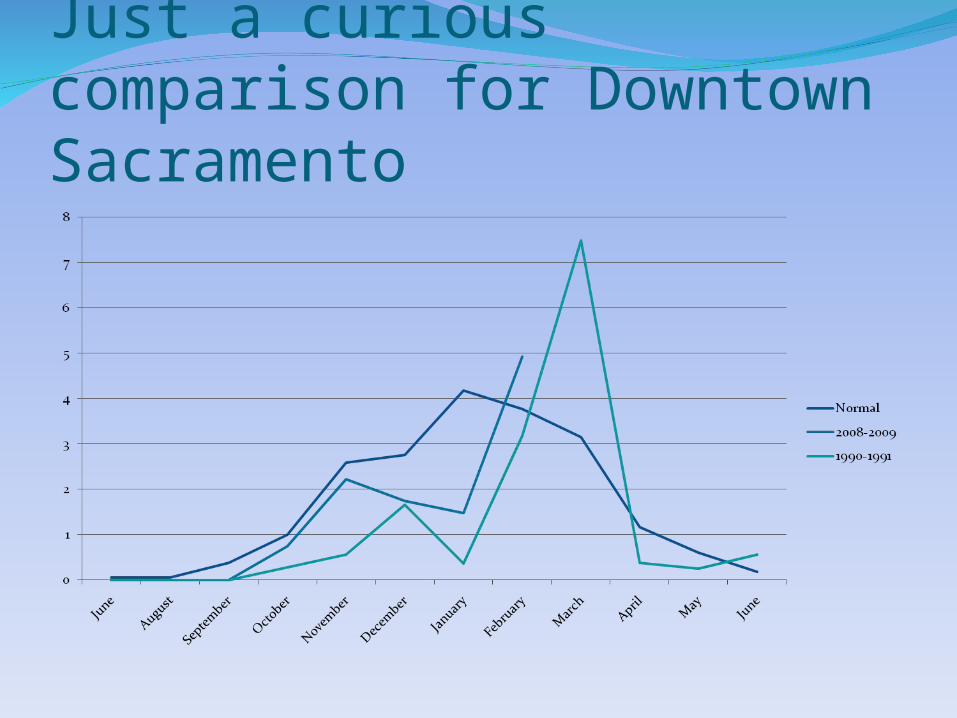
Just a curious comparison for Downtown Sacramento
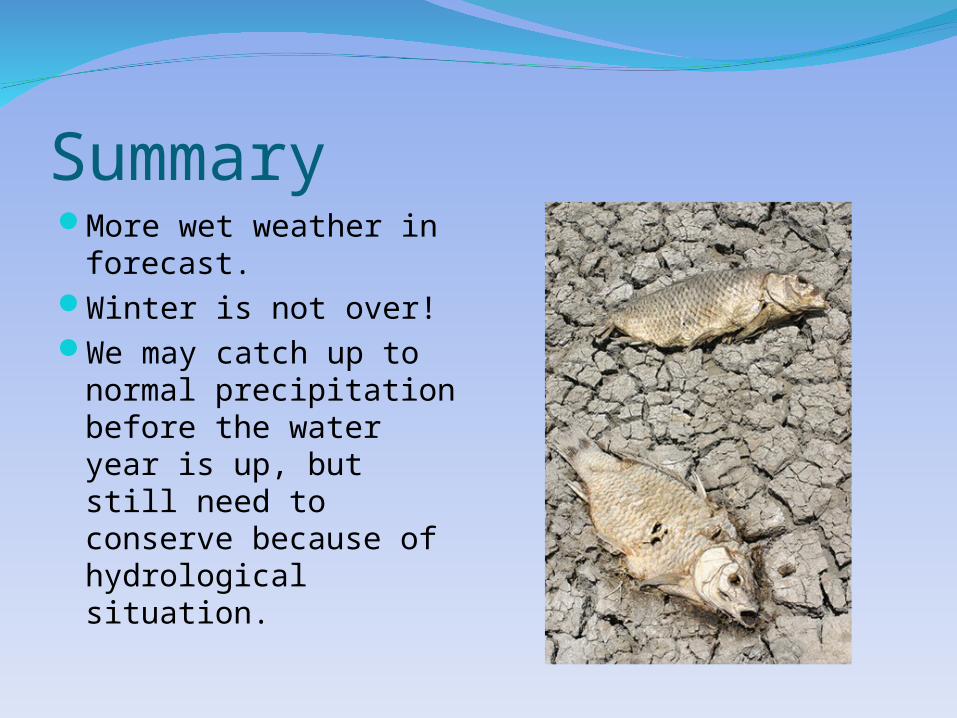
SummaryMore wet weather in
forecast.Winter is not over!We may catch up to
normal precipitation before the water year is up, but still need to conserve because of hydrological situation.

What’s New with the NWS
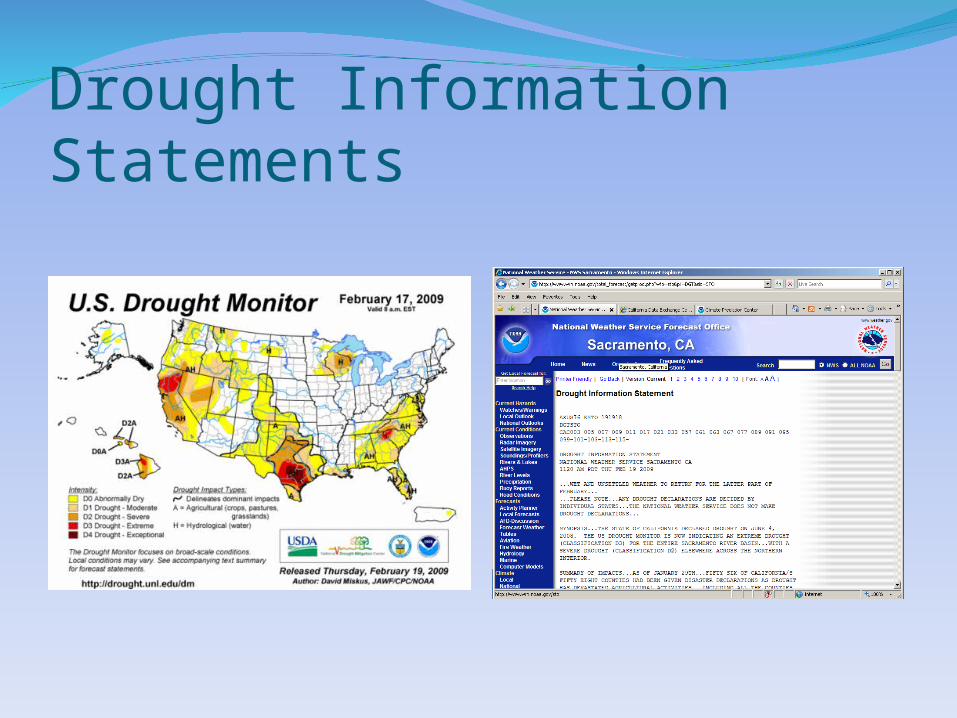
Drought Information Statements

Sacramento River Drought Statushttp://www.cnrfc.noaa.gov/products/Drought_8si_product.pdf
Current 8SI for WY2009: 27.5 inches
Median 8SI to date: 30.83 inches Current WY Percentile: 0.397
8SI Percentiles As of Feb 1 Projected for Feb 28Past 24 months (weighted) * 0.032 0.046Past 12 months 0.030 0.064Past 24 months 0.081 0.097
Percentile Drought Monitor Category0.00 - 0.02 D4 Drought - Exceptional0.02 - 0.05 D3 Drought - Extreme0.05 - 0.10 D2 Drought - Severe0.10 - 0.20 D1 Drought - Moderate0.20 - 0.30 D0 Abnormally Dry
0.30 + Normal
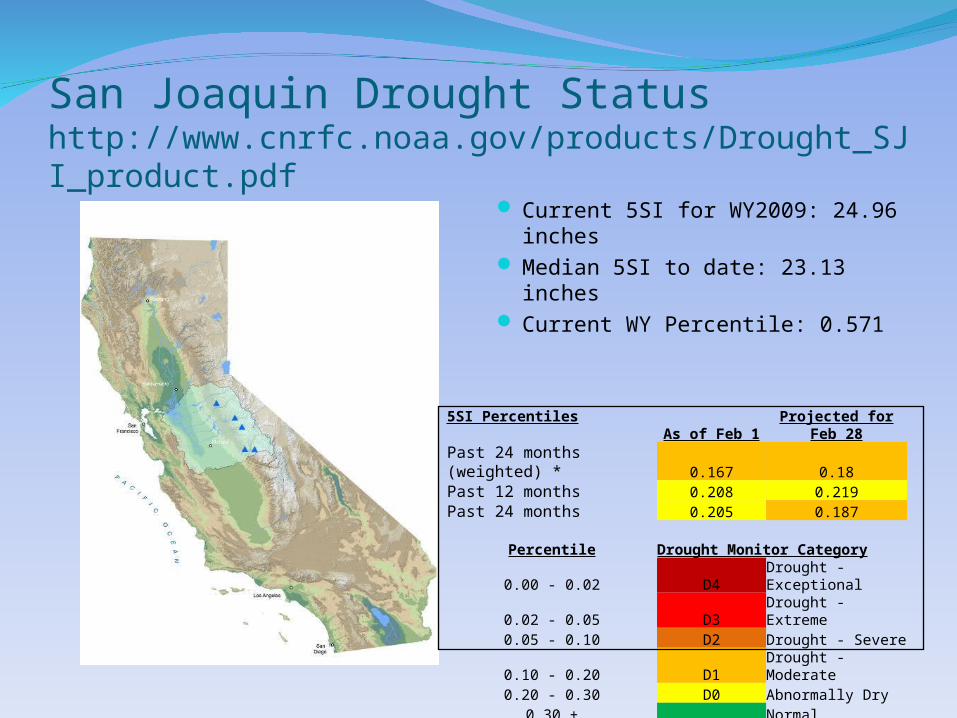
San Joaquin Drought Statushttp://www.cnrfc.noaa.gov/products/Drought_SJI_product.pdf
Current 5SI for WY2009: 24.96 inches
Median 5SI to date: 23.13 inches Current WY Percentile: 0.571
5SI Percentiles As of Feb 1 Projected for Feb 28Past 24 months (weighted) * 0.167 0.18Past 12 months 0.208 0.219Past 24 months 0.205 0.187
Percentile Drought Monitor Category0.00 - 0.02 D4 Drought - Exceptional0.02 - 0.05 D3 Drought - Extreme0.05 - 0.10 D2 Drought - Severe0.10 - 0.20 D1 Drought - Moderate0.20 - 0.30 D0 Abnormally Dry
0.30 + Normal
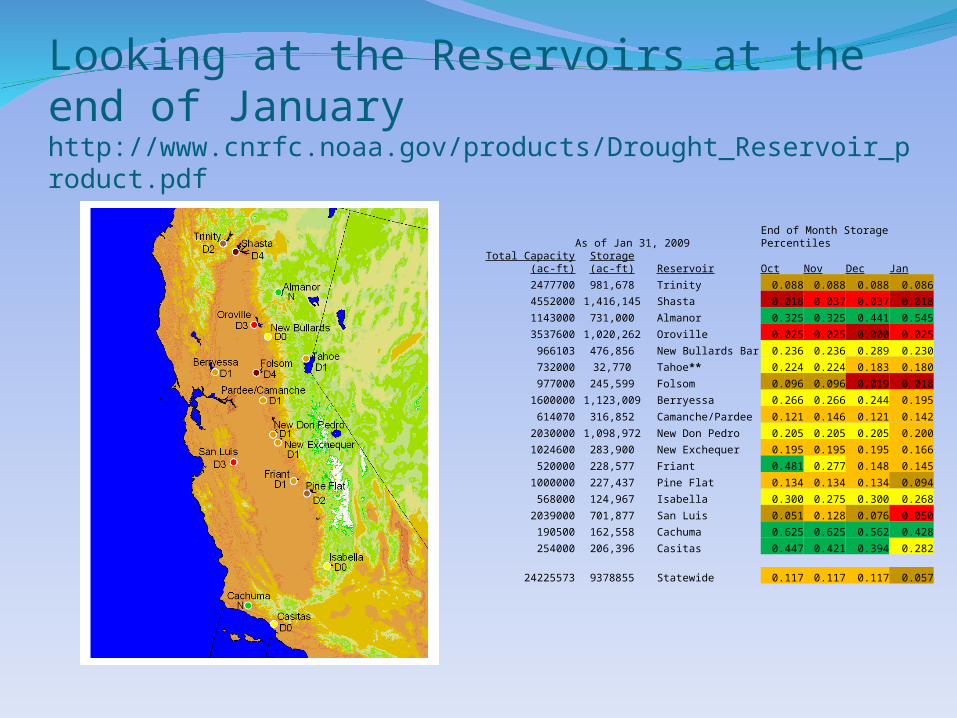
Looking at the Reservoirs at the end of January http://www.cnrfc.noaa.gov/products/Drought_Reservoir_product.pdf
As of Jan 31, 2009 End of Month Storage Percentiles
Total Capacity (ac-ft) Storage (ac-ft) Reservoir Oct Nov Dec Jan
2477700 981,678 Trinity 0.088 0.088 0.088 0.086
4552000 1,416,145 Shasta 0.018 0.037 0.037 0.018
1143000 731,000 Almanor 0.325 0.325 0.441 0.545
3537600 1,020,262 Oroville 0.025 0.025 0.000 0.025
966103 476,856 New Bullards Bar 0.236 0.236 0.289 0.230
732000 32,770 Tahoe** 0.224 0.224 0.183 0.180
977000 245,599 Folsom 0.096 0.096 0.019 0.018
1600000 1,123,009 Berryessa 0.266 0.266 0.244 0.195
614070 316,852 Camanche/Pardee 0.121 0.146 0.121 0.142
2030000 1,098,972 New Don Pedro 0.205 0.205 0.205 0.200
1024600 283,900 New Exchequer 0.195 0.195 0.195 0.166
520000 228,577 Friant 0.481 0.277 0.148 0.145
1000000 227,437 Pine Flat 0.134 0.134 0.134 0.094
568000 124,967 Isabella 0.300 0.275 0.300 0.268
2039000 701,877 San Luis 0.051 0.128 0.076 0.050
190500 162,558 Cachuma 0.625 0.625 0.562 0.428
254000 206,396 Casitas 0.447 0.421 0.394 0.282
24225573 9378855 Statewide 0.117 0.117 0.117 0.057
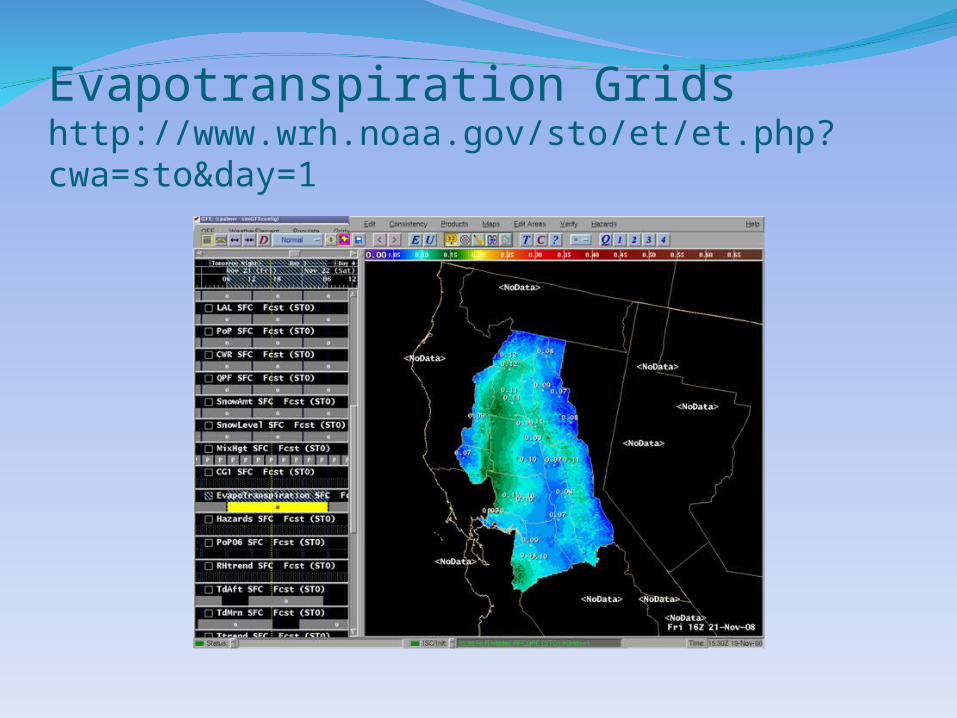
Evapotranspiration Gridshttp://www.wrh.noaa.gov/sto/et/et.php?cwa=sto&day=1

Related Documents