CYME 7.0 Industrial and Transmission 1 New Features and Analysis Modules CYME 7.0 Industrial and Transmission Power Engineering Software New Features and Modules

CYME 7.0 Whats New Industrial and Transmission.pdf
Nov 08, 2014
Engineering Tool by CYME
Welcome message from author
This document is posted to help you gain knowledge. Please leave a comment to let me know what you think about it! Share it to your friends and learn new things together.
Transcript
CYME 7.0 Industrial and Transmission
1
New Features and Analysis Modules
CYME 7.0
Industrial and Transmission
Power Engineering Software
New Features and Modules

CYME 7.0 Industrial and Transmission
2
New Features and Analysis Modules
CYME 7.0 Industrial and Transmission
3
New Features and Analysis Modules
Table of Contents
Chapter 1 General Enhancements .............................................................. 5
1.1 Keywords Units ......................................................................................... 5
1.2 System Parameters .................................................................................... 5
1.3 Induction Motors ........................................................................................ 6
1.3.1 Locked Rotor Current Entry in p.u .......................................................... 6
1.3.2 Computation of the Power Factor .......................................................... 6
1.4 Transformer Loading (ANSI / IEC)................................................................... 6
1.5 Customer Types ........................................................................................ 7
Chapter 2 Load Flow Analysis .................................................................... 8
2.1 Tolerance on Impedances ............................................................................ 8
2.2 Include DC Network .................................................................................... 9
2.3 Line Charging ........................................................................................... 9
Chapter 3 Short Circuit Analysis ............................................................... 10
3.1 Tolerance on Impedances .......................................................................... 10
3.2 All Duty Type Analysis ............................................................................... 11
3.1 ANSI / IEC Report Enhancements................................................................. 12
3.1.1 Available reports ............................................................................ 12 3.1.1.1 ANSI & IEC Summary on all Buses ............................................................... 12
3.1.1.2 Fault Flow at a Bus ........................................................................................ 12
3.1.2 Sample Reports ............................................................................. 13 3.1.2.1 IEC Initial Duty Report ................................................................................... 13
3.1.2.2 IEC Peak Duty ............................................................................................... 14
3.1.2.3 ANSI Short Circuit Duties .............................................................................. 16
3.1.3 One Line Diagram Results ................................................................. 18
Chapter 4 Transient Stability Analysis...................................................... 19
4.1 Frequency by Zone .................................................................................. 19
4.1 Global Settings........................................................................................ 21
4.1 Over Current Relay .................................................................................. 23
4.1.1 General Settings ............................................................................ 23
4.1.2 Controlled Breakers ......................................................................... 24
4.1.3 TCC Settings ................................................................................. 25
Chapter 5 Motor Starting Analysis ............................................................ 26
5.1 Locked Rotor Analysis ............................................................................... 26
5.1.1 Analysis Settings ............................................................................ 26
5.1.2 Flicker Table Tab ............................................................................ 28
5.1.3 Locked Rotor Analysis Sample Output .................................................. 29
5.1.4 Display: Color by Voltage Level ........................................................... 30
5.2 Maximum Start Size Analysis ...................................................................... 31
CYME 7.0 Industrial and Transmission
4
New Features and Analysis Modules
5.2.1 Analysis Settings ............................................................................ 31
5.2.2 Running the Analysis and Viewing the Results......................................... 31
Chapter 6 DC Analysis .............................................................................. 33
6.1 Introduction ............................................................................................ 33
6.2 DC Equipment ........................................................................................ 33
6.2.1 DC Bus ........................................................................................ 33
6.2.2 DC Cable ..................................................................................... 34
6.2.3 DC Impedance ............................................................................... 34
6.2.4 DC Load ...................................................................................... 35
6.2.5 DC Motor ..................................................................................... 35
6.2.6 Protective Devices .......................................................................... 37
6.2.7 Charger ....................................................................................... 38
6.2.8 Uninterruptable Power Supply (UPS) .................................................... 40
6.2.9 DC-DC Converter ........................................................................... 40
6.2.10 DC Battery .................................................................................... 41 6.2.10.1 Nominal Rating from Battery Data Sheet ...................................................... 42
6.2.10.2 Nominal Rating from Cell Data Sheet (IEEE 946 STD) ................................. 43
6.2.10.3 Station Battery Data ....................................................................................... 44
6.3 DC Load Flow Analysis .............................................................................. 46
6.3.1 Analysis Parameters ........................................................................ 47
6.3.2 Solving the Power Flow .................................................................... 48
6.3.3 Power Flow Reports ........................................................................ 49
6.4 DC Short Circuit ...................................................................................... 50
6.4.1 Analysis Parameters ........................................................................ 50
6.4.2 Solving the Sort Circuit ..................................................................... 51
6.4.3 Short Circuit Reports ....................................................................... 53 6.4.3.1 Summary on all bus report ............................................................................. 53
6.4.3.2 Fault a Bus report .......................................................................................... 54
6.5 Interface to AC System .............................................................................. 55
6.5.1 AC Power Flow .............................................................................. 55
6.5.2 Harmonic Analysis .......................................................................... 56
Chapter 7 CYMPROTEC ............................................................................. 59
7.1 New Features and Enhancements ................................................................ 59
7.1.1 Protective Device Analysis ................................................................ 59
7.1.2 TCC Library .................................................................................. 60
7.1.3 Device Settings Dialog Box ................................................................ 60
7.1.4 Live Preview Mode .......................................................................... 62
7.1.5 Device Reports .............................................................................. 62
7.1.6 General Enhancements .................................................................... 63
7.2 New Analysis Modules .............................................................................. 63
7.2.1 Sequence of operations .................................................................... 63
7.2.2 Minimum Fault Analysis .................................................................... 65
CYME 7.0 Industrial and Transmission
5
New Features and Analysis Modules
Chapter 1 General Enhancements
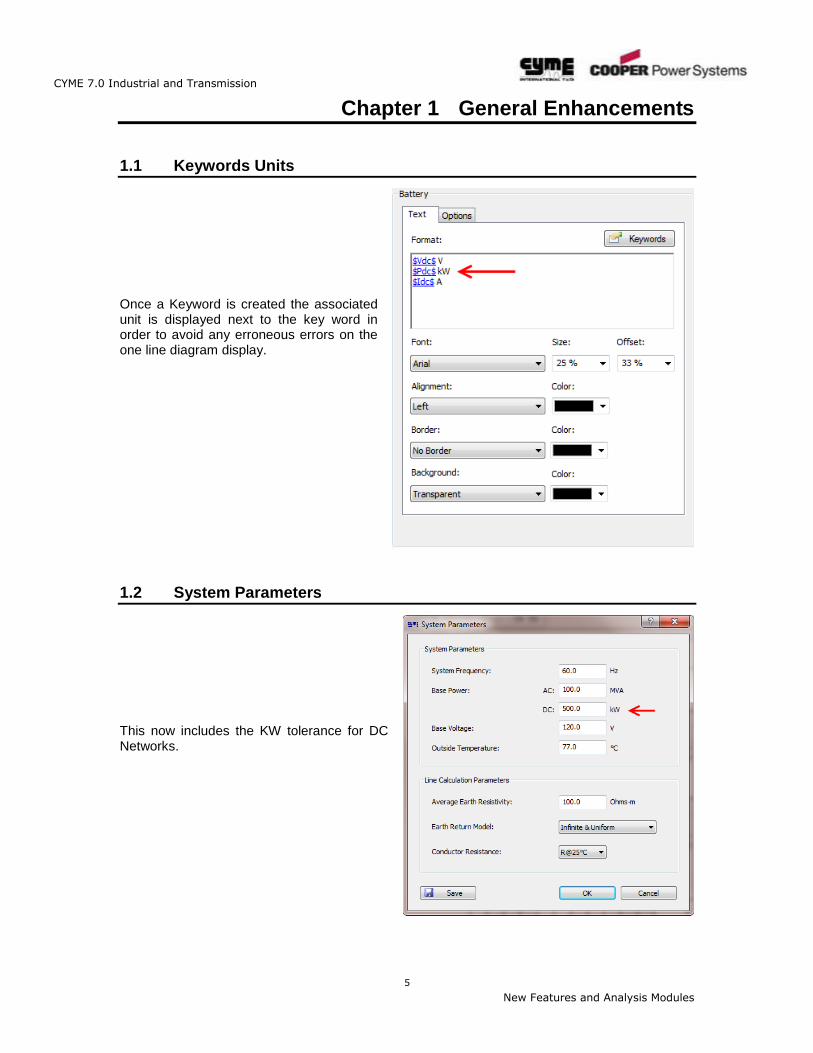
1.1 Keywords Units
Once a Keyword is created the associated unit is displayed next to the key word in order to avoid any erroneous errors on the one line diagram display.
1.2 System Parameters
This now includes the KW tolerance for DC Networks.
CYME 7.0 Industrial and Transmission
6
New Features and Analysis Modules
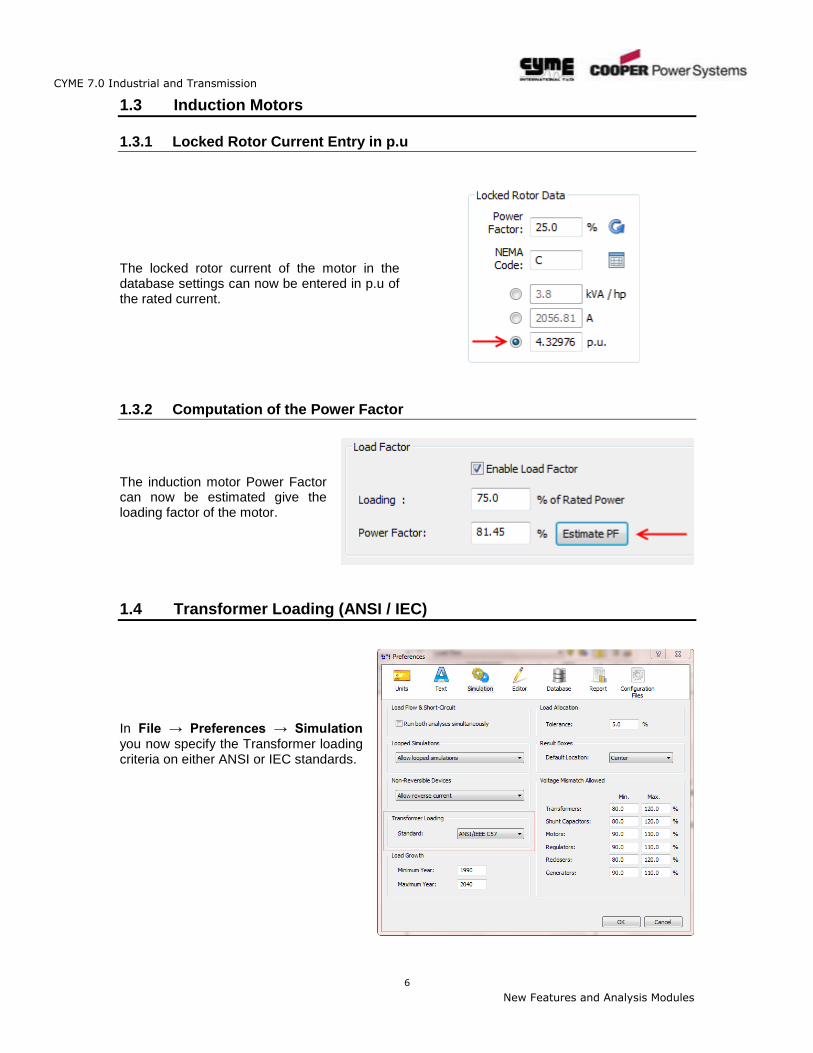
1.3 Induction Motors
1.3.1 Locked Rotor Current Entry in p.u
The locked rotor current of the motor in the database settings can now be entered in p.u of the rated current.
1.3.2 Computation of the Power Factor
The induction motor Power Factor can now be estimated give the loading factor of the motor.
1.4 Transformer Loading (ANSI / IEC)
In File → Preferences → Simulation you now specify the Transformer loading criteria on either ANSI or IEC standards.
CYME 7.0 Industrial and Transmission
7
New Features and Analysis Modules
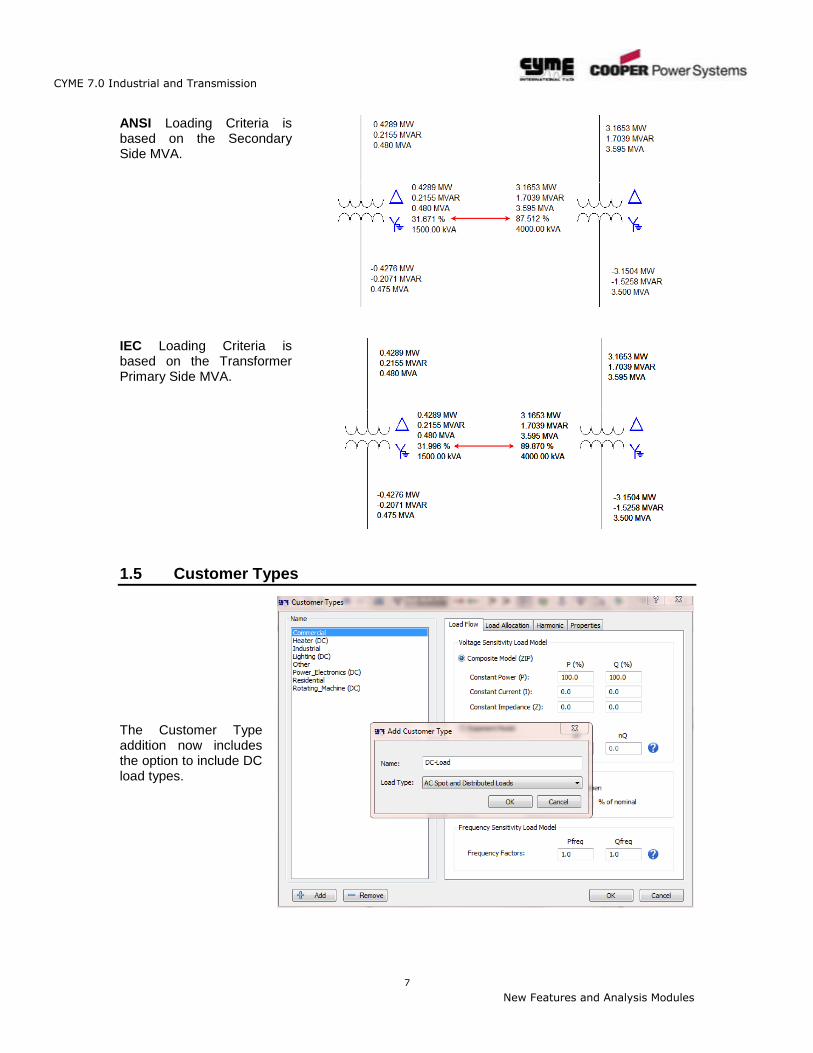
ANSI Loading Criteria is based on the Secondary Side MVA.
IEC Loading Criteria is based on the Transformer Primary Side MVA.
1.5 Customer Types
The Customer Type addition now includes the option to include DC load types.
CYME 7.0 Industrial and Transmission
8
New Features and Analysis Modules
Chapter 2 Load Flow Analysis
2.1 Tolerance on Impedances
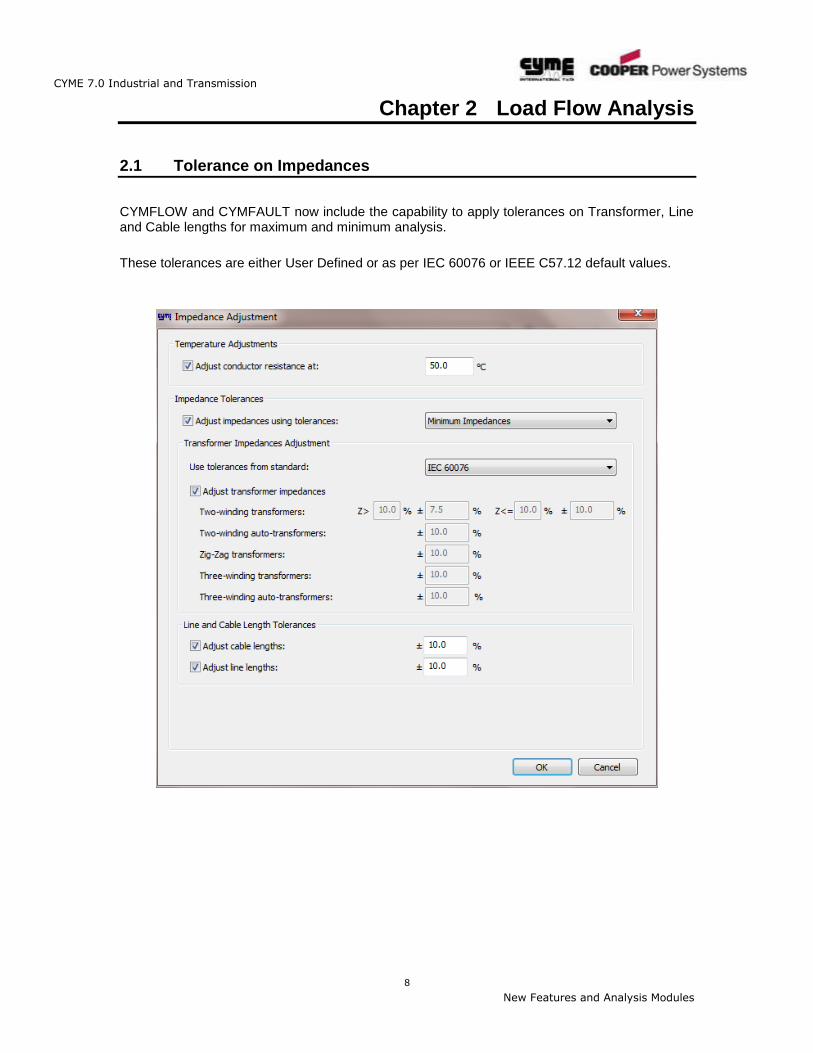
CYMFLOW and CYMFAULT now include the capability to apply tolerances on Transformer, Line and Cable lengths for maximum and minimum analysis.
These tolerances are either User Defined or as per IEC 60076 or IEEE C57.12 default values.
CYME 7.0 Industrial and Transmission
9
New Features and Analysis Modules
2.2 Include DC Network
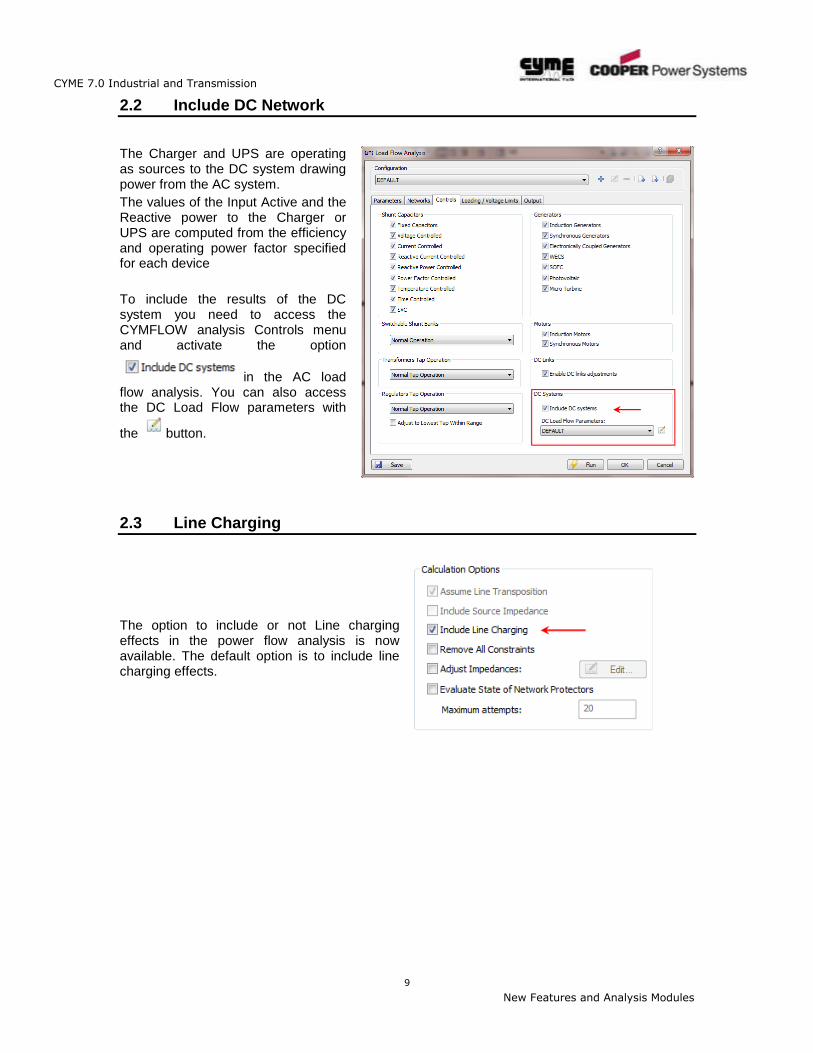
The Charger and UPS are operating as sources to the DC system drawing power from the AC system.
The values of the Input Active and the Reactive power to the Charger or UPS are computed from the efficiency and operating power factor specified for each device
To include the results of the DC system you need to access the CYMFLOW analysis Controls menu and activate the option
in the AC load flow analysis. You can also access the DC Load Flow parameters with
the button.
2.3 Line Charging
The option to include or not Line charging effects in the power flow analysis is now available. The default option is to include line charging effects.
CYME 7.0 Industrial and Transmission
10
New Features and Analysis Modules
Chapter 3 Short Circuit Analysis
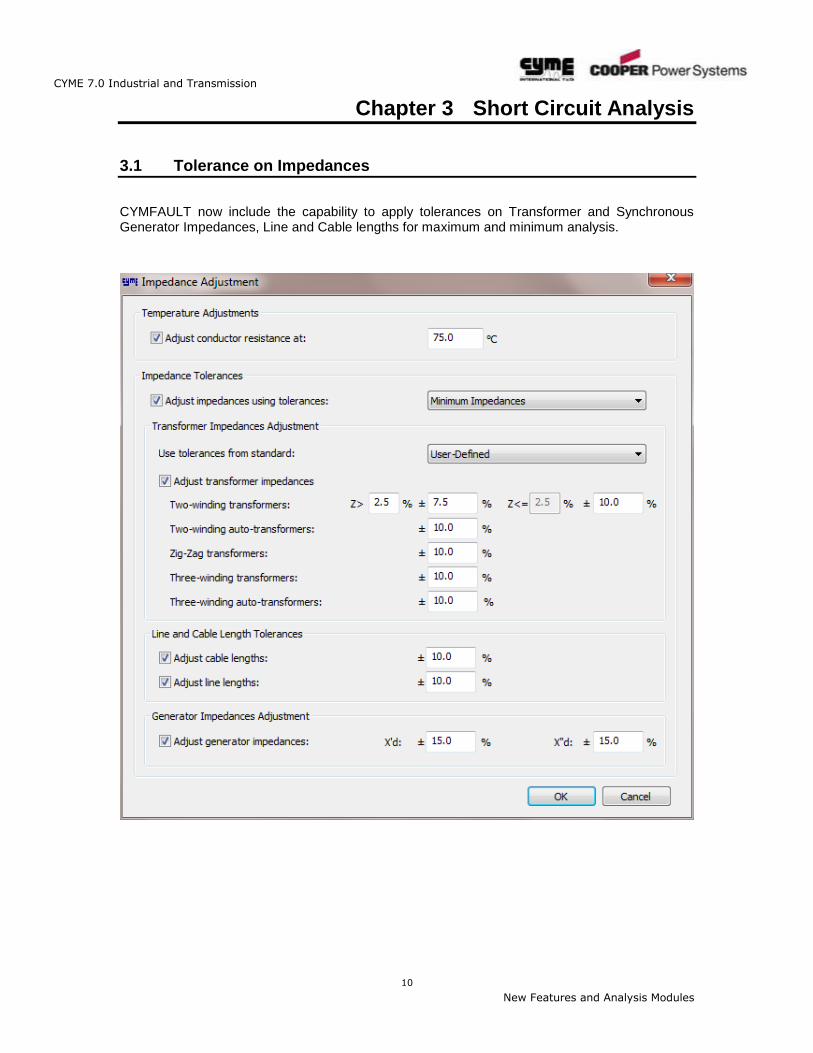
3.1 Tolerance on Impedances
CYMFAULT now include the capability to apply tolerances on Transformer and Synchronous Generator Impedances, Line and Cable lengths for maximum and minimum analysis.
CYME 7.0 Industrial and Transmission
11
New Features and Analysis Modules
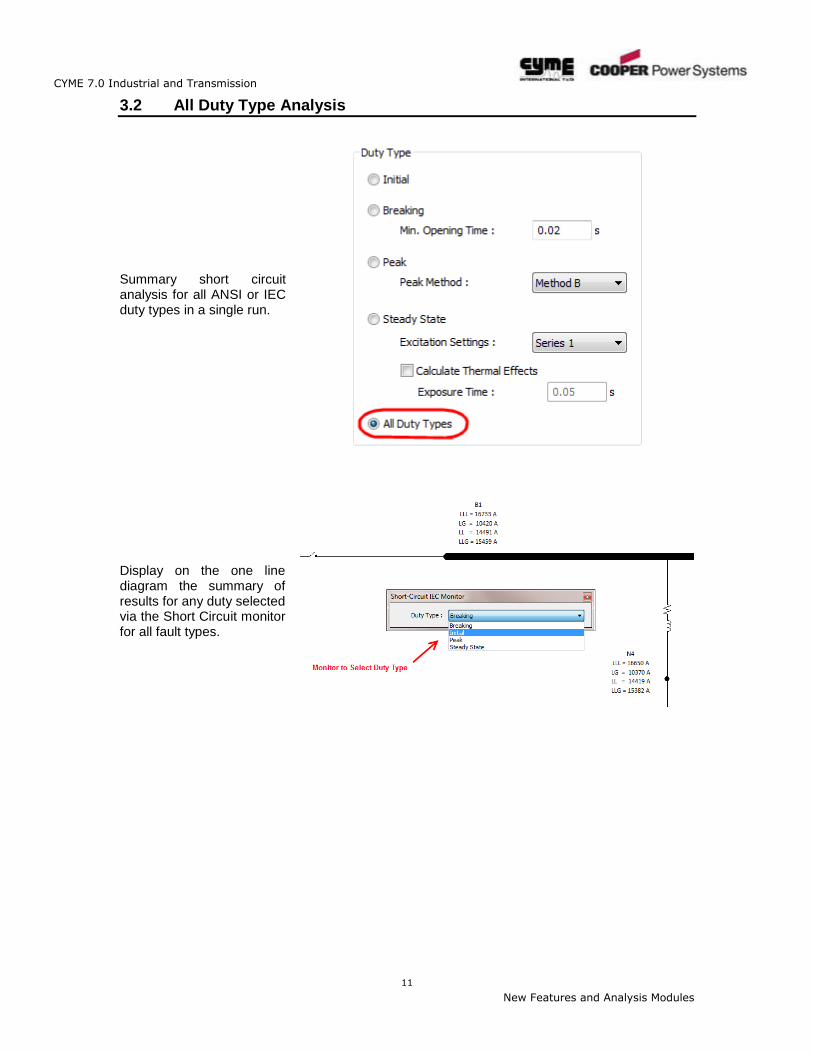
3.2 All Duty Type Analysis
Summary short circuit analysis for all ANSI or IEC duty types in a single run.
Display on the one line diagram the summary of results for any duty selected via the Short Circuit monitor for all fault types.
CYME 7.0 Industrial and Transmission
12
New Features and Analysis Modules
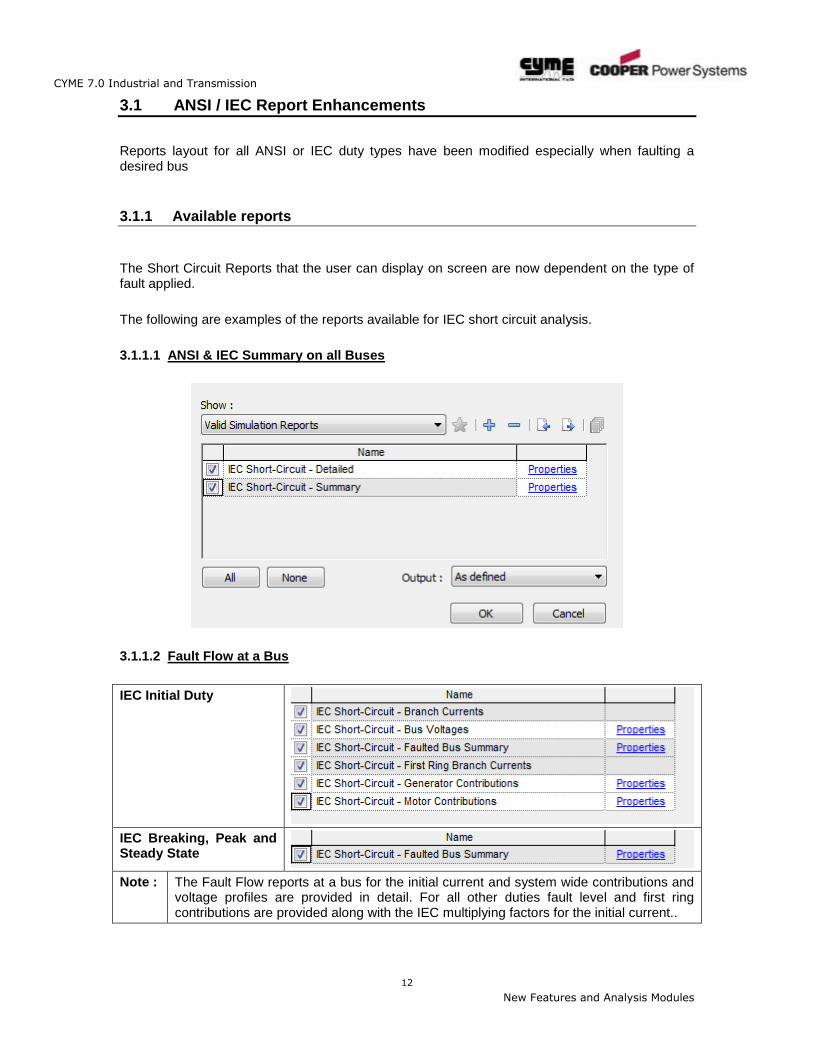
3.1 ANSI / IEC Report Enhancements
Reports layout for all ANSI or IEC duty types have been modified especially when faulting a desired bus
3.1.1 Available reports
The Short Circuit Reports that the user can display on screen are now dependent on the type of fault applied.
The following are examples of the reports available for IEC short circuit analysis.
3.1.1.1 ANSI & IEC Summary on all Buses
3.1.1.2 Fault Flow at a Bus
IEC Initial Duty
IEC Breaking, Peak and Steady State
Note : The Fault Flow reports at a bus for the initial current and system wide contributions and voltage profiles are provided in detail. For all other duties fault level and first ring contributions are provided along with the IEC multiplying factors for the initial current..
CYME 7.0 Industrial and Transmission
13
New Features and Analysis Modules
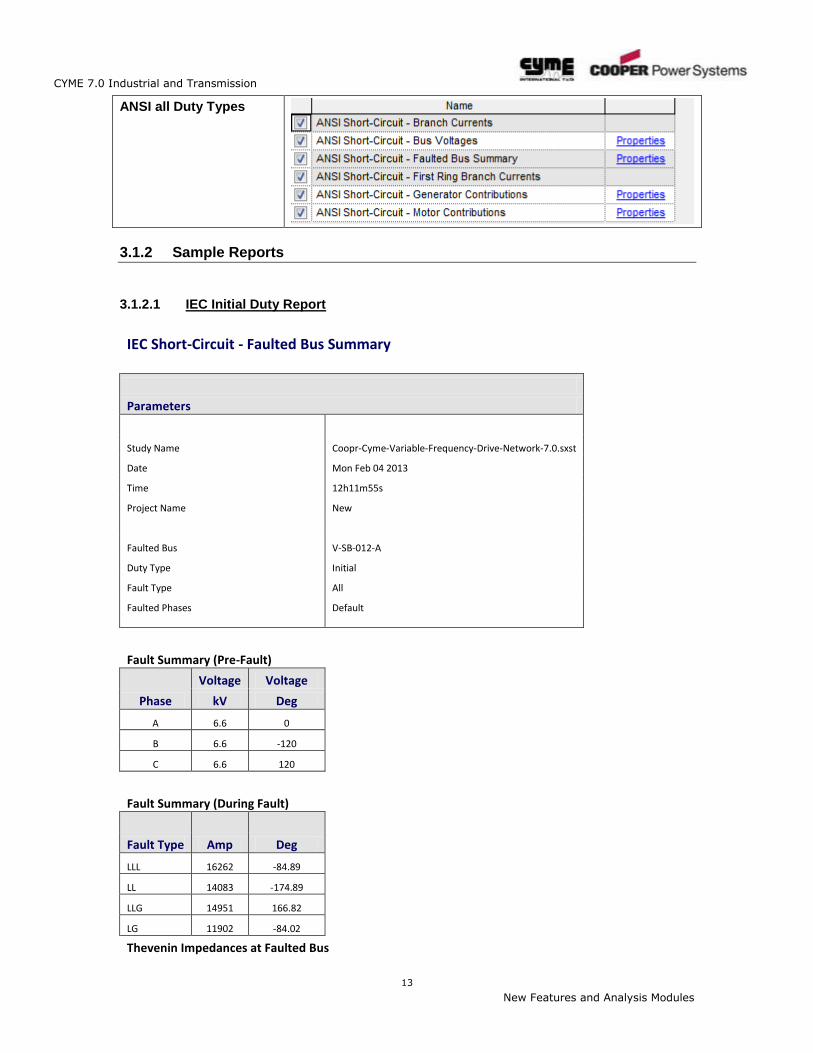
ANSI all Duty Types
3.1.2 Sample Reports
3.1.2.1 IEC Initial Duty Report
IEC Short-Circuit - Faulted Bus Summary
Parameters
Study Name Coopr-Cyme-Variable-Frequency-Drive-Network-7.0.sxst
Date Mon Feb 04 2013
Time 12h11m55s
Project Name New
Faulted Bus V-SB-012-A
Duty Type Initial
Fault Type All
Faulted Phases Default
Fault Summary (Pre-Fault)
Phase
Voltage Voltage
kV Deg
A 6.6 0
B 6.6 -120
C 6.6 120
Fault Summary (During Fault)
Fault Type Amp Deg
LLL 16262 -84.89
LL 14083 -174.89
LLG 14951 166.82
LG 11902 -84.02
Thevenin Impedances at Faulted Bus
CYME 7.0 Industrial and Transmission
14
New Features and Analysis Modules
R + jX
R/X
pu
Z1 0.0527 + j0.5894 0.089
Z0 0.1472 + j1.2336 0.119
First Ring Contributions
Device Number Type LLL LG LL LLG
V-EHP-1005 Cable 10165.7 4967.5 8803.7 8925.7
6.6KV_B_TIE Switch 0.0 0.0 0.0 0.0
V-EHP-1007 Cable 3143.5 5494.3 2722.4 4414.0
V-EHP-1008 Cable 2661.3 1298.2 2304.7 2325.0
V-EHP-1009 Cable 215.1 104.7 186.3 187.9
V-EHP-1010 Cable 82.5 40.2 71.4 72.1
First Ring Transfer Impedance
Device Number Type Z1 Z0
V-EHP-1005 Cable 0.0520 + j0.5876 0.1473 + j1.2336
V-EHP-1007 Cable 0.0454 + j0.5828 0.0297 + j1.1649
V-EHP-1008 Cable 0.0467 + j0.5836 0.1473 + j1.2336
V-EHP-1009 Cable 0.0522 + j0.5889 0.1473 + j1.2336
V-EHP-1010 Cable 0.0527 + j0.5893 0.1472 + j1.2336
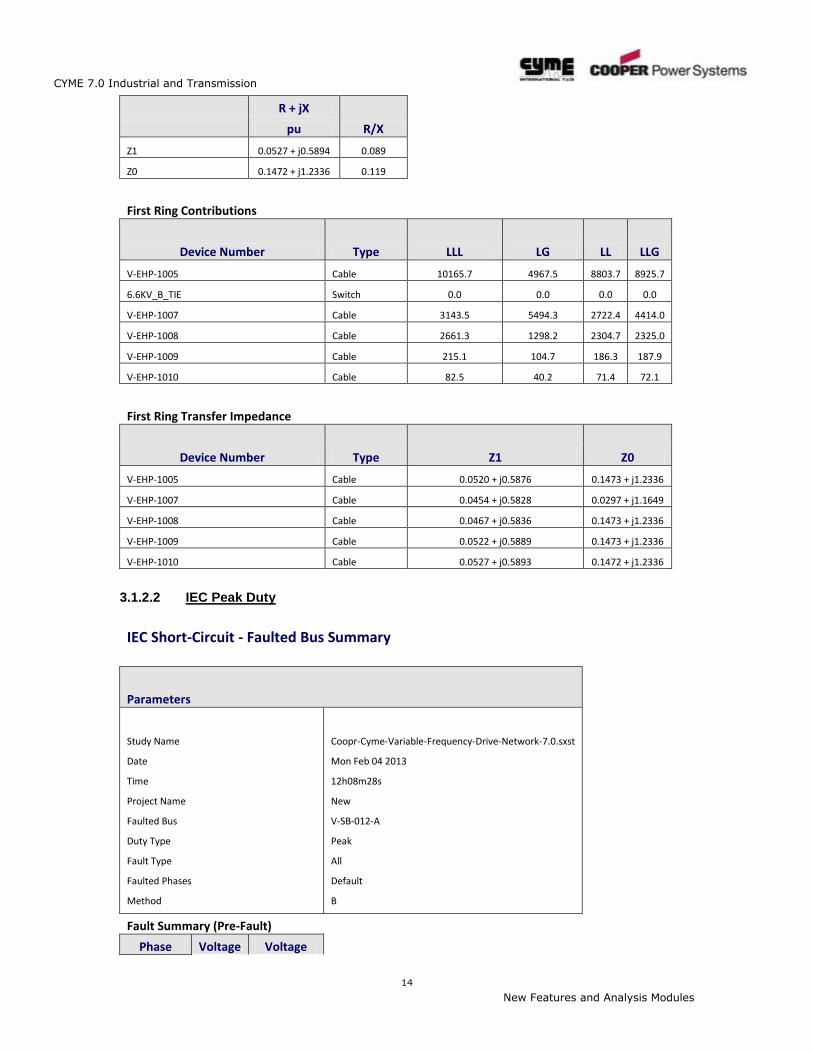
3.1.2.2 IEC Peak Duty
IEC Short-Circuit - Faulted Bus Summary
Parameters
Study Name Coopr-Cyme-Variable-Frequency-Drive-Network-7.0.sxst
Date Mon Feb 04 2013
Time 12h08m28s
Project Name New
Faulted Bus V-SB-012-A
Duty Type Peak
Fault Type All
Faulted Phases Default
Method B
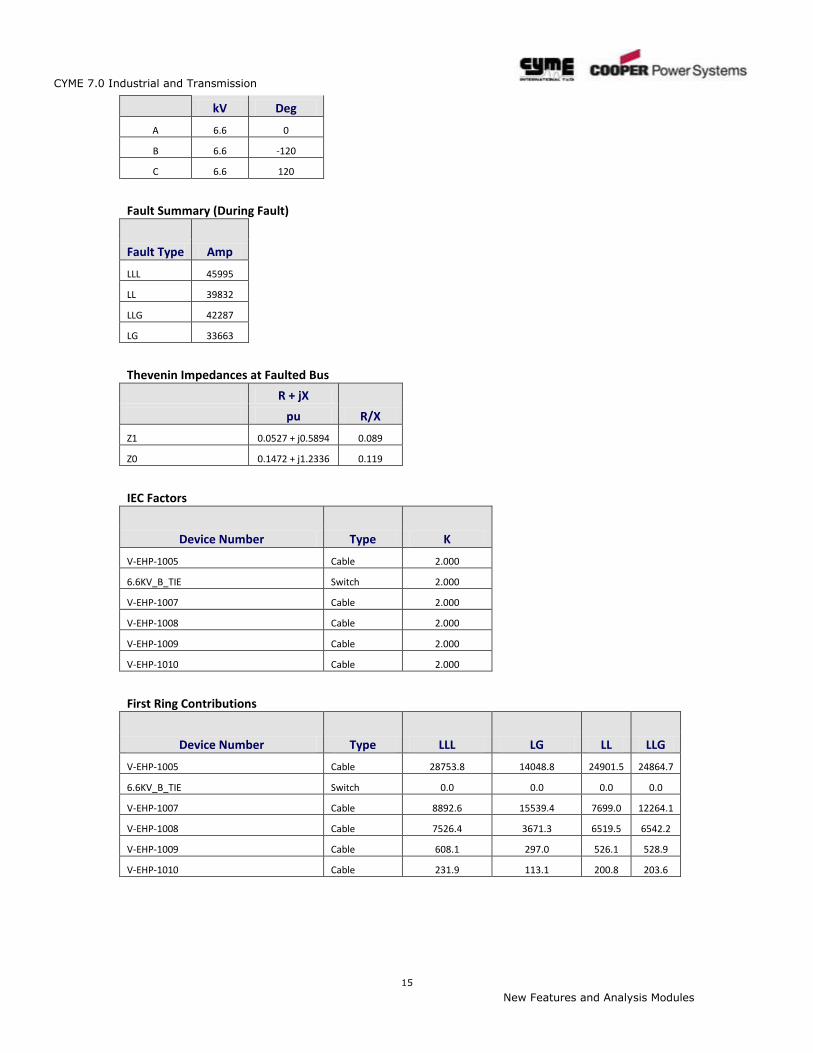
Fault Summary (Pre-Fault)
Phase Voltage Voltage
CYME 7.0 Industrial and Transmission
15
New Features and Analysis Modules
kV Deg
A 6.6 0
B 6.6 -120
C 6.6 120
Fault Summary (During Fault)
Fault Type Amp
LLL 45995
LL 39832
LLG 42287
LG 33663
Thevenin Impedances at Faulted Bus
R + jX
R/X
pu
Z1 0.0527 + j0.5894 0.089
Z0 0.1472 + j1.2336 0.119
IEC Factors
Device Number Type K
V-EHP-1005 Cable 2.000
6.6KV_B_TIE Switch 2.000
V-EHP-1007 Cable 2.000
V-EHP-1008 Cable 2.000
V-EHP-1009 Cable 2.000
V-EHP-1010 Cable 2.000
First Ring Contributions
Device Number Type LLL LG LL LLG
V-EHP-1005 Cable 28753.8 14048.8 24901.5 24864.7
6.6KV_B_TIE Switch 0.0 0.0 0.0 0.0
V-EHP-1007 Cable 8892.6 15539.4 7699.0 12264.1
V-EHP-1008 Cable 7526.4 3671.3 6519.5 6542.2
V-EHP-1009 Cable 608.1 297.0 526.1 528.9
V-EHP-1010 Cable 231.9 113.1 200.8 203.6
CYME 7.0 Industrial and Transmission
16
New Features and Analysis Modules
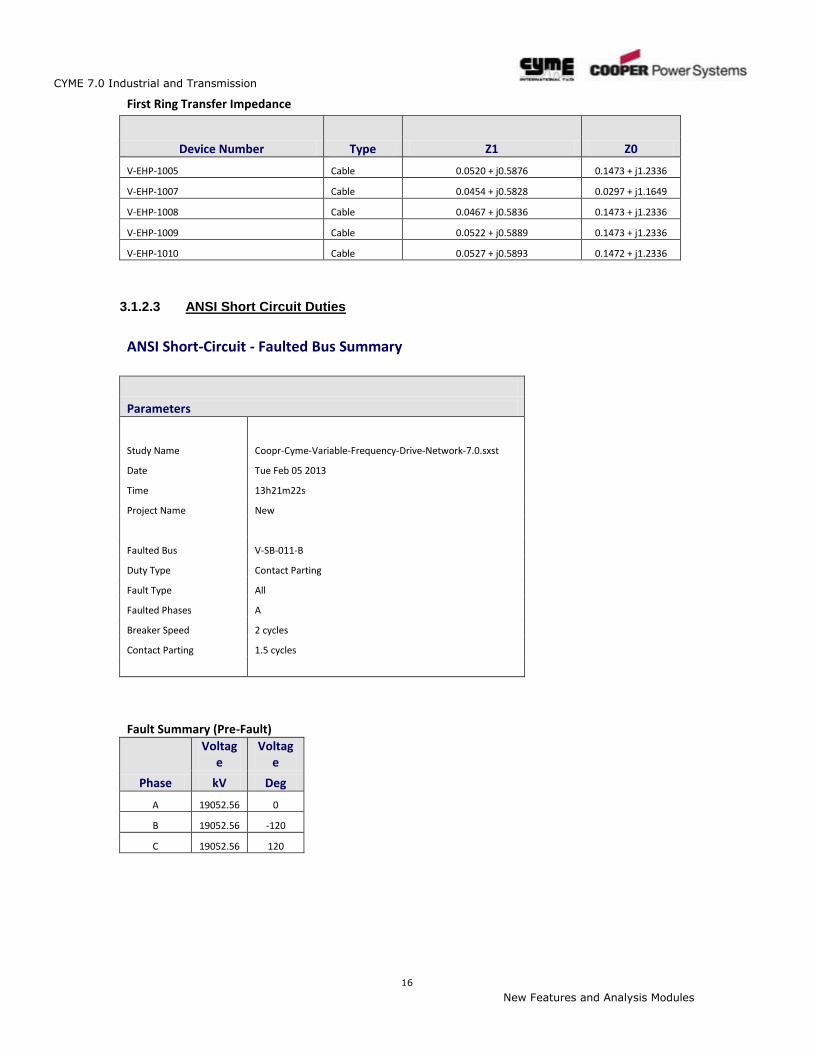
First Ring Transfer Impedance
Device Number Type Z1 Z0
V-EHP-1005 Cable 0.0520 + j0.5876 0.1473 + j1.2336
V-EHP-1007 Cable 0.0454 + j0.5828 0.0297 + j1.1649
V-EHP-1008 Cable 0.0467 + j0.5836 0.1473 + j1.2336
V-EHP-1009 Cable 0.0522 + j0.5889 0.1473 + j1.2336
V-EHP-1010 Cable 0.0527 + j0.5893 0.1472 + j1.2336
3.1.2.3 ANSI Short Circuit Duties
ANSI Short-Circuit - Faulted Bus Summary
Parameters
Study Name Coopr-Cyme-Variable-Frequency-Drive-Network-7.0.sxst
Date Tue Feb 05 2013
Time 13h21m22s
Project Name New
Faulted Bus V-SB-011-B
Duty Type Contact Parting
Fault Type All
Faulted Phases A
Breaker Speed 2 cycles
Contact Parting 1.5 cycles
Fault Summary (Pre-Fault)
Phase
Voltage
Voltage
kV Deg
A 19052.56 0
B 19052.56 -120
C 19052.56 120
CYME 7.0 Industrial and Transmission
17
New Features and Analysis Modules
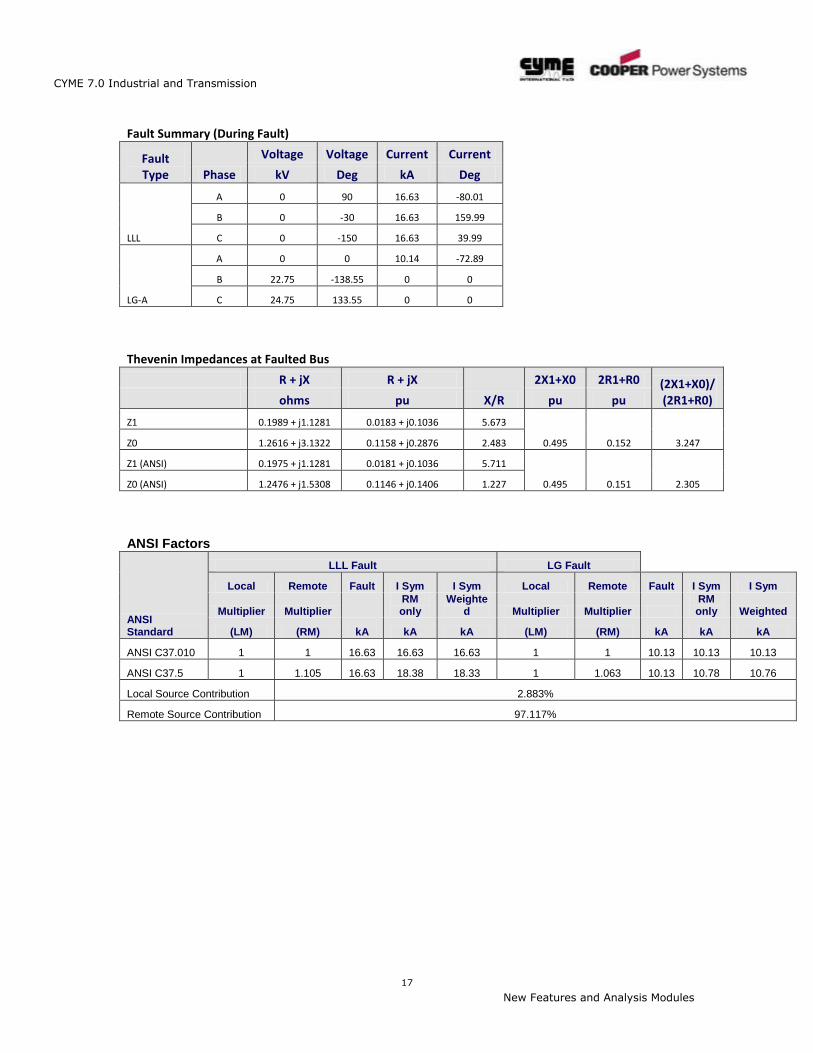
Fault Summary (During Fault)
Fault Type Phase
Voltage Voltage Current Current
kV Deg kA Deg
LLL
A 0 90 16.63 -80.01
B 0 -30 16.63 159.99
C 0 -150 16.63 39.99
LG-A
A 0 0 10.14 -72.89
B 22.75 -138.55 0 0
C 24.75 133.55 0 0
Thevenin Impedances at Faulted Bus
R + jX R + jX
X/R
2X1+X0 2R1+R0 (2X1+X0)/(2R1+R0)
ohms pu pu pu
Z1 0.1989 + j1.1281 0.0183 + j0.1036 5.673
0.495 0.152 3.247
Z0 1.2616 + j3.1322 0.1158 + j0.2876 2.483
Z1 (ANSI) 0.1975 + j1.1281 0.0181 + j0.1036 5.711
0.495 0.151 2.305
Z0 (ANSI) 1.2476 + j1.5308 0.1146 + j0.1406 1.227
ANSI Factors
ANSI Standard
LLL Fault LG Fault
Local Remote Fault I Sym I Sym Local Remote Fault I Sym I Sym
Multiplier Multiplier
RM only
Weighted Multiplier Multiplier
RM only Weighted
(LM) (RM) kA kA kA (LM) (RM) kA kA kA
ANSI C37.010 1 1 16.63 16.63 16.63 1 1 10.13 10.13 10.13
ANSI C37.5 1 1.105 16.63 18.38 18.33 1 1.063 10.13 10.78 10.76
Local Source Contribution 2.883%
Remote Source Contribution 97.117%
CYME 7.0 Industrial and Transmission
18
New Features and Analysis Modules
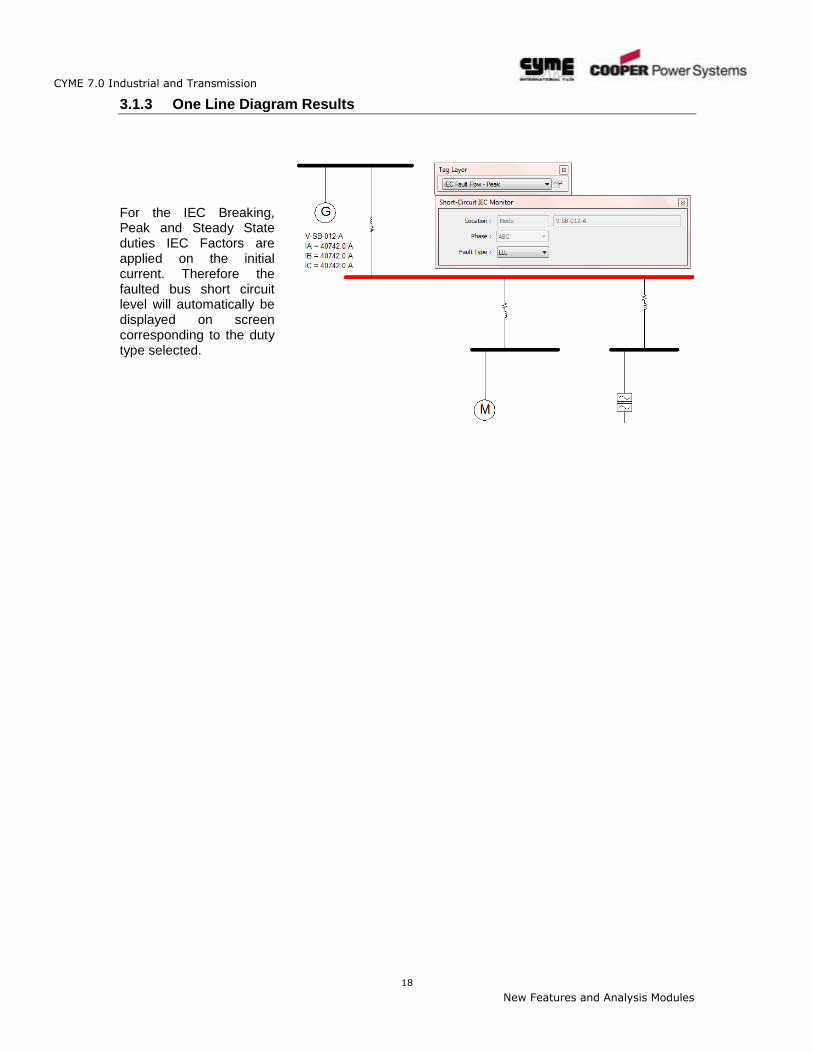
3.1.3 One Line Diagram Results
For the IEC Breaking, Peak and Steady State duties IEC Factors are applied on the initial current. Therefore the faulted bus short circuit level will automatically be displayed on screen corresponding to the duty type selected.
CYME 7.0 Industrial and Transmission
19
New Features and Analysis Modules
Chapter 4 Transient Stability Analysis
4.1 Frequency by Zone
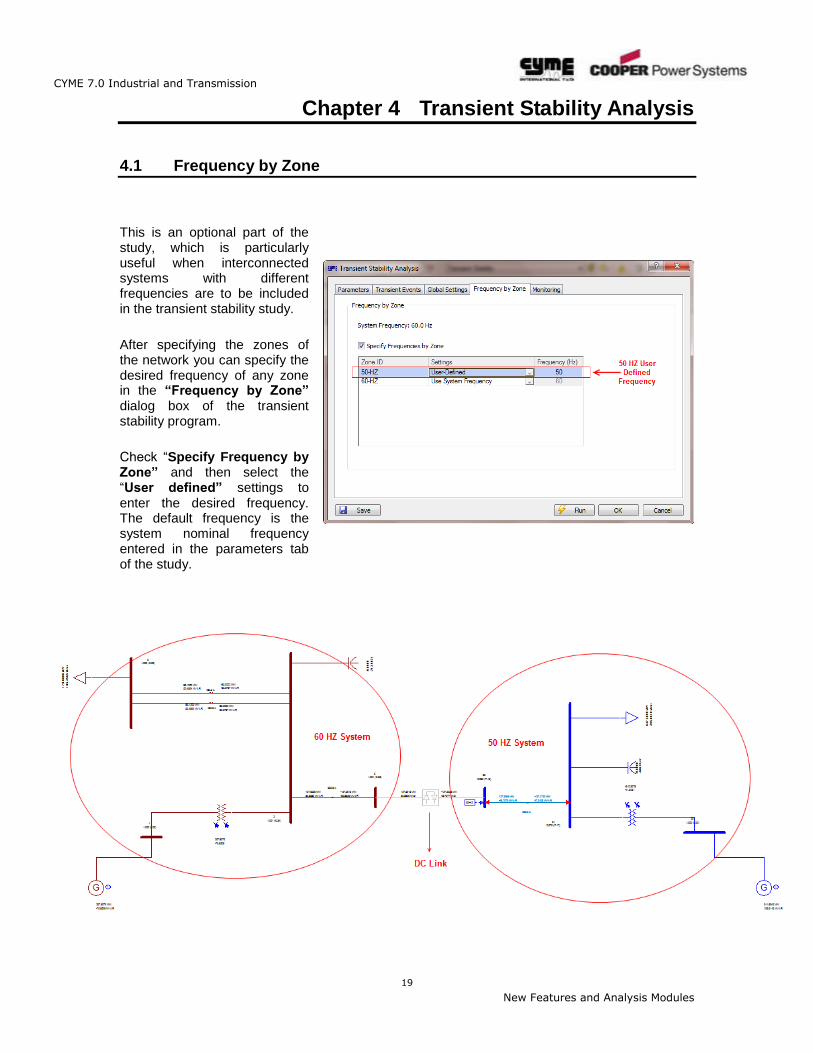
This is an optional part of the study, which is particularly useful when interconnected systems with different frequencies are to be included in the transient stability study.
After specifying the zones of the network you can specify the desired frequency of any zone in the “Frequency by Zone” dialog box of the transient stability program.
Check “Specify Frequency by Zone” and then select the “User defined” settings to enter the desired frequency. The default frequency is the system nominal frequency entered in the parameters tab of the study.
CYME 7.0 Industrial and Transmission
20
New Features and Analysis Modules
CYME 7.0 Industrial and Transmission
21
New Features and Analysis Modules
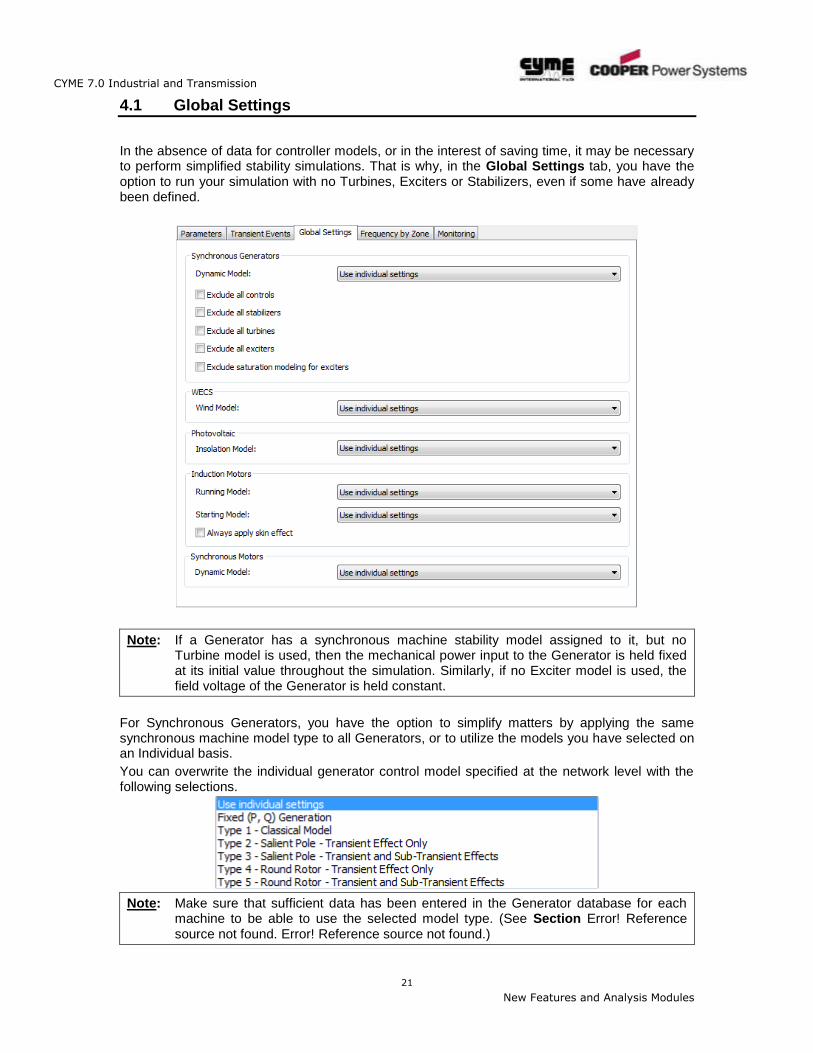
4.1 Global Settings
In the absence of data for controller models, or in the interest of saving time, it may be necessary to perform simplified stability simulations. That is why, in the Global Settings tab, you have the option to run your simulation with no Turbines, Exciters or Stabilizers, even if some have already been defined.
Note: If a Generator has a synchronous machine stability model assigned to it, but no Turbine model is used, then the mechanical power input to the Generator is held fixed at its initial value throughout the simulation. Similarly, if no Exciter model is used, the field voltage of the Generator is held constant.
For Synchronous Generators, you have the option to simplify matters by applying the same synchronous machine model type to all Generators, or to utilize the models you have selected on an Individual basis.
You can overwrite the individual generator control model specified at the network level with the following selections.
Note: Make sure that sufficient data has been entered in the Generator database for each machine to be able to use the selected model type. (See Section Error! Reference source not found. Error! Reference source not found.)
CYME 7.0 Industrial and Transmission
22
New Features and Analysis Modules
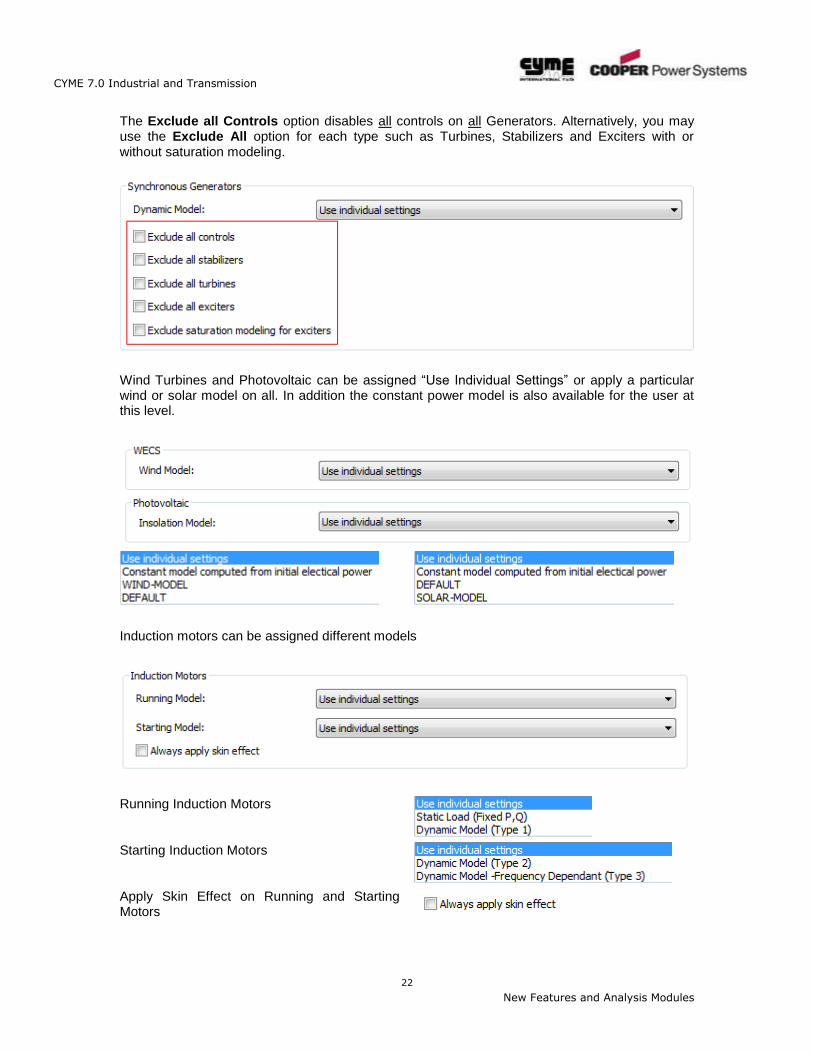
The Exclude all Controls option disables all controls on all Generators. Alternatively, you may use the Exclude All option for each type such as Turbines, Stabilizers and Exciters with or without saturation modeling.
Wind Turbines and Photovoltaic can be assigned “Use Individual Settings” or apply a particular wind or solar model on all. In addition the constant power model is also available for the user at this level.
Induction motors can be assigned different models
Running Induction Motors
Starting Induction Motors
Apply Skin Effect on Running and Starting Motors
CYME 7.0 Industrial and Transmission
23
New Features and Analysis Modules
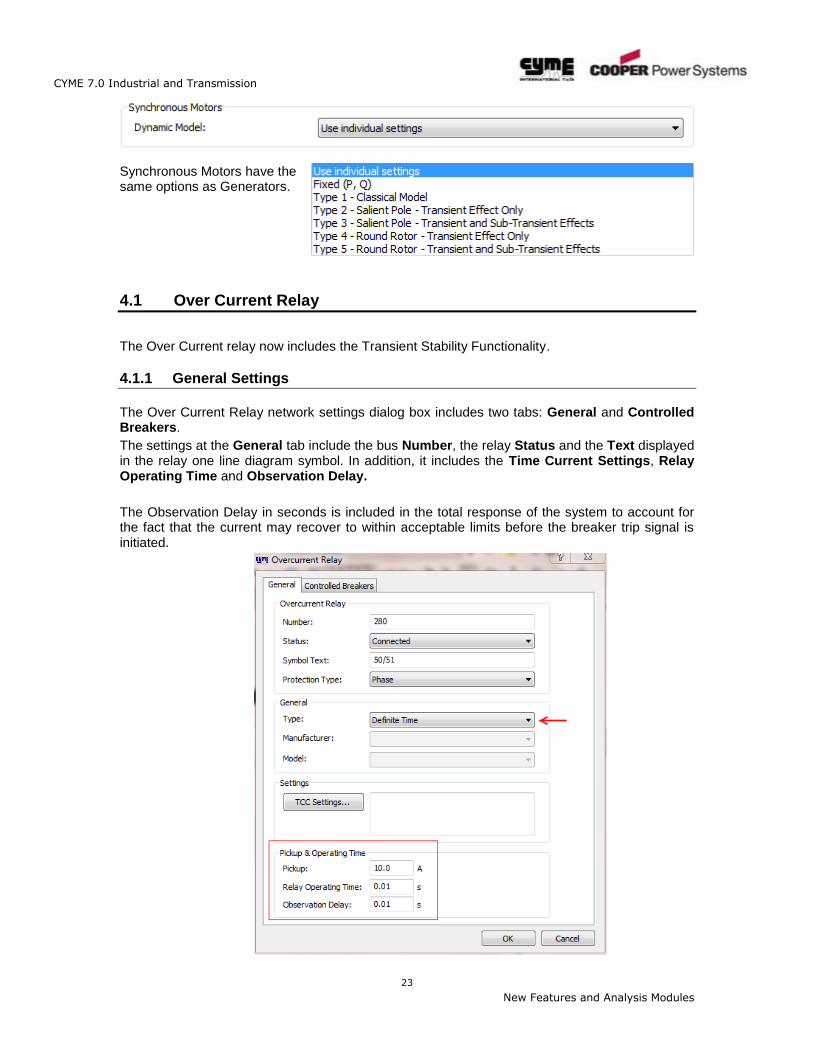
Synchronous Motors have the same options as Generators.
4.1 Over Current Relay
The Over Current relay now includes the Transient Stability Functionality.
4.1.1 General Settings
The Over Current Relay network settings dialog box includes two tabs: General and Controlled Breakers.
The settings at the General tab include the bus Number, the relay Status and the Text displayed in the relay one line diagram symbol. In addition, it includes the Time Current Settings, Relay Operating Time and Observation Delay.
The Observation Delay in seconds is included in the total response of the system to account for the fact that the current may recover to within acceptable limits before the breaker trip signal is initiated.
CYME 7.0 Industrial and Transmission
24
New Features and Analysis Modules
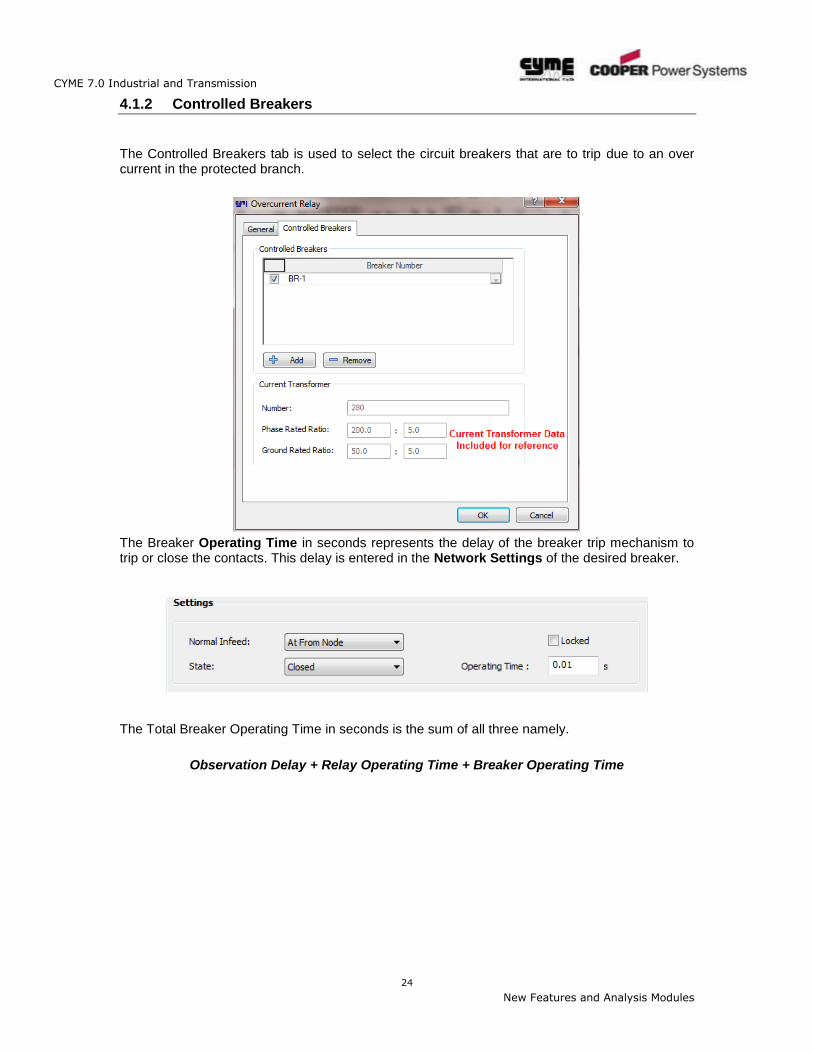
4.1.2 Controlled Breakers
The Controlled Breakers tab is used to select the circuit breakers that are to trip due to an over current in the protected branch.
The Breaker Operating Time in seconds represents the delay of the breaker trip mechanism to trip or close the contacts. This delay is entered in the Network Settings of the desired breaker.
The Total Breaker Operating Time in seconds is the sum of all three namely.
Observation Delay + Relay Operating Time + Breaker Operating Time

CYME 7.0 Industrial and Transmission
25
New Features and Analysis Modules
4.1.3 TCC Settings
User defined Definite Time or directly from the device Time Current curves for either Definite Time or relays with time dial functionality.
User Defined Definite Time Settings
The Relay Current Pick Up, Operating and Observation Delay times can be entered by the user.
Note The Relay Pick Current is used to calculate the branch current threshold that will activate the trip signal.
Example
Relay Pick up is 10 A
The CT Ratio is 200:5
The Branch Current trip threshold is
CYME 7.0 Industrial and Transmission
26
New Features and Analysis Modules
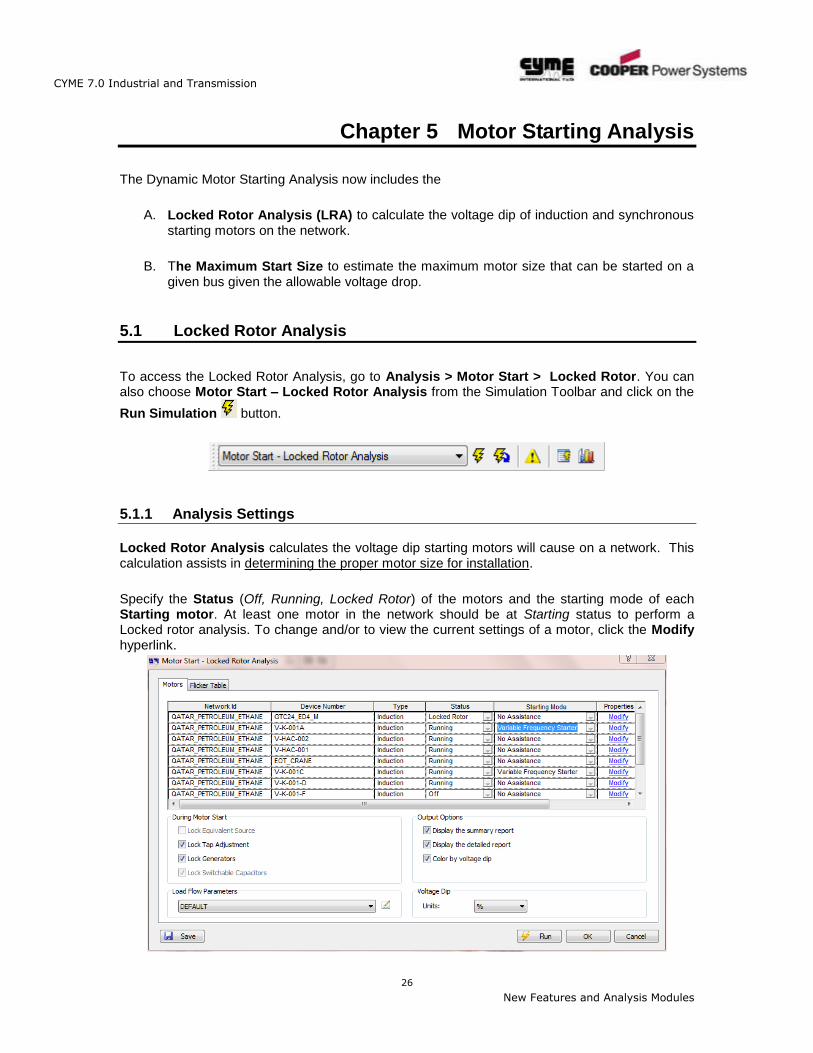
Chapter 5 Motor Starting Analysis
The Dynamic Motor Starting Analysis now includes the
A. Locked Rotor Analysis (LRA) to calculate the voltage dip of induction and synchronous
starting motors on the network.
B. The Maximum Start Size to estimate the maximum motor size that can be started on a
given bus given the allowable voltage drop.
5.1 Locked Rotor Analysis
To access the Locked Rotor Analysis, go to Analysis > Motor Start > Locked Rotor. You can also choose Motor Start – Locked Rotor Analysis from the Simulation Toolbar and click on the
Run Simulation button.
5.1.1 Analysis Settings
Locked Rotor Analysis calculates the voltage dip starting motors will cause on a network. This calculation assists in determining the proper motor size for installation.
Specify the Status (Off, Running, Locked Rotor) of the motors and the starting mode of each Starting motor. At least one motor in the network should be at Starting status to perform a Locked rotor analysis. To change and/or to view the current settings of a motor, click the Modify hyperlink.
CYME 7.0 Industrial and Transmission
27
New Features and Analysis Modules
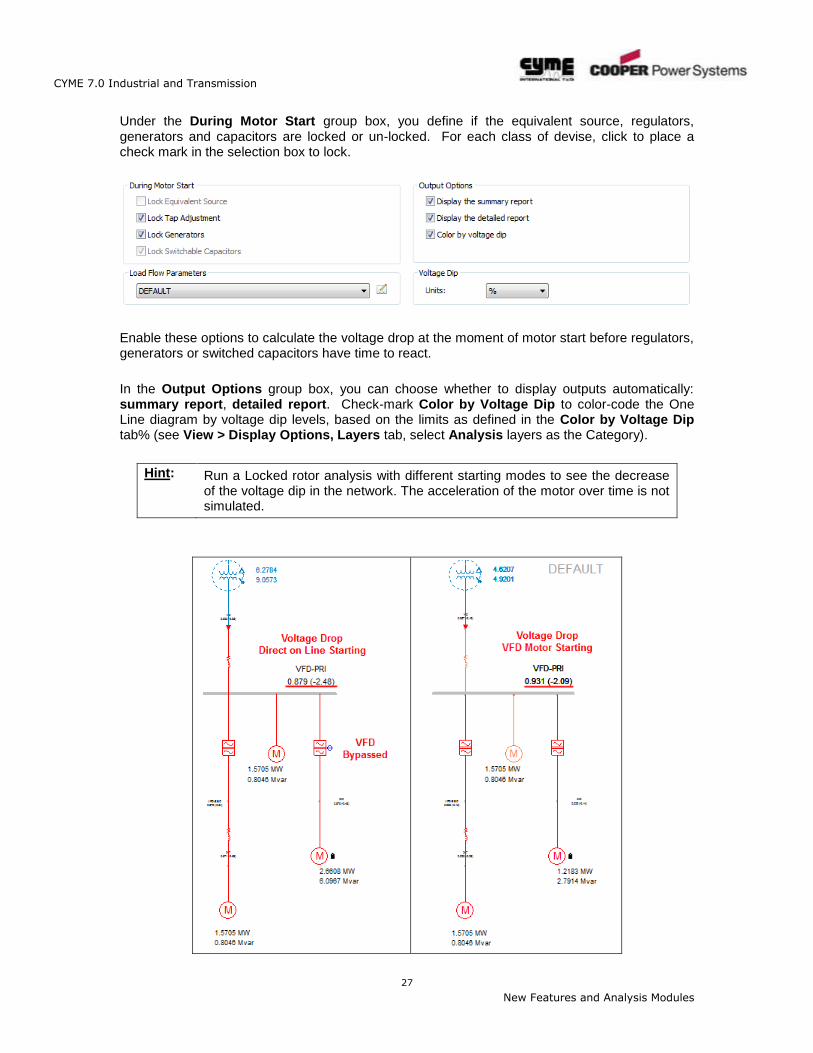
Under the During Motor Start group box, you define if the equivalent source, regulators, generators and capacitors are locked or un-locked. For each class of devise, click to place a check mark in the selection box to lock.
Enable these options to calculate the voltage drop at the moment of motor start before regulators, generators or switched capacitors have time to react.
In the Output Options group box, you can choose whether to display outputs automatically: summary report, detailed report. Check-mark Color by Voltage Dip to color-code the One Line diagram by voltage dip levels, based on the limits as defined in the Color by Voltage Dip tab% (see View > Display Options, Layers tab, select Analysis layers as the Category).
Hint: Run a Locked rotor analysis with different starting modes to see the decrease of the voltage dip in the network. The acceleration of the motor over time is not simulated.
CYME 7.0 Industrial and Transmission
28
New Features and Analysis Modules
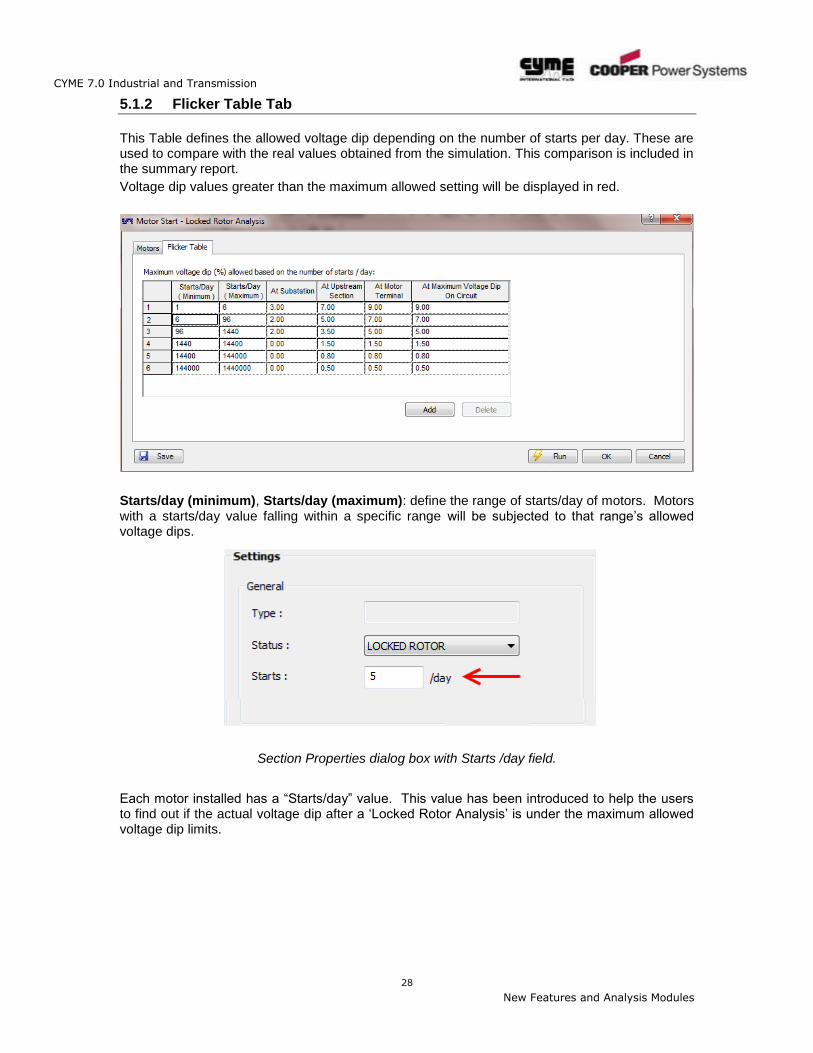
5.1.2 Flicker Table Tab
This Table defines the allowed voltage dip depending on the number of starts per day. These are used to compare with the real values obtained from the simulation. This comparison is included in the summary report.
Voltage dip values greater than the maximum allowed setting will be displayed in red.
Starts/day (minimum), Starts/day (maximum): define the range of starts/day of motors. Motors with a starts/day value falling within a specific range will be subjected to that range’s allowed voltage dips.
Section Properties dialog box with Starts /day field.
Each motor installed has a “Starts/day” value. This value has been introduced to help the users to find out if the actual voltage dip after a ‘Locked Rotor Analysis’ is under the maximum allowed voltage dip limits.
CYME 7.0 Industrial and Transmission
29
New Features and Analysis Modules
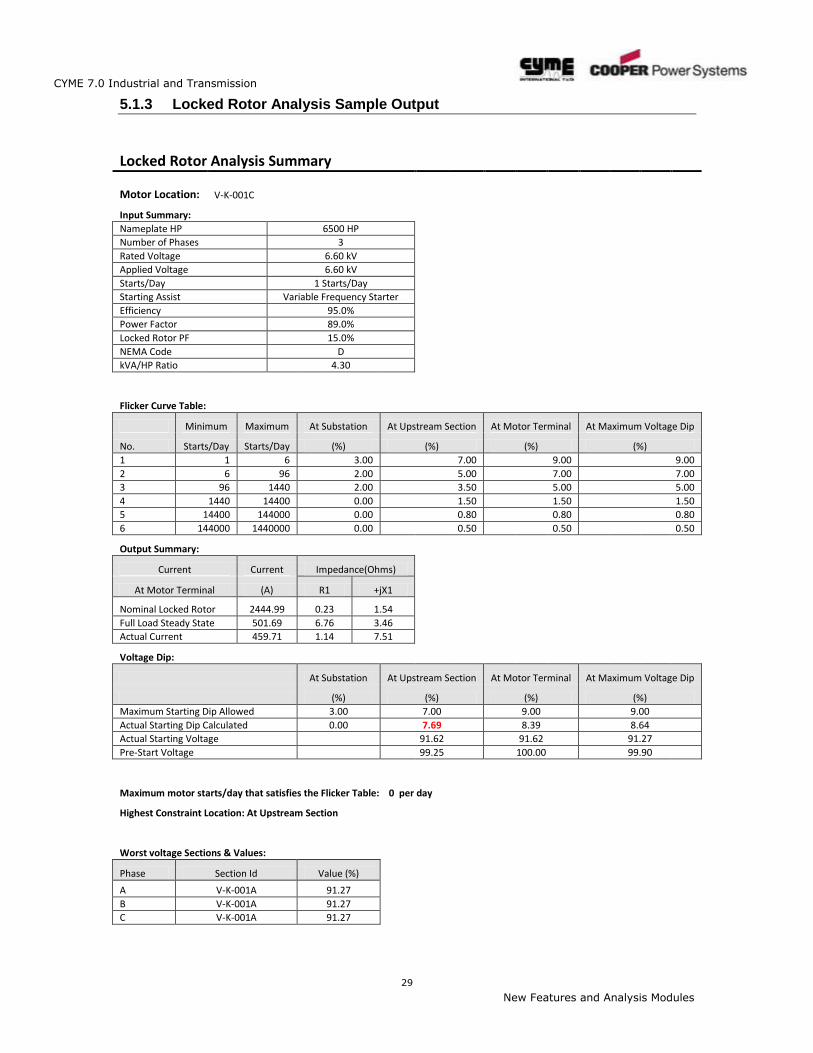
5.1.3 Locked Rotor Analysis Sample Output
Locked Rotor Analysis Summary Motor Location: V-K-001C
Input Summary:
Nameplate HP 6500 HP Number of Phases 3 Rated Voltage 6.60 kV Applied Voltage 6.60 kV Starts/Day 1 Starts/Day Starting Assist Variable Frequency Starter Efficiency 95.0% Power Factor 89.0% Locked Rotor PF 15.0% NEMA Code D kVA/HP Ratio 4.30
Flicker Curve Table:
Minimum Maximum At Substation At Upstream Section At Motor Terminal At Maximum Voltage Dip
No. Starts/Day Starts/Day (%) (%) (%) (%)
1 1 6 3.00 7.00 9.00 9.00
2 6 96 2.00 5.00 7.00 7.00
3 96 1440 2.00 3.50 5.00 5.00
4 1440 14400 0.00 1.50 1.50 1.50
5 14400 144000 0.00 0.80 0.80 0.80
6 144000 1440000 0.00 0.50 0.50 0.50
Output Summary:
Current Current Impedance(Ohms)
At Motor Terminal (A) R1 +jX1
Nominal Locked Rotor 2444.99 0.23 1.54 Full Load Steady State 501.69 6.76 3.46 Actual Current 459.71 1.14 7.51
Voltage Dip:
At Substation At Upstream Section At Motor Terminal At Maximum Voltage Dip
(%) (%) (%) (%)
Maximum Starting Dip Allowed 3.00 7.00 9.00 9.00
Actual Starting Dip Calculated 0.00 7.69 8.39 8.64
Actual Starting Voltage 91.62 91.62 91.27
Pre-Start Voltage 99.25 100.00 99.90
Maximum motor starts/day that satisfies the Flicker Table: 0 per day
Highest Constraint Location: At Upstream Section
Worst voltage Sections & Values:
Phase Section Id Value (%)
A V-K-001A 91.27 B V-K-001A 91.27 C V-K-001A 91.27
CYME 7.0 Industrial and Transmission
30
New Features and Analysis Modules
The detailed report is very similar to the power flow report.
You can customize the report output. To do this, select the Report > On calculation menu option to display the Reports dialog box; locate your report in the list and click on the Properties hyperlink. This will display the corresponding Report Properties dialog box, where you can edit the parameters of your report.
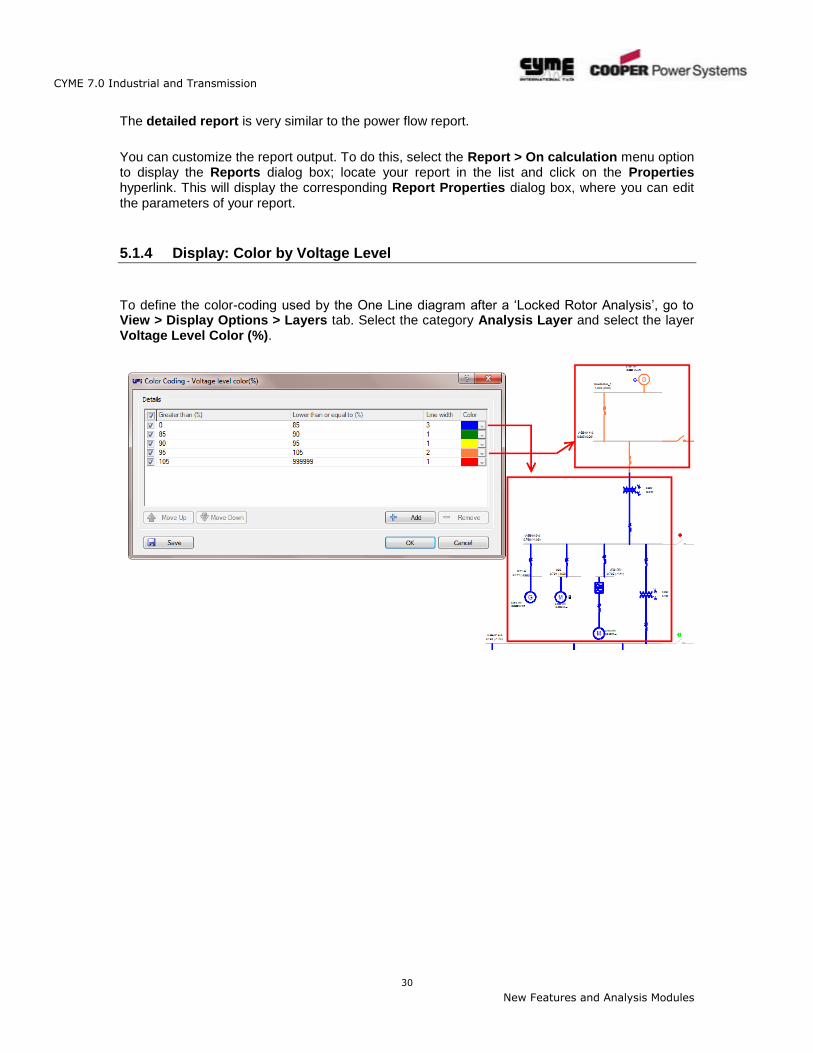
5.1.4 Display: Color by Voltage Level
To define the color-coding used by the One Line diagram after a ‘Locked Rotor Analysis’, go to View > Display Options > Layers tab. Select the category Analysis Layer and select the layer Voltage Level Color (%).
CYME 7.0 Industrial and Transmission
31
New Features and Analysis Modules
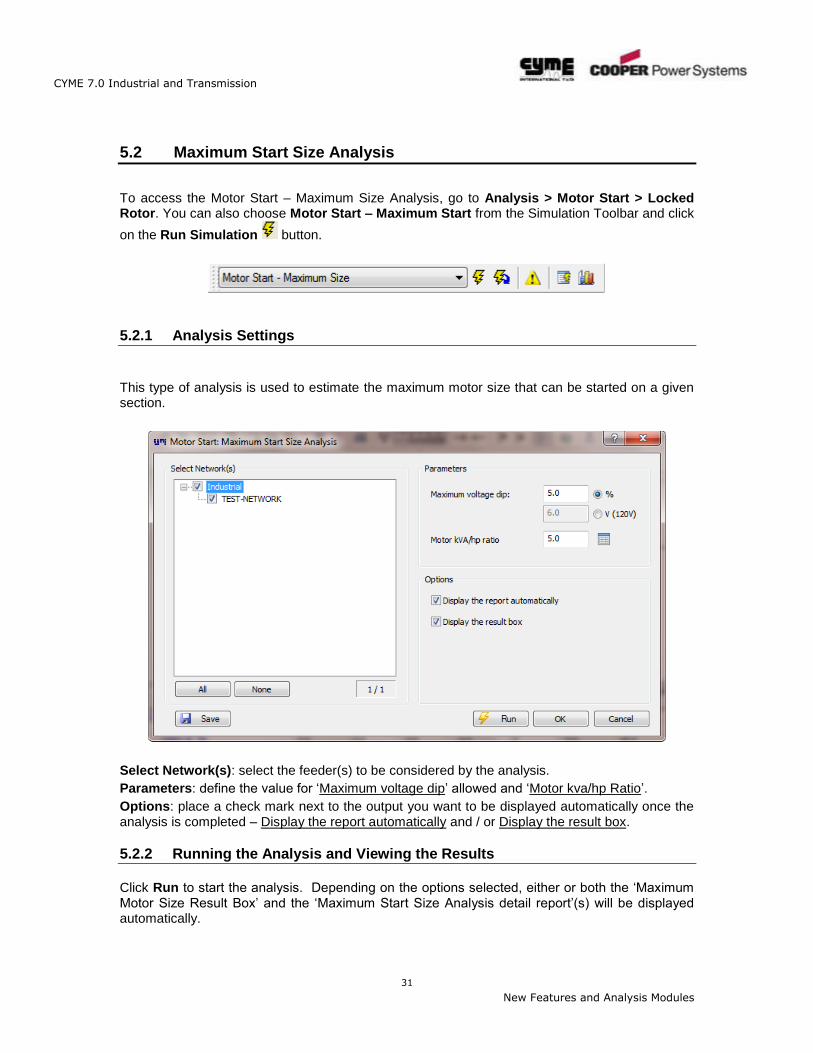
5.2 Maximum Start Size Analysis
To access the Motor Start – Maximum Size Analysis, go to Analysis > Motor Start > Locked Rotor. You can also choose Motor Start – Maximum Start from the Simulation Toolbar and click
on the Run Simulation button.
5.2.1 Analysis Settings
This type of analysis is used to estimate the maximum motor size that can be started on a given section.
Select Network(s): select the feeder(s) to be considered by the analysis.
Parameters: define the value for ‘Maximum voltage dip’ allowed and ‘Motor kva/hp Ratio’.
Options: place a check mark next to the output you want to be displayed automatically once the analysis is completed – Display the report automatically and / or Display the result box.
5.2.2 Running the Analysis and Viewing the Results
Click Run to start the analysis. Depending on the options selected, either or both the ‘Maximum Motor Size Result Box’ and the ‘Maximum Start Size Analysis detail report’(s) will be displayed automatically.
CYME 7.0 Industrial and Transmission
32
New Features and Analysis Modules
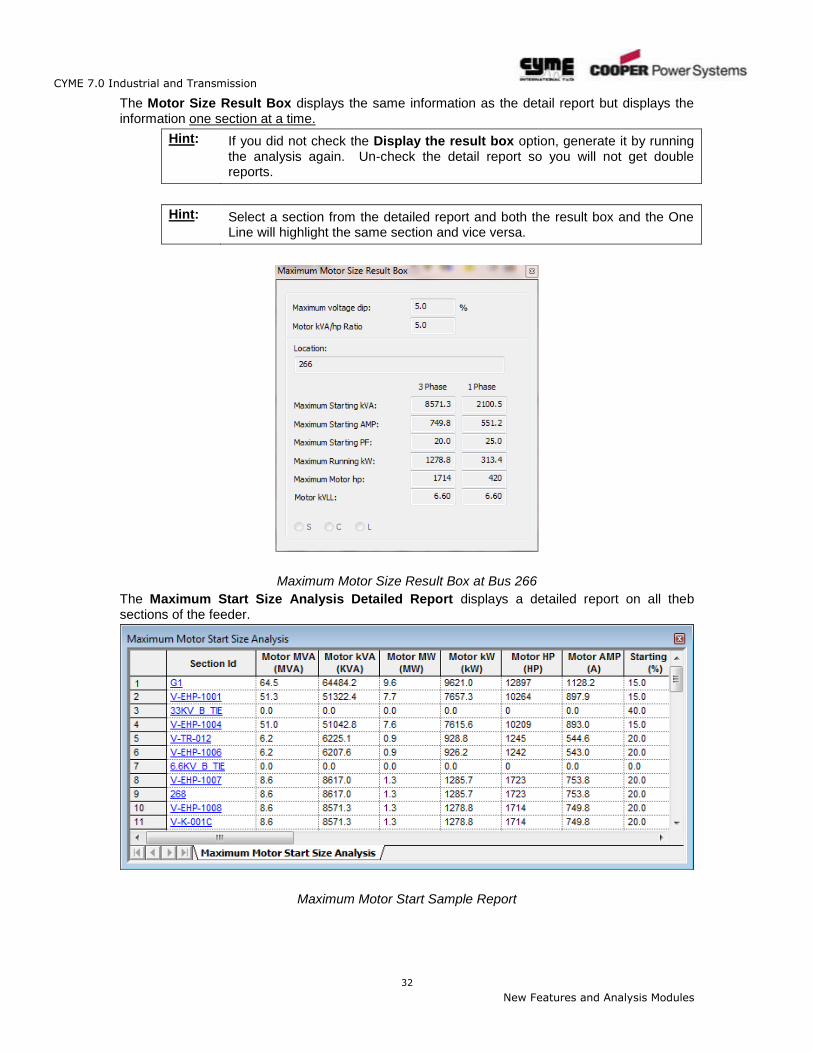
The Motor Size Result Box displays the same information as the detail report but displays the information one section at a time.
Hint: If you did not check the Display the result box option, generate it by running the analysis again. Un-check the detail report so you will not get double reports.
Hint: Select a section from the detailed report and both the result box and the One Line will highlight the same section and vice versa.
Maximum Motor Size Result Box at Bus 266
The Maximum Start Size Analysis Detailed Report displays a detailed report on all theb sections of the feeder.
Maximum Motor Start Sample Report
CYME 7.0 Industrial and Transmission
33
New Features and Analysis Modules
Chapter 6 DC Analysis
6.1 Introduction
DC Analysis is limited to networks that contain safe power supplies to critical equipment such as DC Motors, Valves and other loads that are required when the DC battery is supplying power to these loads due to a loss in the supply voltage to the Charger.
The equipment library has now been enhanced with the addition of DC equipment such as Station Batteries, Charger, Uninterruptable Power Supply (UPS) and DC / DC Converter.
In addition DC Cables, Impedance branch, protective devices, loads and machines are now included in the library which allows the user to build any DC network with all the necessary network components.
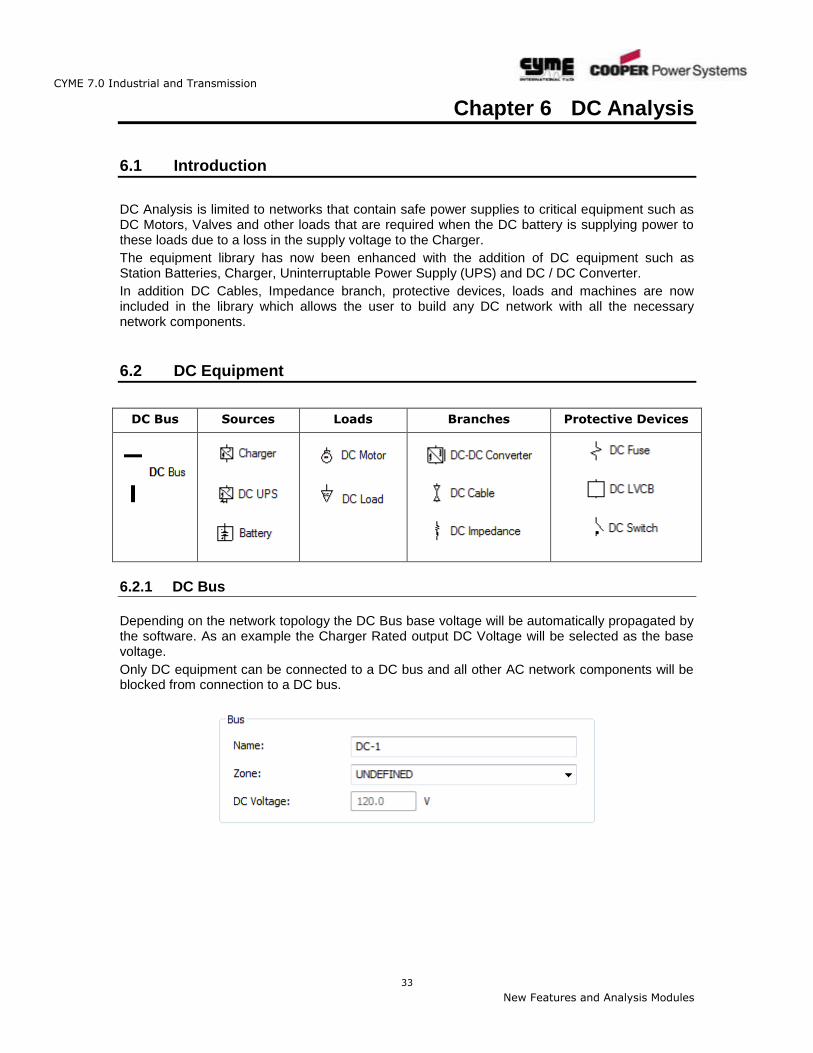
6.2 DC Equipment
DC Bus Sources Loads Branches Protective Devices
6.2.1 DC Bus
Depending on the network topology the DC Bus base voltage will be automatically propagated by the software. As an example the Charger Rated output DC Voltage will be selected as the base voltage.
Only DC equipment can be connected to a DC bus and all other AC network components will be blocked from connection to a DC bus.
CYME 7.0 Industrial and Transmission
34
New Features and Analysis Modules
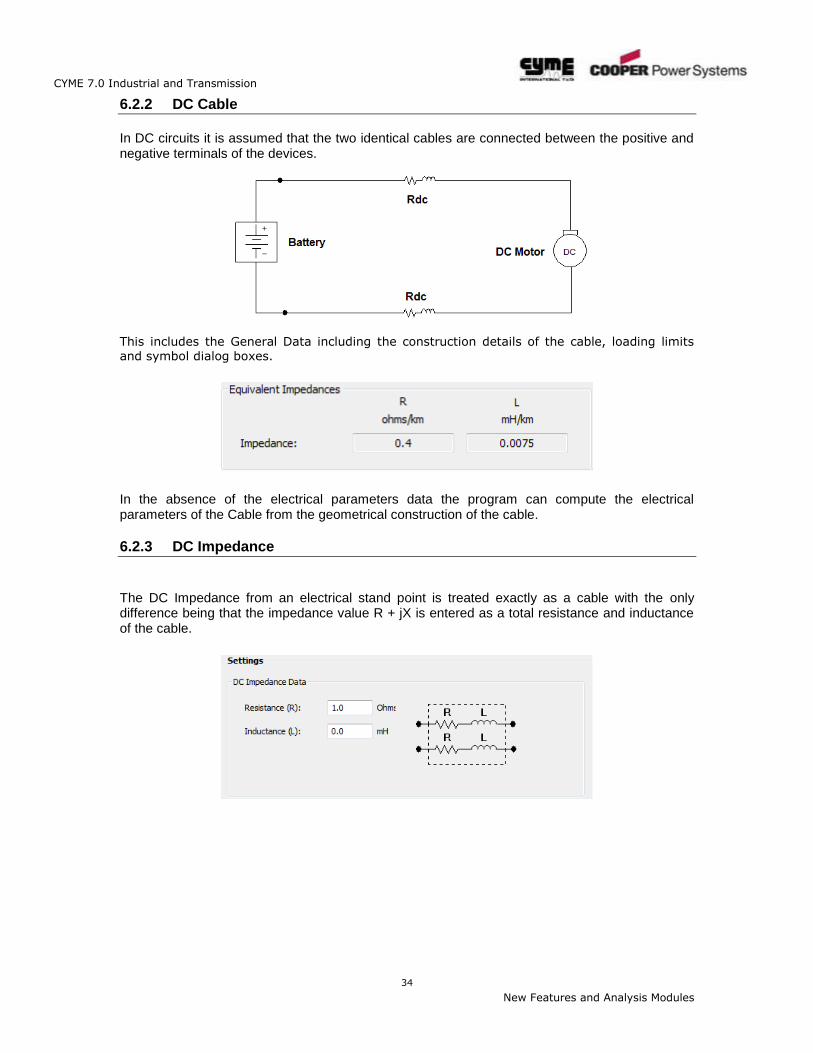
6.2.2 DC Cable
In DC circuits it is assumed that the two identical cables are connected between the positive and negative terminals of the devices.
This includes the General Data including the construction details of the cable, loading limits and symbol dialog boxes.
In the absence of the electrical parameters data the program can compute the electrical parameters of the Cable from the geometrical construction of the cable.
6.2.3 DC Impedance
The DC Impedance from an electrical stand point is treated exactly as a cable with the only difference being that the impedance value R + jX is entered as a total resistance and inductance of the cable.
CYME 7.0 Industrial and Transmission
35
New Features and Analysis Modules
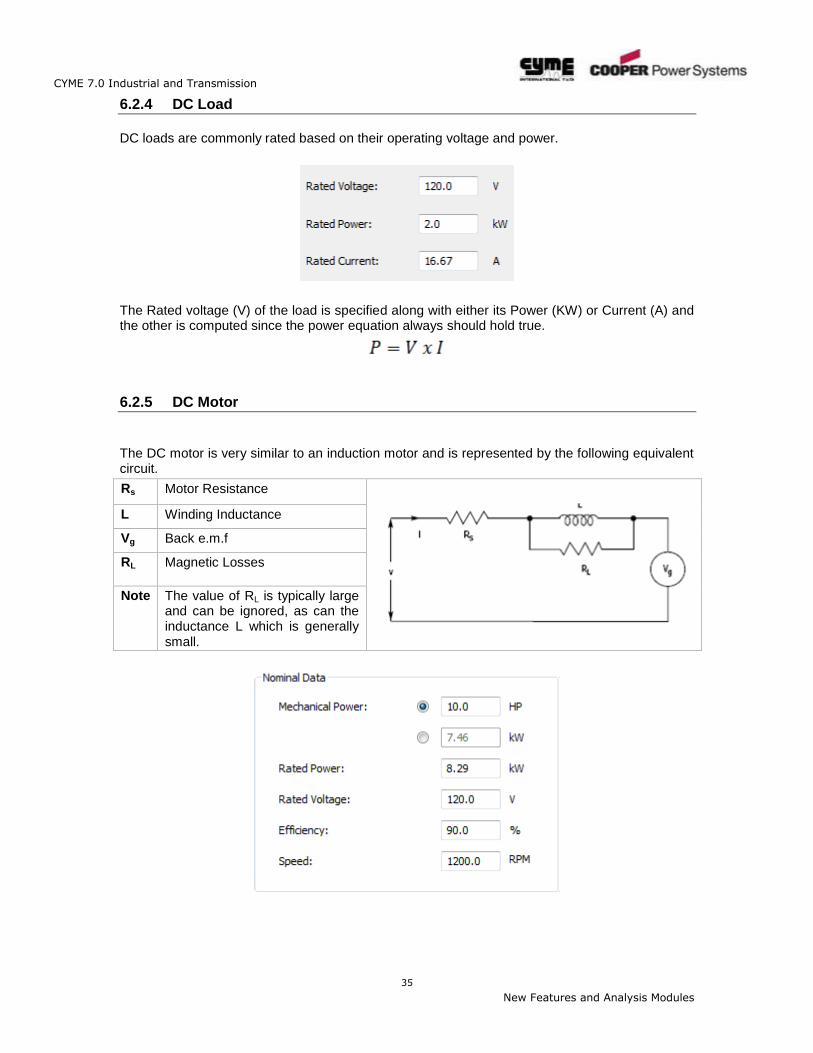
6.2.4 DC Load
DC loads are commonly rated based on their operating voltage and power.
The Rated voltage (V) of the load is specified along with either its Power (KW) or Current (A) and the other is computed since the power equation always should hold true.
6.2.5 DC Motor
The DC motor is very similar to an induction motor and is represented by the following equivalent circuit.
Rs Motor Resistance
L Winding Inductance
Vg Back e.m.f
RL Magnetic Losses
Note The value of RL is typically large and can be ignored, as can the inductance L which is generally small.
CYME 7.0 Industrial and Transmission
36
New Features and Analysis Modules
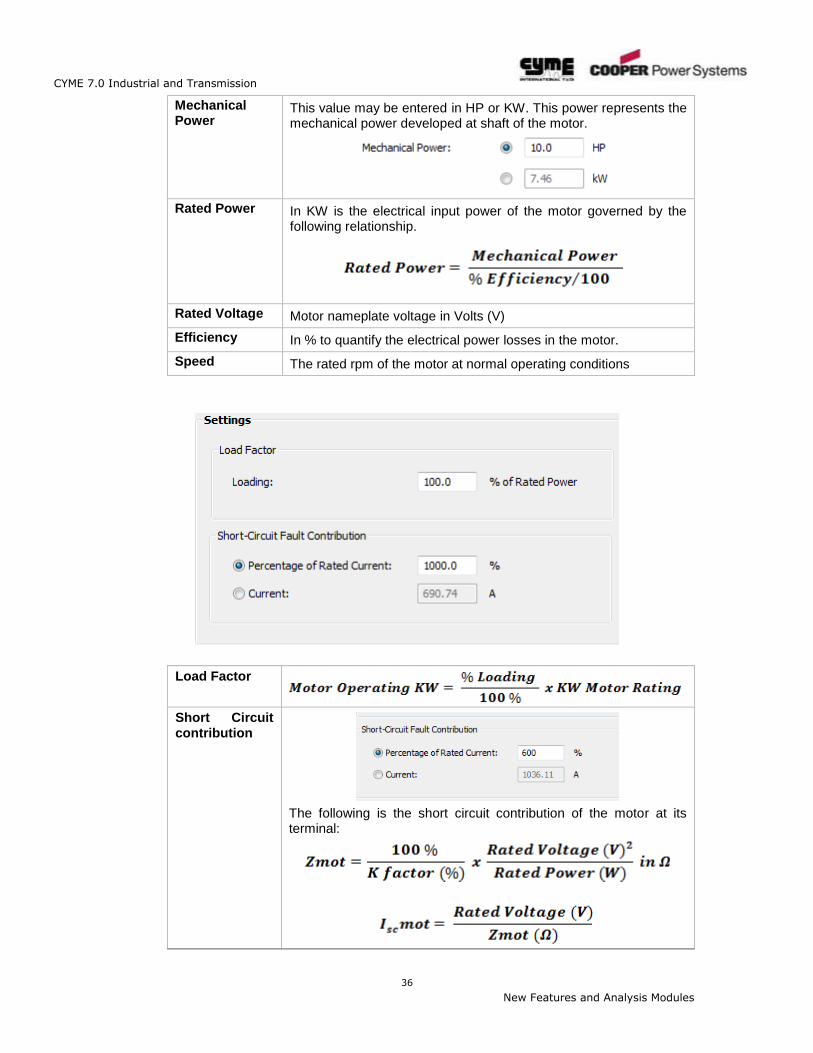
Mechanical Power
This value may be entered in HP or KW. This power represents the mechanical power developed at shaft of the motor.
Rated Power In KW is the electrical input power of the motor governed by the following relationship.
Rated Voltage Motor nameplate voltage in Volts (V)
Efficiency In % to quantify the electrical power losses in the motor.
Speed The rated rpm of the motor at normal operating conditions
Load Factor
Short Circuit contribution
The following is the short circuit contribution of the motor at its terminal:
CYME 7.0 Industrial and Transmission
37
New Features and Analysis Modules
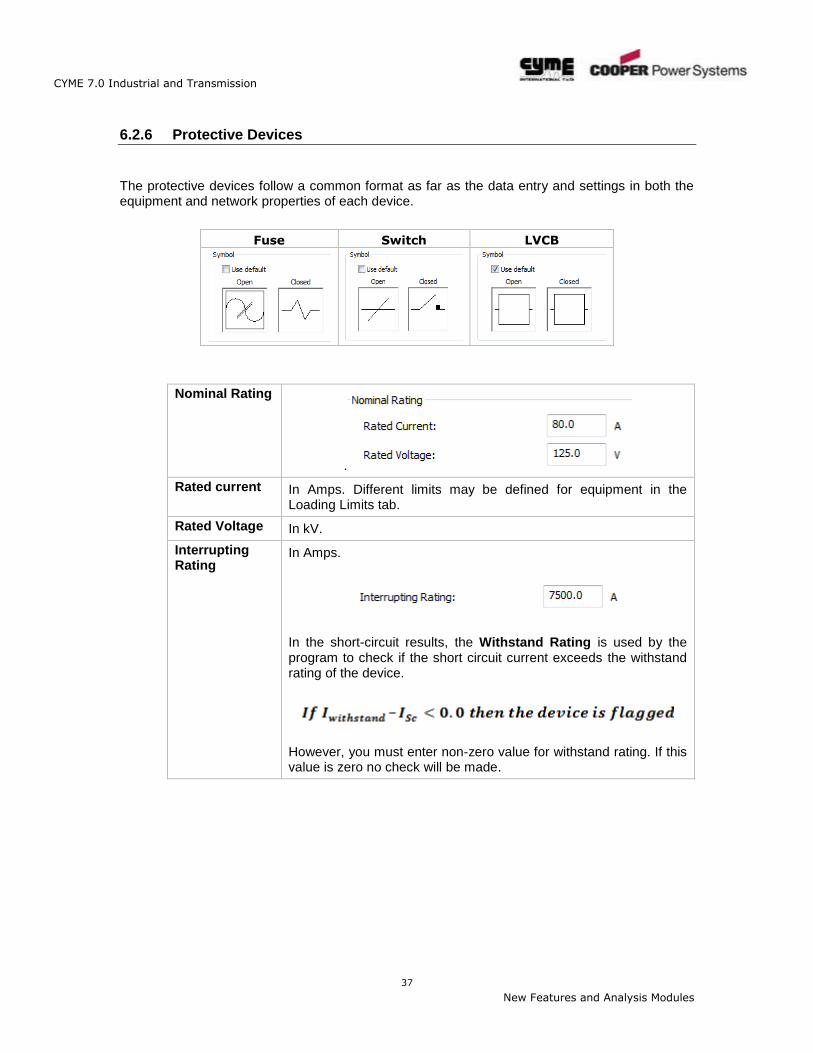
6.2.6 Protective Devices
The protective devices follow a common format as far as the data entry and settings in both the equipment and network properties of each device.
Fuse Switch LVCB
Nominal Rating
.
Rated current In Amps. Different limits may be defined for equipment in the Loading Limits tab.
Rated Voltage In kV.
Interrupting Rating
In Amps.
In the short-circuit results, the Withstand Rating is used by the program to check if the short circuit current exceeds the withstand rating of the device.
However, you must enter non-zero value for withstand rating. If this value is zero no check will be made.
CYME 7.0 Industrial and Transmission
38
New Features and Analysis Modules
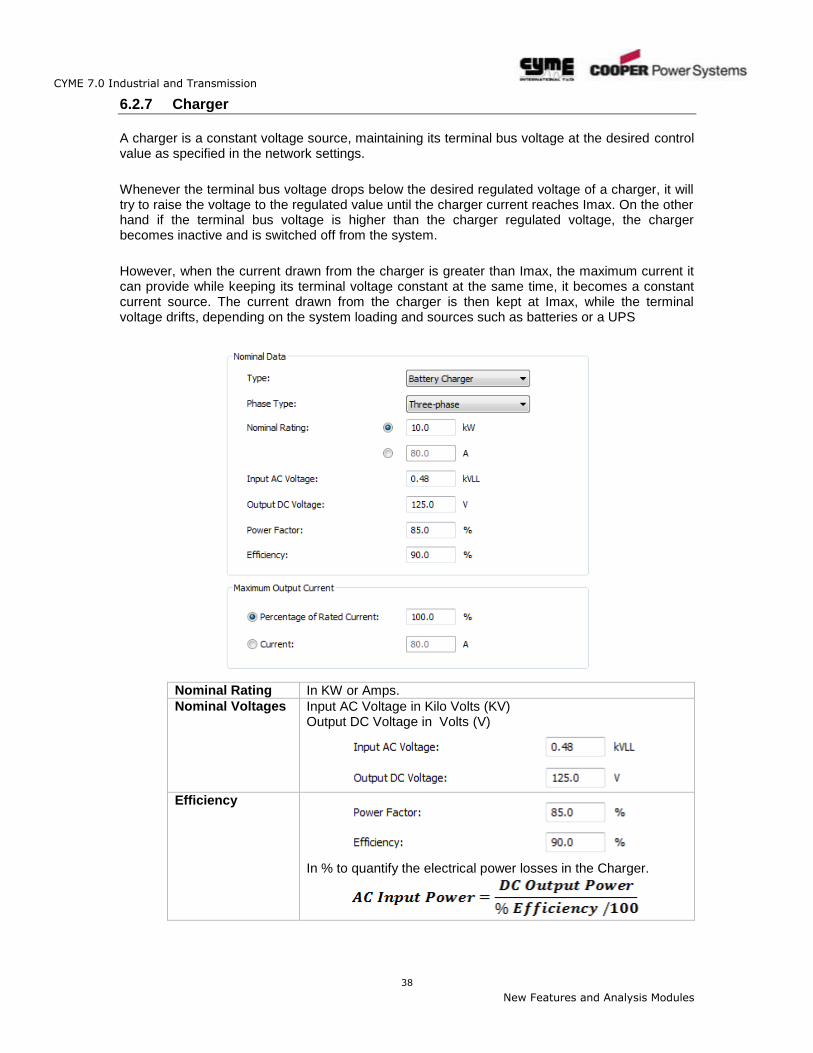
6.2.7 Charger
A charger is a constant voltage source, maintaining its terminal bus voltage at the desired control value as specified in the network settings.
Whenever the terminal bus voltage drops below the desired regulated voltage of a charger, it will try to raise the voltage to the regulated value until the charger current reaches Imax. On the other hand if the terminal bus voltage is higher than the charger regulated voltage, the charger becomes inactive and is switched off from the system.
However, when the current drawn from the charger is greater than Imax, the maximum current it can provide while keeping its terminal voltage constant at the same time, it becomes a constant current source. The current drawn from the charger is then kept at Imax, while the terminal voltage drifts, depending on the system loading and sources such as batteries or a UPS
Nominal Rating In KW or Amps.
Nominal Voltages Input AC Voltage in Kilo Volts (KV) Output DC Voltage in Volts (V)
Efficiency
In % to quantify the electrical power losses in the Charger.
CYME 7.0 Industrial and Transmission
39
New Features and Analysis Modules
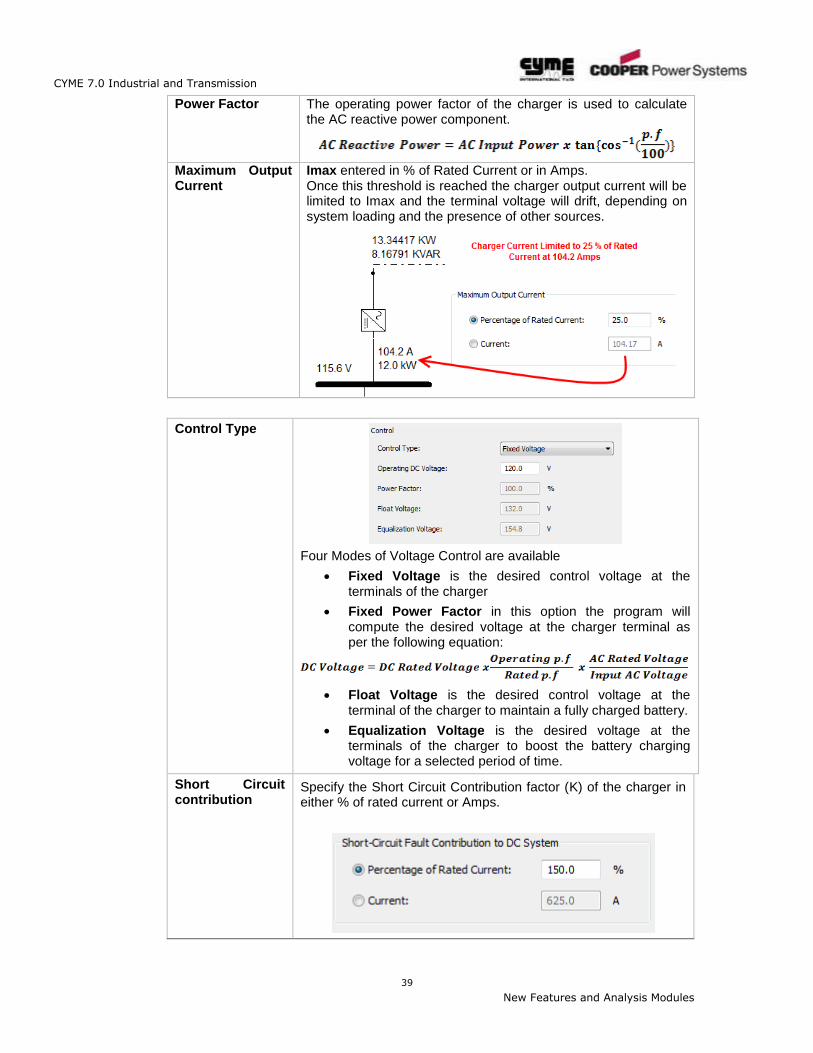
Power Factor The operating power factor of the charger is used to calculate the AC reactive power component.
Maximum Output Current
Imax entered in % of Rated Current or in Amps. Once this threshold is reached the charger output current will be limited to Imax and the terminal voltage will drift, depending on system loading and the presence of other sources.
Control Type
Four Modes of Voltage Control are available
Fixed Voltage is the desired control voltage at the terminals of the charger
Fixed Power Factor in this option the program will compute the desired voltage at the charger terminal as per the following equation:
Float Voltage is the desired control voltage at the terminal of the charger to maintain a fully charged battery.
Equalization Voltage is the desired voltage at the terminals of the charger to boost the battery charging voltage for a selected period of time.
Short Circuit contribution
Specify the Short Circuit Contribution factor (K) of the charger in either % of rated current or Amps.
CYME 7.0 Industrial and Transmission
40
New Features and Analysis Modules
6.2.8 Uninterruptable Power Supply (UPS)
A DC UPS is similar to a Charger since it is series component with AC and DC sides.
A DC UPS which is a system by itself composed of a charger and a battery which are controlled to feed a dc network during a shutdown. The data and dialog boxes are pretty similar. The only difference is that there’s only one type of DC UPS.
The DC battery within the UPS is not modeled at the present time.
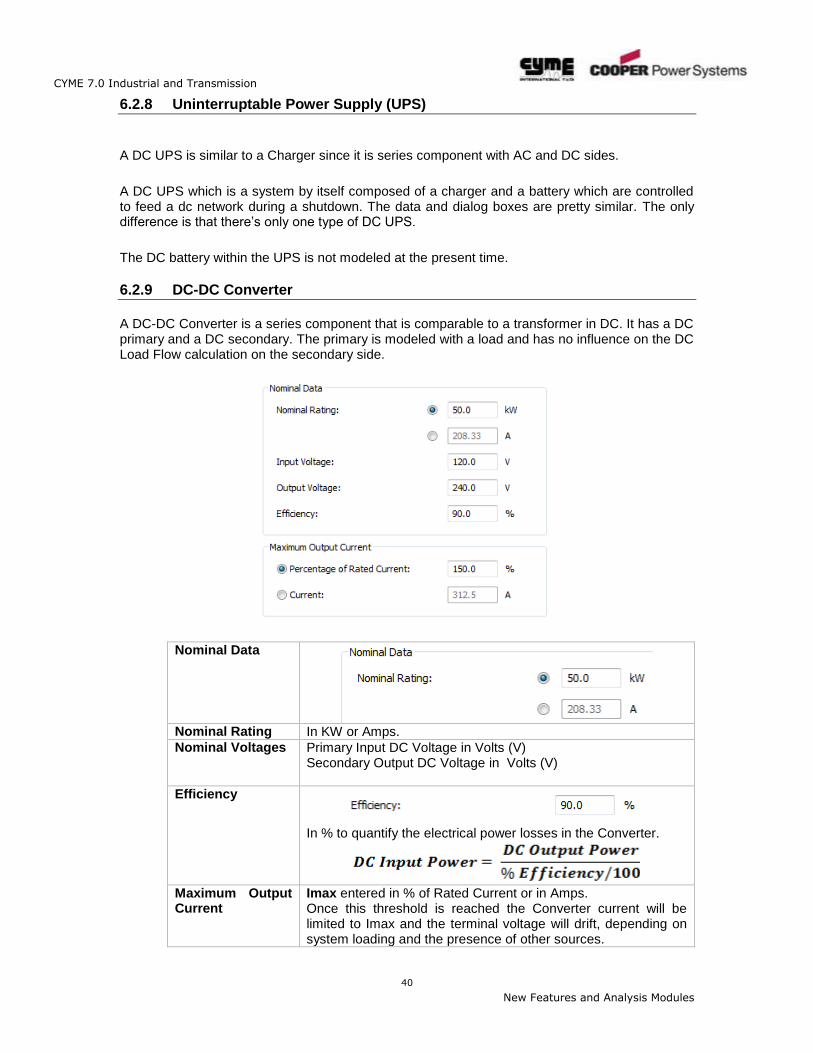
6.2.9 DC-DC Converter
A DC-DC Converter is a series component that is comparable to a transformer in DC. It has a DC primary and a DC secondary. The primary is modeled with a load and has no influence on the DC Load Flow calculation on the secondary side.
Nominal Data
Nominal Rating In KW or Amps.
Nominal Voltages Primary Input DC Voltage in Volts (V) Secondary Output DC Voltage in Volts (V)
Efficiency
In % to quantify the electrical power losses in the Converter.
Maximum Output Current
Imax entered in % of Rated Current or in Amps. Once this threshold is reached the Converter current will be limited to Imax and the terminal voltage will drift, depending on system loading and the presence of other sources.
CYME 7.0 Industrial and Transmission
41
New Features and Analysis Modules
Control Type Operating output DC Voltage in % of rated secondary voltage or Volts
Short Circuit contribution
Specify the Short Circuit Contribution factor (K) of the Converter Secondary in either % of rated current or Amps.
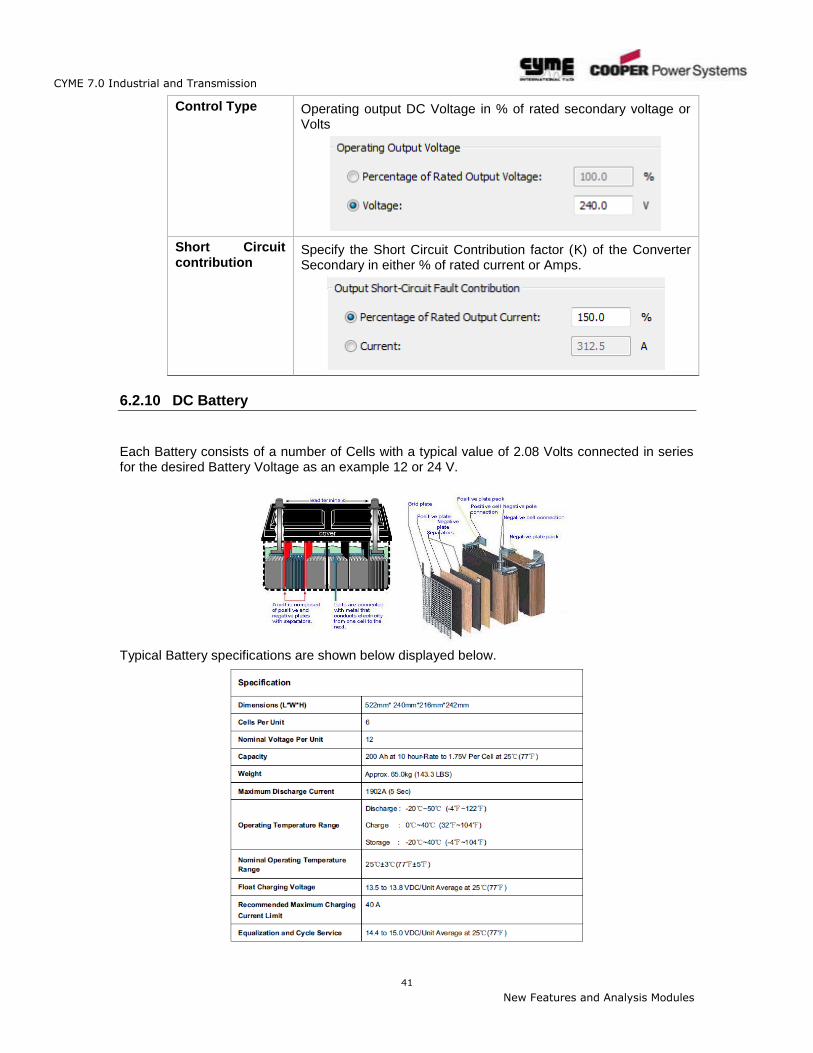
6.2.10 DC Battery
Each Battery consists of a number of Cells with a typical value of 2.08 Volts connected in series for the desired Battery Voltage as an example 12 or 24 V.
Typical Battery specifications are shown below displayed below.
CYME 7.0 Industrial and Transmission
42
New Features and Analysis Modules
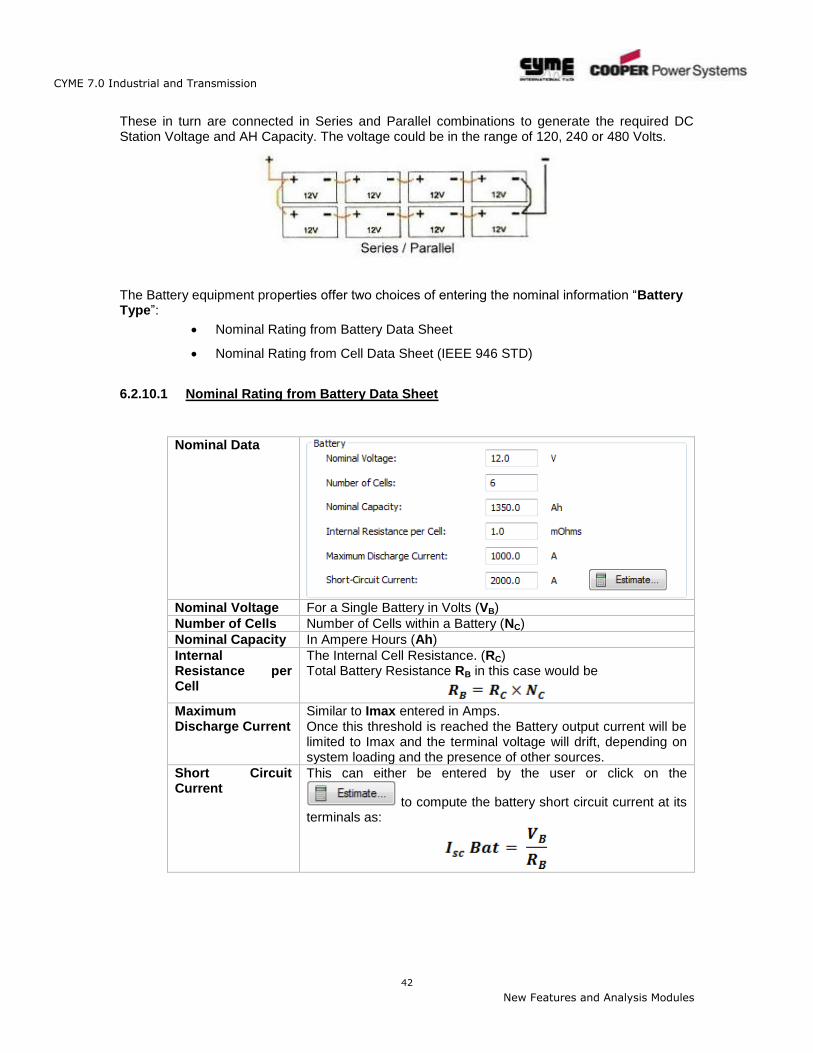
These in turn are connected in Series and Parallel combinations to generate the required DC Station Voltage and AH Capacity. The voltage could be in the range of 120, 240 or 480 Volts.
The Battery equipment properties offer two choices of entering the nominal information “Battery Type”:
Nominal Rating from Battery Data Sheet
Nominal Rating from Cell Data Sheet (IEEE 946 STD)
6.2.10.1 Nominal Rating from Battery Data Sheet
Nominal Data
Nominal Voltage For a Single Battery in Volts (VB)
Number of Cells Number of Cells within a Battery (NC)
Nominal Capacity In Ampere Hours (Ah)
Internal Resistance per Cell
The Internal Cell Resistance. (RC) Total Battery Resistance RB in this case would be
Maximum Discharge Current
Similar to Imax entered in Amps. Once this threshold is reached the Battery output current will be limited to Imax and the terminal voltage will drift, depending on system loading and the presence of other sources.
Short Circuit Current
This can either be entered by the user or click on the
to compute the battery short circuit current at its terminals as:
CYME 7.0 Industrial and Transmission
43
New Features and Analysis Modules
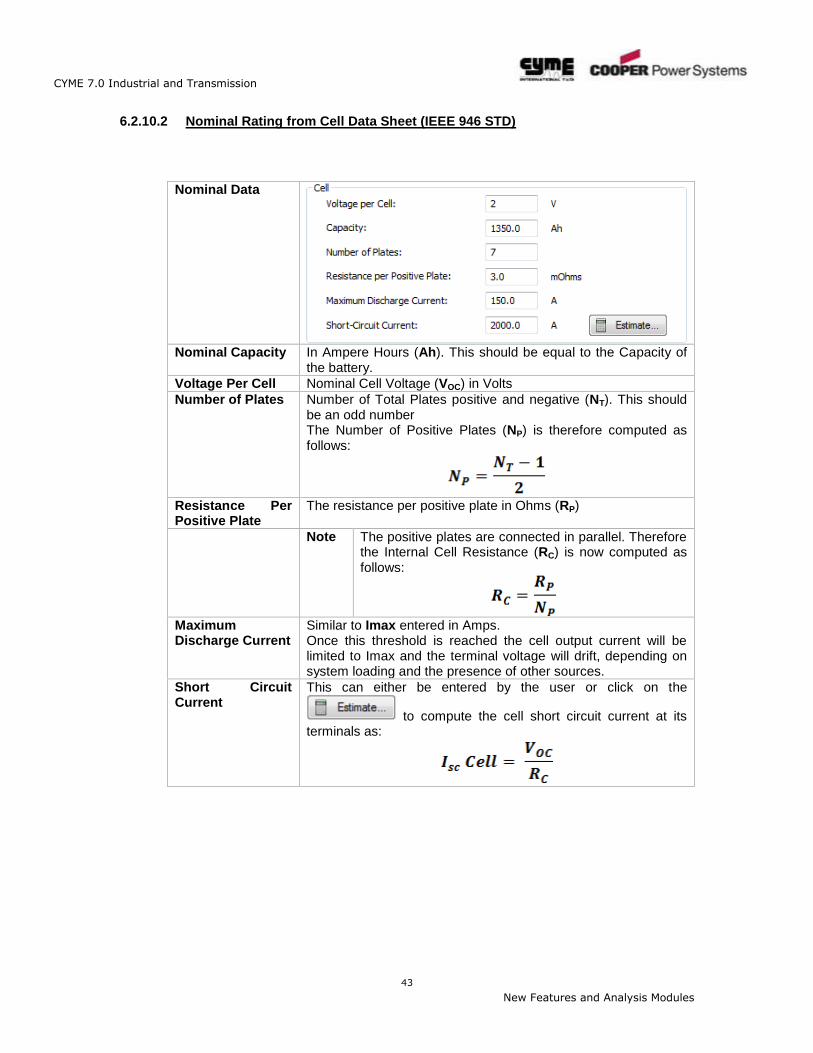
6.2.10.2 Nominal Rating from Cell Data Sheet (IEEE 946 STD)
Nominal Data
Nominal Capacity In Ampere Hours (Ah). This should be equal to the Capacity of
the battery.
Voltage Per Cell Nominal Cell Voltage (VOC) in Volts
Number of Plates Number of Total Plates positive and negative (NT). This should be an odd number The Number of Positive Plates (NP) is therefore computed as follows:
Resistance Per Positive Plate
The resistance per positive plate in Ohms (RP)
Note The positive plates are connected in parallel. Therefore the Internal Cell Resistance (RC) is now computed as follows:
Maximum Discharge Current
Similar to Imax entered in Amps. Once this threshold is reached the cell output current will be limited to Imax and the terminal voltage will drift, depending on system loading and the presence of other sources.
Short Circuit Current
This can either be entered by the user or click on the
to compute the cell short circuit current at its terminals as:
CYME 7.0 Industrial and Transmission
44
New Features and Analysis Modules
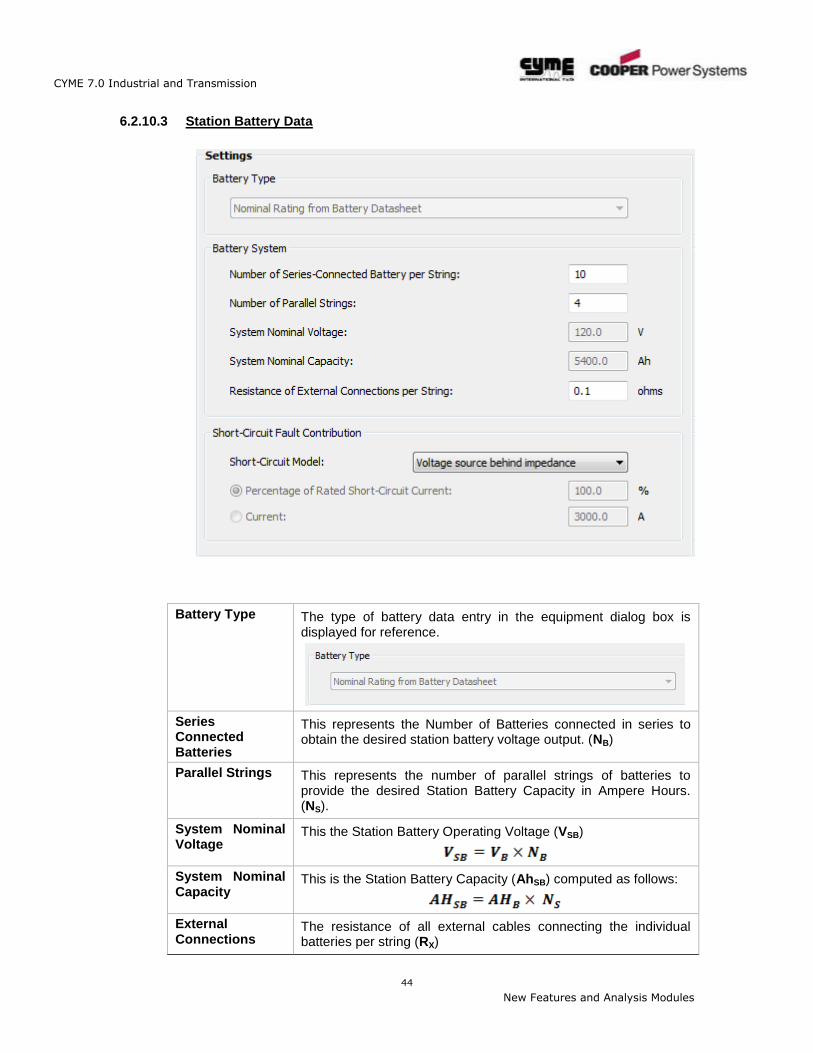
6.2.10.3 Station Battery Data
Battery Type The type of battery data entry in the equipment dialog box is displayed for reference.
Series Connected Batteries
This represents the Number of Batteries connected in series to obtain the desired station battery voltage output. (NB)
Parallel Strings This represents the number of parallel strings of batteries to provide the desired Station Battery Capacity in Ampere Hours. (NS).
System Nominal Voltage
This the Station Battery Operating Voltage (VSB)
System Nominal Capacity
This is the Station Battery Capacity (AhSB) computed as follows:
External Connections
The resistance of all external cables connecting the individual batteries per string (RX)
CYME 7.0 Industrial and Transmission
45
New Features and Analysis Modules
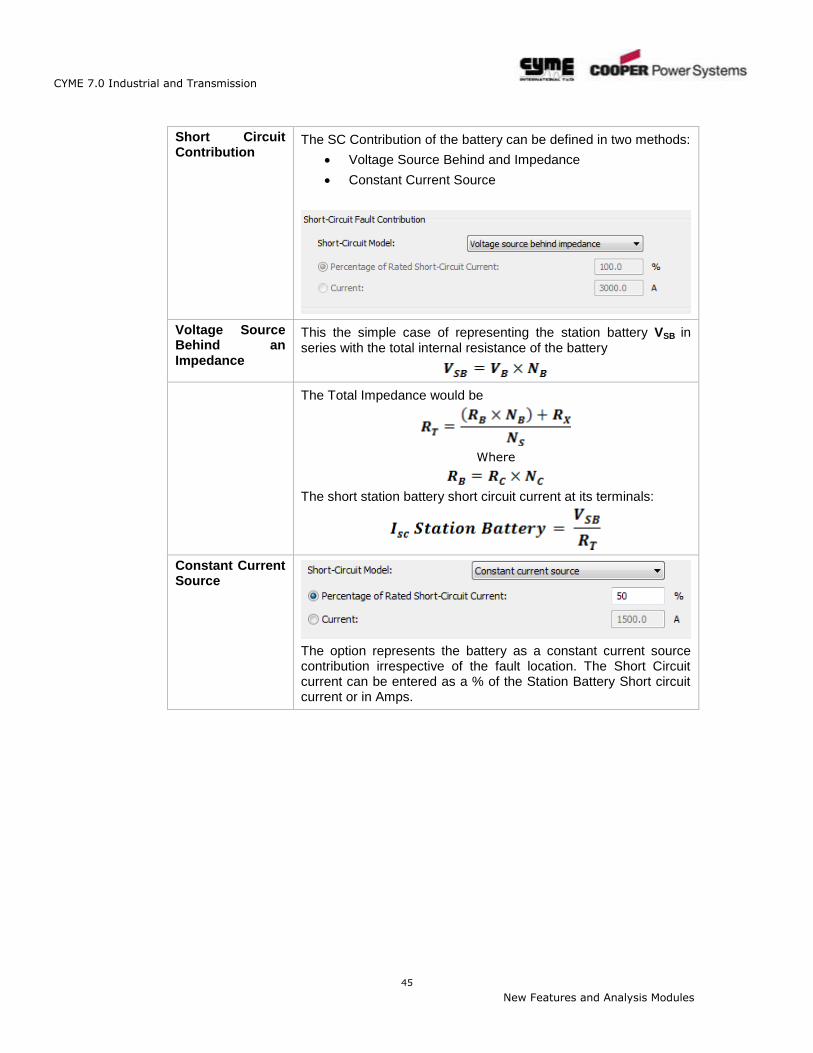
Short Circuit Contribution
The SC Contribution of the battery can be defined in two methods:
Voltage Source Behind and Impedance
Constant Current Source
Voltage Source Behind an Impedance
This the simple case of representing the station battery VSB in series with the total internal resistance of the battery
The Total Impedance would be
Where
The short station battery short circuit current at its terminals:
Constant Current Source
The option represents the battery as a constant current source contribution irrespective of the fault location. The Short Circuit current can be entered as a % of the Station Battery Short circuit current or in Amps.
CYME 7.0 Industrial and Transmission
46
New Features and Analysis Modules
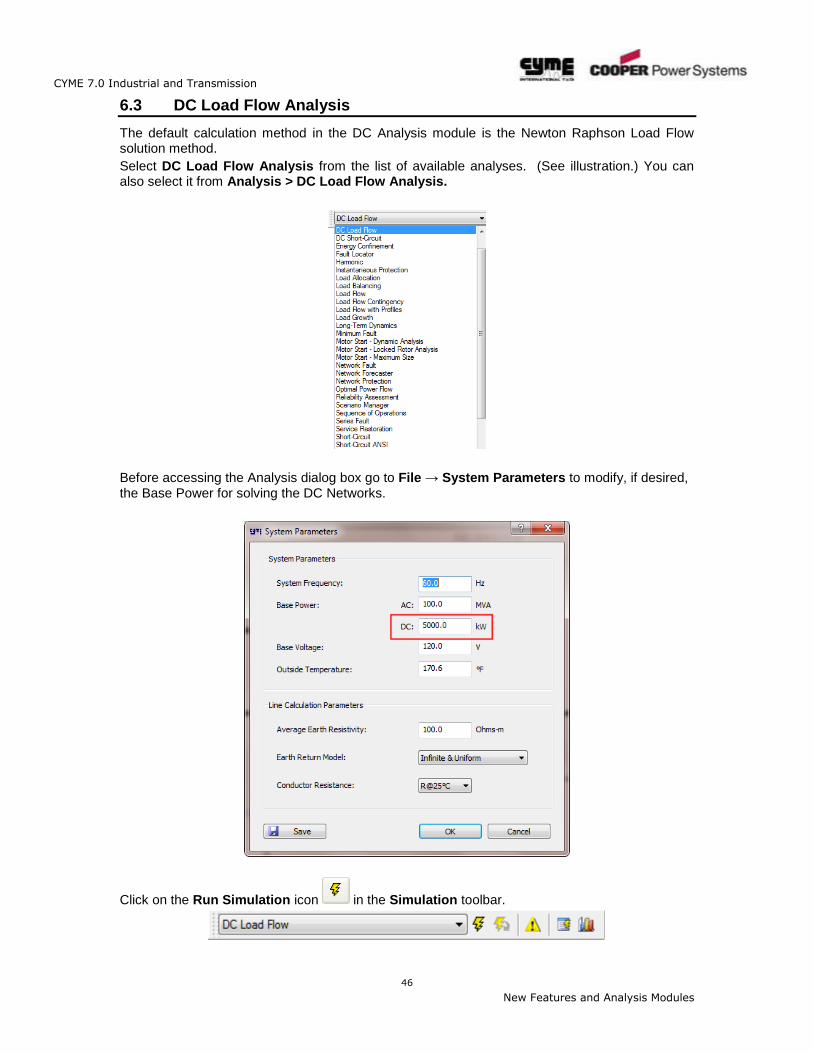
6.3 DC Load Flow Analysis
The default calculation method in the DC Analysis module is the Newton Raphson Load Flow solution method.
Select DC Load Flow Analysis from the list of available analyses. (See illustration.) You can also select it from Analysis > DC Load Flow Analysis.
Before accessing the Analysis dialog box go to File → System Parameters to modify, if desired, the Base Power for solving the DC Networks.
Click on the Run Simulation icon in the Simulation toolbar.
CYME 7.0 Industrial and Transmission
47
New Features and Analysis Modules
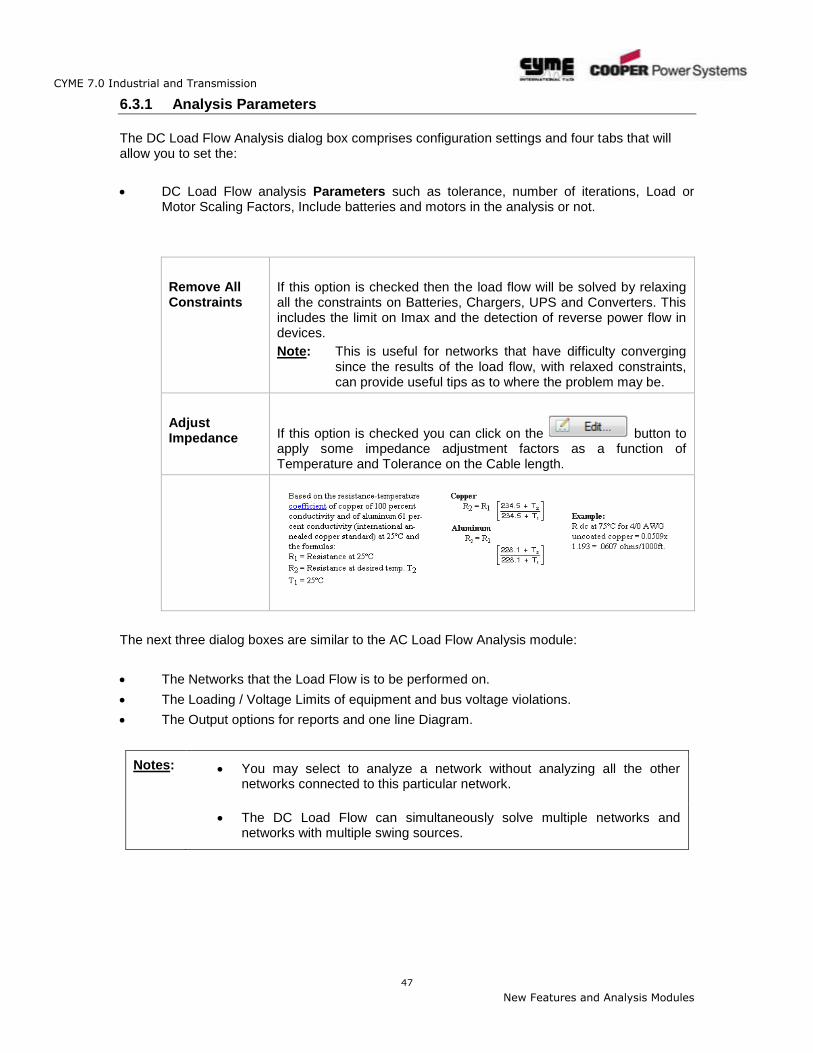
6.3.1 Analysis Parameters
The DC Load Flow Analysis dialog box comprises configuration settings and four tabs that will allow you to set the:
DC Load Flow analysis Parameters such as tolerance, number of iterations, Load or Motor Scaling Factors, Include batteries and motors in the analysis or not.
Remove All Constraints
If this option is checked then the load flow will be solved by relaxing all the constraints on Batteries, Chargers, UPS and Converters. This includes the limit on Imax and the detection of reverse power flow in devices.
Note: This is useful for networks that have difficulty converging since the results of the load flow, with relaxed constraints, can provide useful tips as to where the problem may be.
Adjust Impedance
If this option is checked you can click on the button to apply some impedance adjustment factors as a function of Temperature and Tolerance on the Cable length.
The next three dialog boxes are similar to the AC Load Flow Analysis module:
The Networks that the Load Flow is to be performed on.
The Loading / Voltage Limits of equipment and bus voltage violations.
The Output options for reports and one line Diagram.
Notes: You may select to analyze a network without analyzing all the other networks connected to this particular network.
The DC Load Flow can simultaneously solve multiple networks and networks with multiple swing sources.
CYME 7.0 Industrial and Transmission
48
New Features and Analysis Modules
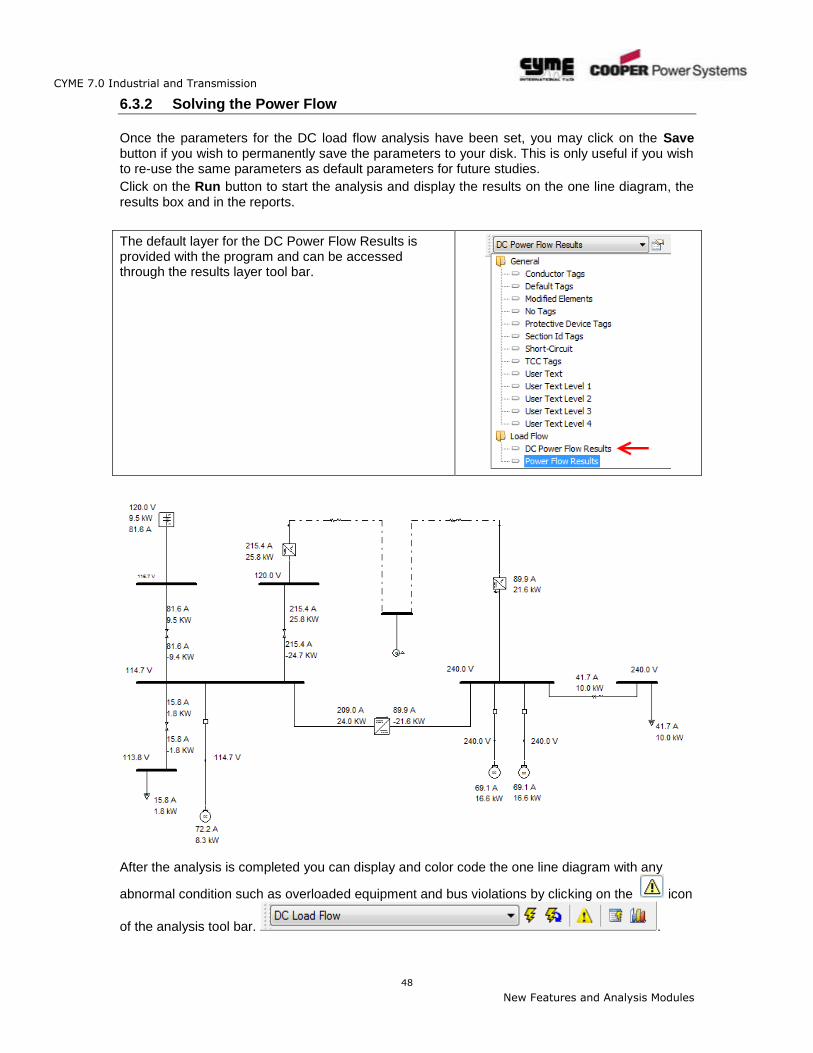
6.3.2 Solving the Power Flow
Once the parameters for the DC load flow analysis have been set, you may click on the Save button if you wish to permanently save the parameters to your disk. This is only useful if you wish to re-use the same parameters as default parameters for future studies.
Click on the Run button to start the analysis and display the results on the one line diagram, the results box and in the reports.
The default layer for the DC Power Flow Results is provided with the program and can be accessed through the results layer tool bar.
After the analysis is completed you can display and color code the one line diagram with any
abnormal condition such as overloaded equipment and bus violations by clicking on the icon
of the analysis tool bar. .
CYME 7.0 Industrial and Transmission
49
New Features and Analysis Modules
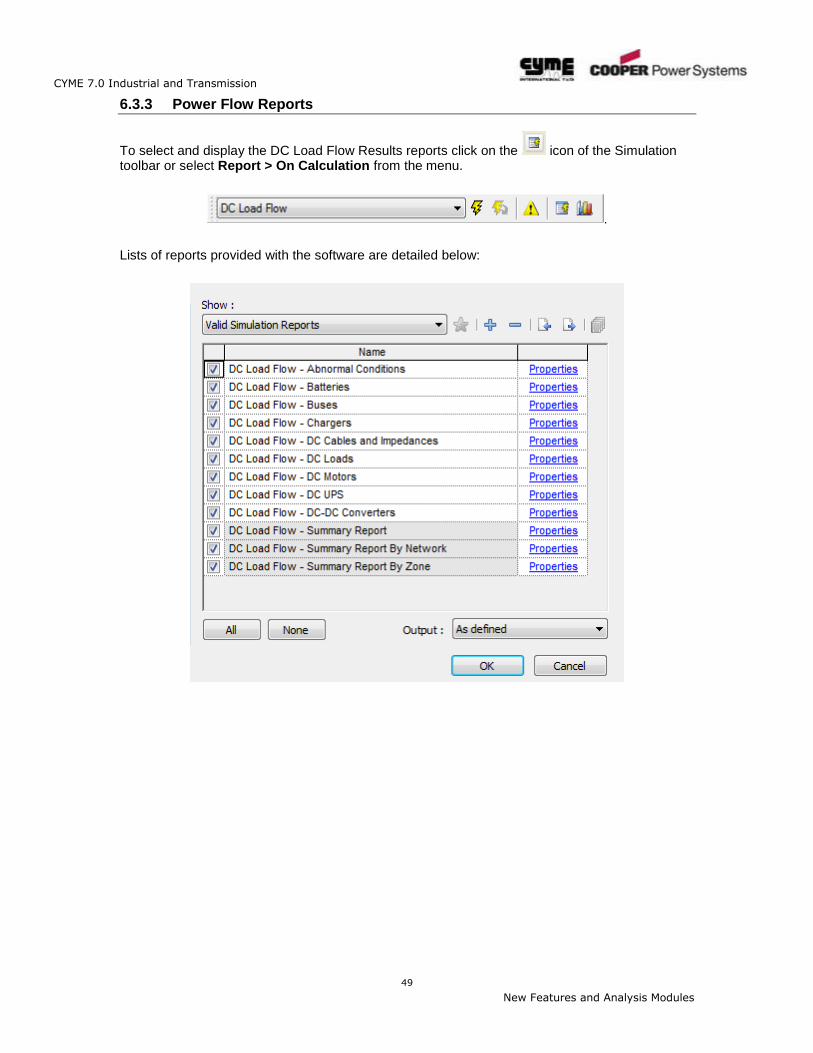
6.3.3 Power Flow Reports
To select and display the DC Load Flow Results reports click on the icon of the Simulation toolbar or select Report > On Calculation from the menu.
.
Lists of reports provided with the software are detailed below:
CYME 7.0 Industrial and Transmission
50
New Features and Analysis Modules
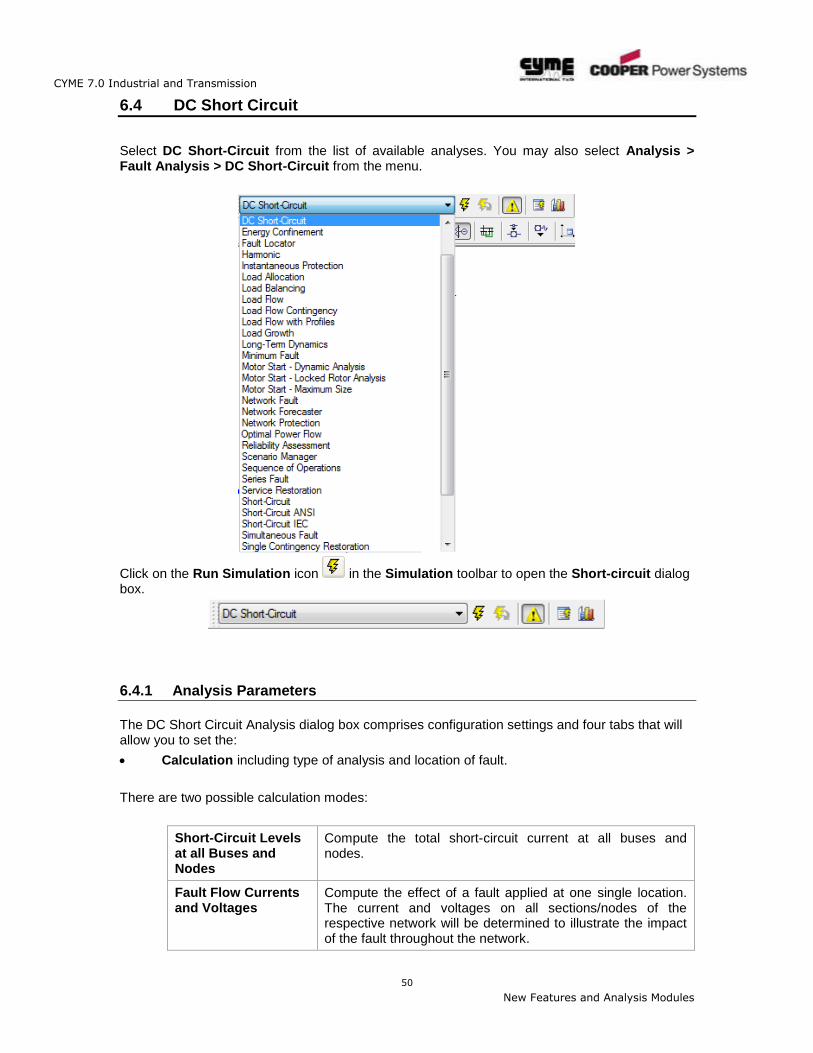
6.4 DC Short Circuit
Select DC Short-Circuit from the list of available analyses. You may also select Analysis > Fault Analysis > DC Short-Circuit from the menu.
Click on the Run Simulation icon in the Simulation toolbar to open the Short-circuit dialog box.
6.4.1 Analysis Parameters
The DC Short Circuit Analysis dialog box comprises configuration settings and four tabs that will allow you to set the:
Calculation including type of analysis and location of fault.
There are two possible calculation modes:
Short-Circuit Levels at all Buses and Nodes
Compute the total short-circuit current at all buses and nodes.
Fault Flow Currents and Voltages
Compute the effect of a fault applied at one single location. The current and voltages on all sections/nodes of the respective network will be determined to illustrate the impact of the fault throughout the network.
CYME 7.0 Industrial and Transmission
51
New Features and Analysis Modules
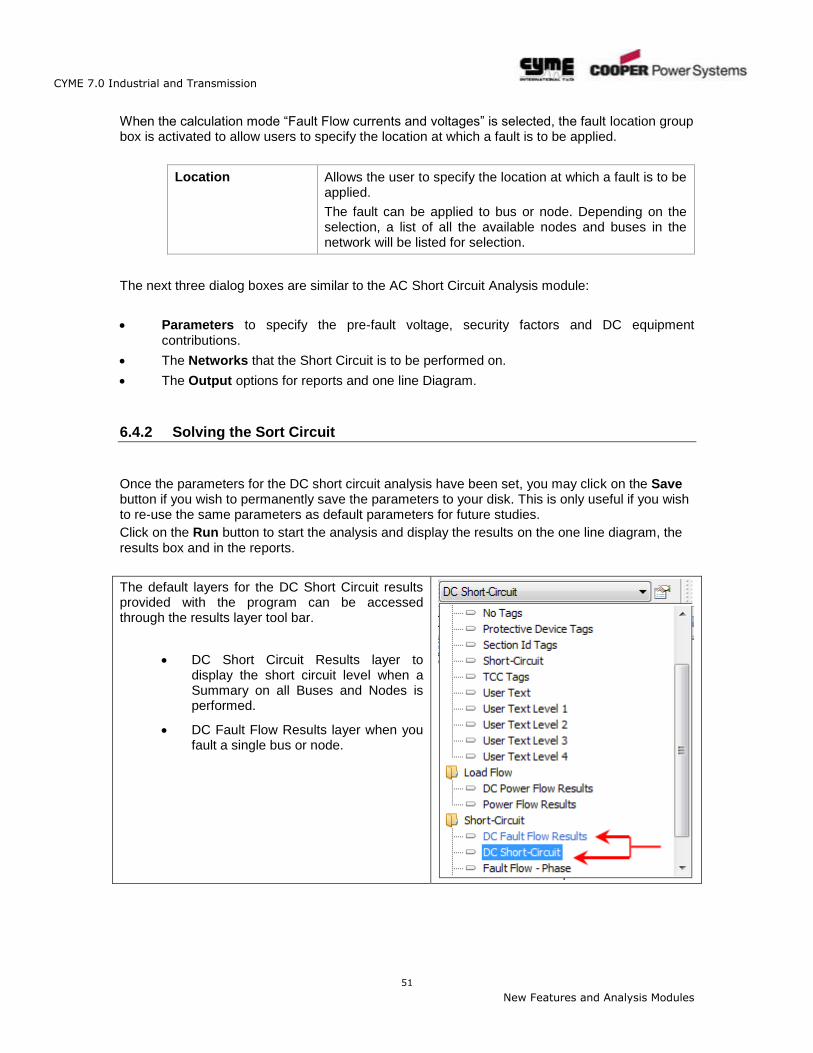
When the calculation mode “Fault Flow currents and voltages” is selected, the fault location group box is activated to allow users to specify the location at which a fault is to be applied.
Location Allows the user to specify the location at which a fault is to be applied.
The fault can be applied to bus or node. Depending on the selection, a list of all the available nodes and buses in the network will be listed for selection.
The next three dialog boxes are similar to the AC Short Circuit Analysis module:
Parameters to specify the pre-fault voltage, security factors and DC equipment contributions.
The Networks that the Short Circuit is to be performed on.
The Output options for reports and one line Diagram.
6.4.2 Solving the Sort Circuit
Once the parameters for the DC short circuit analysis have been set, you may click on the Save button if you wish to permanently save the parameters to your disk. This is only useful if you wish to re-use the same parameters as default parameters for future studies.
Click on the Run button to start the analysis and display the results on the one line diagram, the results box and in the reports.
The default layers for the DC Short Circuit results provided with the program can be accessed through the results layer tool bar.
DC Short Circuit Results layer to display the short circuit level when a Summary on all Buses and Nodes is performed.
DC Fault Flow Results layer when you fault a single bus or node.
CYME 7.0 Industrial and Transmission
52
New Features and Analysis Modules
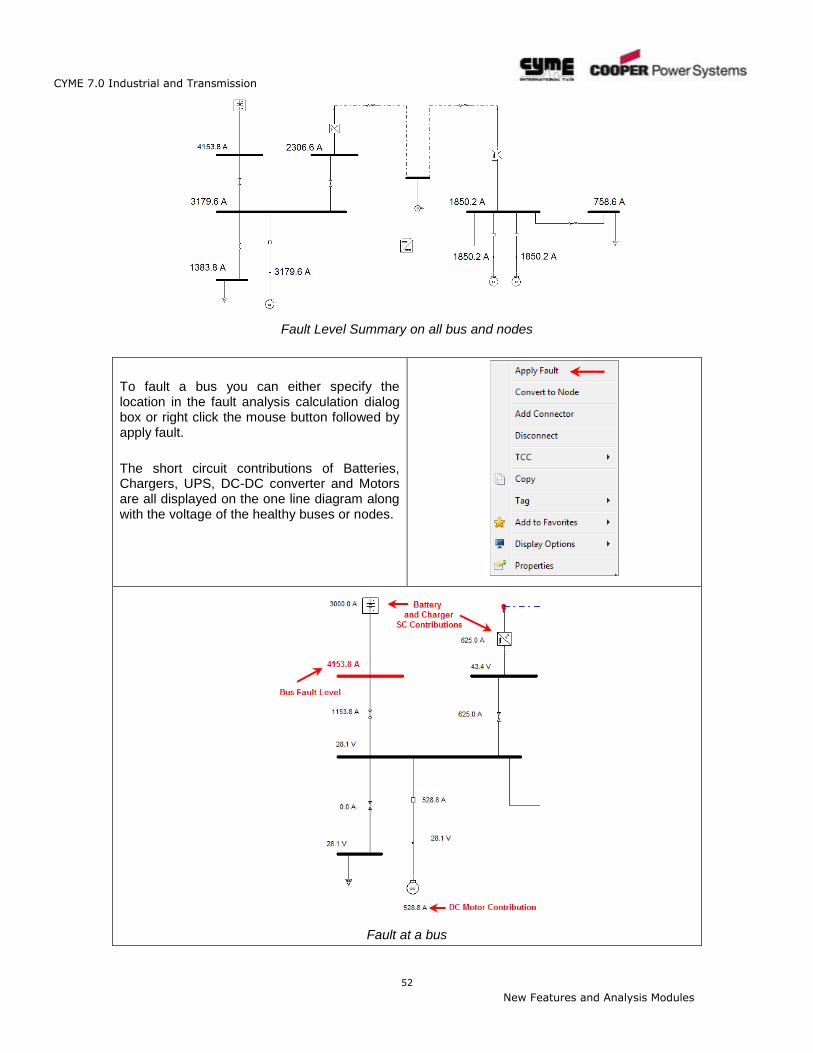
Fault Level Summary on all bus and nodes
To fault a bus you can either specify the location in the fault analysis calculation dialog box or right click the mouse button followed by apply fault.
The short circuit contributions of Batteries, Chargers, UPS, DC-DC converter and Motors are all displayed on the one line diagram along with the voltage of the healthy buses or nodes.
Fault at a bus
CYME 7.0 Industrial and Transmission
53
New Features and Analysis Modules
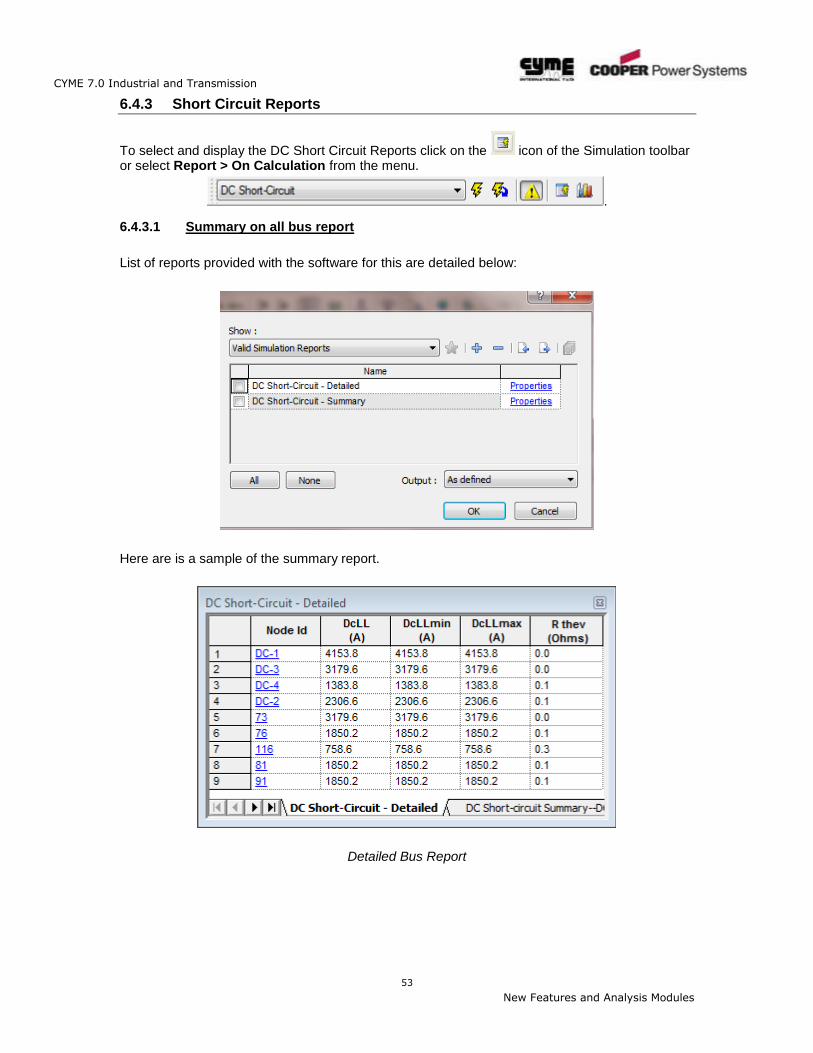
6.4.3 Short Circuit Reports
To select and display the DC Short Circuit Reports click on the icon of the Simulation toolbar or select Report > On Calculation from the menu.
.
6.4.3.1 Summary on all bus report
List of reports provided with the software for this are detailed below:
Here are is a sample of the summary report.
Detailed Bus Report
CYME 7.0 Industrial and Transmission
54
New Features and Analysis Modules
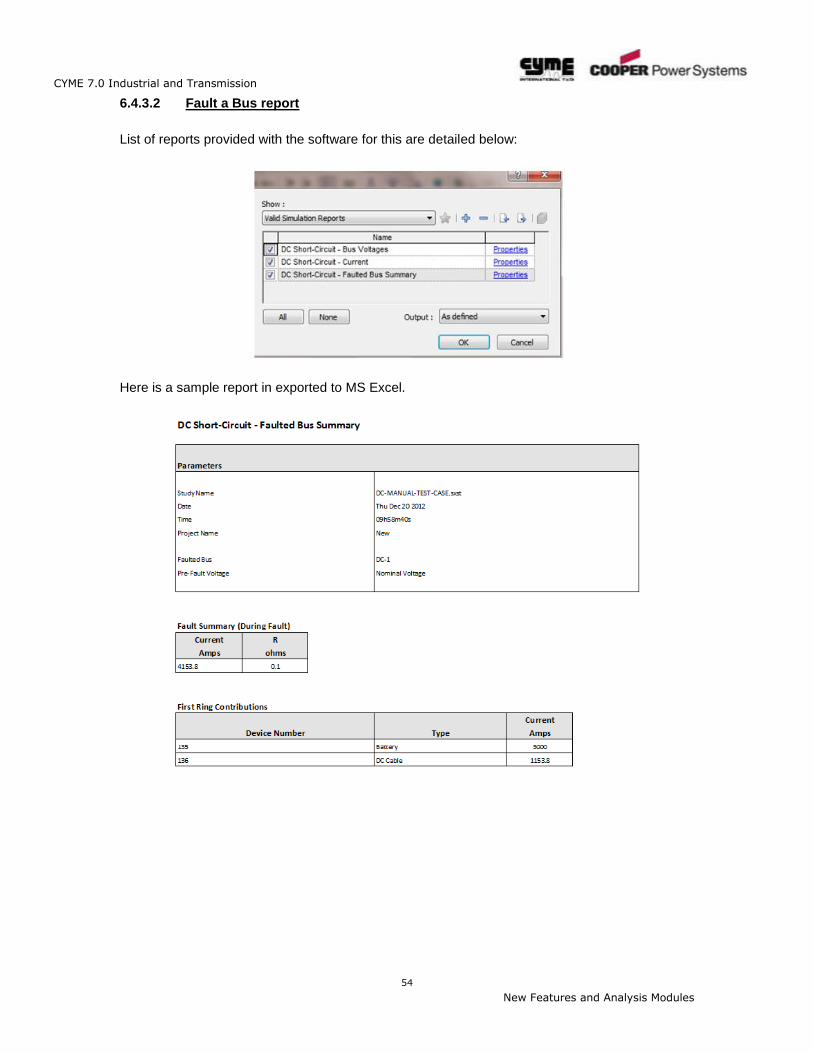
6.4.3.2 Fault a Bus report
List of reports provided with the software for this are detailed below:
Here is a sample report in exported to MS Excel.
CYME 7.0 Industrial and Transmission
55
New Features and Analysis Modules
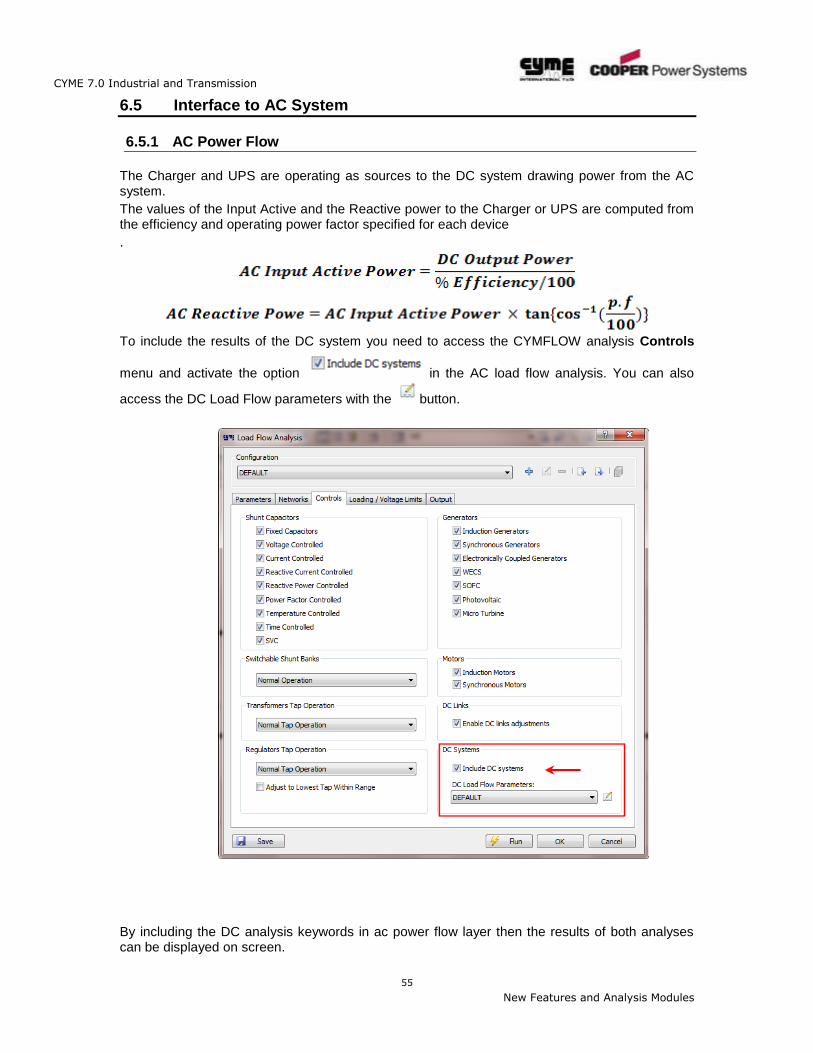
6.5 Interface to AC System
6.5.1 AC Power Flow
The Charger and UPS are operating as sources to the DC system drawing power from the AC system.
The values of the Input Active and the Reactive power to the Charger or UPS are computed from the efficiency and operating power factor specified for each device
.
To include the results of the DC system you need to access the CYMFLOW analysis Controls
menu and activate the option in the AC load flow analysis. You can also
access the DC Load Flow parameters with the button.
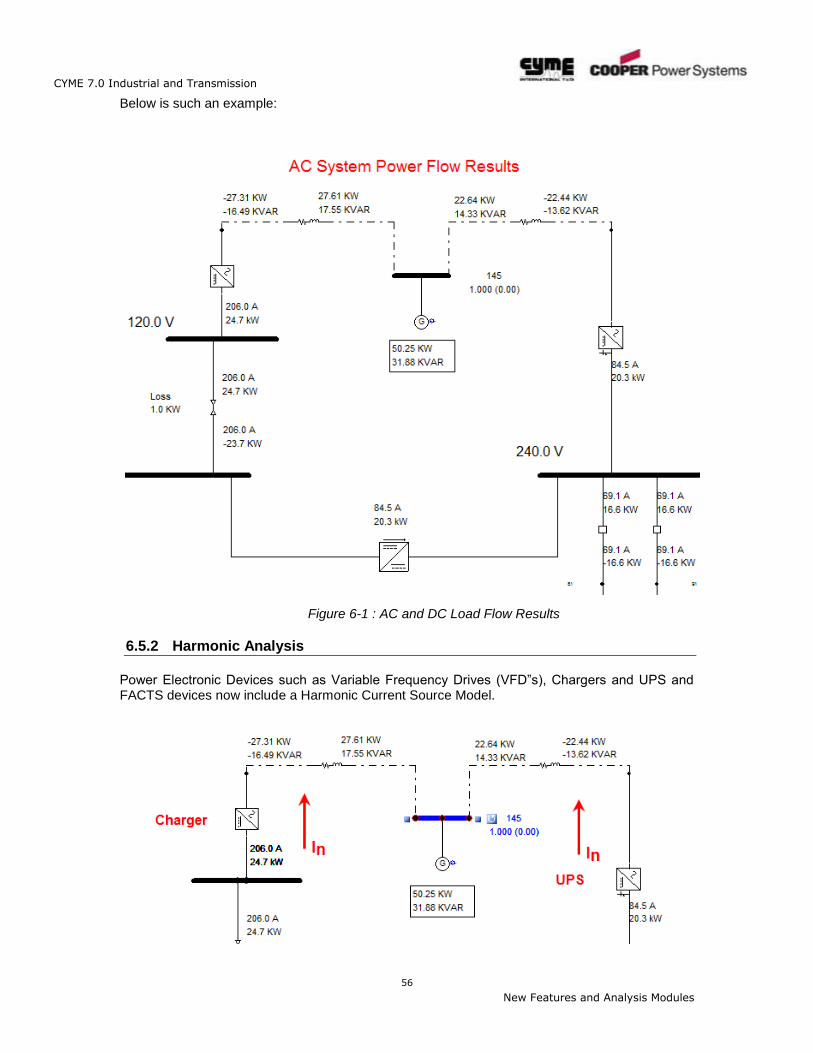
By including the DC analysis keywords in ac power flow layer then the results of both analyses can be displayed on screen.
CYME 7.0 Industrial and Transmission
56
New Features and Analysis Modules
Below is such an example:
Figure 6-1 : AC and DC Load Flow Results
6.5.2 Harmonic Analysis
Power Electronic Devices such as Variable Frequency Drives (VFD”s), Chargers and UPS and FACTS devices now include a Harmonic Current Source Model.
CYME 7.0 Industrial and Transmission
57
New Features and Analysis Modules
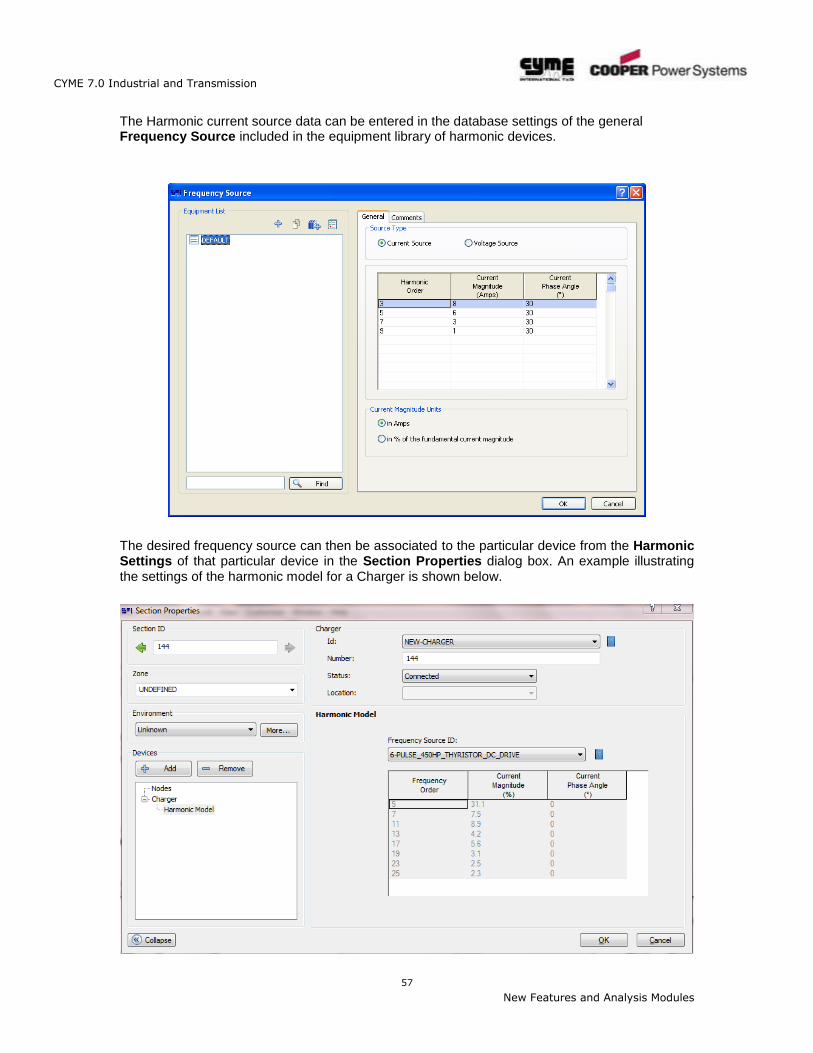
The Harmonic current source data can be entered in the database settings of the general Frequency Source included in the equipment library of harmonic devices.
The desired frequency source can then be associated to the particular device from the Harmonic Settings of that particular device in the Section Properties dialog box. An example illustrating the settings of the harmonic model for a Charger is shown below.
CYME 7.0 Industrial and Transmission
58
New Features and Analysis Modules
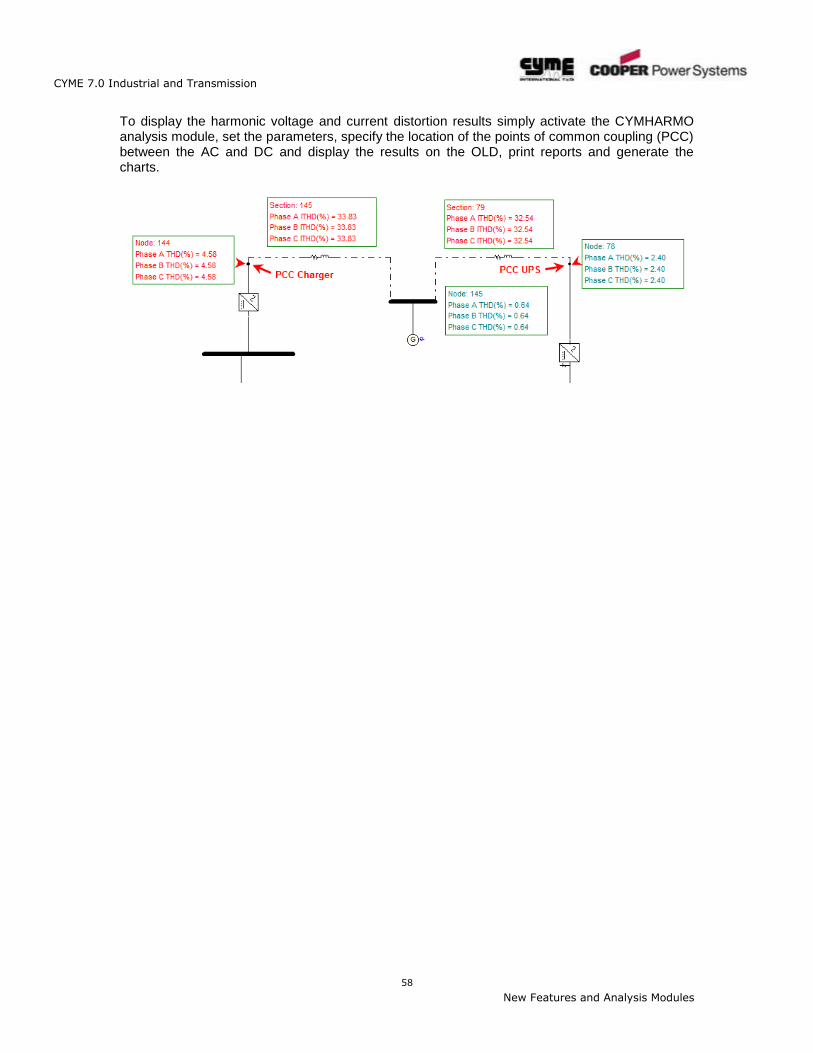
To display the harmonic voltage and current distortion results simply activate the CYMHARMO analysis module, set the parameters, specify the location of the points of common coupling (PCC) between the AC and DC and display the results on the OLD, print reports and generate the charts.
CYME 7.0 Industrial and Transmission
59
New Features and Analysis Modules
Chapter 7 CYMPROTEC
CYME 7.0 brings numerous enhancements and new features to its Network Protection Analysis module. The CYMPROTEC Module is an advanced protection analysis module that is now fully integrated within the CYME 7.0 software package.
New Features
Re-designed Protection Analysis Study Menu
Device Library Editor
Revamped TCC Settings dialog boxes
Live Preview mode
General Enhancements
New Analysis Modules
Sequence of Operation
Minimum Fault Analysis
7.1 New Features and Enhancements
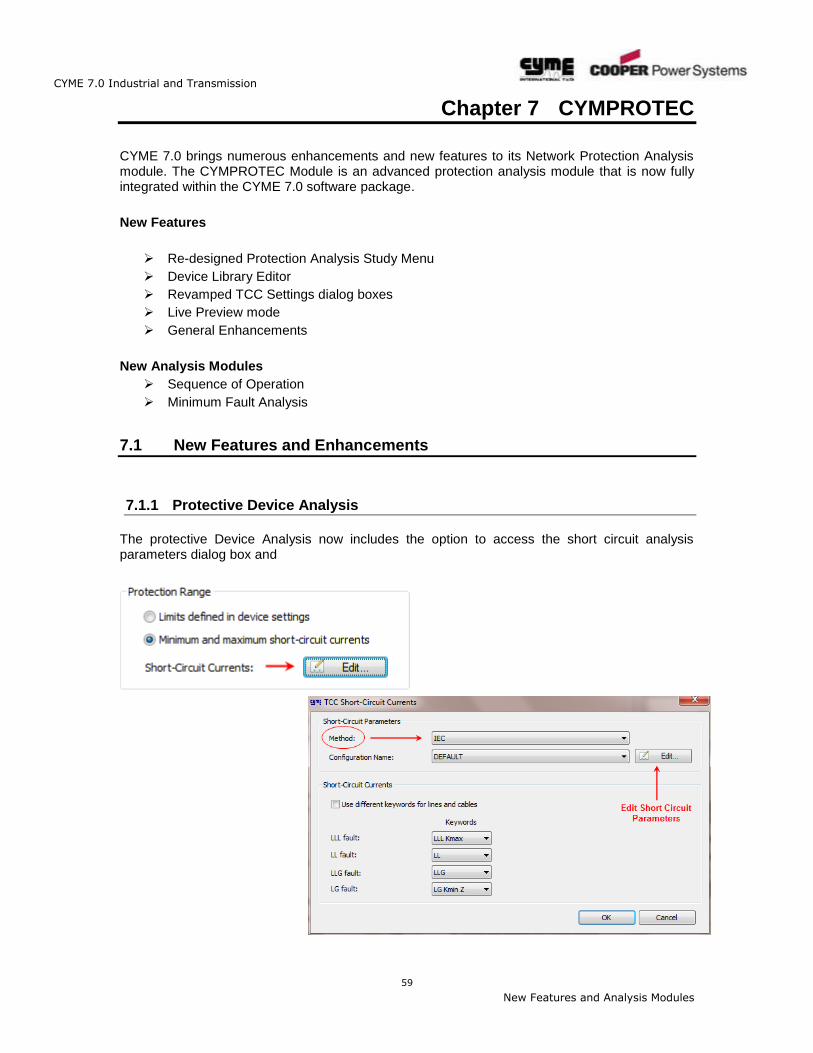
7.1.1 Protective Device Analysis
The protective Device Analysis now includes the option to access the short circuit analysis parameters dialog box and
CYME 7.0 Industrial and Transmission
60
New Features and Analysis Modules
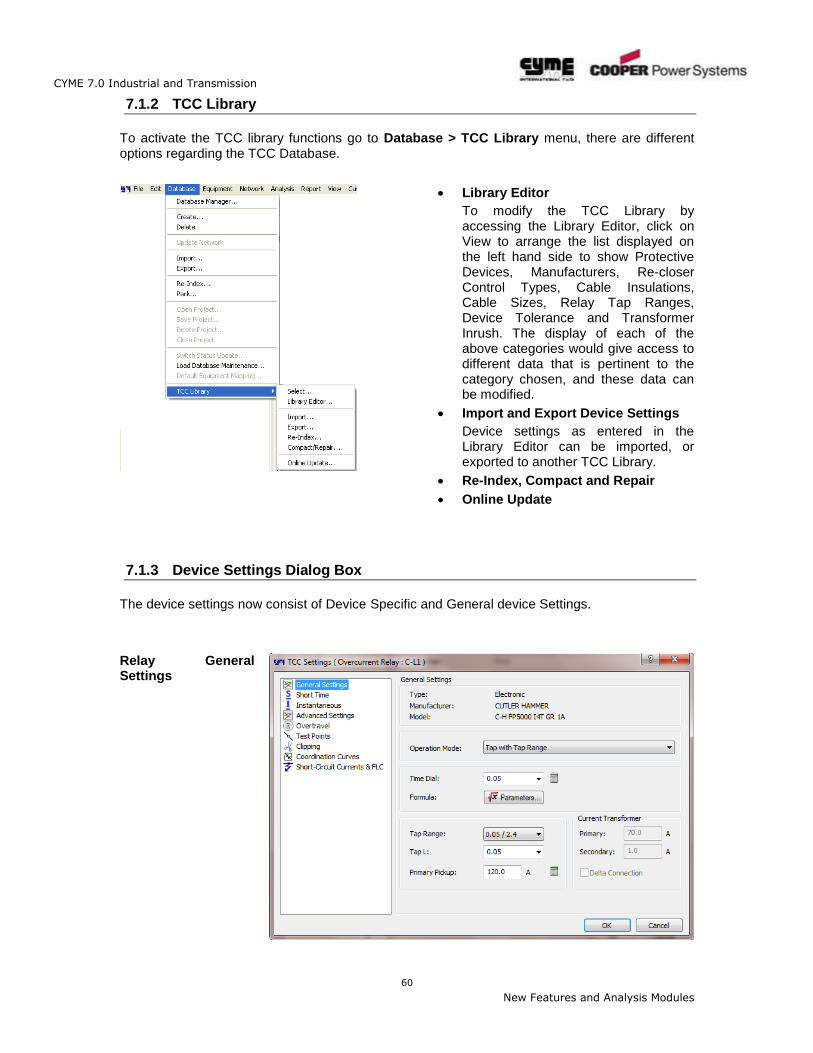
7.1.2 TCC Library
To activate the TCC library functions go to Database > TCC Library menu, there are different options regarding the TCC Database.
Library Editor
To modify the TCC Library by accessing the Library Editor, click on View to arrange the list displayed on the left hand side to show Protective Devices, Manufacturers, Re-closer Control Types, Cable Insulations, Cable Sizes, Relay Tap Ranges, Device Tolerance and Transformer Inrush. The display of each of the above categories would give access to different data that is pertinent to the category chosen, and these data can be modified.
Import and Export Device Settings
Device settings as entered in the Library Editor can be imported, or exported to another TCC Library.
Re-Index, Compact and Repair
Online Update
7.1.3 Device Settings Dialog Box
The device settings now consist of Device Specific and General device Settings.
Relay General Settings
CYME 7.0 Industrial and Transmission
61
New Features and Analysis Modules
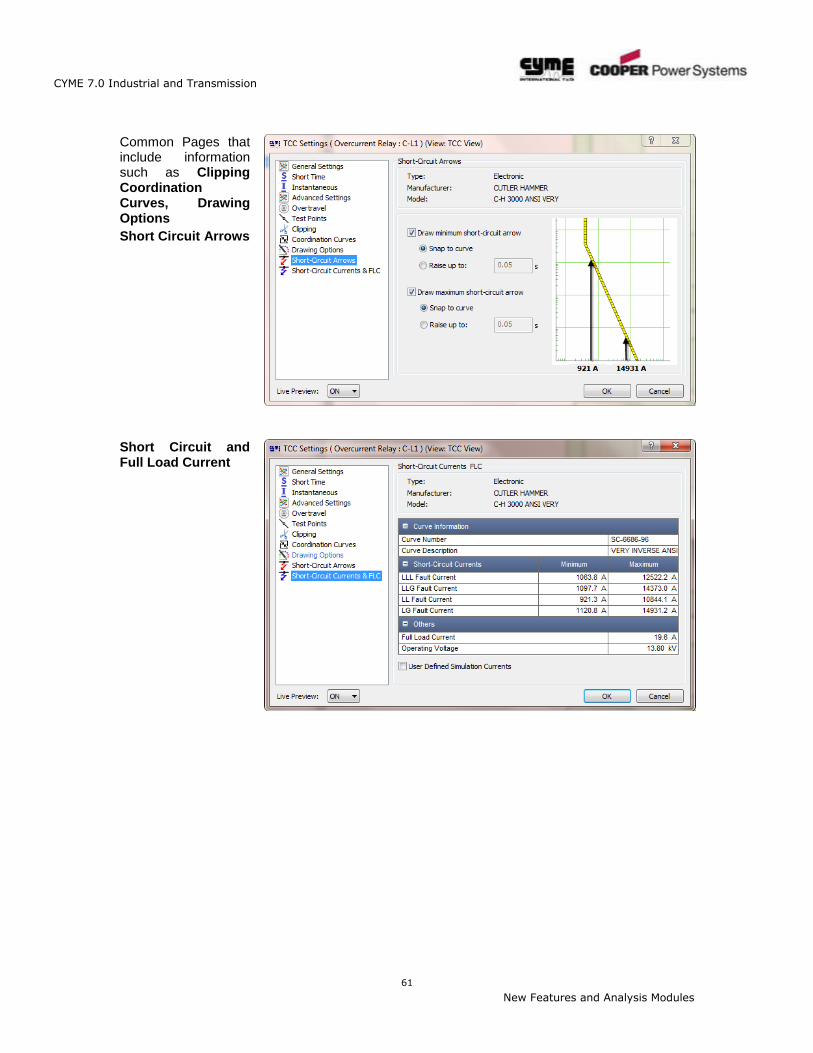
Common Pages that include information such as Clipping Coordination Curves, Drawing Options
Short Circuit Arrows
Short Circuit and Full Load Current
CYME 7.0 Industrial and Transmission
62
New Features and Analysis Modules
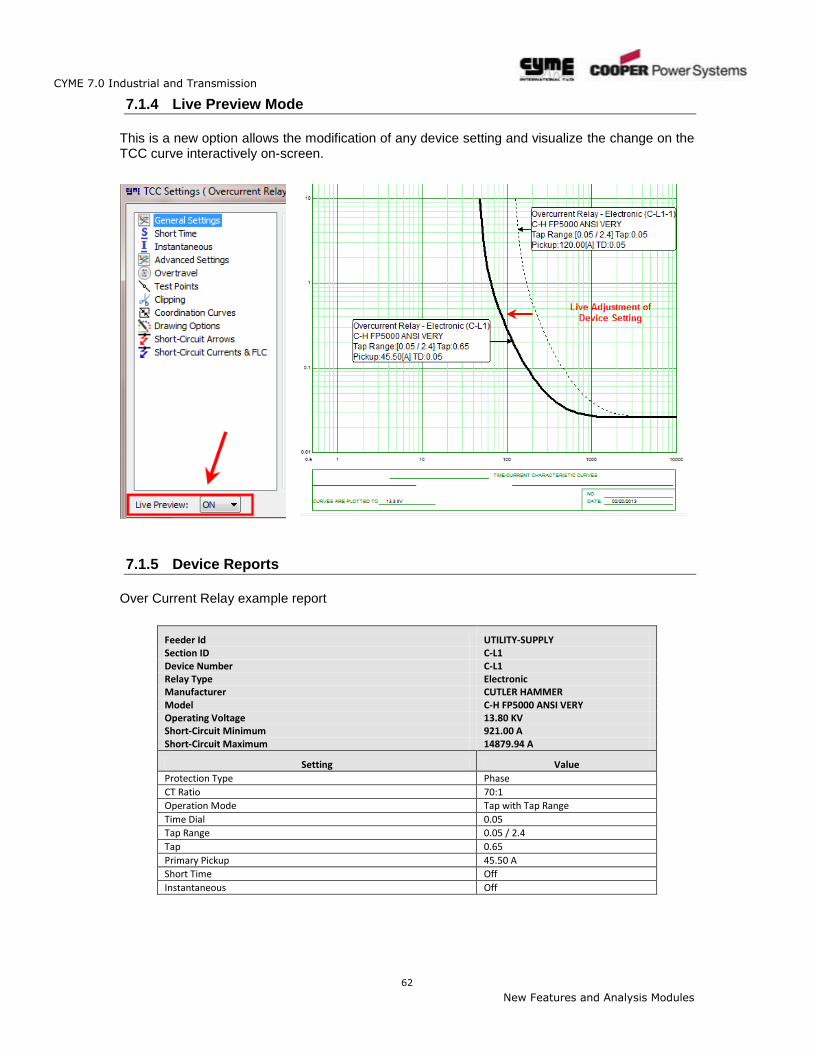
7.1.4 Live Preview Mode
This is a new option allows the modification of any device setting and visualize the change on the TCC curve interactively on-screen.
7.1.5 Device Reports
Over Current Relay example report
Feeder Id UTILITY-SUPPLY Section ID C-L1 Device Number C-L1 Relay Type Electronic Manufacturer CUTLER HAMMER Model C-H FP5000 ANSI VERY Operating Voltage 13.80 KV Short-Circuit Minimum 921.00 A Short-Circuit Maximum 14879.94 A
Setting Value
Protection Type Phase
CT Ratio 70:1
Operation Mode Tap with Tap Range
Time Dial 0.05
Tap Range 0.05 / 2.4
Tap 0.65
Primary Pickup 45.50 A
Short Time Off
Instantaneous Off
CYME 7.0 Industrial and Transmission
63
New Features and Analysis Modules
7.1.6 General Enhancements
The Network Protection module in CYME 7.0 can help verify network protection schemes
User Defined SC Currents
TCC View double click on the device click gives direct access to TCC Settings dialog
TCC views are now saved with the study
New TCC Keywords
Customization (Global vs Local)
Title Block Information (in Grid Options)
Display Tool (TCC Toolbar)
IntelliRupter® Type re-closer for up to 25 Curves
7.2 New Analysis Modules
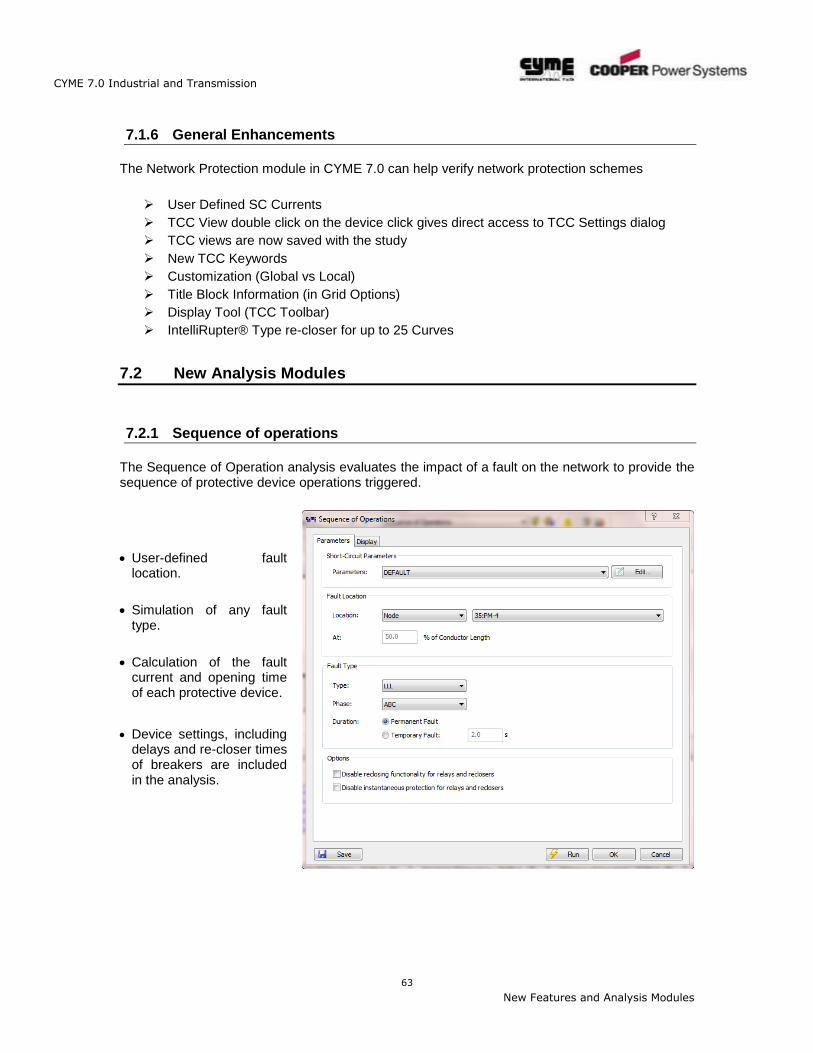
7.2.1 Sequence of operations
The Sequence of Operation analysis evaluates the impact of a fault on the network to provide the sequence of protective device operations triggered.
User-defined fault location.
Simulation of any fault type.
Calculation of the fault current and opening time of each protective device.
Device settings, including delays and re-closer times of breakers are included in the analysis.
CYME 7.0 Industrial and Transmission
64
New Features and Analysis Modules
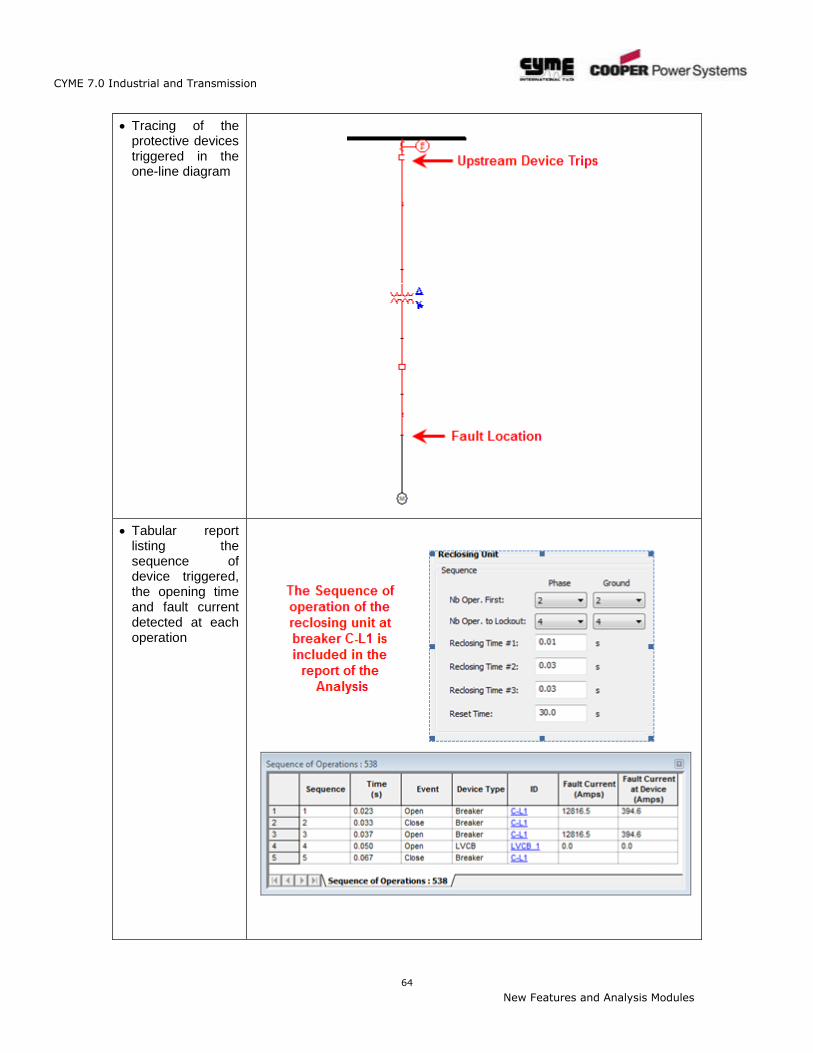
Tracing of the protective devices triggered in the one-line diagram
Tabular report listing the sequence of device triggered, the opening time and fault current detected at each operation
CYME 7.0 Industrial and Transmission
65
New Features and Analysis Modules
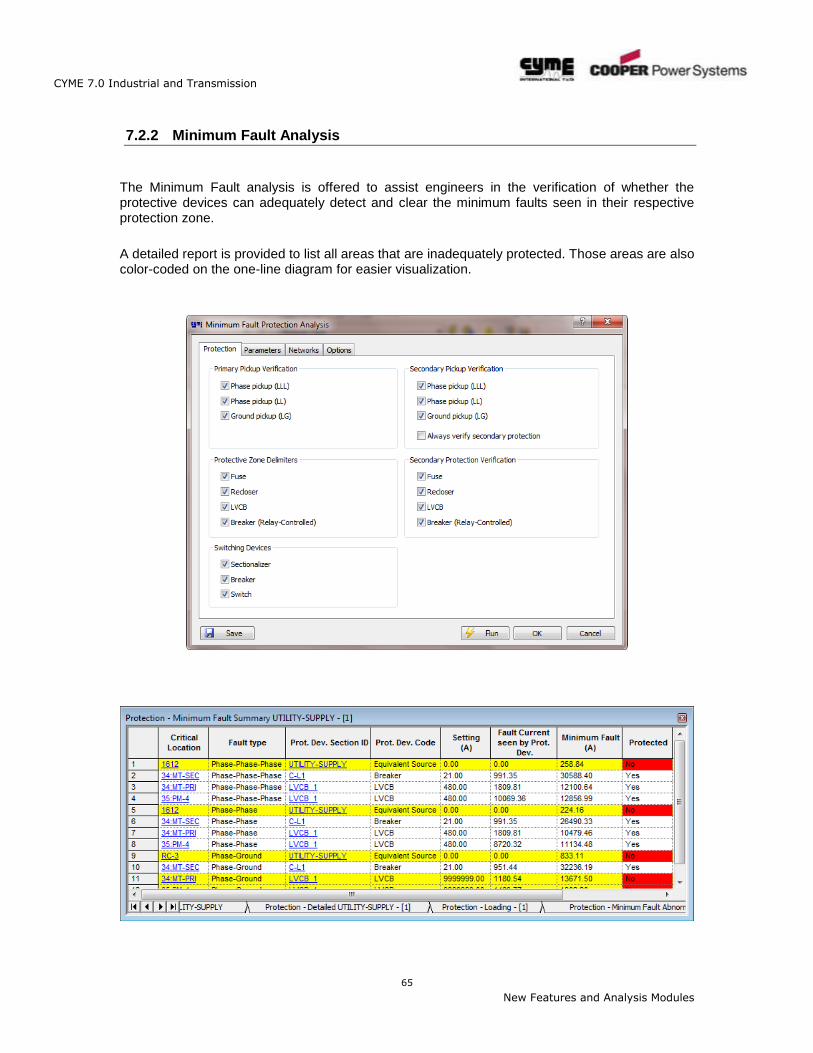
7.2.2 Minimum Fault Analysis
The Minimum Fault analysis is offered to assist engineers in the verification of whether the protective devices can adequately detect and clear the minimum faults seen in their respective protection zone.
A detailed report is provided to list all areas that are inadequately protected. Those areas are also color-coded on the one-line diagram for easier visualization.
Related Documents