arXiv:0811.2954v1 [cond-mat.str-el] 18 Nov 2008 Cyclotron resonance of a magnetic quantum dot Nga T. T. Nguyen ∗ and F. M. Peeters † Departement Fysica, Universiteit Antwerpen, Groenenborgerlaan 171, B-2020 Antwerpen, Belgium The energy spectrum of a one-electron quantum dot doped with a single magnetic ion is studied in the presence of an external magnetic field. The allowed cyclotron resonance (CR) transitions are obtained together with their oscillator strength (OS) as function of the magnetic field, the position of the magnetic ion, and the quantum dot confinement strength. With increasing magnetic field a ferromagnetic - antiferromagnetic transition is found that results in clear signatures in the CR absorption. It leads to discontinuities in the transition energies and the oscillator strengths and an increase of the number of allowed transitions. PACS numbers: 78.67.Hc, 71.55.Eq, 75.75.+a, 75.50.Pp I. INTRODUCTION. Twenty years after the pioneering studies 1 on mag- netically doped quantum dots, both experimental and theoretical work on III-V and II-VI semiconductor systems and containing a low density of magnetic ions 2,3 (Diluted Magnetic Semiconductors - DMS) have revealed a variety of remarkable new physical properties 4,5,6,7,8,9,10,11,12,13,14,15,16 as e.g. giant Zeeman splitting, spin splitting of exciton levels, magnetic po- larons, etc. Recent investigations of the optical prop- erties of II-VI manganese-doped quantum dots 5,10,11,12 have shown that they are promising new systems for e.g. qubits. The spin of the magnetic ion (Mn-ion) is used as a quantum bit and recent experiments have shown that in single Mn-doped one-electron quantum dots it is pos- sible to control the spin of the electron and of the mag- netic ion 11 . The characterization of single Mn-doped few- electron II-VI quantum dots is very important. Typically, one uses inter-band absorption experiments. Here, we will investigate intra-band transitions and show that as function of the magnetic field new features appear when a magnetic ion is present which depend on the position of the Mn ion inside the quantum dot (QD). Studies on N e strongly interacting electrons that are confined in a quantum dot and interacting with a single magnetic ion have been mostly limited to the experimental 11 and theoretical study 10,14,15,16 of the ground state and the thermodynamic properties of dots containing a small number of electrons. Cyclotron resonance (CR) has been an important ex- perimental technique to investigate the properties of elec- trons (and holes). The advantage is that CR transitions involve only one type of carriers (electrons or holes) facil- itating the interpretation of the results. CR is also often used to obtain information on the effective mass of the carriers. Cyclotron resonance has been studied in bulk semiconductors 17 and later on also in semiconduc- tor quantum dots 18,19,20 where it was shown that in parabolic confined quantum dots Kohn’s theorem still holds and thus the CR-transitions are independent of the number of electrons. The latter is no longer true if the confinement potential is non-parabolic 19 or when the carriers obey a non-parabolic energy spectrum. Very recently 12 , the intra-band optical properties of a three-dimensional (3D) single-electron CdTe/ZnTe quan- tum dot containing one or two Mn impurities confined by a potential that is parabolic in the xy-plane and has the quantum-well confinement along the z-axis was in- vestigated. New absorption lines (mixing with the lines to higher excited levels for quantum-well system - as for example see Ref. 19 for studies of CR in quantum well sys- tem without a Mn-ion) were predicted as well as crossings and anti-crossings of allowed CR transitions as function of an external magnetic field. In the present paper we calculate the single-particle states of a quasi-two-dimensional parabolic quantum dot in the presence of a single Mn-ion and an external per- pendicular magnetic field. We investigate the allowed cy- clotron resonance transitions and their corresponding os- cillator strength. We have in mind experimental realized systems [i.e. Cd(Mn)Te] where the lateral size is much larger than the height of the quantum dot and conse- quently the system behaves like a quasi-two-dimensional quantum dot. As in Ref. 12 we find new resonant transi- tions due to the electron-magnetic ion (e-Mn) spin-spin exchange interaction but we also investigate these tran- sitions as function of the position of the Mn-ion in the quantum dot. We find crossing and anti-crossing fea- tures that depend on the position of the magnetic ion in the quantum dot and on the strength of the confinement potential. We will focus on the allowed transitions and concentrate on the new CR lines that become possible due to the presence of the Mn-ion. Due to the presence of the Mn-ion the electron spin will not always be parallel to the external magnetic field. It will together with the Mn- ion define two kinds of relative orientation of their spins called ferromagnetic (FM) and antiferromagnetic (AFM). The FM-AFM transition can be influenced by changing the exchange interaction parameters which we will real- ize by moving the magnetic ion to different positions. We show that this can change the position and the number of crossing and anti-crossing points and consequently in- fluence the CR lines. We find that the CR transitions now contain information not only on the electron state but also on the magnetic-ion-electron interaction and the

Welcome message from author
This document is posted to help you gain knowledge. Please leave a comment to let me know what you think about it! Share it to your friends and learn new things together.
Transcript

arX
iv:0
811.
2954
v1 [
cond
-mat
.str
-el]
18
Nov
200
8
Cyclotron resonance of a magnetic quantum dot
Nga T. T. Nguyen∗ and F. M. Peeters†
Departement Fysica, Universiteit Antwerpen, Groenenborgerlaan 171, B-2020 Antwerpen, Belgium
The energy spectrum of a one-electron quantum dot doped with a single magnetic ion is studiedin the presence of an external magnetic field. The allowed cyclotron resonance (CR) transitions areobtained together with their oscillator strength (OS) as function of the magnetic field, the positionof the magnetic ion, and the quantum dot confinement strength. With increasing magnetic fielda ferromagnetic - antiferromagnetic transition is found that results in clear signatures in the CRabsorption. It leads to discontinuities in the transition energies and the oscillator strengths and anincrease of the number of allowed transitions.
PACS numbers: 78.67.Hc, 71.55.Eq, 75.75.+a, 75.50.Pp
I. INTRODUCTION.
Twenty years after the pioneering studies1 on mag-netically doped quantum dots, both experimental andtheoretical work on III-V and II-VI semiconductorsystems and containing a low density of magneticions2,3 (Diluted Magnetic Semiconductors - DMS)have revealed a variety of remarkable new physicalproperties4,5,6,7,8,9,10,11,12,13,14,15,16 as e.g. giant Zeemansplitting, spin splitting of exciton levels, magnetic po-larons, etc. Recent investigations of the optical prop-erties of II-VI manganese-doped quantum dots5,10,11,12
have shown that they are promising new systems for e.g.qubits. The spin of the magnetic ion (Mn-ion) is used asa quantum bit and recent experiments have shown thatin single Mn-doped one-electron quantum dots it is pos-sible to control the spin of the electron and of the mag-netic ion11. The characterization of single Mn-doped few-electron II-VI quantum dots is very important. Typically,one uses inter-band absorption experiments. Here, wewill investigate intra-band transitions and show that asfunction of the magnetic field new features appear whena magnetic ion is present which depend on the positionof the Mn ion inside the quantum dot (QD).
Studies on Ne strongly interacting electrons that areconfined in a quantum dot and interacting with asingle magnetic ion have been mostly limited to theexperimental11 and theoretical study10,14,15,16 of theground state and the thermodynamic properties of dotscontaining a small number of electrons.
Cyclotron resonance (CR) has been an important ex-perimental technique to investigate the properties of elec-trons (and holes). The advantage is that CR transitionsinvolve only one type of carriers (electrons or holes) facil-itating the interpretation of the results. CR is also oftenused to obtain information on the effective mass of thecarriers.
Cyclotron resonance has been studied in bulksemiconductors17 and later on also in semiconduc-tor quantum dots18,19,20 where it was shown that inparabolic confined quantum dots Kohn’s theorem stillholds and thus the CR-transitions are independent ofthe number of electrons. The latter is no longer true
if the confinement potential is non-parabolic19 or whenthe carriers obey a non-parabolic energy spectrum.
Very recently12, the intra-band optical properties of athree-dimensional (3D) single-electron CdTe/ZnTe quan-tum dot containing one or two Mn impurities confinedby a potential that is parabolic in the xy-plane and hasthe quantum-well confinement along the z-axis was in-vestigated. New absorption lines (mixing with the linesto higher excited levels for quantum-well system - as forexample see Ref.19 for studies of CR in quantum well sys-tem without a Mn-ion) were predicted as well as crossingsand anti-crossings of allowed CR transitions as functionof an external magnetic field.
In the present paper we calculate the single-particlestates of a quasi-two-dimensional parabolic quantum dotin the presence of a single Mn-ion and an external per-pendicular magnetic field. We investigate the allowed cy-clotron resonance transitions and their corresponding os-cillator strength. We have in mind experimental realizedsystems [i.e. Cd(Mn)Te] where the lateral size is muchlarger than the height of the quantum dot and conse-quently the system behaves like a quasi-two-dimensionalquantum dot. As in Ref.12 we find new resonant transi-tions due to the electron-magnetic ion (e-Mn) spin-spinexchange interaction but we also investigate these tran-sitions as function of the position of the Mn-ion in thequantum dot. We find crossing and anti-crossing fea-tures that depend on the position of the magnetic ion inthe quantum dot and on the strength of the confinementpotential. We will focus on the allowed transitions andconcentrate on the new CR lines that become possibledue to the presence of the Mn-ion. Due to the presence ofthe Mn-ion the electron spin will not always be parallel tothe external magnetic field. It will together with the Mn-ion define two kinds of relative orientation of their spinscalled ferromagnetic (FM) and antiferromagnetic (AFM).The FM-AFM transition can be influenced by changingthe exchange interaction parameters which we will real-ize by moving the magnetic ion to different positions. Weshow that this can change the position and the numberof crossing and anti-crossing points and consequently in-fluence the CR lines. We find that the CR transitionsnow contain information not only on the electron statebut also on the magnetic-ion-electron interaction and the
2
magnetic state of the magnetic ion. Because of the richphysics involved we will limit our discussion here to thefundamental single-electron quantum dot case.
This paper is organized as follows. Section II intro-duces the model and the numerical method. In sectionIII we present our numerical results for the energy spec-trum. Sect. IV is devoted to the cyclotron resonancetransitions where we calculate the oscillator strength andthe allowed transition energy spectrum. Our discussionand conclusions are presented in Sect. V.
II. THEORETICAL MODEL
A quantum dot containing a single electron with spin−→s confined by a parabolic potential and interacting with
a single magnetic ion (Mn2+) with spin−→M and a mag-
netic field is described by the following Hamiltonian:
H =
[
1
2m∗
(
−i~−→∇−→r + e
−→A (−→r )
)2
+1
2m∗ω2
0−→r 2
]
+1
2~ωc (gem
∗sz + gMnm∗Mz)
− Jc−→s · −→Mδ(−→r −−→
R ). (1)
The first two terms are, respectively, the single-particlekinetic energy and the confinement potential for the elec-tron. The third and the fourth terms are the electronand magnetic ion Zeeman energies, respectively. Thelast term is the electron-Mn spin-spin exchange inter-action with strength Jc. The vector potential is taken
in the symmetric gauge:−→A = B/2(−y, x, 0) where the
magnetic field−→B is perpendicular to the plane of the
interface. The confinement frequency ω0 defines the con-finement length: l0 =
√
~/m∗ω0. ge and gMn are theLande g-factor of the host semiconductor and the mag-netic ion, respectively. We introduce a dimensionless pa-rameter SC = (a∗
B/l0)2
called the confinement strength(square comes from the fact that ω0 ∼ 1/l20). In a many-electron system SC is: SC = 1/λ2
C with λC = l0/a∗B the
Coulomb interaction strength15. a∗B = 4πǫ0ǫ~
2/m∗e2 isthe effective Bohr radius. The cyclotron frequency is:ωc = eB/m∗. We use the set of parameters14 that isapplicable to a self-assembled Cd(Mn)Te quantum dotwith a typical lateral size of about tens of nanome-ters. The dielectric constant ǫ = 10.6, effective massm∗ = 0.106m0, a∗
B = 52.9 A, ge = −1.67, gMn = 2.02,
Jc = 1.5 × 10³meV A2, and l0 about tens of angstroms
(~ω0 corresponding to tens of meV ). For example, with~ω0 = 51.32 meV gives l0 = 26.45 A and correspondsto SC = 4; ~ω0 = 12.83 meV gives l0 = 52.9 A andcorresponds to SC = 1.
We use the single-particle states in a parabolic confine-ment potential namely the complete basis of Fock-Darwin(FD) orbitals φnl (−→r ) and spin functions χσ (−→s ):
φnlσ (−→r ,−→s ) = ϕnl (−→r )χσ (−→s ) , (2)
with the Fock-Darwin orbitals:
ϕnl (−→r ) =
1
lH
√
n!
π (n + |l|)!
(
r
lH
)|l|
e−ilθe− r2
2l2H L|l|
n
(
r2
l2H
)
.
(3)The single-particle (spin σ) Fock-Darwin orbital en-
ergy in the presence of a magnetic field at site i = n, lis given by:
Ei,σ = ~ωH(2n + |l| + 1) − ~ωcl/2, (4)
with ωH = ω0
√
1 + (ωc/2ω0)2 that can also be expressedin terms of a new length lH : ωH = ~/m∗l2H .
We now can rewrite the Hamiltonian in second-quantized form:
H =∑
i,σ
Ei,σc+i,σci,σ +
1
2~ωc (gem
∗sz + gMnm∗Mz)
−∑
ij
1
2Jij
(−→R
)
[(c+i,↑cj,↑ − c+
i,↓cj,↓)Mz
+ c+i,↑cj,↓M
− + c+i,↓cj,↑M
+], (5)
where i denotes a set of quantum numbers n, l. Lz, sz,and Mz are the projections of the angular momentumof the electron, its spin, and spin of the magnetic ion inthe direction of the magnetic field, respectively. Mz, M
+,and M− are the z-projection, raising and lowering oper-ators of the magnetic ion spin, respectively. The e-Mninteraction appearing in this form describes the conser-vation of the electron spin in the e-Mn interaction of e.g.two configurations i and j in the first term and the spinexchange of these configurations by flipping the electron’sspin at one site along with a compensation by flipping theMn-ion spin at the other site, and vice versa, in the lasttwo terms. This interaction parameter is:
Jij(−→R ) = Jcϕ
∗i (−→R )ϕj(
−→R ) (6)
a product of the two Fock-Darwin orbitals of states i andj calculated at the position of the magnetic ion RMn.
We construct the many-particle wave function usingthe configuration interaction (CI) method:
Ψ(−→x∗,
−→M
)
=
Nc∑
k=1
ckΨk
(−→x∗,
−→M
)
, (7)
where−→x∗ is the radial and spin coordinate of the electron
and Ψk is the k-th state of the non-interacting many-electron wave function (in this case for one-electron) de-termined by:
Ψk =⇒ |k〉 = |c+k↑(↓)〉|Mk
z 〉. (8)
Mkz runs through six states: 5/2, 3/2, ... −5/2. The
number of configurations, Nc = 12Ns with Ns the num-ber of orbitals that are included and is taken sufficientlarge in order to guarantee sufficient accuracy.
3
0.0 0.5 1.0 1.50.00
0.05
0.10
0.15
0.20
0.25
0.30
SC=1S
C=4
SC=16
Ωc=
ωc/ω
0
RMn
/26.45Å
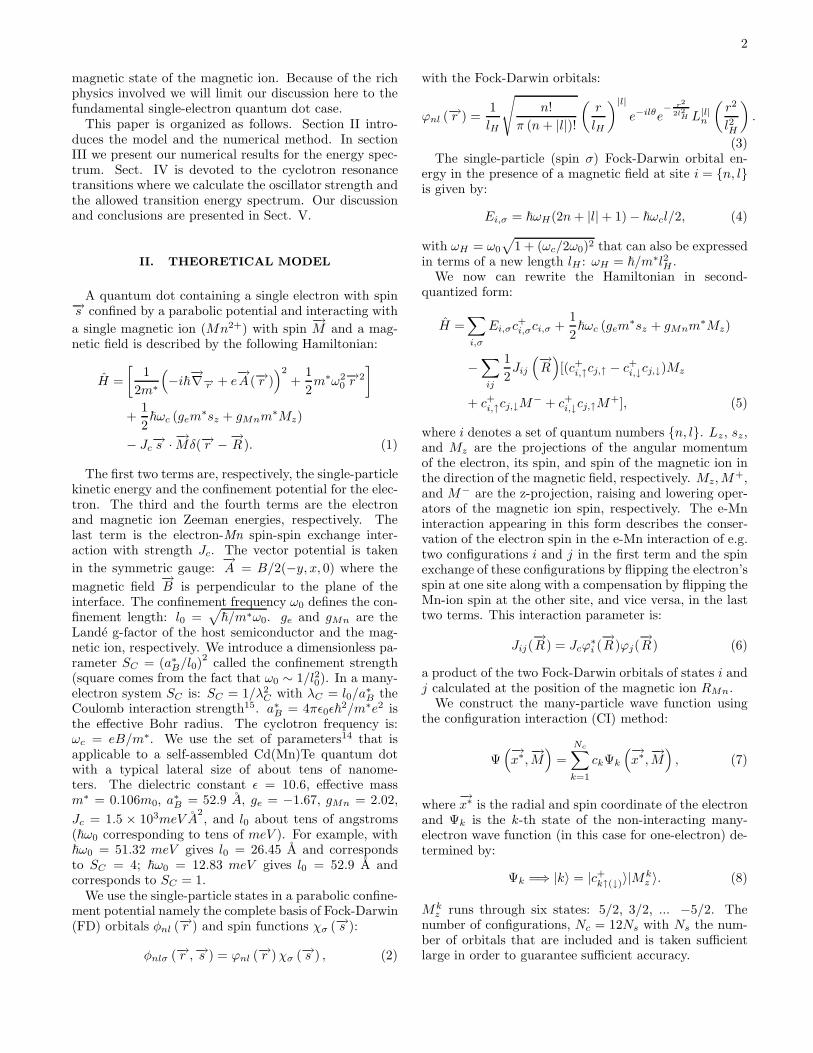
FIG. 1: (Color online) Phase diagram ΩC − RMn plotted forthree different confinement strengths SC . The region below(above) the line corresponds each time to the ferromagnetic(antiferromagnetic) phase, respectively.
III. ENERGY SPECTRUM
The presence of the magnetic ion leads to different ar-rangements of the spins of the electron and the magneticion depending on the strength of the magnetic field. Thisis due to the interplay between on the one hand the con-tributions of the Zeeman energies of the electron and themagnetic ion and on the other hand the exchange inter-action, both depend on the magnetic field. Two differentarrangements of the spins of the electron and the Mn-ionare possible: ferromagnetic and antiferromagnetic. Theferromagnetic arrangement is found for very small mag-netic field when the exchange energy dominates over theZeeman energy terms. In the reverse case the AFM ar-rangement of electron and magnetic ion spins is found.As illustrated in Fig. 1, the ferromagnetic - antiferro-magnetic (FM-AFM) phase transition line depends alsoon the position of the magnetic ion. Note that in nonzeromagnetic field, the magnetic ion is always antiparallel tothe magnetic field due to the positive value of its g-factor.
When the magnetic ion is located at the center of thedot the FM-AFM transition occurs at the same magneticfield for any value of the confinement strength as is madeclear in Fig. 1. The e-Mn exchange energy is maximal fora Mn-ion situated in the center of the quantum dot. Notethat in one-electron system, the electron density is maxi-mum at the center of the dot and the electron is found inthe s shell where the Jc matrix element is also found tobe maximum at the center of the dot. Moving the Mn-ion out of the center of the quantum dot will decreasethis e-Mn exchange interaction. The electron probabilityat the Mn-ion is now a strong function of the confine-
ment strength. With decreasing e-Mn exchange energy(i.e. by moving the Mn-ion out the center of the QD orincreasing the confinement) a smaller external magneticfield is needed to induce the FM-AFM transition, as canbe seen from Fig. 1.
In the presence of the exchange energy term in Eq.(1) the ground state (GS) consists of contributions fromdifferent configurations of (sz, Mz). The electron is stillfound in the s shell even at very high magnetic field.Unlike the system without a magnetic ion where the spinof the electron always orients parallel to the magneticfield, the system containing a magnetic ion has a wavefunction containing contributions from states where theelectron is antiparallel to the magnetic field. This leadsto an attraction to the magnetic ion and reduces the totalenergy.
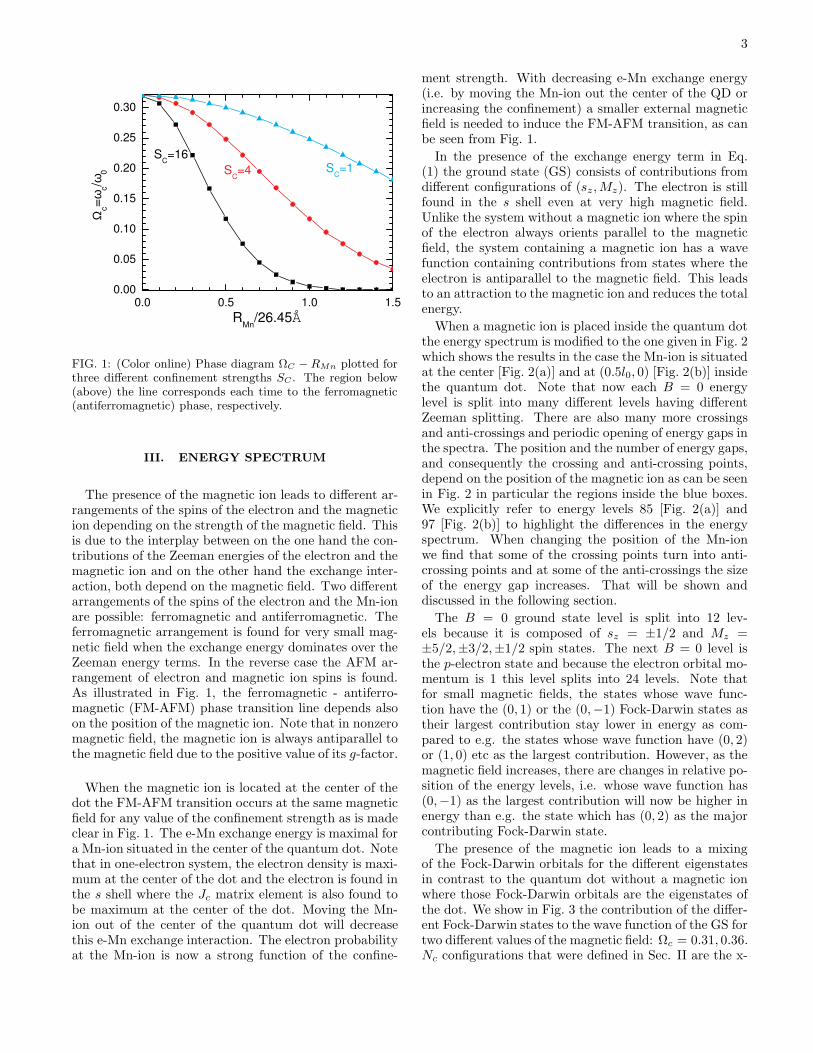
When a magnetic ion is placed inside the quantum dotthe energy spectrum is modified to the one given in Fig. 2which shows the results in the case the Mn-ion is situatedat the center [Fig. 2(a)] and at (0.5l0, 0) [Fig. 2(b)] insidethe quantum dot. Note that now each B = 0 energylevel is split into many different levels having differentZeeman splitting. There are also many more crossingsand anti-crossings and periodic opening of energy gaps inthe spectra. The position and the number of energy gaps,and consequently the crossing and anti-crossing points,depend on the position of the magnetic ion as can be seenin Fig. 2 in particular the regions inside the blue boxes.We explicitly refer to energy levels 85 [Fig. 2(a)] and97 [Fig. 2(b)] to highlight the differences in the energyspectrum. When changing the position of the Mn-ionwe find that some of the crossing points turn into anti-crossing points and at some of the anti-crossings the sizeof the energy gap increases. That will be shown anddiscussed in the following section.
The B = 0 ground state level is split into 12 lev-els because it is composed of sz = ±1/2 and Mz =±5/2,±3/2,±1/2 spin states. The next B = 0 level isthe p-electron state and because the electron orbital mo-mentum is 1 this level splits into 24 levels. Note thatfor small magnetic fields, the states whose wave func-tion have the (0, 1) or the (0,−1) Fock-Darwin states astheir largest contribution stay lower in energy as com-pared to e.g. the states whose wave function have (0, 2)or (1, 0) etc as the largest contribution. However, as themagnetic field increases, there are changes in relative po-sition of the energy levels, i.e. whose wave function has(0,−1) as the largest contribution will now be higher inenergy than e.g. the state which has (0, 2) as the majorcontributing Fock-Darwin state.
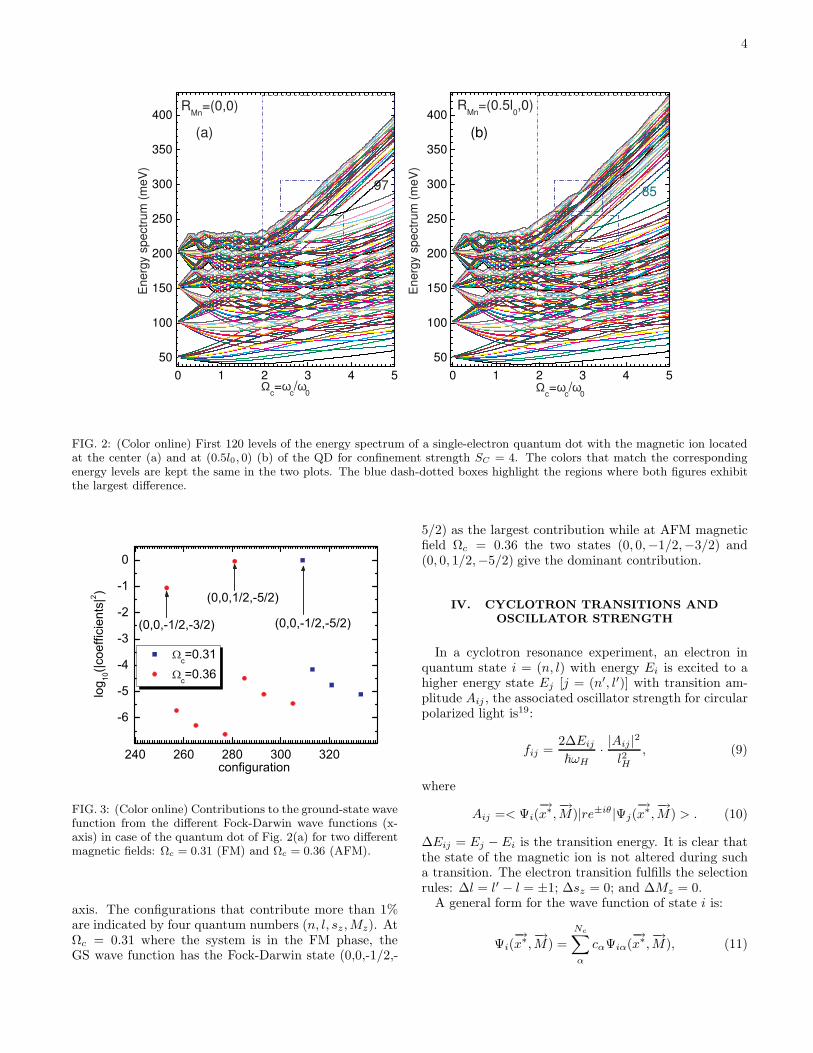
The presence of the magnetic ion leads to a mixingof the Fock-Darwin orbitals for the different eigenstatesin contrast to the quantum dot without a magnetic ionwhere those Fock-Darwin orbitals are the eigenstates ofthe dot. We show in Fig. 3 the contribution of the differ-ent Fock-Darwin states to the wave function of the GS fortwo different values of the magnetic field: Ωc = 0.31, 0.36.Nc configurations that were defined in Sec. II are the x-
4
0 1 2 3 4 5
50
100
150
200
250
300
350
400
0 1 2 3 4 5
50
100
150
200
250
300
350
400
(b)
Energ
y s
pectr
um
(m
eV
)
Ωc=ω
c/ω
0
RMn
=(0.5l0,0)
85
Energ
y s
pectr
um
(m
eV
)
Ωc=ω
c/ω
0
RMn
=(0,0)
97
(a)
FIG. 2: (Color online) First 120 levels of the energy spectrum of a single-electron quantum dot with the magnetic ion locatedat the center (a) and at (0.5l0, 0) (b) of the QD for confinement strength SC = 4. The colors that match the correspondingenergy levels are kept the same in the two plots. The blue dash-dotted boxes highlight the regions where both figures exhibitthe largest difference.
240 260 280 300 320
-6
-5
-4
-3
-2
-1
0
log 10
(|coe
ffici
ents
|2 )
configuration
c=0.31 c=0.36
(0,0,-1/2,-3/2)
(0,0,1/2,-5/2)
(0,0,-1/2,-5/2)
FIG. 3: (Color online) Contributions to the ground-state wavefunction from the different Fock-Darwin wave functions (x-axis) in case of the quantum dot of Fig. 2(a) for two differentmagnetic fields: Ωc = 0.31 (FM) and Ωc = 0.36 (AFM).
axis. The configurations that contribute more than 1%are indicated by four quantum numbers (n, l, sz, Mz). AtΩc = 0.31 where the system is in the FM phase, theGS wave function has the Fock-Darwin state (0,0,-1/2,-
5/2) as the largest contribution while at AFM magneticfield Ωc = 0.36 the two states (0, 0,−1/2,−3/2) and(0, 0, 1/2,−5/2) give the dominant contribution.
IV. CYCLOTRON TRANSITIONS AND
OSCILLATOR STRENGTH
In a cyclotron resonance experiment, an electron inquantum state i = (n, l) with energy Ei is excited to ahigher energy state Ej [j = (n′, l′)] with transition am-plitude Aij , the associated oscillator strength for circularpolarized light is19:
fij =2∆Eij
~ωH
· |Aij |2l2H
, (9)
where
Aij =< Ψi(−→x∗,
−→M)|re±iθ |Ψj(
−→x∗,
−→M) > . (10)
∆Eij = Ej − Ei is the transition energy. It is clear thatthe state of the magnetic ion is not altered during sucha transition. The electron transition fulfills the selectionrules: ∆l = l′ − l = ±1; ∆sz = 0; and ∆Mz = 0.
A general form for the wave function of state i is:
Ψi(−→x∗,
−→M) =
Nc∑
α
cαΨiα(−→x∗,
−→M), (11)
5
0 1 2 3 4 5
50
100
150
200
250
300
350
400
450
3.0 3.5 4.080
100
120
En
erg
y s
pe
ctr
um
(m
eV
)
Ωc=ω
c/ω
0
s
p
d
f
f12
f13
No magnetic ion
(0,3,1/2)(0,3,1/2) (0,2,-1/2)
(0,2,-1/2)
(0,2,1/2)(0,1,-1
/2) (0,2,1/2)
(0,1,-1/2) (0,0,-1
/2)
(0,1,1/2)
(0,1,1/2)
(0,0,-1/2)
(0,0,1/2)
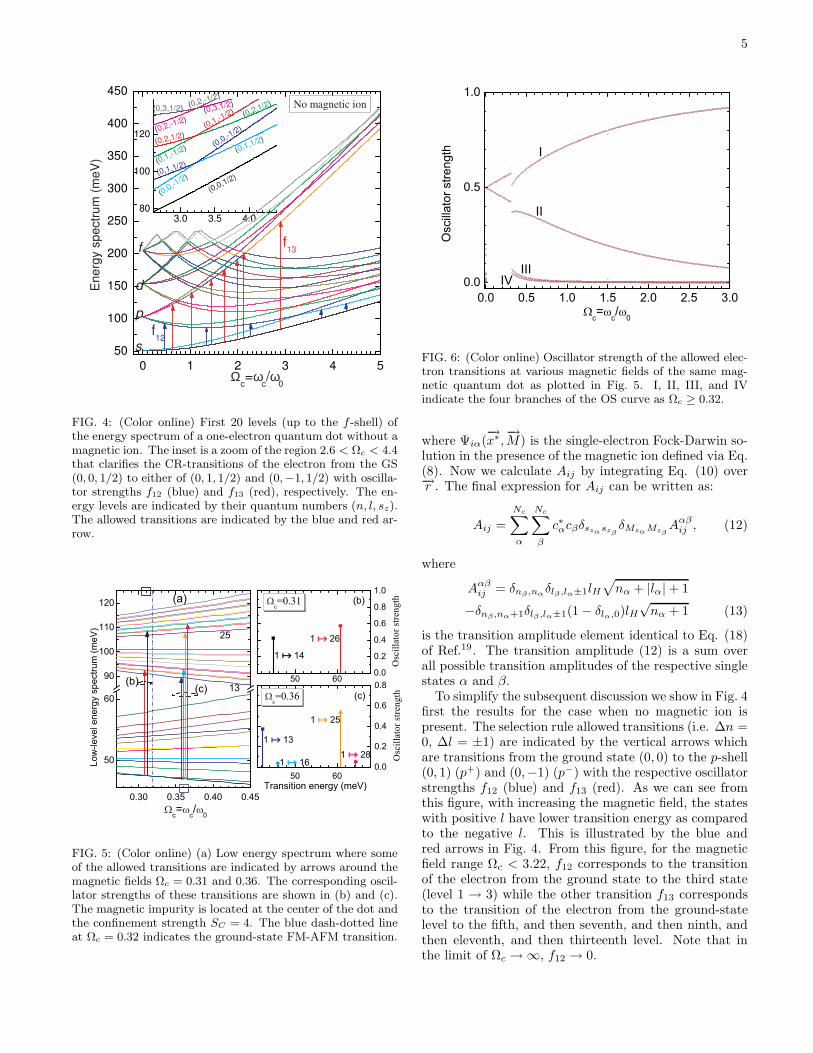
FIG. 4: (Color online) First 20 levels (up to the f -shell) ofthe energy spectrum of a one-electron quantum dot without amagnetic ion. The inset is a zoom of the region 2.6 < Ωc < 4.4that clarifies the CR-transitions of the electron from the GS(0, 0, 1/2) to either of (0, 1, 1/2) and (0,−1, 1/2) with oscilla-tor strengths f12 (blue) and f13 (red), respectively. The en-ergy levels are indicated by their quantum numbers (n, l, sz).The allowed transitions are indicated by the blue and red ar-row.
50 600.0
0.2
0.4
0.6
0.8
1.0
0.30 0.35 0.40 0.45
50
60
90
100
110
120
50 600.0
0.2
0.4
0.6
0.8
1 14
1 26
Osc
illat
or st
reng
th
c=0.31 (b)
Low
-leve
l ene
rgy
spec
trum
(meV
)
c= c/ 0
(b)(c)
(a)
13
25
1 25
1 281 13
1 16
Transition energy (meV)
Osc
illat
or st
reng
th
c=0.36 (c)
FIG. 5: (Color online) (a) Low energy spectrum where someof the allowed transitions are indicated by arrows around themagnetic fields Ωc = 0.31 and 0.36. The corresponding oscil-lator strengths of these transitions are shown in (b) and (c).The magnetic impurity is located at the center of the dot andthe confinement strength SC = 4. The blue dash-dotted lineat Ωc = 0.32 indicates the ground-state FM-AFM transition.
0.0 0.5 1.0 1.5 2.0 2.5 3.00.0
0.5
1.0
Osc
illat
or s
treng
th
c= c/ 0
I
II
IIIIV
FIG. 6: (Color online) Oscillator strength of the allowed elec-tron transitions at various magnetic fields of the same mag-netic quantum dot as plotted in Fig. 5. I, II, III, and IVindicate the four branches of the OS curve as Ωc ≥ 0.32.
where Ψiα(−→x∗,
−→M) is the single-electron Fock-Darwin so-
lution in the presence of the magnetic ion defined via Eq.(8). Now we calculate Aij by integrating Eq. (10) over−→r . The final expression for Aij can be written as:
Aij =
Nc∑
α
Nc∑
β
c∗αcβδszαszβδMzαMzβ
Aαβij , (12)
where
Aαβij = δnβ ,nα
δlβ ,lα±1lH√
nα + |lα| + 1
−δnβ,nα+1δlβ ,lα±1(1 − δlα,0)lH√
nα + 1 (13)
is the transition amplitude element identical to Eq. (18)of Ref.19. The transition amplitude (12) is a sum overall possible transition amplitudes of the respective singlestates α and β.
To simplify the subsequent discussion we show in Fig. 4first the results for the case when no magnetic ion ispresent. The selection rule allowed transitions (i.e. ∆n =0, ∆l = ±1) are indicated by the vertical arrows whichare transitions from the ground state (0, 0) to the p-shell(0, 1) (p+) and (0,−1) (p−) with the respective oscillatorstrengths f12 (blue) and f13 (red). As we can see fromthis figure, with increasing the magnetic field, the stateswith positive l have lower transition energy as comparedto the negative l. This is illustrated by the blue andred arrows in Fig. 4. From this figure, for the magneticfield range Ωc < 3.22, f12 corresponds to the transitionof the electron from the ground state to the third state(level 1 → 3) while the other transition f13 correspondsto the transition of the electron from the ground-statelevel to the fifth, and then seventh, and then ninth, andthen eleventh, and then thirteenth level. Note that inthe limit of Ωc → ∞, f12 → 0.
6
0.0 0.2 0.4 0.6 0.8 1.0 1.2 1.4 1.6 1.8 2.0
80
90
100
110
120
Energ
y s
pectr
um
(m
eV
)
Ωc=ω
c/ω
0
13
36
25
FM AFM
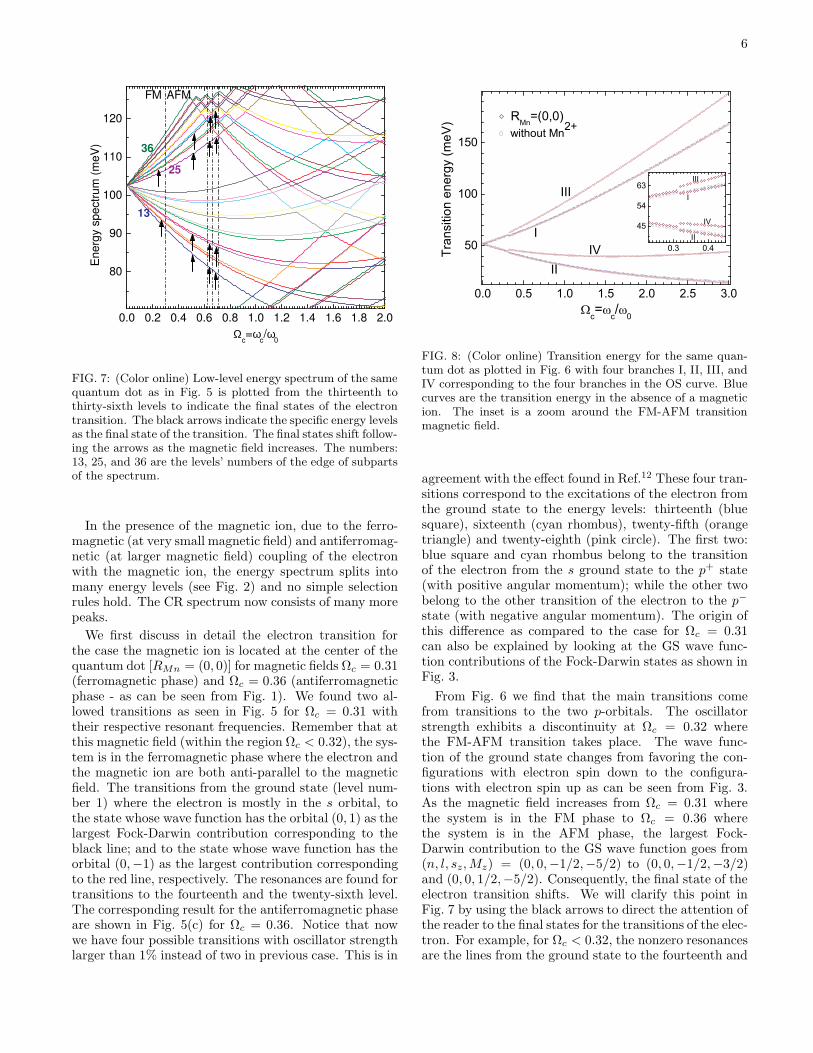
FIG. 7: (Color online) Low-level energy spectrum of the samequantum dot as in Fig. 5 is plotted from the thirteenth tothirty-sixth levels to indicate the final states of the electrontransition. The black arrows indicate the specific energy levelsas the final state of the transition. The final states shift follow-ing the arrows as the magnetic field increases. The numbers:13, 25, and 36 are the levels’ numbers of the edge of subpartsof the spectrum.
In the presence of the magnetic ion, due to the ferro-magnetic (at very small magnetic field) and antiferromag-netic (at larger magnetic field) coupling of the electronwith the magnetic ion, the energy spectrum splits intomany energy levels (see Fig. 2) and no simple selectionrules hold. The CR spectrum now consists of many morepeaks.
We first discuss in detail the electron transition forthe case the magnetic ion is located at the center of thequantum dot [RMn = (0, 0)] for magnetic fields Ωc = 0.31(ferromagnetic phase) and Ωc = 0.36 (antiferromagneticphase - as can be seen from Fig. 1). We found two al-lowed transitions as seen in Fig. 5 for Ωc = 0.31 withtheir respective resonant frequencies. Remember that atthis magnetic field (within the region Ωc < 0.32), the sys-tem is in the ferromagnetic phase where the electron andthe magnetic ion are both anti-parallel to the magneticfield. The transitions from the ground state (level num-ber 1) where the electron is mostly in the s orbital, tothe state whose wave function has the orbital (0, 1) as thelargest Fock-Darwin contribution corresponding to theblack line; and to the state whose wave function has theorbital (0,−1) as the largest contribution correspondingto the red line, respectively. The resonances are found fortransitions to the fourteenth and the twenty-sixth level.The corresponding result for the antiferromagnetic phaseare shown in Fig. 5(c) for Ωc = 0.36. Notice that nowwe have four possible transitions with oscillator strengthlarger than 1% instead of two in previous case. This is in
0.0 0.5 1.0 1.5 2.0 2.5 3.0
50
100
150
0.3 0.4
45
54
63
Tran
sitio
n en
ergy
(meV
)
c= c/ 0
RMn=(0,0)without Mn2+
I
II
III
IV
I
III
IV
II
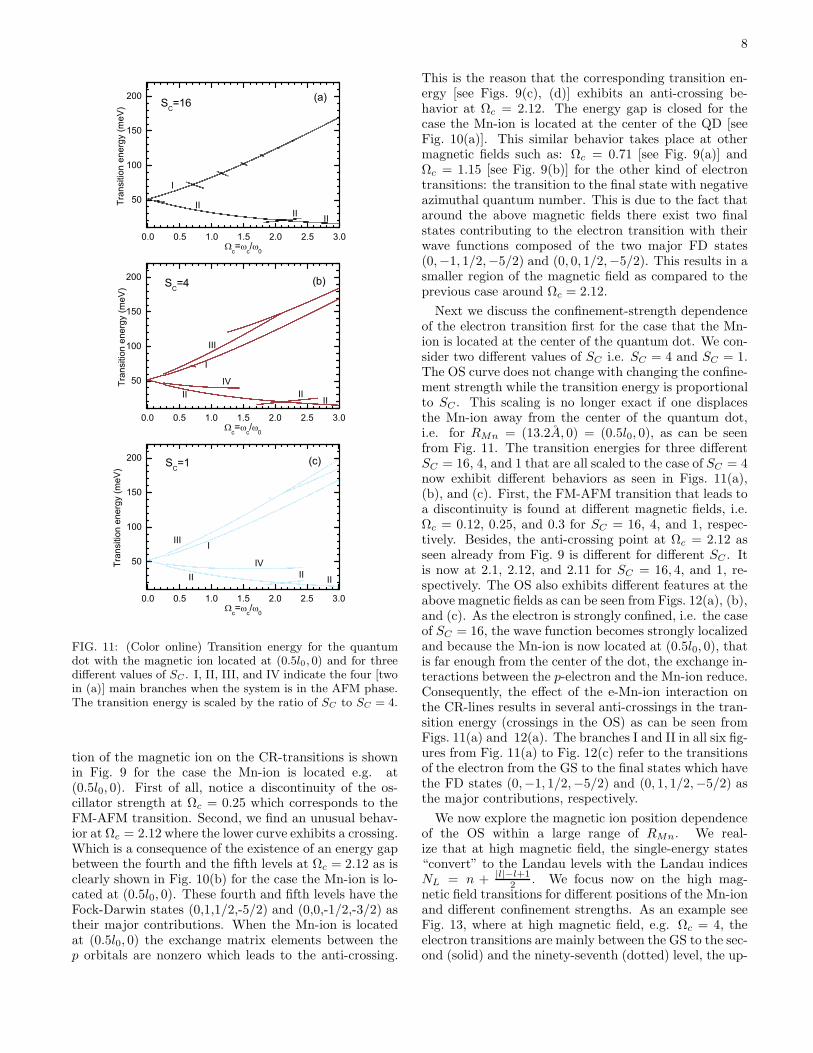
FIG. 8: (Color online) Transition energy for the same quan-tum dot as plotted in Fig. 6 with four branches I, II, III, andIV corresponding to the four branches in the OS curve. Bluecurves are the transition energy in the absence of a magneticion. The inset is a zoom around the FM-AFM transitionmagnetic field.
agreement with the effect found in Ref.12 These four tran-sitions correspond to the excitations of the electron fromthe ground state to the energy levels: thirteenth (bluesquare), sixteenth (cyan rhombus), twenty-fifth (orangetriangle) and twenty-eighth (pink circle). The first two:blue square and cyan rhombus belong to the transitionof the electron from the s ground state to the p+ state(with positive angular momentum); while the other twobelong to the other transition of the electron to the p−
state (with negative angular momentum). The origin ofthis difference as compared to the case for Ωc = 0.31can also be explained by looking at the GS wave func-tion contributions of the Fock-Darwin states as shown inFig. 3.
From Fig. 6 we find that the main transitions comefrom transitions to the two p-orbitals. The oscillatorstrength exhibits a discontinuity at Ωc = 0.32 wherethe FM-AFM transition takes place. The wave func-tion of the ground state changes from favoring the con-figurations with electron spin down to the configura-tions with electron spin up as can be seen from Fig. 3.As the magnetic field increases from Ωc = 0.31 wherethe system is in the FM phase to Ωc = 0.36 wherethe system is in the AFM phase, the largest Fock-Darwin contribution to the GS wave function goes from(n, l, sz, Mz) = (0, 0,−1/2,−5/2) to (0, 0,−1/2,−3/2)and (0, 0, 1/2,−5/2). Consequently, the final state of theelectron transition shifts. We will clarify this point inFig. 7 by using the black arrows to direct the attention ofthe reader to the final states for the transitions of the elec-tron. For example, for Ωc < 0.32, the nonzero resonancesare the lines from the ground state to the fourteenth and

7
0.0 0.5 1.0 1.5 2.0 2.5 3.0
0.0
0.5
1.0
0 1 2 3
50
100
150
0.69 0.720.0
0.2
0.4
0.6
1.14 1.160.0
0.3
0.6
2.0 2.515
20
25
Oscill
ato
r str
en
gth
Ωc=ω
c/ω
0
I
II
IIIIV
II
II
Tra
nsitio
n e
ne
rgy (
me
V)
Ωc=ω
c/ω
0
III I
II II
IV
(c)
II
(a)
(b)
(d) II
II
FIG. 9: (Color online) Oscillator strength with two zoomsaround Ωc = 0.71 (a) and Ωc = 1.15 (b) and transition en-ergy (c) with a zoom around Ωc = 2.12 (d) for the same quan-tum dot as plotted in Fig. 6 but the magnetic ion located at(0.5l0, 0). I, II, III, and IV indicate the four branches whenΩc ≥ 0.25 in the OS and the corresponding transition ener-gies.
the twenty-sixth levels. When the system transits to theAFM phase, the number of resonance lines increases fromtwo to four. In the region 0.32 ≤ Ωc < 0.62, the transi-tions are to the thirteenth and sixteenth level; the twenty-fifth and twenty-eighth; and the main contributions arethe lines to the thirteenth and the twenty-fifth, etc. Thisis explained as follows. For the FM magnetic field rangeΩc < 0.32, the electron and the Mn-ion both are antipar-allel to the magnetic field and sz + Mz = −3 with theconfiguration of (n = 0, l = 0, sz = −1/2, Mz = −5/2)having the probability almost unity. This is due to thefact that the commutator of the z-component of the totalspin commutes with the Hamiltonian, [sz + Mz, H ] = 0.Beyond this magnetic field region, Ωc ≥ 0.32, the electronand the Mn-ion are antiparallel and since the Zeeman(spin) part of the Mn-ion is always larger than the elec-tron’s and the exchange energy becomes the smallest oneamong these three competing energies there are two con-figurations (0, 0, 1/2,−5/2) and (0, 0,−1/2,−3/2) withsz + Mz = −2 of the GS wave function as the main con-tributions. It is obvious that the exchange energy nowhas the largest contribution coming from the second term[corresponding to configuration (0, 0, 1/2,−5/2)] and thesecond largest from the last term [corresponding to con-figuration (0, 0,−1/2,−3/2)] in the last sum in Eq. (5).As the system is in the AFM, the final states of themajor parts in the OS that are the branches I andII in Fig. 6 and the corresponding transition energiesin Fig. 8 have wave functions that are the FD states
1.0 1.5 2.0 2.5 3.0 3.5
60
65
70
1.0 1.5 2.0 2.5 3.0 3.5
60
65
70
En
erg
y (
me
V)
Ωc=ω
c/ω
0
234
5
67
8
910
11
12
13
RMn
=(0,0)
(a)
(b)
RMn
=(0.5l0,0)
En
erg
y (
me
V)
Ωc=ω
c/ω
0
2345
6
78
9
10
11
12
FIG. 10: (Color online) Zoom of the low-level spectrum ofFig. 2 for the cases the magnetic ion is located at the centerand at (0.5l0, 0) in the quantum dot. The black arrows in-dicate how the final state moves with magnetic field for thelowest energy CR transition.
(0,−1, 1/2,−5/2) and (0, 1, 1/2,−5/2), respectively, asthe major contributions. The other two transitions (IIIand IV) come from the spin-spin exchange interactionscorresponding to the final states that have wave functionscontaining FD states, respectively, (0,−1,−1/2,−3/2)and (0, 1,−1/2,−3/2) as their major contributions. Ingeneral, the largest one among all the small contribu-tions can reach to about 5 ÷ 10% of the total OS. Withincreasing magnetic field, these smaller contributions tothe OS decrease to zero.
The oscillator strength for the case the magnetic ionis located at the center of the dot samples the centralregion of the quantum dot. In this situation the mag-netic ion does not interact with the p-orbitals. The fourbranches in the OS (Fig. 6) and transition energy (Fig. 8)in the AFM phase are smooth with respect to magneticfield. With moving the Mn-ion to other positions awayfrom the center of the dot gives rise to the interactionsof the Mn-ion with the p-orbitals and this is expected tochange the OS by the changes in the two main branches(I and II in Figs. 6 and 8). The influence of the posi-
8
0.0 0.5 1.0 1.5 2.0 2.5 3.0
50
100
150
200
0.0 0.5 1.0 1.5 2.0 2.5 3.0
50
100
150
200
0.0 0.5 1.0 1.5 2.0 2.5 3.0
50
100
150
200
(c)
Tran
sitio
n en
ergy
(meV
)
c= c/ 0
SC=1
I
II
III
IVII II
Tran
sitio
n en
ergy
(meV
)
c= c/ 0
SC=16 (a)
I
IIII II
(b)
Tran
sitio
n en
ergy
(meV
)
c= c/ 0
SC=4
I
II
III
IVII
II
FIG. 11: (Color online) Transition energy for the quantumdot with the magnetic ion located at (0.5l0, 0) and for threedifferent values of SC . I, II, III, and IV indicate the four [twoin (a)] main branches when the system is in the AFM phase.The transition energy is scaled by the ratio of SC to SC = 4.
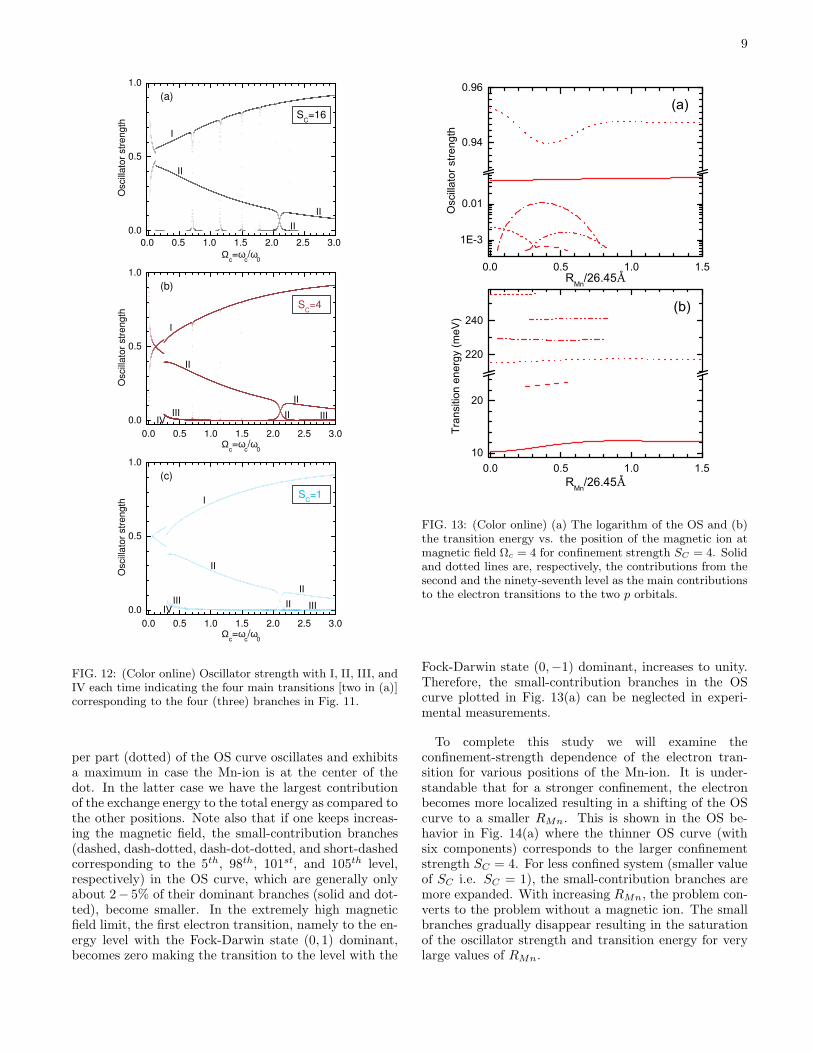
tion of the magnetic ion on the CR-transitions is shownin Fig. 9 for the case the Mn-ion is located e.g. at(0.5l0, 0). First of all, notice a discontinuity of the os-cillator strength at Ωc = 0.25 which corresponds to theFM-AFM transition. Second, we find an unusual behav-ior at Ωc = 2.12 where the lower curve exhibits a crossing.Which is a consequence of the existence of an energy gapbetween the fourth and the fifth levels at Ωc = 2.12 as isclearly shown in Fig. 10(b) for the case the Mn-ion is lo-cated at (0.5l0, 0). These fourth and fifth levels have theFock-Darwin states (0,1,1/2,-5/2) and (0,0,-1/2,-3/2) astheir major contributions. When the Mn-ion is locatedat (0.5l0, 0) the exchange matrix elements between thep orbitals are nonzero which leads to the anti-crossing.
This is the reason that the corresponding transition en-ergy [see Figs. 9(c), (d)] exhibits an anti-crossing be-havior at Ωc = 2.12. The energy gap is closed for thecase the Mn-ion is located at the center of the QD [seeFig. 10(a)]. This similar behavior takes place at othermagnetic fields such as: Ωc = 0.71 [see Fig. 9(a)] andΩc = 1.15 [see Fig. 9(b)] for the other kind of electrontransitions: the transition to the final state with negativeazimuthal quantum number. This is due to the fact thataround the above magnetic fields there exist two finalstates contributing to the electron transition with theirwave functions composed of the two major FD states(0,−1, 1/2,−5/2) and (0, 0, 1/2,−5/2). This results in asmaller region of the magnetic field as compared to theprevious case around Ωc = 2.12.
Next we discuss the confinement-strength dependenceof the electron transition first for the case that the Mn-ion is located at the center of the quantum dot. We con-sider two different values of SC i.e. SC = 4 and SC = 1.The OS curve does not change with changing the confine-ment strength while the transition energy is proportionalto SC . This scaling is no longer exact if one displacesthe Mn-ion away from the center of the quantum dot,i.e. for RMn = (13.2A, 0) = (0.5l0, 0), as can be seenfrom Fig. 11. The transition energies for three differentSC = 16, 4, and 1 that are all scaled to the case of SC = 4now exhibit different behaviors as seen in Figs. 11(a),(b), and (c). First, the FM-AFM transition that leads toa discontinuity is found at different magnetic fields, i.e.Ωc = 0.12, 0.25, and 0.3 for SC = 16, 4, and 1, respec-tively. Besides, the anti-crossing point at Ωc = 2.12 asseen already from Fig. 9 is different for different SC . Itis now at 2.1, 2.12, and 2.11 for SC = 16, 4, and 1, re-spectively. The OS also exhibits different features at theabove magnetic fields as can be seen from Figs. 12(a), (b),and (c). As the electron is strongly confined, i.e. the caseof SC = 16, the wave function becomes strongly localizedand because the Mn-ion is now located at (0.5l0, 0), thatis far enough from the center of the dot, the exchange in-teractions between the p-electron and the Mn-ion reduce.Consequently, the effect of the e-Mn-ion interaction onthe CR-lines results in several anti-crossings in the tran-sition energy (crossings in the OS) as can be seen fromFigs. 11(a) and 12(a). The branches I and II in all six fig-ures from Fig. 11(a) to Fig. 12(c) refer to the transitionsof the electron from the GS to the final states which havethe FD states (0,−1, 1/2,−5/2) and (0, 1, 1/2,−5/2) asthe major contributions, respectively.
We now explore the magnetic ion position dependenceof the OS within a large range of RMn. We real-ize that at high magnetic field, the single-energy states“convert” to the Landau levels with the Landau indicesNL = n + |l|−l+1
2 . We focus now on the high mag-netic field transitions for different positions of the Mn-ionand different confinement strengths. As an example seeFig. 13, where at high magnetic field, e.g. Ωc = 4, theelectron transitions are mainly between the GS to the sec-ond (solid) and the ninety-seventh (dotted) level, the up-
9
0.0 0.5 1.0 1.5 2.0 2.5 3.0
0.0
0.5
1.0
0.0 0.5 1.0 1.5 2.0 2.5 3.0
0.0
0.5
1.0
0.0 0.5 1.0 1.5 2.0 2.5 3.0
0.0
0.5
1.0
(c)
Oscill
ato
r str
en
gth
Ωc=ω
c/ω
0
SC=1
I
II
II
IIIII
IV III
(b)
Oscill
ato
r str
en
gth
Ωc=ω
c/ω
0
SC=4
II
I
II
IIIIV
II
III
Oscill
ato
r str
en
gth
Ωc=ω
c/ω
0
SC=16
I
II
II
II
(a)
FIG. 12: (Color online) Oscillator strength with I, II, III, andIV each time indicating the four main transitions [two in (a)]corresponding to the four (three) branches in Fig. 11.
per part (dotted) of the OS curve oscillates and exhibitsa maximum in case the Mn-ion is at the center of thedot. In the latter case we have the largest contributionof the exchange energy to the total energy as compared tothe other positions. Note also that if one keeps increas-ing the magnetic field, the small-contribution branches(dashed, dash-dotted, dash-dot-dotted, and short-dashedcorresponding to the 5th, 98th, 101st, and 105th level,respectively) in the OS curve, which are generally onlyabout 2− 5% of their dominant branches (solid and dot-ted), become smaller. In the extremely high magneticfield limit, the first electron transition, namely to the en-ergy level with the Fock-Darwin state (0, 1) dominant,becomes zero making the transition to the level with the
0.0 0.5 1.0 1.5
1E-3
0.01
0.94
0.96
0.0 0.5 1.0 1.510
20
220
240
Osc
illato
r stre
ngth
RMn/26.45Å
(a)
(b)
Tran
sitio
n en
ergy
(meV
)
RMn/26.45Å
FIG. 13: (Color online) (a) The logarithm of the OS and (b)the transition energy vs. the position of the magnetic ion atmagnetic field Ωc = 4 for confinement strength SC = 4. Solidand dotted lines are, respectively, the contributions from thesecond and the ninety-seventh level as the main contributionsto the electron transitions to the two p orbitals.
Fock-Darwin state (0,−1) dominant, increases to unity.Therefore, the small-contribution branches in the OScurve plotted in Fig. 13(a) can be neglected in experi-mental measurements.
To complete this study we will examine theconfinement-strength dependence of the electron tran-sition for various positions of the Mn-ion. It is under-standable that for a stronger confinement, the electronbecomes more localized resulting in a shifting of the OScurve to a smaller RMn. This is shown in the OS be-havior in Fig. 14(a) where the thinner OS curve (withsix components) corresponds to the larger confinementstrength SC = 4. For less confined system (smaller valueof SC i.e. SC = 1), the small-contribution branches aremore expanded. With increasing RMn, the problem con-verts to the problem without a magnetic ion. The smallbranches gradually disappear resulting in the saturationof the oscillator strength and transition energy for verylarge values of RMn.
10
0.0 0.5 1.0 1.5
1E-3
0.01
0.93
0.94
0.95
0.96
0.0 0.5 1.0 1.5
12
18
24
220
240
SC=1
Osc
illato
r stre
ngth
RMn/26.45Å
(a)
SC=4
(b)
Tran
sitio
n en
ergy
(meV
)
RMn/26.45Å
SC=1
SC=4
FIG. 14: (Color online) (a) The logarithm of the OS and (b)the transition energies of the same QD as plotted in Fig. 13but for two different confinement strengths SC = 4 (six redthinner curves) and SC = 1 (six cyan thicker curves). Thefinal levels with the same relative position in the OS and twoenergy spectra (for two different SC) have the same style ofline.
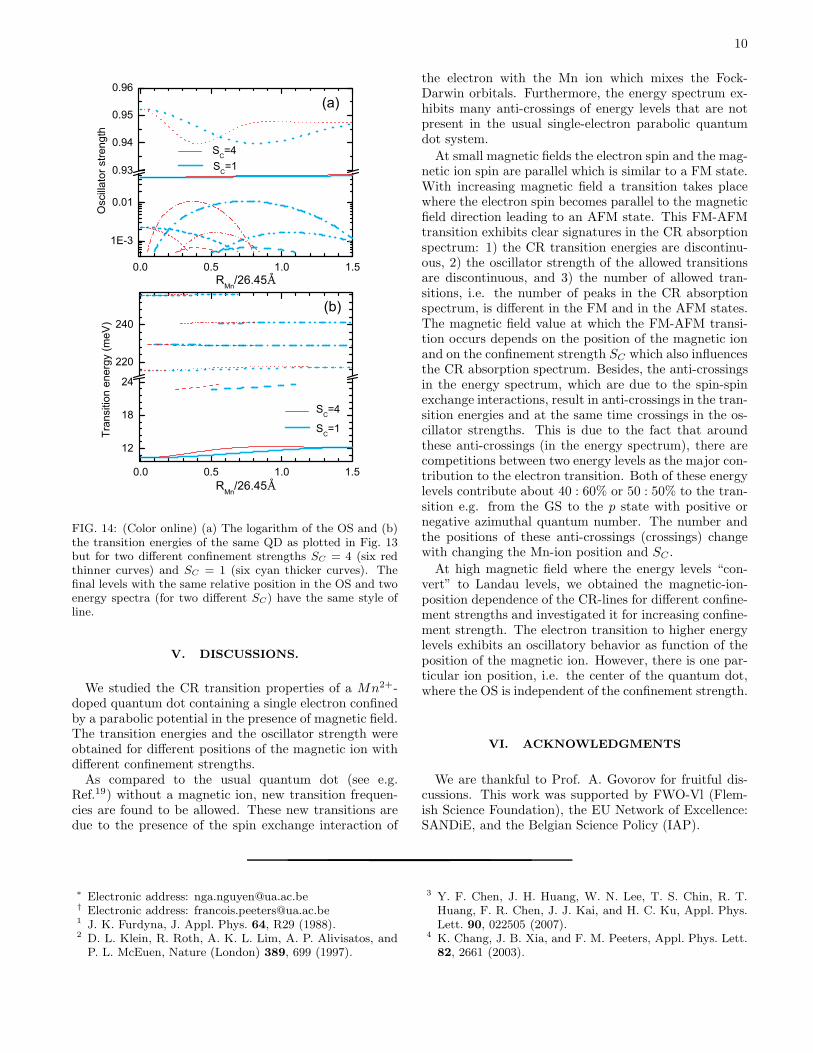
V. DISCUSSIONS.
We studied the CR transition properties of a Mn2+-doped quantum dot containing a single electron confinedby a parabolic potential in the presence of magnetic field.The transition energies and the oscillator strength wereobtained for different positions of the magnetic ion withdifferent confinement strengths.
As compared to the usual quantum dot (see e.g.Ref.19) without a magnetic ion, new transition frequen-cies are found to be allowed. These new transitions aredue to the presence of the spin exchange interaction of
the electron with the Mn ion which mixes the Fock-Darwin orbitals. Furthermore, the energy spectrum ex-hibits many anti-crossings of energy levels that are notpresent in the usual single-electron parabolic quantumdot system.
At small magnetic fields the electron spin and the mag-netic ion spin are parallel which is similar to a FM state.With increasing magnetic field a transition takes placewhere the electron spin becomes parallel to the magneticfield direction leading to an AFM state. This FM-AFMtransition exhibits clear signatures in the CR absorptionspectrum: 1) the CR transition energies are discontinu-ous, 2) the oscillator strength of the allowed transitionsare discontinuous, and 3) the number of allowed tran-sitions, i.e. the number of peaks in the CR absorptionspectrum, is different in the FM and in the AFM states.The magnetic field value at which the FM-AFM transi-tion occurs depends on the position of the magnetic ionand on the confinement strength SC which also influencesthe CR absorption spectrum. Besides, the anti-crossingsin the energy spectrum, which are due to the spin-spinexchange interactions, result in anti-crossings in the tran-sition energies and at the same time crossings in the os-cillator strengths. This is due to the fact that aroundthese anti-crossings (in the energy spectrum), there arecompetitions between two energy levels as the major con-tribution to the electron transition. Both of these energylevels contribute about 40 : 60% or 50 : 50% to the tran-sition e.g. from the GS to the p state with positive ornegative azimuthal quantum number. The number andthe positions of these anti-crossings (crossings) changewith changing the Mn-ion position and SC .
At high magnetic field where the energy levels “con-vert” to Landau levels, we obtained the magnetic-ion-position dependence of the CR-lines for different confine-ment strengths and investigated it for increasing confine-ment strength. The electron transition to higher energylevels exhibits an oscillatory behavior as function of theposition of the magnetic ion. However, there is one par-ticular ion position, i.e. the center of the quantum dot,where the OS is independent of the confinement strength.
VI. ACKNOWLEDGMENTS
We are thankful to Prof. A. Govorov for fruitful dis-cussions. This work was supported by FWO-Vl (Flem-ish Science Foundation), the EU Network of Excellence:SANDiE, and the Belgian Science Policy (IAP).
∗ Electronic address: [email protected]† Electronic address: [email protected] J. K. Furdyna, J. Appl. Phys. 64, R29 (1988).2 D. L. Klein, R. Roth, A. K. L. Lim, A. P. Alivisatos, and
P. L. McEuen, Nature (London) 389, 699 (1997).
3 Y. F. Chen, J. H. Huang, W. N. Lee, T. S. Chin, R. T.Huang, F. R. Chen, J. J. Kai, and H. C. Ku, Appl. Phys.Lett. 90, 022505 (2007).
4 K. Chang, J. B. Xia, and F. M. Peeters, Appl. Phys. Lett.82, 2661 (2003).
11
5 L. Besombes, Y. Leger, L. Maingault, D. Ferrand, H. Ma-riette, and J. Cibert, Phys. Rev. Lett. 93, 207403 (2004).
6 A. O. Govorov, Phys. Rev. B 70, 035321 (2004); 72,075358 (2005).
7 Paul I. Archer, Steven A. Santangelo, and Daniel R.Gamelin, Nano Lett. 7, 1037 (2007).
8 T. Schmidt, M. Scheibner, L. Worschech, A. Forchel, T.Slobodskyy, and L. W. Molenkamp, J. Appl. Phys. 100,123109 (2006).
9 P. Wojnar, J. Suffczynski, K. Kowalik, A. Golnik, G. Kar-czewski, and J. Kossut, Phys. Rev. B 75, 155301 (2007).
10 J. Fernandez-Rossier and Ramon Aguado, Phys. Rev. Lett.98, 106805 (2007); J. Fernandez-Rossier, Phys. Rev. B 73
, 045301 (2006).11 Y. Leger, L. Besombes, J. Fernandez-Rossier, L. Main-
gault, and H. Mariette, Phys. Rev. Lett. 97, 107401 (2006);L. Maingault, L. Besombes, Y. Leger, H. Mariette, andC. Bougerol, Phys. Stat. Sol. (c) 3, 3992 (2006); M. M.Glazov, E. L. Ivchenko, L. Besombes, Y. Leger, L. Main-
gault, and H. Mariette, Phys. Rev. B 75 205313 (2007).12 I. Savic and N. Vukmirovic, Phys. Rev. B 76, 245307
(2007).13 Shun-Jen Cheng, Phys. Rev. B 72, 235332 (2005); 77,
115310 (2008).14 F. Qu and P. Hawrylak, Phys. Rev. Lett. 95, 217206
(2005); 96, 157201 (2006).15 Nga T. T. Nguyen and F. M. Peeters, Phys. Rev. B 76,
045315 (2007)16 Nga T. T. Nguyen and F. M. Peeters, Phys. Rev. B 78,
045321 (2008).17 W. Kohn and J. M. Luttinger, Phys. Rev. 96, 529 (1954);
J. M. Luttinger, Phys. Rev. 102, 1030 (1956).18 Sikorski and U. Merkt, Surf. Sci. 229, 282 (1990); Ulrich
Merkt, Phys. Rev. Lett. 76, 1134 (1996).19 F. Geerinckx, F. M. Peeters, and J. T. Devreese, J. Appl.
Phys. 68, 3435 (1990).20 F. M. Peeters, Phys. Rev. B 42, 1486 (1990).
Related Documents