Mechanics & Industry 15, 467–476 (2014) c AFM, EDP Sciences 2014 DOI: 10.1051/meca/2014061 www.mechanics-industry.org Mechanics & Industry Cyclostationarity applied to acoustic emission and development of a new indicator for monitoring bearing defects M. Kedadouche, M. Thomas a and A. Tahan Department of Mechanical Engineering, ´ Ecole de Technologie Sup´ erieure, 1100, Notre-Dame street West, Montreal, H3C 1K3, Quebec, Canada Received 17 June 2013, Accepted 15 May 2014 Abstract – The exploitation of cyclostationarity properties of vibratory signals is now more widely used for monitoring rotating machinery and especially for diagnosing bearing defects. The acoustic emission (AE) technology has also emerged as a reliable tool for preventive maintenance of rotating machines. In this study, we propose an experimental study that characterizes the cyclostationary aspect of acoustic emission (AE) signals recorded from a defective bearing (40 μm on the outer race) to see its efficiency to detect a defect at its very early stage of degradation. An industrial sensor (UE10 000) is used. An electrical circuit converts the high frequency signal into an audible signal by heterodyning. The cyclic spectral density, which is a tool dedicated that put into evidence the presence of cyclostationarity, is used for characterizing the cyclostationary. Two new indicators based on this cyclostationary technique are proposed and compared for early detection of defective bearings. Key words: Acoustic emission / cyclostationarity / indicator of cyclostationarity / rolling bearing 1 Introduction Most researches on machinery fault diagnosis can be classified in time, frequency or time-frequency domain. In time domain, the RMS value of vibratory signals, Crest Factor (CF), Skewness and Kurtosis are the most used statistical descriptors since they are scalar [1, 2]. Tech- niques advanced signal processing have been widely used in vibration. In the frequency domain, the envelope anal- ysis, also known as amplitude demodulation, has been widely used and proved to be very effective in detecting bearing characteristic frequencies. On the other hand, many research studies have been published on the detection and diagnosis of bearing de- fects by acoustic emission. Tandon and Choudhury [3] presented a detailed review of vibration and acoustic methods, noise measurements, shock waves and acous- tic emission technique. They updated critical works [4] incorporating latest and advanced techniques. Yongyong et al. [5] presented a detailed review of the application of acoustic emission for monitoring bearings. There are few publications on the application of ultrasonic techniques for monitoring bearing condition [6, 7]. Kim et al. [8] fo- cused on the diagnosis of bearings (defect about 100 μm) operating at low speeds. Kedadouche et al. [9] presented a a Corresponding author: [email protected] comparative study between acoustic emission and vibra- tion. This study was focused on the diagnostic of bear- ing which presents a defect at an early stage (40 μm). Chiementin et al. [10] used time domain indicators: RMS, Kurtosis, and proposed to improve the signal-to-noise ra- tio by applying denoising techniques (wavelet, spectral subtraction, sanc) on experimental acquired AE data. Liao et al. [11] used wavelet analysis and Zvokelj et al. [12] were interested in the application of empirical mode decomposition (EMD) applied to AE signals. Recently, Kilundu et al. [13] applied the cyclostationary on acous- tic emission and showed the effectiveness of the spectral correlation and the ICS (integrated correlation spectral) indicator for monitoring bearing defect but with relatively big defect sizes. The aim of this study is to investigate the effectiveness of acoustic emission techniques to detect bearing defects at a very early stage and compare the results with signals from vibration measurements, using an experimental ap- proach. An artificially defect in the form of a scratch with a 40 microns size, induced on the outer ring of the bear- ing was used for this comparative study. It is the smallest bearing fault size that has ever been investigated in liter- ature. The ultrasonic sensor (UE 10 000) is used with an electrical circuit that converts the high frequency signal into an audible signal EA by heterodyning. The ultrasonic signals from a normal bearing and those of the damaged Article published by EDP Sciences

Welcome message from author
This document is posted to help you gain knowledge. Please leave a comment to let me know what you think about it! Share it to your friends and learn new things together.
Transcript
Mechanics & Industry 15, 467–476 (2014)c© AFM, EDP Sciences 2014DOI: 10.1051/meca/2014061www.mechanics-industry.org
Mechanics&Industry
Cyclostationarity applied to acoustic emission and developmentof a new indicator for monitoring bearing defects
M. Kedadouche, M. Thomasa and A. Tahan
Department of Mechanical Engineering, Ecole de Technologie Superieure, 1100, Notre-Dame street West, Montreal, H3C 1K3,Quebec, Canada
Received 17 June 2013, Accepted 15 May 2014
Abstract – The exploitation of cyclostationarity properties of vibratory signals is now more widely used formonitoring rotating machinery and especially for diagnosing bearing defects. The acoustic emission (AE)technology has also emerged as a reliable tool for preventive maintenance of rotating machines. In thisstudy, we propose an experimental study that characterizes the cyclostationary aspect of acoustic emission(AE) signals recorded from a defective bearing (40 µm on the outer race) to see its efficiency to detect adefect at its very early stage of degradation. An industrial sensor (UE10 000) is used. An electrical circuitconverts the high frequency signal into an audible signal by heterodyning. The cyclic spectral density, whichis a tool dedicated that put into evidence the presence of cyclostationarity, is used for characterizing thecyclostationary. Two new indicators based on this cyclostationary technique are proposed and comparedfor early detection of defective bearings.
Key words: Acoustic emission / cyclostationarity / indicator of cyclostationarity / rolling bearing
1 Introduction
Most researches on machinery fault diagnosis can beclassified in time, frequency or time-frequency domain. Intime domain, the RMS value of vibratory signals, CrestFactor (CF), Skewness and Kurtosis are the most usedstatistical descriptors since they are scalar [1, 2]. Tech-niques advanced signal processing have been widely usedin vibration. In the frequency domain, the envelope anal-ysis, also known as amplitude demodulation, has beenwidely used and proved to be very effective in detectingbearing characteristic frequencies.
On the other hand, many research studies have beenpublished on the detection and diagnosis of bearing de-fects by acoustic emission. Tandon and Choudhury [3]presented a detailed review of vibration and acousticmethods, noise measurements, shock waves and acous-tic emission technique. They updated critical works [4]incorporating latest and advanced techniques. Yongyonget al. [5] presented a detailed review of the application ofacoustic emission for monitoring bearings. There are fewpublications on the application of ultrasonic techniquesfor monitoring bearing condition [6, 7]. Kim et al. [8] fo-cused on the diagnosis of bearings (defect about 100 μm)operating at low speeds. Kedadouche et al. [9] presented a
a Corresponding author: [email protected]
comparative study between acoustic emission and vibra-tion. This study was focused on the diagnostic of bear-ing which presents a defect at an early stage (40 μm).Chiementin et al. [10] used time domain indicators: RMS,Kurtosis, and proposed to improve the signal-to-noise ra-tio by applying denoising techniques (wavelet, spectralsubtraction, sanc) on experimental acquired AE data.Liao et al. [11] used wavelet analysis and Zvokelj et al. [12]were interested in the application of empirical modedecomposition (EMD) applied to AE signals. Recently,Kilundu et al. [13] applied the cyclostationary on acous-tic emission and showed the effectiveness of the spectralcorrelation and the ICS (integrated correlation spectral)indicator for monitoring bearing defect but with relativelybig defect sizes.
The aim of this study is to investigate the effectivenessof acoustic emission techniques to detect bearing defectsat a very early stage and compare the results with signalsfrom vibration measurements, using an experimental ap-proach. An artificially defect in the form of a scratch witha 40 microns size, induced on the outer ring of the bear-ing was used for this comparative study. It is the smallestbearing fault size that has ever been investigated in liter-ature. The ultrasonic sensor (UE 10 000) is used with anelectrical circuit that converts the high frequency signalinto an audible signal EA by heterodyning. The ultrasonicsignals from a normal bearing and those of the damaged
Article published by EDP Sciences

468 M. Kedadouche et al.: Mechanics & Industry 15, 467–476 (2014)
Fig. 1. Methodology for processing cyclostationary machine signals, Antoni et al. [15].
bearing are compared with vibration signals at speeds ofrotation ranging from 300 rpm to 900 rpm. This paperfirst highlights the cyclostationary character of AE asso-ciated with a defective bearing, and secondly, shows theeffectiveness of the density spectral cyclic for diagnosis.Finally, new indicators for monitoring bearings based oncyclostationarity characteristics are presented.
2 Cyclostationarity
A signal is cyclostationary at an order “n”, if its statis-tical properties, at an order “n” are periodic. Antoni [14]presented a review of cyclostatinary processes and givesmany examples. It is well known that the defects on therolling bearing produce a series of shocks. These shocksare not perfectly periodic because of slips. Antony hassuggested that these slips are non-stationary process andmay be approximated as quasi-cyclostationary over onlya limited period of time [15]. Kilundu et al. [13] note thatthe acoustic emission is similar to vibrations and sug-gest the same cyclostationarity properties for AE signalarising from a defective bearing. An efficient method fortesting cyclostationarity of a signal X(t) (residual partafter extracting the deterministic part of the signal) isto compute the two-dimensional Fourier transform of itsautocorrelation function Rxx(t, τ) i.e
Sx(F, α)dfdx = DFTt→α,τ→f{Rxx(t, τ)} (1)
where f and α are, respectively, the spectral and cyclicfrequencies.
The cyclic power spectral density of the signal is es-timated by using Welch’s averaged periodogram method.The parameters and the method are set based on the
recommendations of Antoni [21, 22]. For this investiga-tion the parameters employed for obtaining the averagedcyclic periodogram estimate were as follows:
– hanning window with 2/3 overlap;– window length: 256;– cyclic frequency resolution: 0.2 Hz.
2.1 Methodologies for processing cyclostationarysignals
Antoni et al. [15] presented a review of some sig-nal processing tools dedicated to cyclostationary sig-nals (Fig. 1) when the signals are issued from rotatingmachines. Figure 1 presents an organization chart fordifferent steps.
The technique consists in resampling the signal in theangle domain (Step 1) and extracting the angle periodiccomponent using the synchronous average (Step 2). Afterthat, the residual (2sd order) may be computed by ex-tracting the periodic part (deterministic) from the orig-inal signal (Step 3). If we cannot resample the signal inthe angle domain, other tools may be used which are ded-icated to extract the deterministic part for any signal likeComb-filter, ALE, SANC and DRSep. . . etc. In the lastdecades, several blind algorithms were dedicated to theseparation of mixtures of unobserved signals. Recently ap-plied to mechanical systems and in particular to rotatingmachines that usually generate vibration signals exhibit-ing cyclostationarity, Bonnardot et al. [16] developed amultiple cyclic regression (MCR) technique for extract-ing the 2sd order of a signal. Boustany and Antoni [17]proposed a new method called SUBLEX which achieves tothe same objectives under the same assumptions as [16],but using a different approach. After that, Boustany and
M. Kedadouche et al.: Mechanics & Industry 15, 467–476 (2014) 469
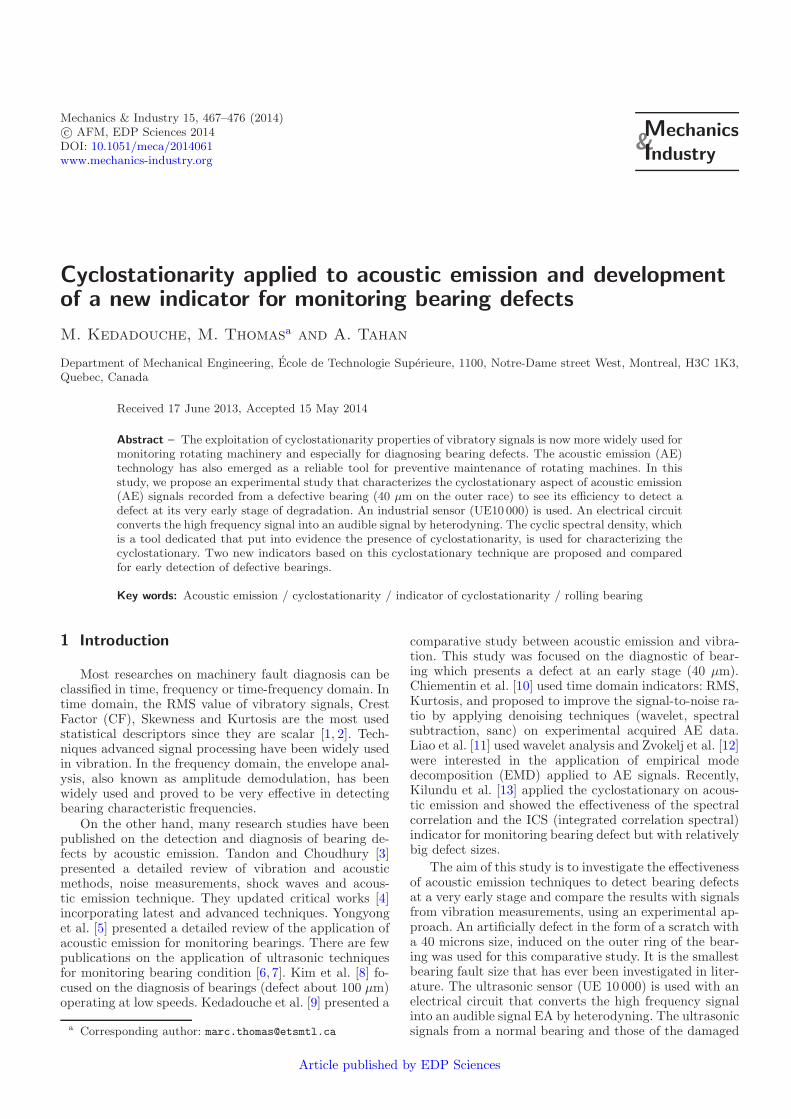
Fig. 2. Methodology for processing cyclostationary machine signals by extracting the second order.
(a) (b)
Fig. 3. (a) Experimental test bench, (b) the defect on outer ring.
Antoni [18] proposed a new effective method called RRCR(Reduced-Rank Cyclic Regression) that benefits from therespective advantages of the original MCR and SUBLEXmethods but suppresses their drawbacks. All these tech-nique may be used to study the cyclostationary of rotatingmachine (Fig. 2). In this paper, the last method (RRCR)is used for extracting the second order of the signal fromthe acoustic emission and from the vibration signal in or-der to compute their cyclic spectral density (CSD).
3 Experimental study
The test bench used in this study is shown in Fig-ure 3a. A shaft is supported by two bearings and con-nected to a motor with a flanged coupling bolted rub-ber. Two systems were investigated, one with a healthybearing (SKF, 1210 EKTN9) and the other with an arti-ficially damaged bearing on the outer race (defect order:BPFO = 7.24). The default size is 40 microns as shownin Figure 3b.
The equipments for vibration data collection and ul-trasound are shown in Figure 4a. They consist in an ac-celerometer with a sensitivity of 100 mV.g−1 and an ul-trasound detector (UE Systems UltraProb 10 000). Both
sensors are connected to an analogous digital converter(THOR Analyzer PRO: DT9837-13310) with a samplingfrequency of 48 kHz. The latter is connected to a collector-analyzer BETAVIB. The ultrasonic sensor used in thisstudy operates in the lower ultrasonic spectrum from20 kHz to 100 kHz. A heterodyne circuit converts thehigh frequency acoustic emission signal as detected by thetransducer around a central frequency Fc into an audiblesignal (0–7 kHz) (Fig. 4b). The heterodyned signal maythen be recorded through conventional data acquisitionsystem at 48 kHz. The mechanical system is excited byan unbalance mass rotating. The acoustic emission signalsfrom the two bearings (healthy and faulty) are recordedat the central frequency of 30 kHz which was found asthe more sensitive to the defect when rotating at variousspeeds (300, 600 and 900 rpm).
4 Results analysis and applications
4.1 Vibration signal
Figures 5a and 5b show, respectively, the vibration sig-nal of the damaged bearing when operating at 300 rpmand its second order obtained by RCRR. Figure 5c shows

470 M. Kedadouche et al.: Mechanics & Industry 15, 467–476 (2014)
(a)
Audible Frequency Ultrasound
(b)
Fig. 4. (a) Data acquisition system, (b) heterodyne principle.
0 0.5 1 1.5 2 2.5
x 105
-0.5
-0.4
-0.3
-0.2
-0.1
0
0.1
0.2
0.3
0.4
0.5
Sample
Am
plit
ud
e(g
)
(a)
0 0.5 1 1.5 2 2.5
x 105
-0.5
-0.4
-0.3
-0.2
-0.1
0
0.1
0.2
0.3
0.4
0.5
Sample
(b)
0 0.5 1 1.5 2
x 104
0
5
10
15
20
25
30
35
40
45
50
Frequency (Hz)
Am
plit
ude
(mm
/s)
Original signal 2nd order
0 50 100 150 200 250 3000
5
10
15
X: 9.888Y: 4.07
Rotational frequency and its harmonic
BPFO
(c)
0 0.5 1 1.5 2
x 104
0
5
10
15
20
25
30
35
40
45
50
Frequency (Hz)
Am
plit
ude
(mm
/s)
20 40 60 80 100 120 140 160 180 200 220
1
2
3
4
5
6
7
2nd order Original signal
BPFO
Rotational frequency
(d)
Fig. 5. (a) Vibration signal of the defective bearing, (b) second order after applying the RRCR method of the defective bearing,(c) spectrum of (a) and (b) of the defective bearing, (d) spectrum of the healthy bearing.

M. Kedadouche et al.: Mechanics & Industry 15, 467–476 (2014) 471
(a) (b)
Fig. 6. CSD of vibration signal: (a) healthy bearing, (b) defective bearing.
the spectrum of the original signal (Blue line) and its 2ndorder (Red line) for the defective bearing while Figure 5dexhibits the spectrum for the healthy bearing. A zoomaround [0–300 Hz] reveals that the frequency related tothe rotation of the shaft (deterministic part) exists only inthe original signal, while we can observe the bearing fre-quency (BPFO) in the 2nd order spectrum in both cases(healthy and faulty), but with a very small amplitude. Allother deterministic peaks were filtered in the 2nd orderspectrum.
Figure 6 compares the cyclic spectral density (CSD)between the healthy and defective bearing. Figure 6bclearly exhibits BPFO and its harmonics around the reso-nance of bearing which are located between [500–1500 Hz]and [4000–5000 Hz], with a level of energy definitely largerthan for the healthy bearing (Fig. 6a).
4.2 Acoustic emission signal
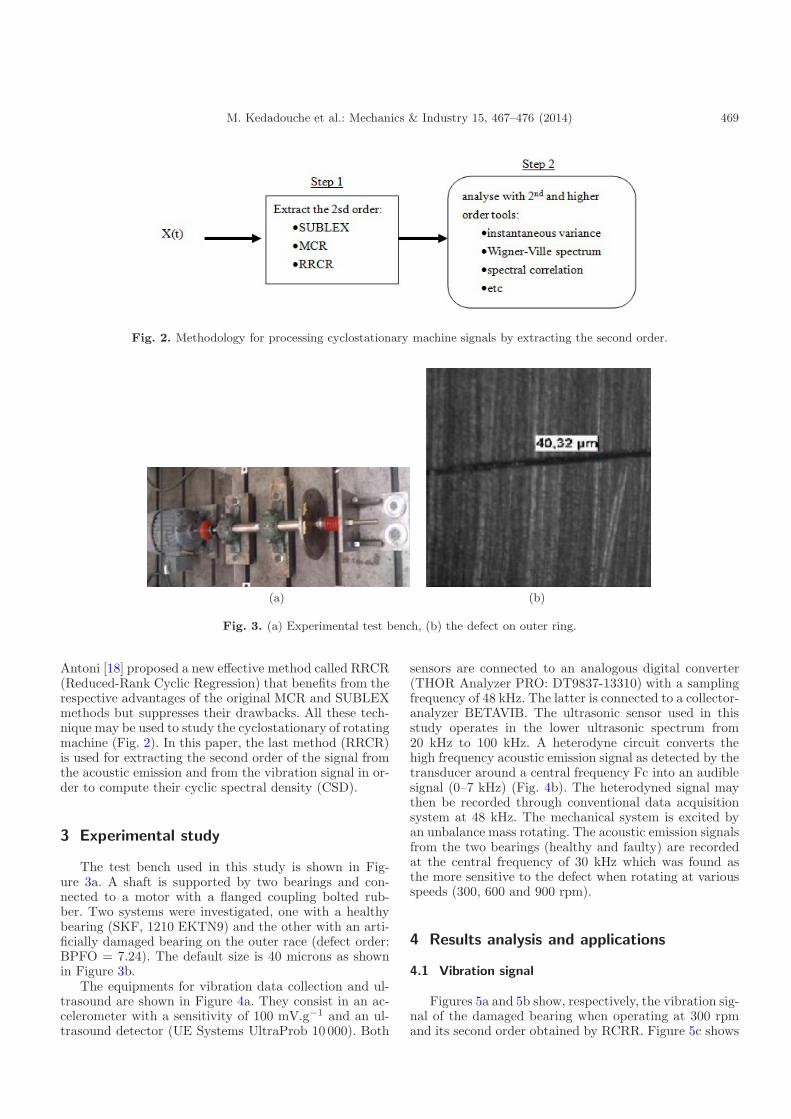
Figures 7a and 7b show, respectively, the ultrasonicsignal of the damaged bearing when operating at 300 rpmand its second order obtained by RCRR. We note that thesecond order is the same as the original signal when a de-fect is present. The acoustic emission doesn’t detect infor-mation related to the rotational frequency (deterministicpart), but we observe a decrease of noise. Figure 7c showsthe spectrum of the original signal (Blue line) and its 2ndorder (Red line) for the defective bearing while Figure 7dexhibits the spectrum for the healthy bearing. A zoomaround [0–300 Hz] reveals that the spectrum of the 2ndorder is the same as the spectrum of the original signalwhen a defect is present while its amplitude is lower whenthere is no defect. At this speed we can consider that theoriginal signal recorded by acoustic emission is at order 2.It is in fact the main advantage of acoustic emission mea-surements. However, the contribution of the deterministicpart is lost.
Similarly to vibration analysis, Figure 8b clearly high-lights the CSD of ultrasonic signal of the defective
bearing, showing the manifestation of BPFO and its har-monics around the resonance [500–1500 Hz] with a levelof energy of the CSD definitely larger than for the healthybearing (Fig. 8a).
4.3 Comparison between vibration and acousticemission
Figures 9–11 represent the CSD of vibration andacoustic measurements for the defective bearing at speedsof 300 rpm, 600 rpm and 900 rpm, respectively. It canbe noticed that acoustic emission detects BPFO and itsharmonics for all speeds. However, the vibration measure-ments show only the manifestation of BPFO when oper-ating at low speed (300 rpm) but only an increase of theenergy at high frequencies around the resonance can benoticed for the two other speeds. In conclusion, it is clearthat the acoustic emission measurement is more efficientto detect a defect than vibration measurements when thedefect is very small (40 μm) for an early stage of degra-dation when increasing the speed.
4.4 New indicator of cyclostationary
In order to track the defect evolution, Kilinduet al. [13] proposed a new indicator called IntegratedSpectral Correlation denoted ICS, to evaluate energy atthe defect frequency (Eq. (2)) from the CSD. The in-dicator is computed by integrating the magnitude of thespectral correlation between α1,2 = fbearing(1±1%) alongα-axis, and for all the values along f -axis (Eq. (2)).
ICS =α2∑
α=α1
fs/2∑0
‖Sαx ‖ (2)
where fs is the sample frequency.
472 M. Kedadouche et al.: Mechanics & Industry 15, 467–476 (2014)
0 0.5 1 1.5 2 2.5
x 105
-1
-0.8
-0.6
-0.4
-0.2
0
0.2
0.4
0.6
0.8
1
Sample
Am
plit
ude(
v)
(a)
0 0.5 1 1.5 2 2.5
x 105
-1
-0.8
-0.6
-0.4
-0.2
0
0.2
0.4
0.6
0.8
1
Sample
Am
plit
ude(
v)
(b)
0 0.5 1 1.5 2
x 104
0
1
2
3
4
5
6
7
8x 10
-3
Frequency (Hz)
Am
plit
ude(
V)
0 50 100 150 200 250 3000
1
2
3
4x 10
-3
original signal2nd order
(c)
(d)
Fig. 7. (a) Ultrasonic signal of the defective bearing, (b) second order after applying the RRCR method of the defective bearing,(c) spectrum of (a) and (b) of the defective bearing, (d) spectrum of the healthy bearing.
If the defect is applied to outer race, the bearing fre-quency BPFO appears:
fbearing = BPFO =NB
2
(1 − Bd
Pdcos θ
)w (3)
where Bd is the diameter of the balls; Pd is the diametralpitch; θ is the contact angle; Nb is the number of ballsand w is the rotational speed.
However, it is well known that the increase of degrada-tion of a faulty bearing not only causes an increase in theamplitude of the vibration frequencies of bearings, but
also generates vibration harmonics of these frequencies aswell as modulation frequencies. Consequently, the key ofdiagnostic relies on the number of harmonic of the bearingfrequency and of their modulation frequencies [19, 20].
We have tried to develop two new indicators like ICSthat are denoted ICS1 and ICS2 which take into accountthe amplitude modulation of the defects and the fre-quency resonance of the bearing:
– For the first one, the ICS is computed by integrat-ing the magnitude of the cyclic spectral density be-tween (BPFO−2.2×Fr and BPFO+2.2×Fr) along

M. Kedadouche et al.: Mechanics & Industry 15, 467–476 (2014) 473
(a) (b)
Fig. 8. CSD of ultrasonic signal: (a) healthy bearing, (b) defective bearing.
(a) (b)
Fig. 9. CSD of defective bearing at speed of 300 rpm: (a) vibration, (b) ultrasound.
(a) (b)
Fig. 10. CSD of defective bearing at speed 600 rpm: (a) vibration, (b) ultrasound.

474 M. Kedadouche et al.: Mechanics & Industry 15, 467–476 (2014)
(a) (b)
Fig. 11. SCD of defective bearing at speed 900 rpm: (a) vibration, (b) ultrasound.
Fig. 12. Indicators of cyclostationarity at different speeds, healthy bearing, defective bearing.
α-axis, and for all the values f around the resonance(Eq. (4)).
ICS1 =3∑
n=1
b∑a
f2∑f1
‖Sαx ‖ (4)
where a = n×BPFO− (2.2×fr) and b = n×BPFO+(2.2 × fr) and fr is frequency of rotational speed.
– For the second one, the ICS is computed by integratingthe magnitude of the cyclic spectral density between(BPFO − 2.2 × Fr, BPFO + 2.2 × Fr) along α-axis,and for all the values along f -axis (Eq. (5)).
ICS2 =3∑
n=1
b∑a
Fs/2∑1
‖Sαx ‖ (5)
Figure 12 shows the indicators (ICS, ICS1 and ICS2) com-puted for the healthy bearing (Blue bar) and the defectivebearing (Red bar) at different speeds.
When rotating at 300 rpm, all the three indicators maydistinguish between the healthy and defective bearing andit can be noticed that the two new indicators (ICS1 andICS2) are more sensitive than the ordinary ICS. However,
at higher speeds (600 and 900 rpm), all these indicatorsare not efficient. We suppose that the problem may bedue to the fact that when the defect size is very small,the amplitude of the healthy bearing is equivalent to theamplitude of the defective bearing due to the effect ofother excitations that act in the high frequency domain(friction, lubricant, etc.).
For enhancing these indicators, we have investigatedthree new indicators. We propose to normalize the pre-vious indicators by dividing them by time descriptorsof the original signal. The new indicators (ICSN: Inte-grated Cyclic Spectral Normalised) are normalized rel-ative to their RMS, Skewness, and kurtosis given byEquations (6)–(8).
SD =
√√√√ 1N
N∑1
(xi − x)2 (6)
Skewness =1N
∑Ni=1(xi − x)3(
1N
∑Ni=1(xi − x)2
)3/2(7)
kurtosis =1N
∑Ni=1(xi − x)4
RMS4 (8)

M. Kedadouche et al.: Mechanics & Industry 15, 467–476 (2014) 475
Table 1. Temporal descriptors for the healthy and the defective bearing at different speeds.
Healthy bearing Defect bearingSpeed Kurtoss RMS Skew Speed Kurtosis RMS Skew300 153.169 0.021 2.073 300 118,05 0,038 0,93600 83.556 0.040 0.654 600 57.13 0.034 0.0057900 82.459 0.017 1.025 900 61.10 0.025 0.1355
Fig. 13. Indicators of cyclostationarity normalized by RMS for different speeds, healthy bearing, defective bearing.
Fig. 14. Indicators of cyclostationarity normalized by Kurtosis for different speeds, healthy bearing, defective bearing.
Table 1 presents the values of the temporal descriptorsof the healthy bearing and the defective one. It is wellknown that the Kurtosis and Skewness are so sensible torandom chocks. Due to the effect of excitations, that act inthe high frequency domain (friction, lubricant, etc.), thehealthy bearing produces random chocks. For this reasonwe note that the Kurtosis and Skewness of the healthybearing are greater than for the defective bearing.
Figures 13–15 show the indicators normalised byRMS, Kurtosis and Skewness, respectively, and computedfor the healthy bearing (Blue bar) and the defective bear-ing (Red bar).– When rotating at low speed (300 rpm), all the indica-
tors normalised are efficient and the ICSN2 is the bestcompared to others indicators.
– When rotating at 600 rpm, only ICSN2 makes a dif-ference between the healthy and the defective bearing,for all the indicators.
– However, when rotating at higher speed (900 rpm),only ICSN2 normalised by Skewness (Fig. 15) allowsfor making a difference between the healthy and thedefective bearing.
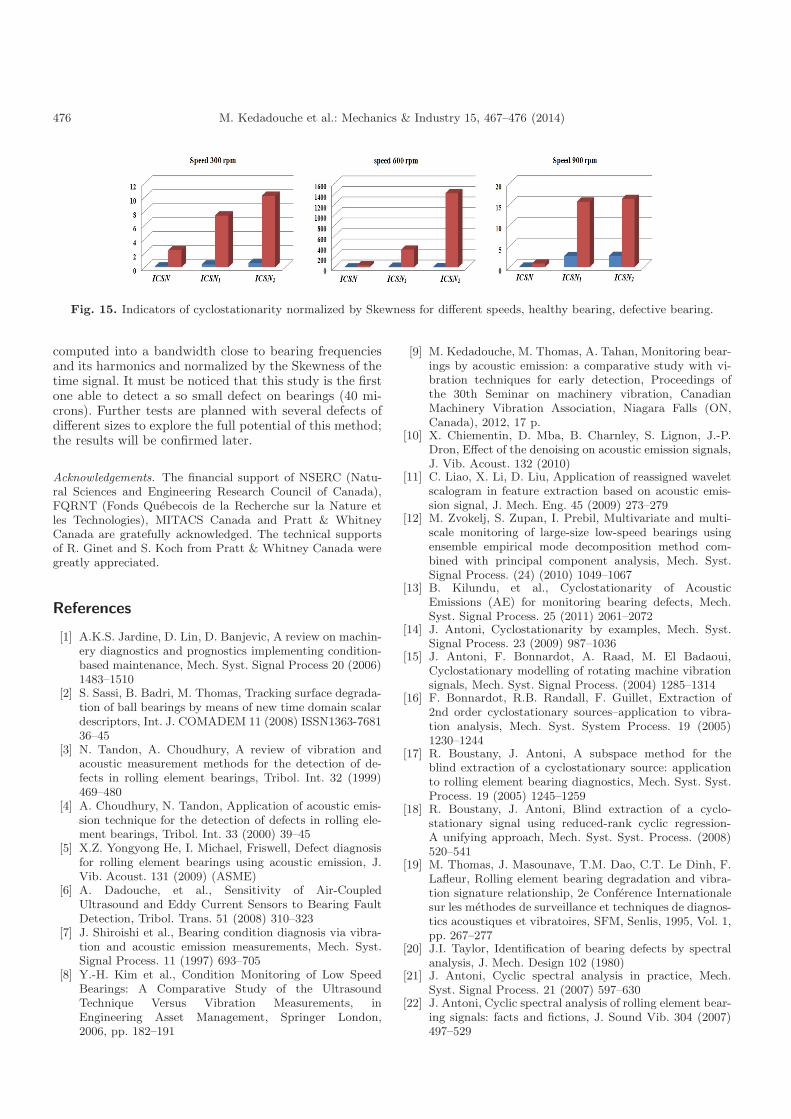
Figure 15 shows that all these indicators normalized byskewness were able to distinguish a defective bearing froma healthy one, whatever the rotating speed. However, the
indicator ICSN2 normalised by Skewness revealed to bemore sensitive than the two others by making a largedifference between the healthy and the defective bearingfor all the speeds (Fig. 15). Consequently, we propose toadopt this indicator (ICSN2) for the monitoring of acous-tic emission signals applied to bearing diagnosis.
5 Conclusion
This study focused on the potential of cyclostation-ary tools applied to the acoustic emission to detect avery small defect (40 microns) compared with the vibra-tion measurement. Two bearings (defective and healthy)were investigated on a test bench at different speeds. Thisstudy highlights the cyclostationarity character of acous-tic emission measurements. The cyclic spectral density(CSD) is computed for all acoustic emission and vibrationsignals and the results show that the acoustic emissionmeasurement is more efficient than the vibration mea-surement for an early detection of degradation even whendefect is very small (40 μm) especially when increasingthe speed. A new indicator (called ICSN2) is developedfor the monitoring of acoustic emission signal. This indica-tor is based on the amplitude of the cyclic spectral density
476 M. Kedadouche et al.: Mechanics & Industry 15, 467–476 (2014)
Fig. 15. Indicators of cyclostationarity normalized by Skewness for different speeds, healthy bearing, defective bearing.
computed into a bandwidth close to bearing frequenciesand its harmonics and normalized by the Skewness of thetime signal. It must be noticed that this study is the firstone able to detect a so small defect on bearings (40 mi-crons). Further tests are planned with several defects ofdifferent sizes to explore the full potential of this method;the results will be confirmed later.
Acknowledgements. The financial support of NSERC (Natu-ral Sciences and Engineering Research Council of Canada),FQRNT (Fonds Quebecois de la Recherche sur la Nature etles Technologies), MITACS Canada and Pratt & WhitneyCanada are gratefully acknowledged. The technical supportsof R. Ginet and S. Koch from Pratt & Whitney Canada weregreatly appreciated.
References
[1] A.K.S. Jardine, D. Lin, D. Banjevic, A review on machin-ery diagnostics and prognostics implementing condition-based maintenance, Mech. Syst. Signal Process 20 (2006)1483–1510
[2] S. Sassi, B. Badri, M. Thomas, Tracking surface degrada-tion of ball bearings by means of new time domain scalardescriptors, Int. J. COMADEM 11 (2008) ISSN1363-768136–45
[3] N. Tandon, A. Choudhury, A review of vibration andacoustic measurement methods for the detection of de-fects in rolling element bearings, Tribol. Int. 32 (1999)469–480
[4] A. Choudhury, N. Tandon, Application of acoustic emis-sion technique for the detection of defects in rolling ele-ment bearings, Tribol. Int. 33 (2000) 39–45
[5] X.Z. Yongyong He, I. Michael, Friswell, Defect diagnosisfor rolling element bearings using acoustic emission, J.Vib. Acoust. 131 (2009) (ASME)
[6] A. Dadouche, et al., Sensitivity of Air-CoupledUltrasound and Eddy Current Sensors to Bearing FaultDetection, Tribol. Trans. 51 (2008) 310–323
[7] J. Shiroishi et al., Bearing condition diagnosis via vibra-tion and acoustic emission measurements, Mech. Syst.Signal Process. 11 (1997) 693–705
[8] Y.-H. Kim et al., Condition Monitoring of Low SpeedBearings: A Comparative Study of the UltrasoundTechnique Versus Vibration Measurements, inEngineering Asset Management, Springer London,2006, pp. 182–191
[9] M. Kedadouche, M. Thomas, A. Tahan, Monitoring bear-ings by acoustic emission: a comparative study with vi-bration techniques for early detection, Proceedings ofthe 30th Seminar on machinery vibration, CanadianMachinery Vibration Association, Niagara Falls (ON,Canada), 2012, 17 p.
[10] X. Chiementin, D. Mba, B. Charnley, S. Lignon, J.-P.Dron, Effect of the denoising on acoustic emission signals,J. Vib. Acoust. 132 (2010)
[11] C. Liao, X. Li, D. Liu, Application of reassigned waveletscalogram in feature extraction based on acoustic emis-sion signal, J. Mech. Eng. 45 (2009) 273–279
[12] M. Zvokelj, S. Zupan, I. Prebil, Multivariate and multi-scale monitoring of large-size low-speed bearings usingensemble empirical mode decomposition method com-bined with principal component analysis, Mech. Syst.Signal Process. (24) (2010) 1049–1067
[13] B. Kilundu, et al., Cyclostationarity of AcousticEmissions (AE) for monitoring bearing defects, Mech.Syst. Signal Process. 25 (2011) 2061–2072
[14] J. Antoni, Cyclostationarity by examples, Mech. Syst.Signal Process. 23 (2009) 987–1036
[15] J. Antoni, F. Bonnardot, A. Raad, M. El Badaoui,Cyclostationary modelling of rotating machine vibrationsignals, Mech. Syst. Signal Process. (2004) 1285–1314
[16] F. Bonnardot, R.B. Randall, F. Guillet, Extraction of2nd order cyclostationary sources–application to vibra-tion analysis, Mech. Syst. System Process. 19 (2005)1230–1244
[17] R. Boustany, J. Antoni, A subspace method for theblind extraction of a cyclostationary source: applicationto rolling element bearing diagnostics, Mech. Syst. Syst.Process. 19 (2005) 1245–1259
[18] R. Boustany, J. Antoni, Blind extraction of a cyclo-stationary signal using reduced-rank cyclic regression-A unifying approach, Mech. Syst. Syst. Process. (2008)520–541
[19] M. Thomas, J. Masounave, T.M. Dao, C.T. Le Dinh, F.Lafleur, Rolling element bearing degradation and vibra-tion signature relationship, 2e Conference Internationalesur les methodes de surveillance et techniques de diagnos-tics acoustiques et vibratoires, SFM, Senlis, 1995, Vol. 1,pp. 267–277
[20] J.I. Taylor, Identification of bearing defects by spectralanalysis, J. Mech. Design 102 (1980)
[21] J. Antoni, Cyclic spectral analysis in practice, Mech.Syst. Signal Process. 21 (2007) 597–630
[22] J. Antoni, Cyclic spectral analysis of rolling element bear-ing signals: facts and fictions, J. Sound Vib. 304 (2007)497–529
Related Documents