Cyclicality of the Safety Net Marianne Bitler UC Davis & NBER (Joint work with Hilary Hoynes (UC Berkeley & NBER) and Elira Kuka (SMU))

Welcome message from author
This document is posted to help you gain knowledge. Please leave a comment to let me know what you think about it! Share it to your friends and learn new things together.
Transcript

Cyclicality of the Safety Net
Marianne Bitler UC Davis & NBER
(Joint work with Hilary Hoynes (UC Berkeley & NBER) and
Elira Kuka (SMU))
Motivation
• In the past 2 decades, the safety net for low income families with children has been transformed:
– Welfare reform has led to historic lows in cash welfare caseloads (TANF), SNAP has expanded
– The EITC has expanded such that about 20 percent of tax filers now receive the credit
• Thus in-work aid has largely replaced out-of-work aid for this population

Motivation (II)
• Given this, how does the EITC perform as a “safety net,” do other programs still work and what about poverty?– How does the EITC adjust in times of greater economic
need? – How do TANF, FS, and UI do and what about poverty?
• The Great Recession provides a good setting for testing the safety net
• Based on work in JOLE, JHR and JPAM
Overview and Findings: EITC
• Empirical strategy:– Exploit differences in timing and severity of cycles across
states– Use administrative micro-level data on tax returns
• Preview of results:– EITC is countercyclical for married couples with children
and weakly procyclical (but insignificant) for single filers with children
– Compared to food stamps, TANF and UI, the EITC is the least responsive to the business cycle
Overview and Findings: The Safety Net, Poverty
and the Unemployment Rate
• Construct poverty using private income, after tax and transfer income, and incorporate in-kind where possible in the latter; for children
• Look at how these are affected by shocks in GR (unemployment rate)
– Private income is more cyclical than net of tax and transfer (safety net provides protection)
– Extreme poverty more cyclical than poverty, and also holds up the distribution
– Most cyclical for children in single parent families, HH with Hispanic
heads, and HH with immigrant heads or spouses
• How does it matter if use SPM/Official/OECD measures; other choices
– Not much above poverty, more for extreme poverty for SPM/etc.
– Medical care treatment doesn’t matter
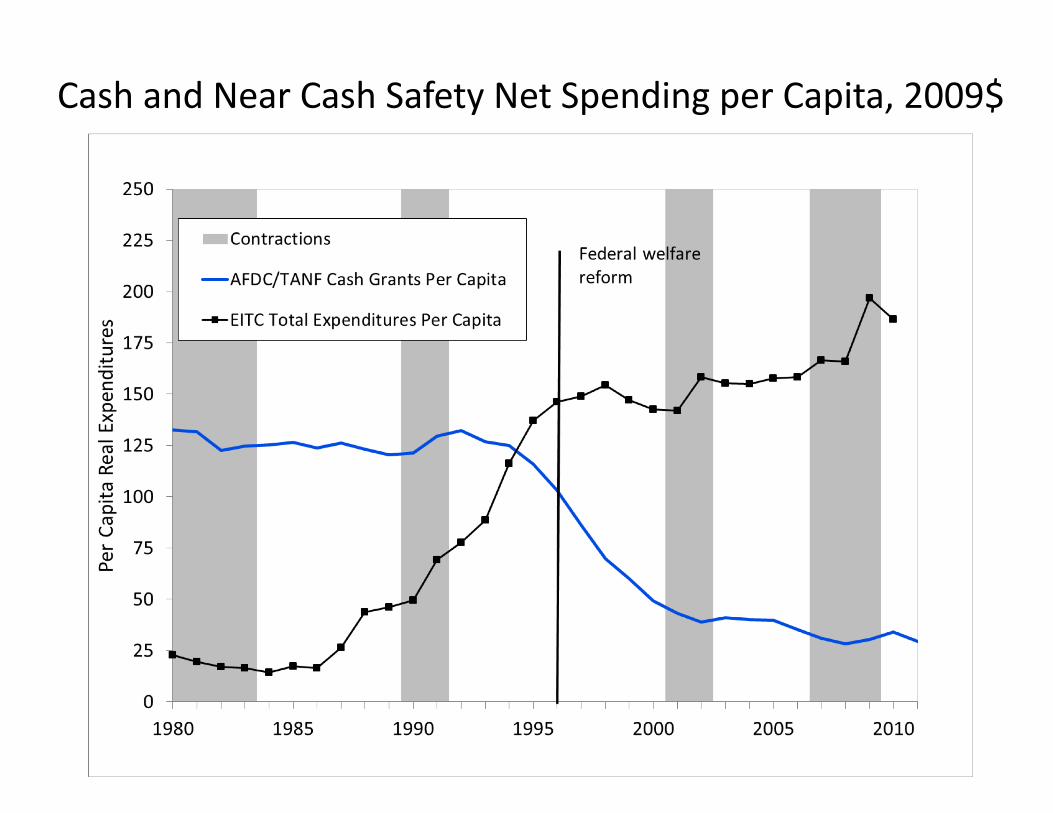
Cash and Near Cash Safety Net Spending per Capita, 2009$
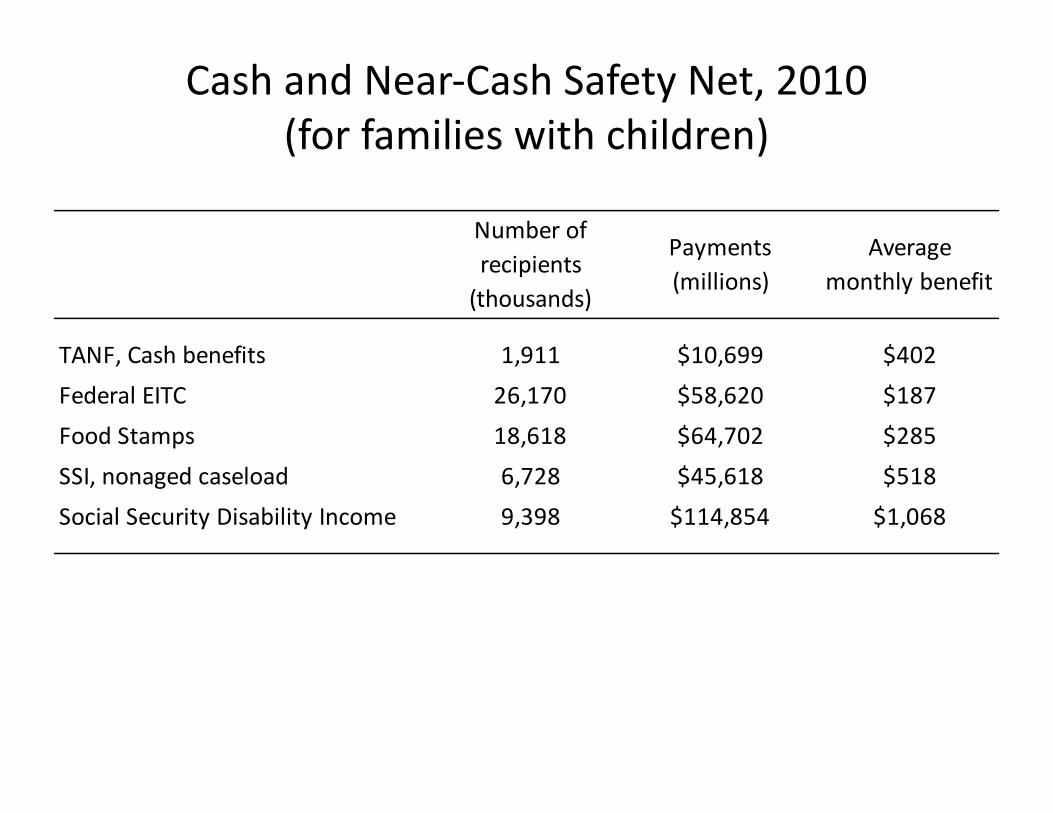
Cash and Near-Cash Safety Net, 2010(for families with children)
Number of recipients
(thousands)
Payments(millions)
Average monthly benefit
TANF, Cash benefits 1,911 $10,699 $402Federal EITC 26,170 $58,620 $187Food Stamps 18,618 $64,702 $285SSI, nonaged caseload 6,728 $45,618 $518Social Security Disability Income 9,398 $114,854 $1,068
8
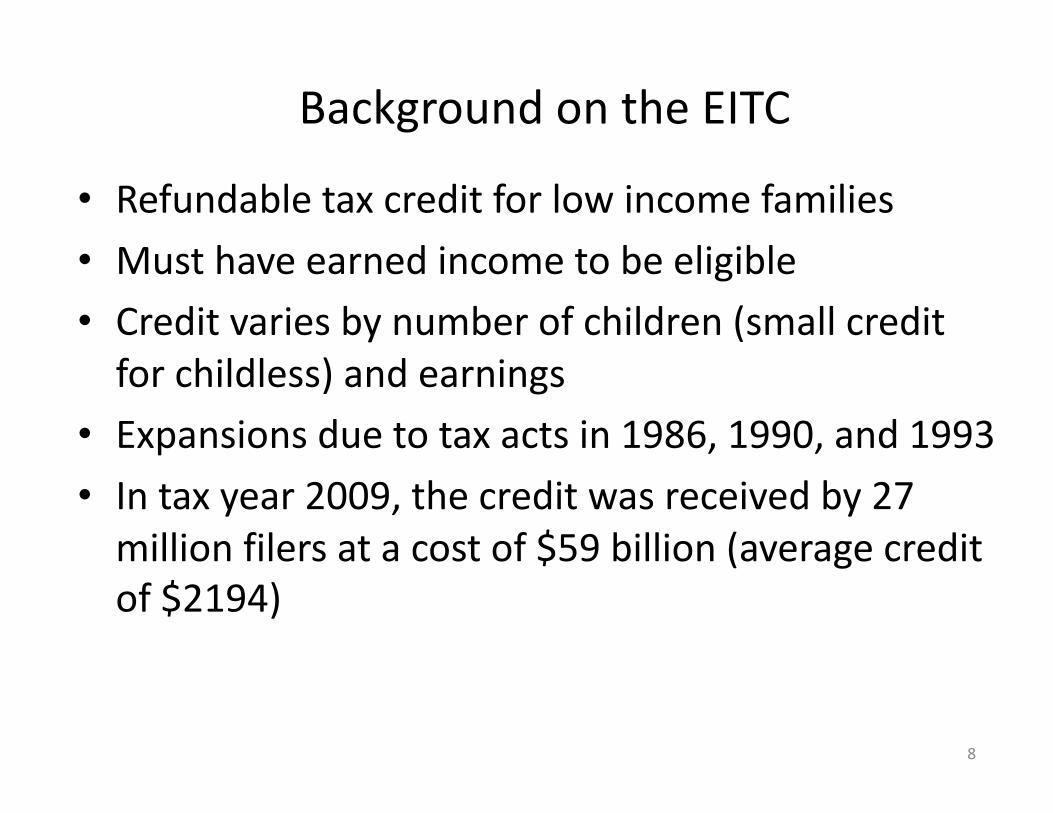
Background on the EITC
• Refundable tax credit for low income families• Must have earned income to be eligible• Credit varies by number of children (small credit
for childless) and earnings• Expansions due to tax acts in 1986, 1990, and 1993• In tax year 2009, the credit was received by 27
million filers at a cost of $59 billion (average credit of $2194)
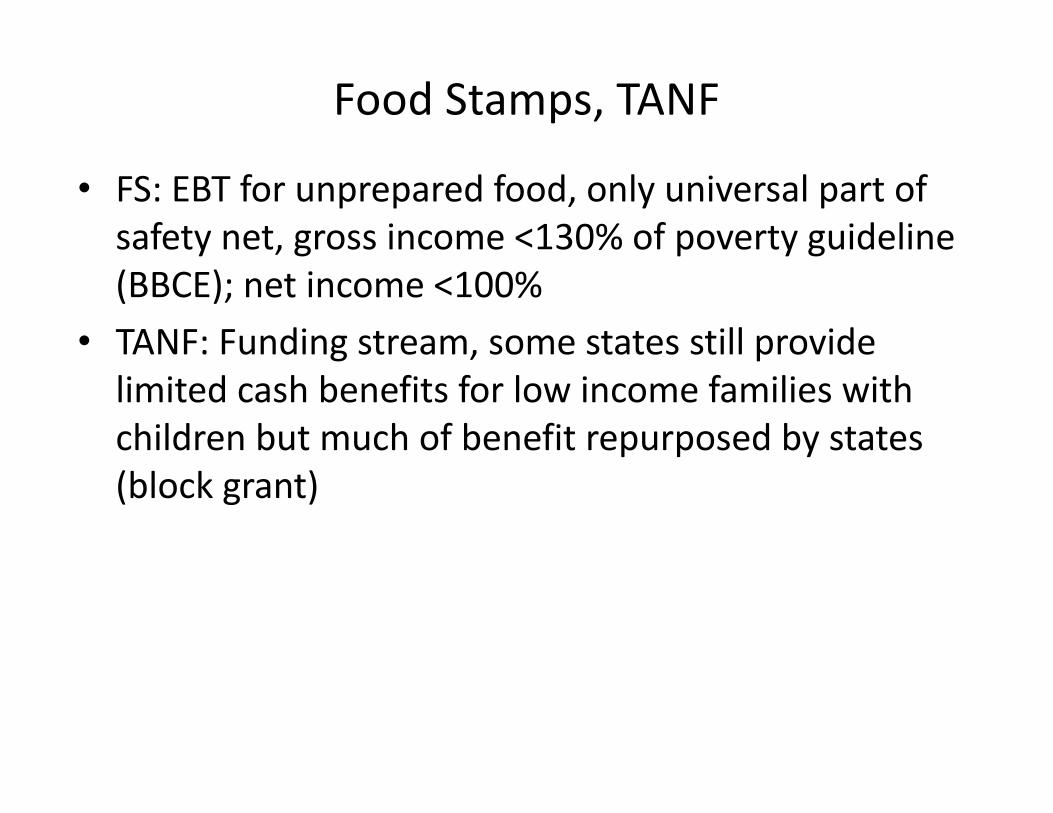
Food Stamps, TANF
• FS: EBT for unprepared food, only universal part of safety net, gross income <130% of poverty guideline (BBCE); net income <100%
• TANF: Funding stream, some states still provide limited cash benefits for low income families with children but much of benefit repurposed by states (block grant)
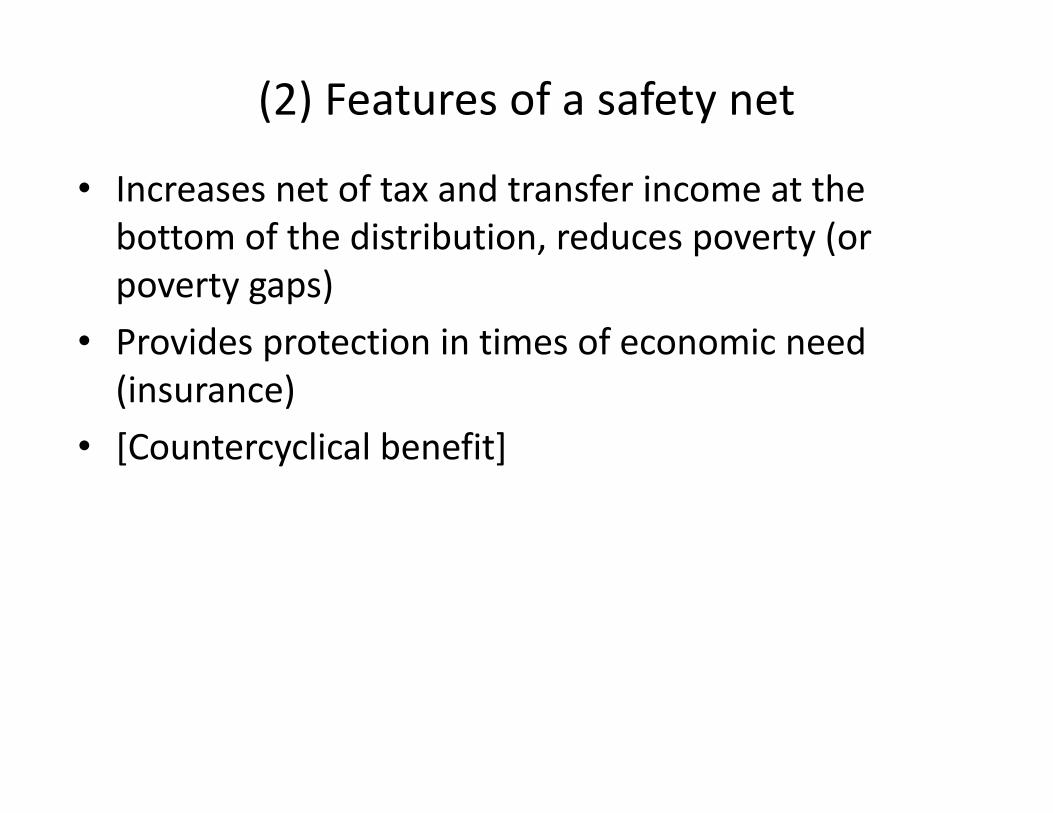
(2) Features of a safety net
• Increases net of tax and transfer income at the bottom of the distribution, reduces poverty (or poverty gaps)
• Provides protection in times of economic need (insurance)
• [Countercyclical benefit]
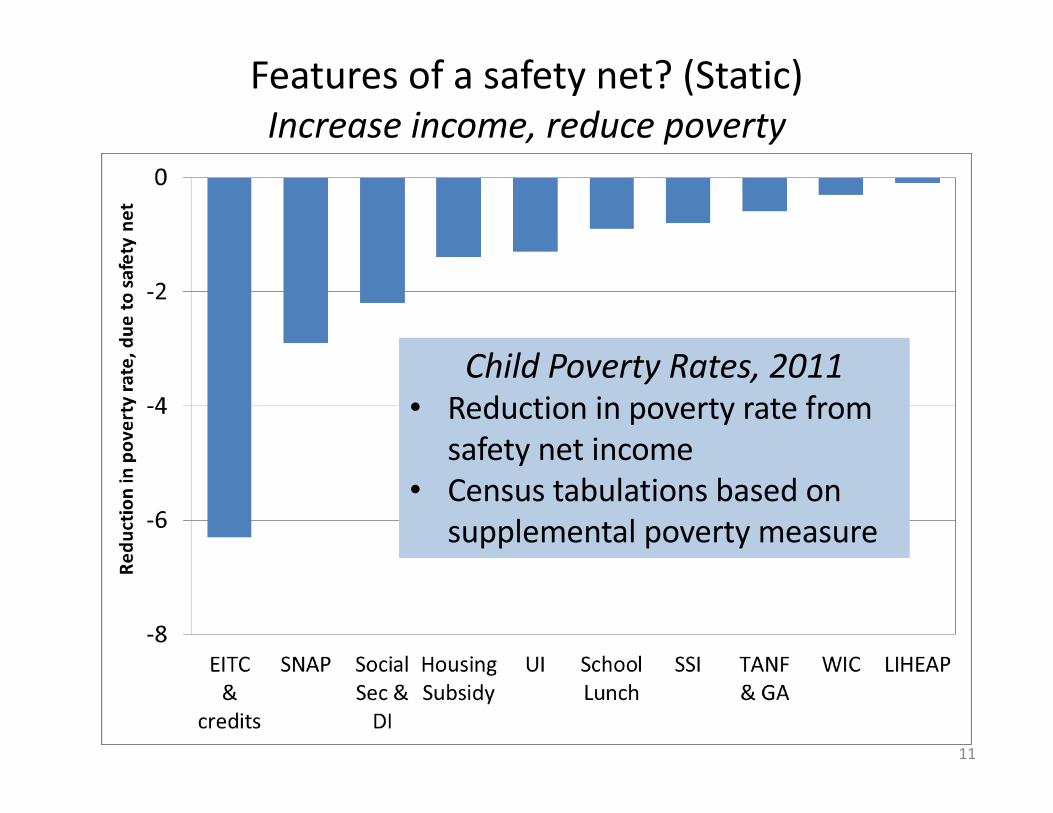
Features of a safety net? (Static)Increase income, reduce poverty
11
Child Poverty Rates, 2011• Reduction in poverty rate from
safety net income• Census tabulations based on
supplemental poverty measure
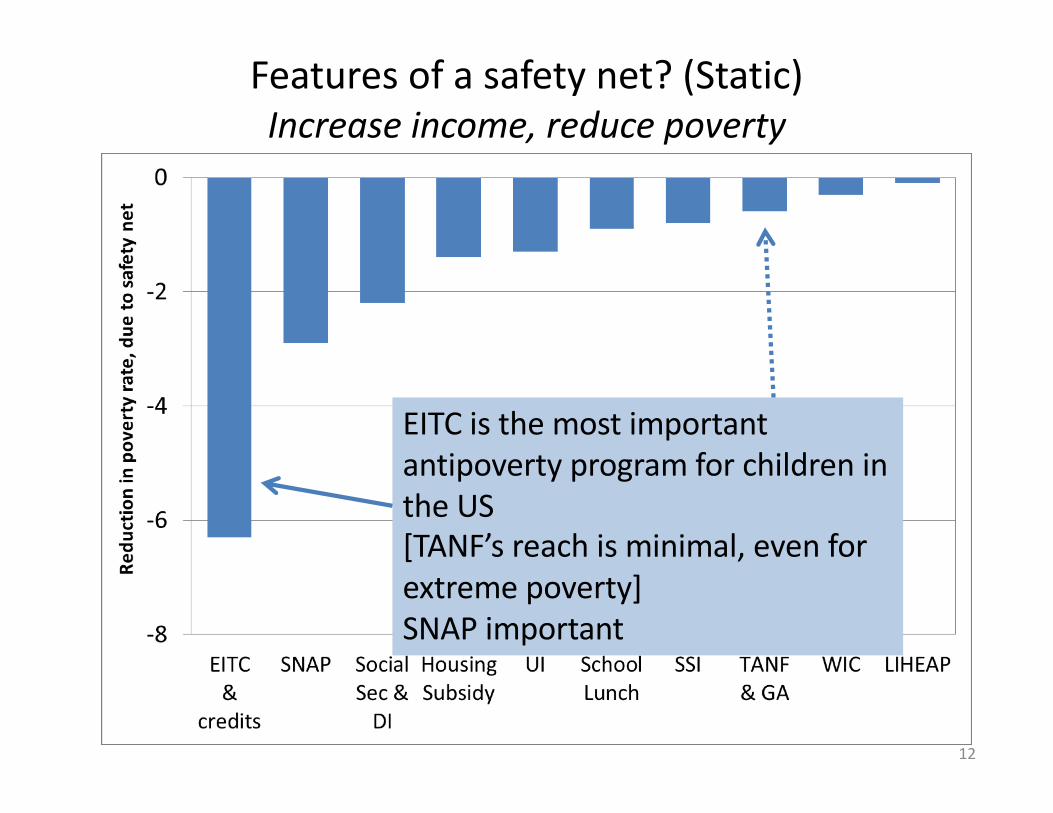
Features of a safety net? (Static)Increase income, reduce poverty
12
EITC is the most important antipoverty program for children in the US[TANF’s reach is minimal, even for extreme poverty]SNAP important
Features of a safety net?Provide protection in times of economic need
13
• We know very little about this aspect of the EITC, TANF. • Income insurance is not an explicit goal of the EITC
– Goal is to increase income at the lower end of the income distribution (offset payroll taxes) while encouraging work
– Prior work (Eissa and Leibman 1996, Meyer and Rosenbaum 2001 and others) shows that the program clearly meets this goal
• Still, in the new era of income redistribution (less welfare, more in-work tax credits) it is important to examine this issue
• Previously SNAP, TANF both did this, what about now?• Role of UI in GR (99 weeks)
?
Main Data for EITC: Statistics of Income (SOI) Microdata
• Representative sample of all U.S. tax filers, admin. data• Data contains: filing status, number of dependents,
earned income, EITC credit amount, number of children for EITC, state of residence
• Sample restrictions/construction:– Exclude: high income earners, late filers, married filing
separately and filers from territories or living abroad– Collapse to cells based on year, state, marital (filing) status
and number of children (0/1/2+)• In each cell, capture (weighted): number of filers,
number of filers claiming EITC, total EITC dollars claimed
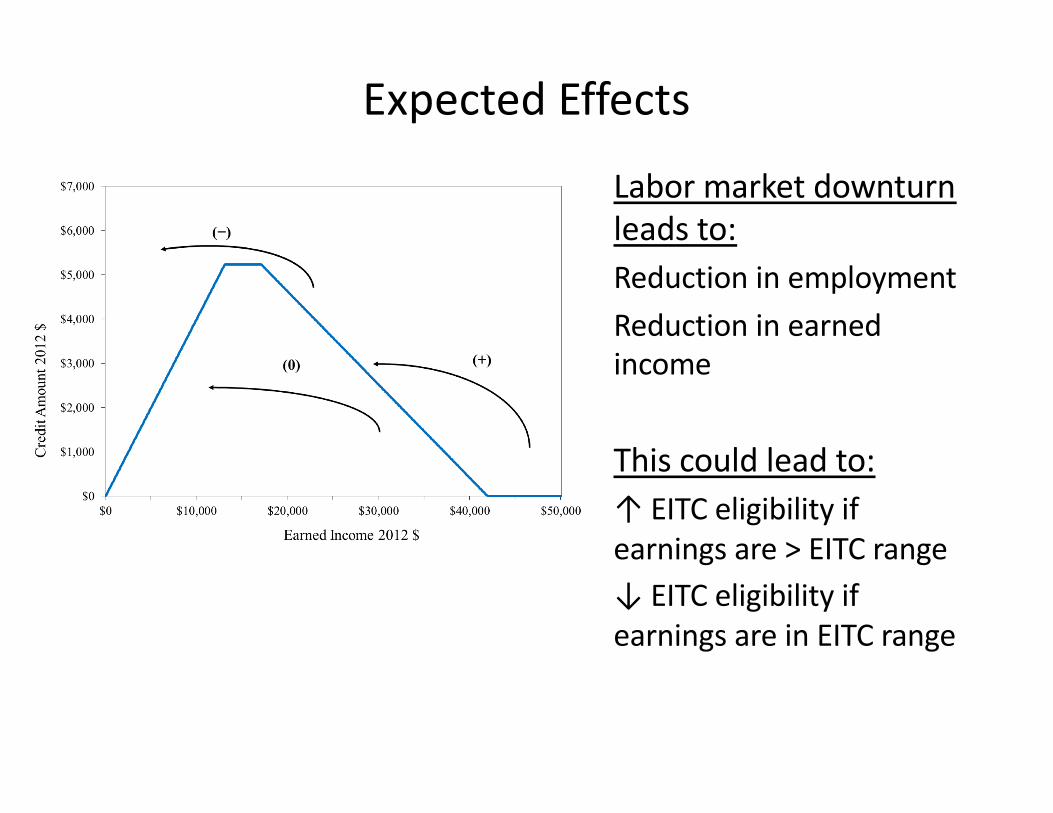
Expected Effects
Labor market downturn leads to:Reduction in employmentReduction in earned income
This could lead to:↑ EITC eligibility if earnings are > EITC range↓ EITC eligibility if earnings are in EITC range
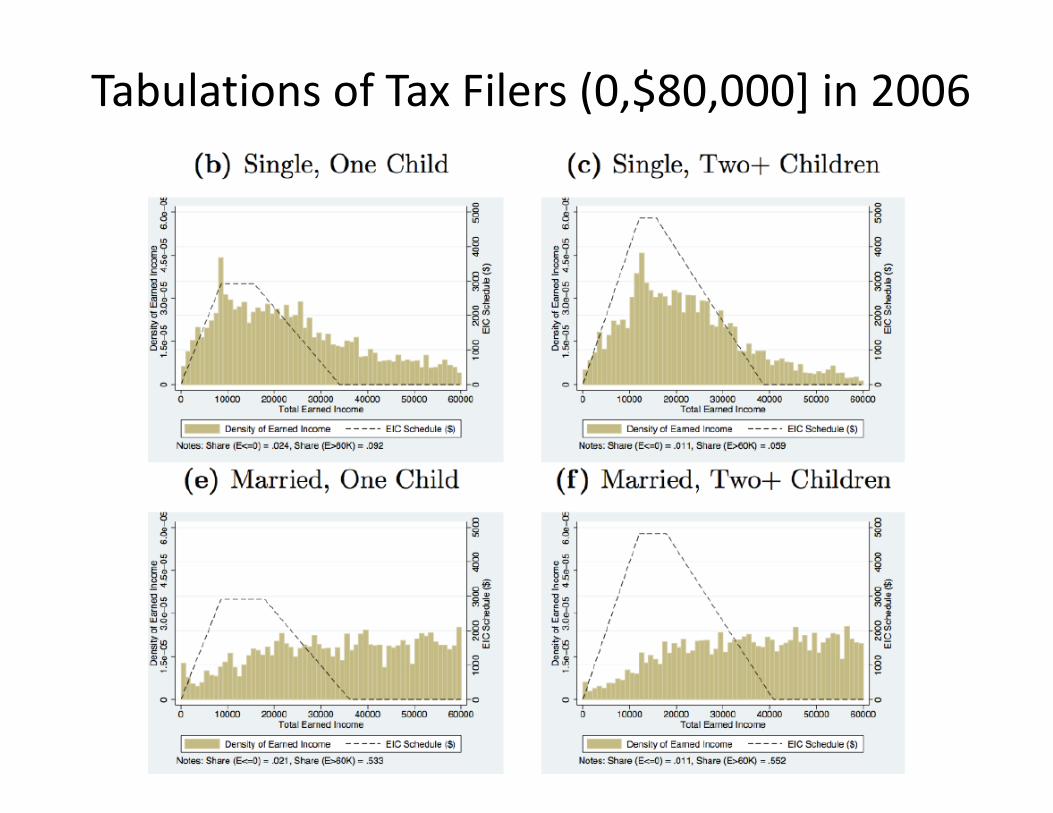
Tabulations of Tax Filers (0,$80,000] in 2006
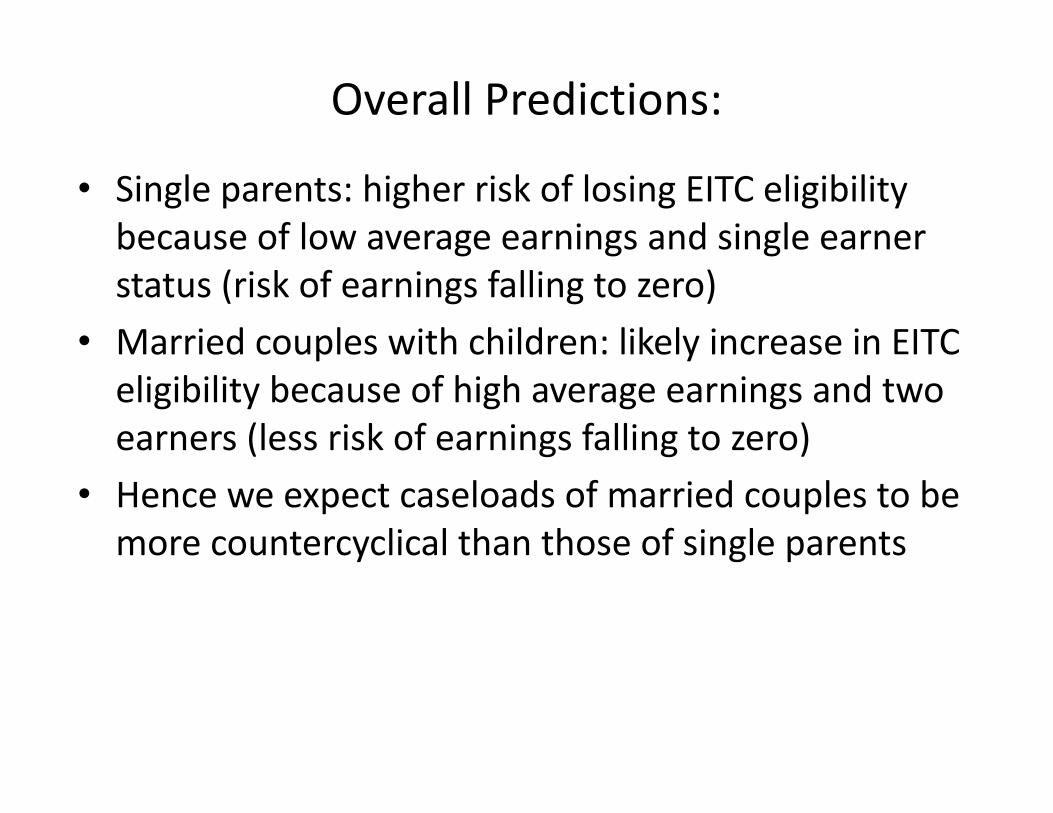
Overall Predictions:
• Single parents: higher risk of losing EITC eligibility because of low average earnings and single earner status (risk of earnings falling to zero)
• Married couples with children: likely increase in EITC eligibility because of high average earnings and two earners (less risk of earnings falling to zero)
• Hence we expect caseloads of married couples to be more countercyclical than those of single parents
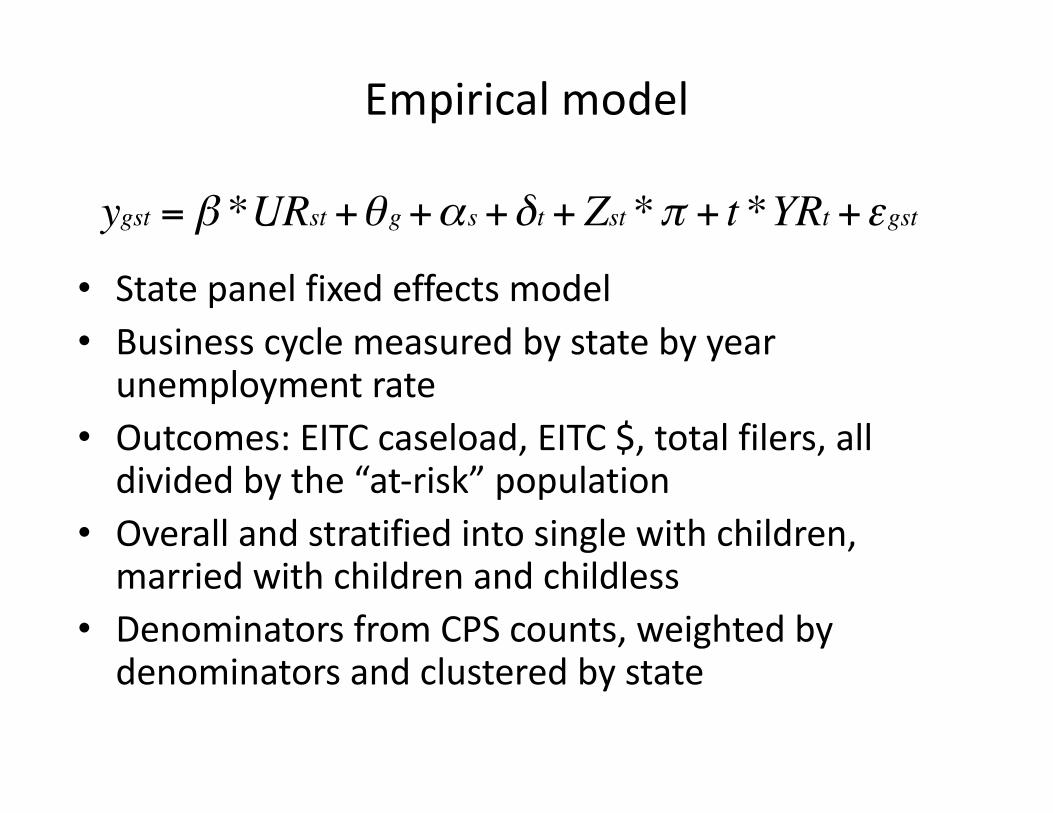
Empirical model
• State panel fixed effects model• Business cycle measured by state by year
unemployment rate• Outcomes: EITC caseload, EITC $, total filers, all
divided by the “at-risk” population• Overall and stratified into single with children,
married with children and childless• Denominators from CPS counts, weighted by
denominators and clustered by state
ygst = β *URst +θ g+αs+δt + Zst *π + t *YRt +εgst
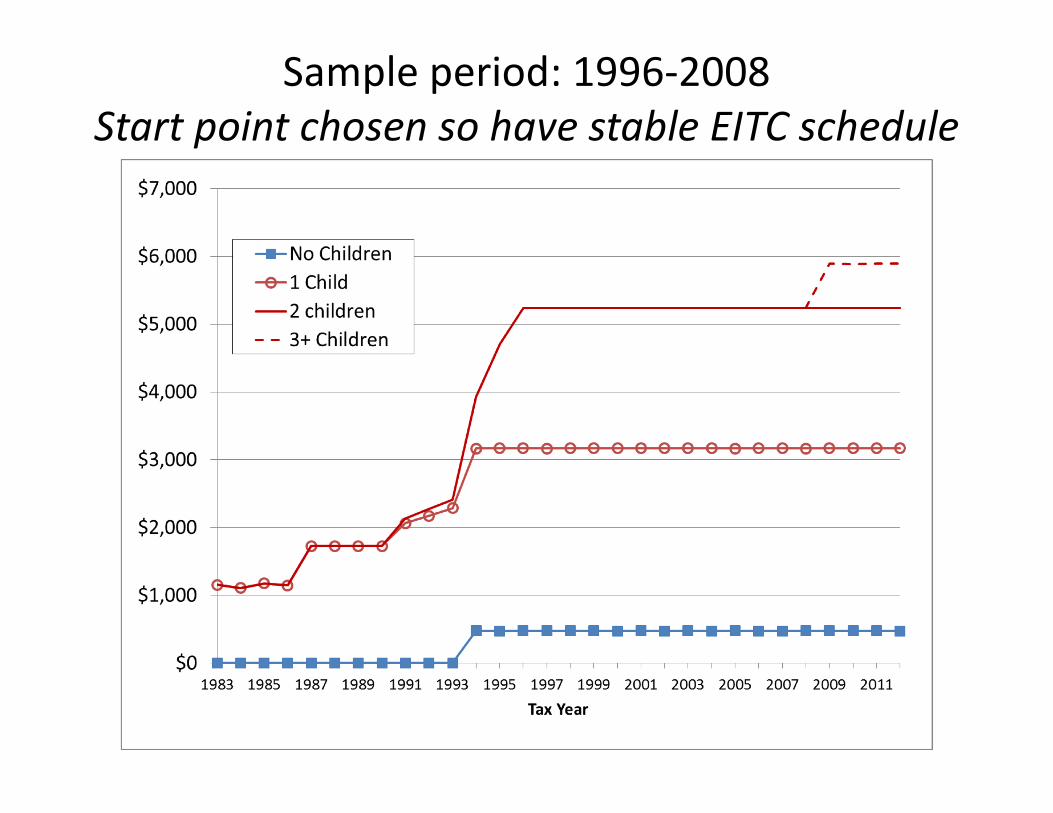
Sample period: 1996-2008Start point chosen so have stable EITC schedule
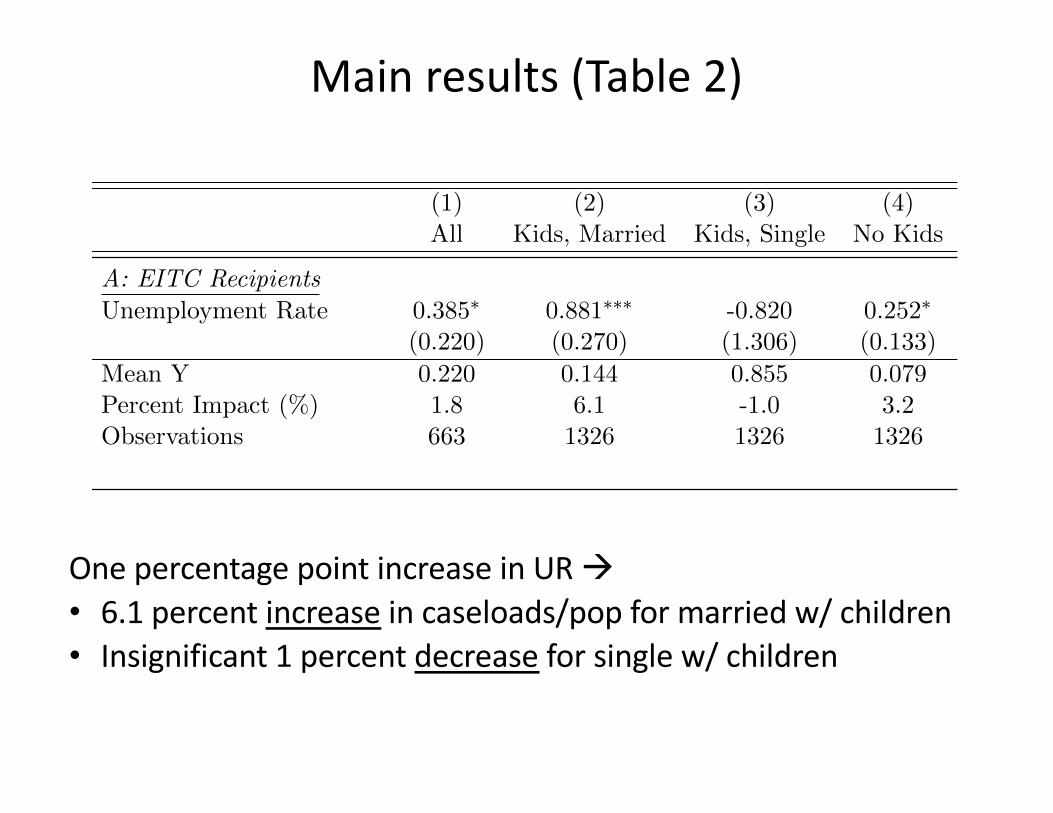
Main results (Table 2)
One percentage point increase in UR à• 6.1 percent increase in caseloads/pop for married w/ children• Insignificant 1 percent decrease for single w/ children
Table 1: Summary Statistics, EITC Recipients and Expenditures, 2008
Total EITC Recipients (Millions) 24.4Total EITC Expenditures (Billions 2008$) $50.5
Percent Distribution of Recipients, by demographic groupChildless 21.9%Single with Children 58.7%Married with Children 19.4%
Percent Distribution of Expenditures, by demographic groupChildless 2.7%Single with Children 74.1%Married with Children 23.2%
Average Credit Amount (2008$), by demographic groupChildless $253Single with Children $2,613Married with Children $2,471
Notes: Data are from the 2008 Statistics of Income, which contains infor-mation on tax returns for tax year 2008. The sample excludes high-incomeearners, individuals living abroad, late filers and married couples filing sep-arately. Statistics are weighted to represent population of tax filers.
Table 2: E�ects of Unemployment Rate on EITC Recipients and Expenditures
(1) (2) (3) (4)All Kids, Married Kids, Single No Kids
A: EITC RecipientsUnemployment Rate 0.385⇤ 0.881⇤⇤⇤ -0.820 0.252⇤
(0.220) (0.270) (1.306) (0.133)Mean Y 0.220 0.144 0.855 0.079Percent Impact (%) 1.8 6.1 -1.0 3.2Observations 663 1326 1326 1326
B: EITC Dollars (2008$)Unemployment Rate 547.6 1969.7⇤⇤⇤ -2168.8 47.2
(609.2) (672.9) (3843.3) (46.4)Mean Y 460.5 345.3 2201.6 20.1Percent Impact (%) 1.2 5.7 -1.0 2.3Observations 663 1326 1326 1326
Notes: Data are from the 1996–2008 Statistics of Income, with denominators mea-suring the number of potential tax filers from the CPS ASEC. The sample excludeshigh-income earners, late filers, individuals living abroad and married couples filingseparately. The dependent variables are total EITC recipients and real EITC expen-ditures ($2008), both divided by the total population of potential filers in each cell.All regressions include controls for demographic characteristics, as well as state andyear fixed e�ects. The results are weighted by the population of potential filers in eachcell. Standard errors are clustered by state and shown in parentheses. * p<0.10, **p<0.05, *** p<0.01.
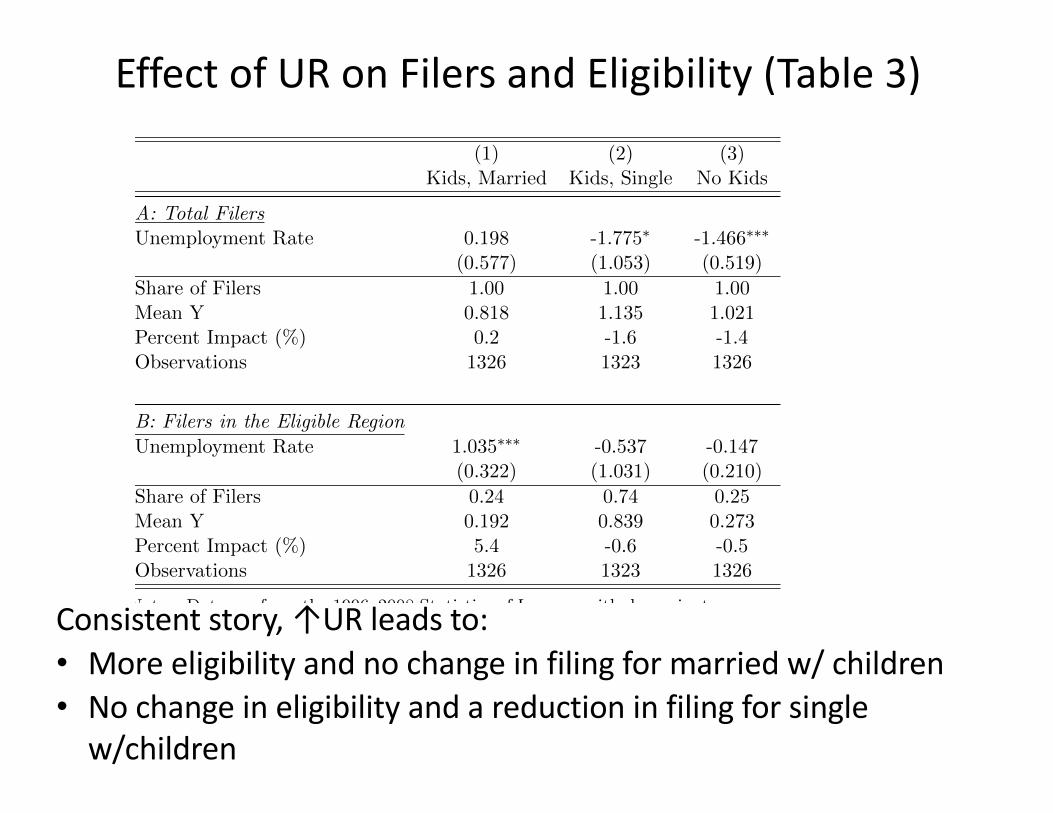
Effect of UR on Filers and Eligibility (Table 3)
Consistent story, ↑UR leads to:• More eligibility and no change in filing for married w/ children• No change in eligibility and a reduction in filing for single
w/children
Table 3: E�ect of Unemployment Rate on EITC Eligibility According to Earned Income
(1) (2) (3)Kids, Married Kids, Single No Kids
A: Total FilersUnemployment Rate 0.198 -1.775⇤ -1.466⇤⇤⇤
(0.577) (1.053) (0.519)Share of Filers 1.00 1.00 1.00Mean Y 0.818 1.135 1.021Percent Impact (%) 0.2 -1.6 -1.4Observations 1326 1323 1326
B: Filers in the Eligible RegionUnemployment Rate 1.035⇤⇤⇤ -0.537 -0.147
(0.322) (1.031) (0.210)Share of Filers 0.24 0.74 0.25Mean Y 0.192 0.839 0.273Percent Impact (%) 5.4 -0.6 -0.5Observations 1326 1323 1326
Notes: Data are from the 1996–2008 Statistics of Income, with denominators mea-suring the number of potential tax filers from the CPS ASEC. The sample excludeshigh-income earners, individuals living abroad, late filers and married couples fil-ing separately. Dependent variable represents the number of filers in the SOI orthe number of filers whose earned income puts them in the EITC eligible range,divided by the population of total potential filers in the demographic group. Allregressions include controls for demographic characteristics, as well as state andyear fixed e�ects. The results are weighted by the population of potential filersin each cell. Standard errors are clustered by state and shown in parentheses. *p<0.10, ** p<0.05, *** p<0.01.
Table 4: E�ect of Unemployment Rate on Other Safety Net Programs
(1) (2) (3) (4) (5)EITC EITCAll With Kids AFDC/TANF Food Stamps UI
Unemployment Rate 0.163⇤⇤ 0.108⇤ 0.066⇤ 0.285⇤⇤⇤ 0.135⇤⇤⇤
(0.068) (0.063) (0.033) (0.061) (0.012)Mean Y 0.072 0.058 0.009 0.034 0.009Percent Impact (%) 2.2 1.8 7.7 8.4 14.5Observations 663 663 663 663 663
Notes: Years 1996-2008. The dependent variables are EITC, AFDC/TANF, food stamps, andUI recipients divided by the state population. Sources for recipients are in text. All regressionsinclude state and year fixed e�ects. The results are weighted by the state population. Standarderrors are clustered by state and shown in parentheses. * p<0.10, ** p<0.05, *** p<0.01.
Full Table
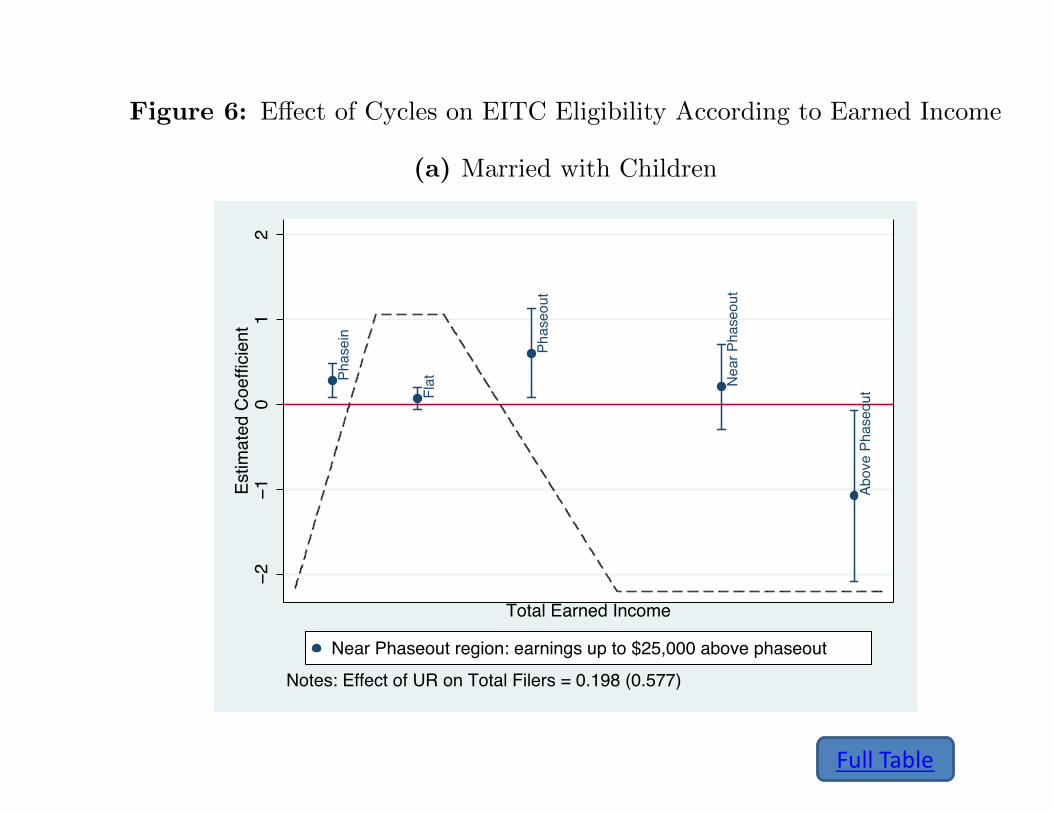
Figure 6: E�ect of Cycles on EITC Eligibility According to Earned Income
(a) Married with Children
Phas
ein
Flat
Phas
eout
Nea
r Pha
seou
t
Abov
e Ph
aseo
ut
−2−1
01
2Es
timat
ed C
oeffi
cien
t
Total Earned Income
Near Phaseout region: earnings up to $25,000 above phaseout
Notes: Effect of UR on Total Filers = 0.198 (0.577)
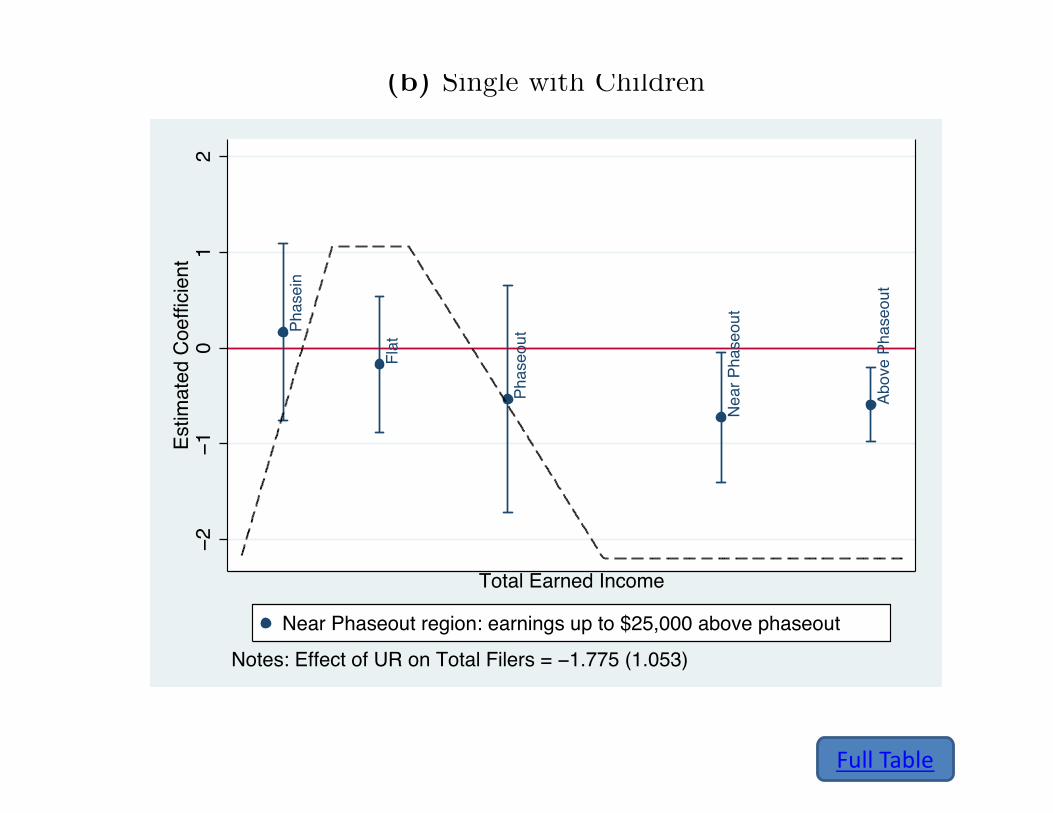
(b) Single with Children
Phas
ein
Flat
Phas
eout
Nea
r Pha
seou
t
Abov
e Ph
aseo
ut
−2−1
01
2Es
timat
ed C
oeffi
cien
t
Total Earned Income
Near Phaseout region: earnings up to $25,000 above phaseout
Notes: Effect of UR on Total Filers = −1.775 (1.053)
Notes: Data are from the 1996–2008 Statistics of Income, with denomi-nators measuring the number of potential tax filers from the CPS ASEC.The sample excludes high-income earners, individuals living abroad, latefilers and married couples filing separately. Each point represents an es-timated coe⇤cient where the dependent variable is the number of filerswhose earned income puts them in each EITC range, divided by the pop-ulation of total potential filers in the demographic group. All regressionsinclude controls for demographic characteristics, as well as state and yearfixed e�ects. The results are weighted by the population of potential filersin each cell. Standard errors are clustered by state.
Full Table
Figure 6: E�ect of Cycles on EITC Eligibility According to Earned Income
(a) Married with Children
Phas
ein
Flat
Phas
eout
Nea
r Pha
seou
t
Abov
e Ph
aseo
ut
−2−1
01
2Es
timat
ed C
oeffi
cien
t
Total Earned Income
Near Phaseout region: earnings up to $25,000 above phaseout
Notes: Effect of UR on Total Filers = 0.198 (0.577)
(b) Single with Children
Phas
ein
Flat
Phas
eout
Nea
r Pha
seou
t
Abov
e Ph
aseo
ut
−2−1
01
2Es
timat
ed C
oeffi
cien
t
Total Earned Income
Near Phaseout region: earnings up to $25,000 above phaseout
Notes: Effect of UR on Total Filers = −1.775 (1.053)
Notes: Data are from the 1996–2008 Statistics of Income, with denomi-nators measuring the number of potential tax filers from the CPS ASEC.The sample excludes high-income earners, individuals living abroad, latefilers and married couples filing separately. Each point represents an es-timated coe⇤cient where the dependent variable is the number of filerswhose earned income puts them in each EITC range, divided by the pop-ulation of total potential filers in the demographic group. All regressionsinclude controls for demographic characteristics, as well as state and yearfixed e�ects. The results are weighted by the population of potential filersin each cell. Standard errors are clustered by state.
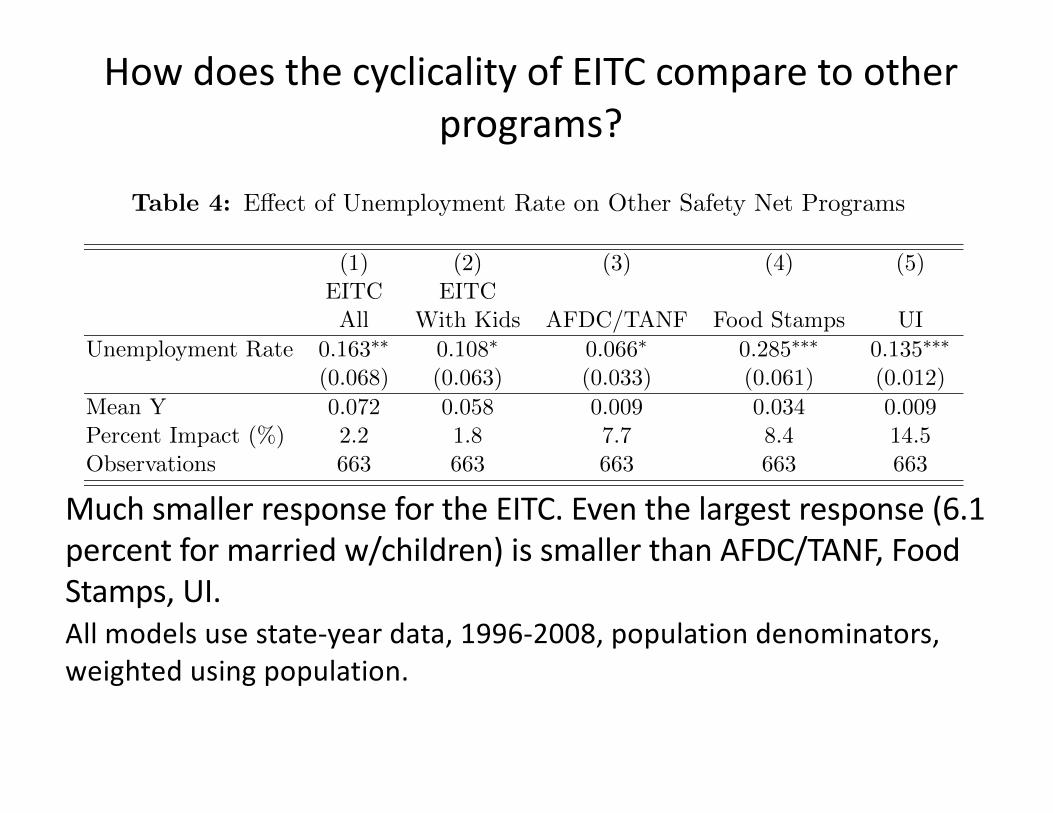
How does the cyclicality of EITC compare to other programs?
Much smaller response for the EITC. Even the largest response (6.1 percent for married w/children) is smaller than AFDC/TANF, Food Stamps, UI.All models use state-year data, 1996-2008, population denominators, weighted using population.
Table 3: E�ect of Unemployment Rate on EITC Eligibility According to Earned Income
(1) (2) (3)Kids, Married Kids, Single No Kids
A: Total FilersUnemployment Rate 0.198 -1.775⇤ -1.466⇤⇤⇤
(0.577) (1.053) (0.519)Share of Filers 1.00 1.00 1.00Mean Y 0.818 1.135 1.021Percent Impact (%) 0.2 -1.6 -1.4Observations 1326 1323 1326
B: Filers in the Eligible RegionUnemployment Rate 1.035⇤⇤⇤ -0.537 -0.147
(0.322) (1.031) (0.210)Share of Filers 0.24 0.74 0.25Mean Y 0.192 0.839 0.273Percent Impact (%) 5.4 -0.6 -0.5Observations 1326 1323 1326
Notes: Data are from the 1996–2008 Statistics of Income, with denominators mea-suring the number of potential tax filers from the CPS ASEC. The sample excludeshigh-income earners, individuals living abroad, late filers and married couples fil-ing separately. Dependent variable represents the number of filers in the SOI orthe number of filers whose earned income puts them in the EITC eligible range,divided by the population of total potential filers in the demographic group. Allregressions include controls for demographic characteristics, as well as state andyear fixed e�ects. The results are weighted by the population of potential filersin each cell. Standard errors are clustered by state and shown in parentheses. *p<0.10, ** p<0.05, *** p<0.01.
Table 4: E�ect of Unemployment Rate on Other Safety Net Programs
(1) (2) (3) (4) (5)EITC EITCAll With Kids AFDC/TANF Food Stamps UI
Unemployment Rate 0.163⇤⇤ 0.108⇤ 0.066⇤ 0.285⇤⇤⇤ 0.135⇤⇤⇤
(0.068) (0.063) (0.033) (0.061) (0.012)Mean Y 0.072 0.058 0.009 0.034 0.009Percent Impact (%) 2.2 1.8 7.7 8.4 14.5Observations 663 663 663 663 663
Notes: Years 1996-2008. The dependent variables are EITC, AFDC/TANF, food stamps, andUI recipients divided by the state population. Sources for recipients are in text. All regressionsinclude state and year fixed e�ects. The results are weighted by the state population. Standarderrors are clustered by state and shown in parentheses. * p<0.10, ** p<0.05, *** p<0.01.
How is the cyclicality of poverty affected by the EITC?
• Look at various cuts of official poverty with and without the imputed maximum EITC (TAXSIM)
• Also explore version with SPM equivalence scales, net of all taxes and transfers
• EITC reduces the cyclicality of poverty for married couples with children, little or no effect for singles with children
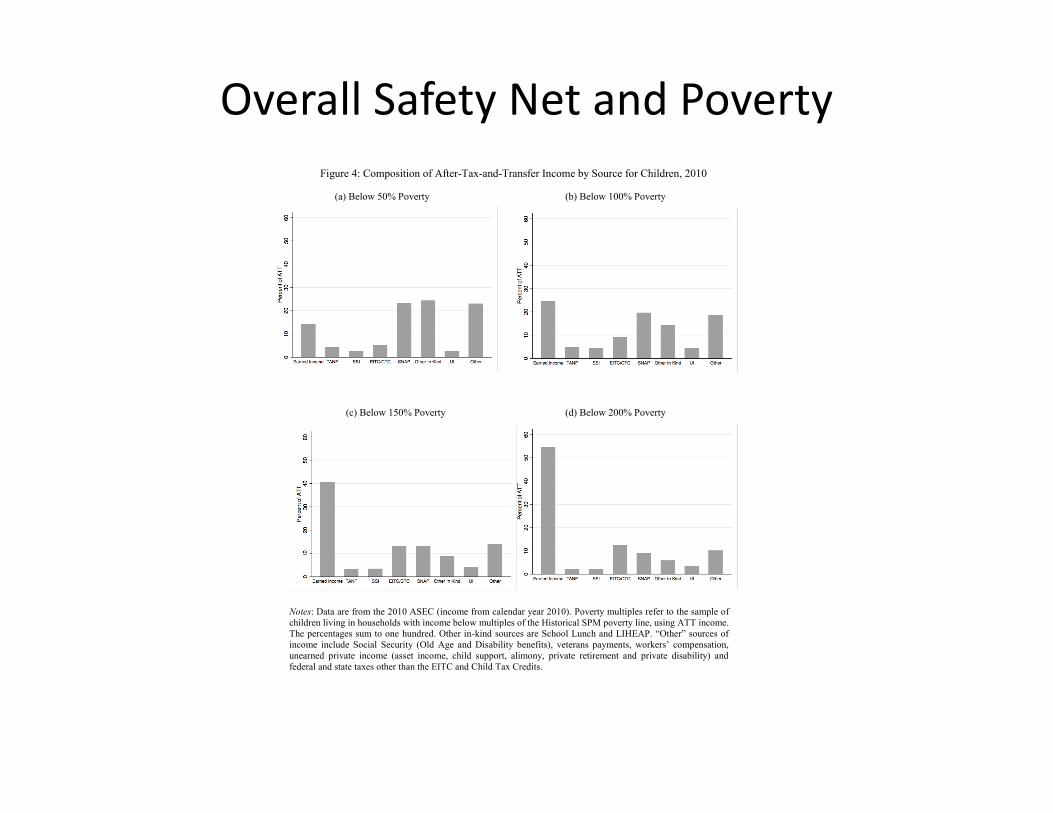
Overall Safety Net and Poverty
40
Figure 4: Composition of After-Tax-and-Transfer Income by Source for Children, 2010
(a) Below 50% Poverty (b) Below 100% Poverty
(c) Below 150% Poverty (d) Below 200% Poverty
Notes: Data are from the 2010 ASEC (income from calendar year 2010). Poverty multiples refer to the sample of children living in households with income below multiples of the Historical SPM poverty line, using ATT income. The percentages sum to one hundred. Other in-kind sources are School Lunch and LIHEAP. “Other” sources of income include Social Security (Old Age and Disability benefits), veterans payments, workers’ compensation, unearned private income (asset income, child support, alimony, private retirement and private disability) and federal and state taxes other than the EITC and Child Tax Credits.
Cyclicality has changed with GR
• Bitler and Hoynes (JOLE) look at cyclicality of programs using admin. data, how has changed post welfare reform; also UI
• AFDC/TANF no longer countercyclical, FS and UI the same (or more), sum of all slightly smaller in point estimate in GR period
Conclusion
• Since the late 1990s, big shift from out of work aid to in work aid in the safety net
• The EITC is the largest in-work program, plays important role in reducing poverty
• Does the EITC act as a safety net program/automatic stabilizer?
• Not for single parents with children, yes for married couples with children
• Less cyclical than other programs (UI/TANF/SNAP)• TANF less countercyclical after
Related Documents


