1H 2021 Cybersecurity 1H Update TECHNOLOGY, MEDIA, AND TELECOMMUNICATIONS

Welcome message from author
This document is posted to help you gain knowledge. Please leave a comment to let me know what you think about it! Share it to your friends and learn new things together.
Transcript
1 H 2 0 2 1
Cybersecurity 1H UpdateT E C H N O L O G Y, M E D I A , AN D T E L E C O M M U N I C AT I O N S
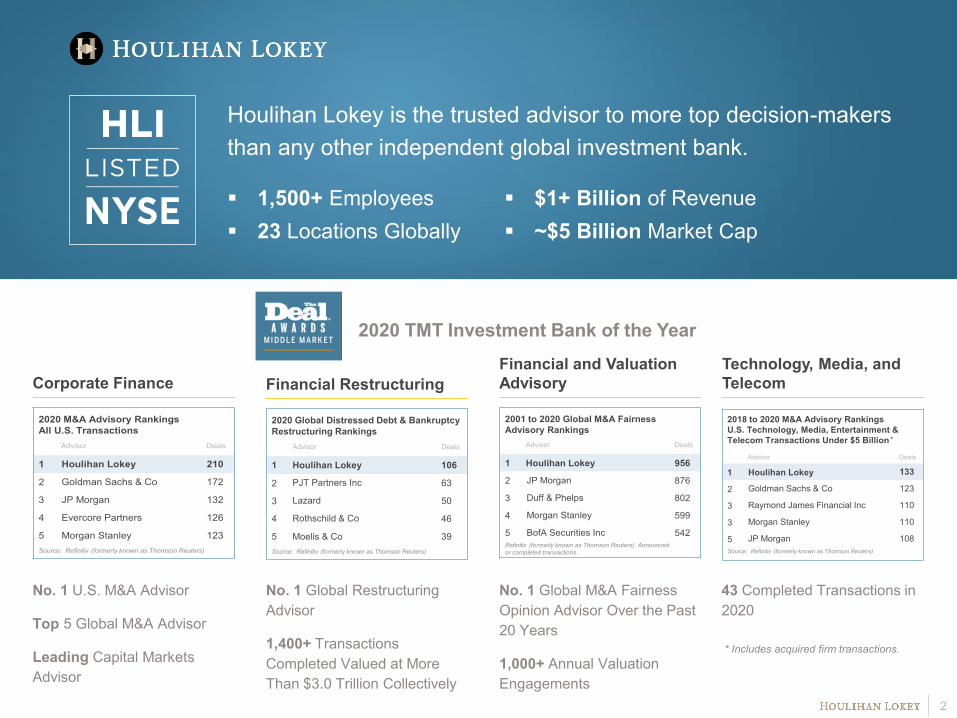
Houlihan Lokey is the trusted advisor to more top decision-makers than any other independent global investment bank.
1,500+ Employees 23 Locations Globally
$1+ Billion of Revenue ~$5 Billion Market Cap
Corporate Finance Financial RestructuringFinancial and Valuation Advisory
No. 1 U.S. M&A Advisor
Top 5 Global M&A Advisor
Leading Capital Markets Advisor
No. 1 Global M&A Fairness Opinion Advisor Over the Past 20 Years
1,000+ Annual Valuation Engagements
No. 1 Global Restructuring Advisor
1,400+ Transactions Completed Valued at More Than $3.0 Trillion Collectively
Technology, Media, and Telecom
43 Completed Transactions in 2020
2020 TMT Investment Bank of the Year
2018 to 2020 M&A Advisory Rankings U.S. Technology, Media, Entertainment & Telecom Transactions Under $5 Billion
Advisor Deals
1 Houlihan Lokey 133
2 Goldman Sachs & Co 123
3 Raymond James Financial Inc 110
3 Morgan Stanley 110
5 JP Morgan 108Source: Refinitiv (formerly known as Thomson Reuters)
2
2020 Global Distressed Debt & BankruptcyRestructuring Rankings
Advisor Deals
1 Houlihan Lokey 106
2 PJT Partners Inc 63
3 Lazard 50
4 Rothschild & Co 46
5 Moelis & Co 39Source: Refinitiv (formerly known as Thomson Reuters)
* Includes acquired firm transactions.
*
2001 to 2020 Global M&A Fairness Advisory Rankings
Advisor Deals
1 Houlihan Lokey 956
2 JP Morgan 876
3 Duff & Phelps 802
4 Morgan Stanley 599
5 BofA Securities Inc 542Refinitiv (formerly known as Thomson Reuters). Announced or completed transactions.
2020 M&A Advisory Rankings All U.S. Transactions
Advisor Deals
1 Houlihan Lokey 210
2 Goldman Sachs & Co 172
3 JP Morgan 132
4 Evercore Partners 126
5 Morgan Stanley 123Source: Refinitiv (formerly known as Thomson Reuters)
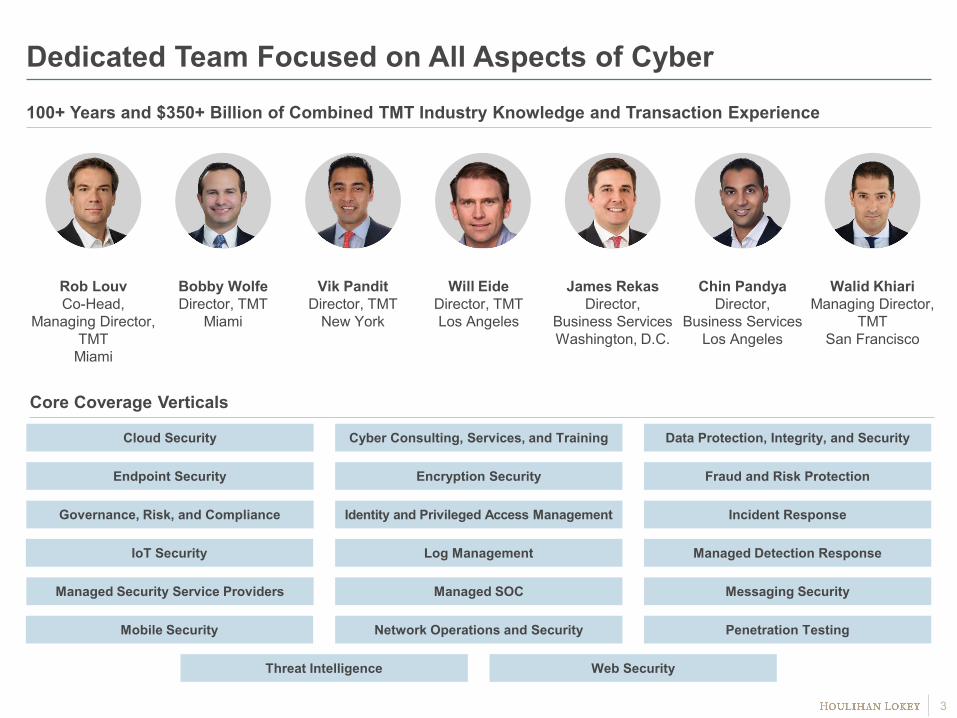
Dedicated Team Focused on All Aspects of Cyber
Cloud Security Cyber Consulting, Services, and Training
Endpoint Security Fraud and Risk Protection
Identity and Privileged Access Management Incident Response
Managed Security Service Providers
Managed Detection Response
Managed SOC
Governance, Risk, and Compliance
Core Coverage Verticals
Messaging Security
Network Operations and Security Penetration Testing
Threat Intelligence Web Security
Data Protection, Integrity, and Security
Encryption Security
Log Management
Mobile Security
IoT Security
100+ Years and $350+ Billion of Combined TMT Industry Knowledge and Transaction Experience
Rob LouvCo-Head,
Managing Director, TMT
Miami
Bobby WolfeDirector, TMT
Miami
Vik PanditDirector, TMT
New York
Will EideDirector, TMT Los Angeles
3
Chin PandyaDirector,
Business ServicesLos Angeles
James RekasDirector,
Business ServicesWashington, D.C.
Walid KhiariManaging Director,
TMTSan Francisco
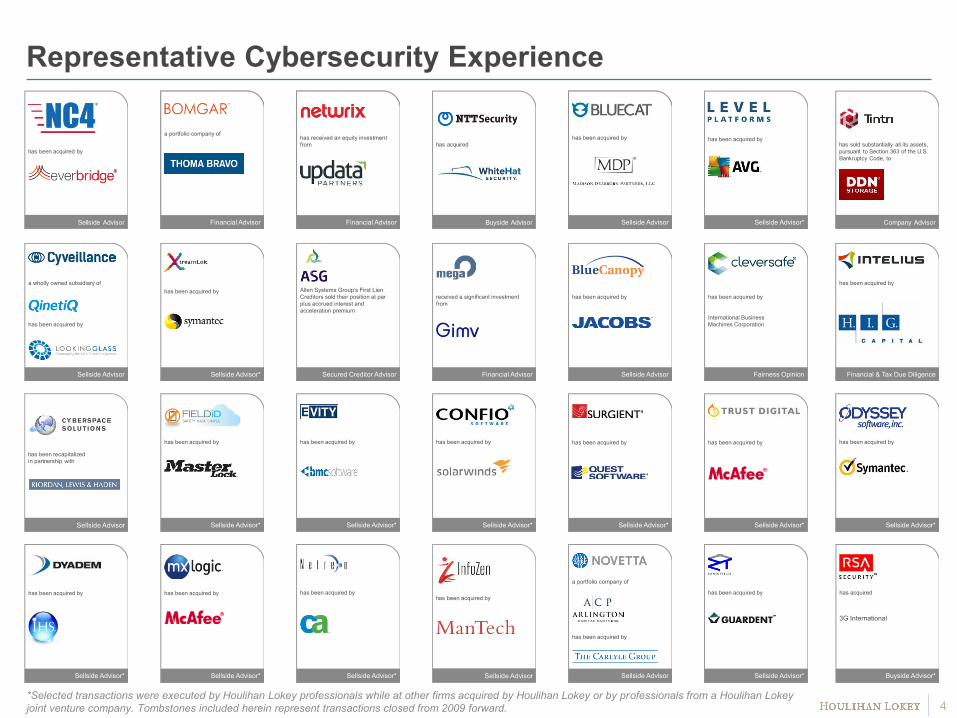
Representative Cybersecurity Experience
4*Selected transactions were executed by Houlihan Lokey professionals while at other firms acquired by Houlihan Lokey or by professionals from a Houlihan Lokey joint venture company. Tombstones included herein represent transactions closed from 2009 forward.
has been acquired by
Sellside Advisor*
has been acquired by
Sellside Advisor*
has been acquired by
International Business Machines Corporation
Fairness Opinion
has sold substantially all its assets, pursuant to Section 363 of the U.S. Bankruptcy Code, to
Company Advisor
received a significant investment from
Financial Advisor
a wholly owned subsidiary of
has been acquired by
Sellside Advisor
has been acquired by
Sellside Advisor*
has been acquired by
Sellside Advisor
has been recapitalizedin partnership with
Sellside Advisor
has been acquired by
Sellside Advisor*
Allen Systems Group’s First Lien Creditors sold their position at par plus accrued interest and acceleration premium
Secured Creditor Advisor
has been acquired by
Sellside Advisor*
has been acquired by
Sellside Advisor*
has been acquired by
Sellside Advisor*
has acquired
3G International
Buyside Advisor*
has been acquired by
Sellside Advisor
has been acquired by
Sellside Advisor*
a portfolio company of
has been acquired by
Sellside Advisor
has been acquired by
Sellside Advisor*
has been acquired by
Sellside Advisor*
has been acquired by
Financial & Tax Due Diligence
has been acquired by
Sellside Advisor*
has been acquired by
Sellside Advisor*
has completed a financing consisting of
$24,000,000Series D Convertible Preferred Stock
Placement Agent
a portfolio company of
Financial Advisor
has completed a financing consisting of
$24,000,000Series D Convertible Preferred Stock
Placement Agent
has received an equity investment from
Financial Advisor
has completed a financing consisting of
$24,000,000Series D Convertible Preferred Stock
Placement Agent
has been acquired by
Sellside Advisor
has been acquired by
Sellside Advisor
has acquired
Buyside Advisor
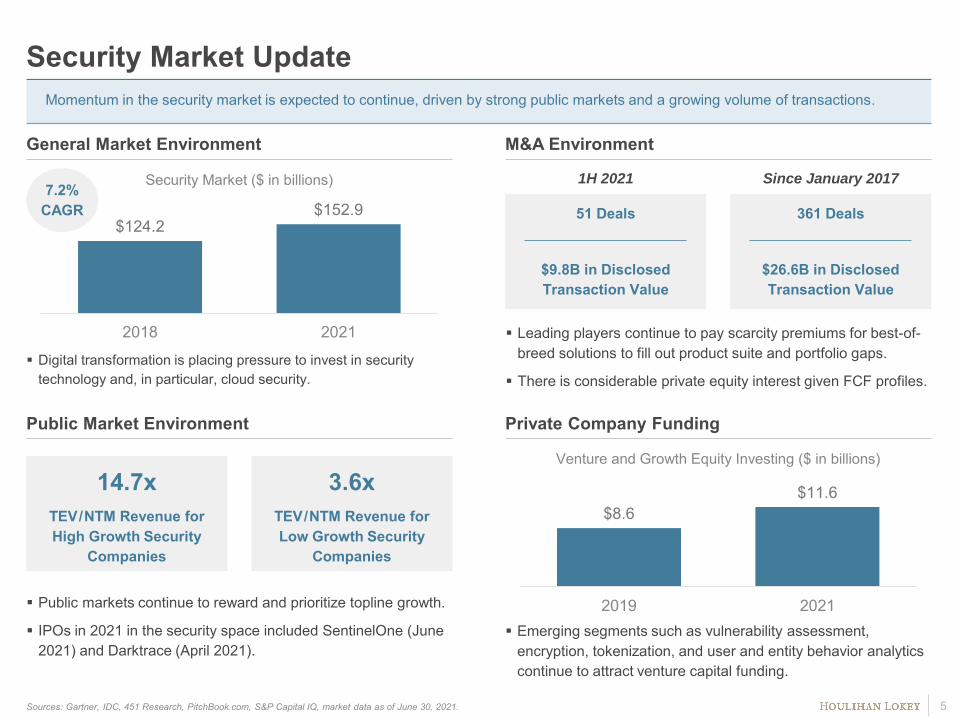
Security Market UpdateMomentum in the security market is expected to continue, driven by strong public markets and a growing volume of transactions.
Sources: Gartner, IDC, 451 Research, PitchBook.com, S&P Capital IQ, market data as of June 30, 2021. 5
General Market Environment M&A Environment
Public Market Environment Private Company Funding
Digital transformation is placing pressure to invest in security technology and, in particular, cloud security.
$124.2$152.9
2018 2021
Security Market ($ in billions)
Leading players continue to pay scarcity premiums for best-of-breed solutions to fill out product suite and portfolio gaps.
There is considerable private equity interest given FCF profiles.
361 Deals
$26.6B in Disclosed Transaction Value
Since January 2017
51 Deals
$9.8B in Disclosed Transaction Value
1H 2021
Public markets continue to reward and prioritize topline growth.
IPOs in 2021 in the security space included SentinelOne (June 2021) and Darktrace (April 2021).
14.7xTEV/NTM Revenue for High Growth Security
Companies
3.6xTEV/NTM Revenue for Low Growth Security
Companies
Emerging segments such as vulnerability assessment, encryption, tokenization, and user and entity behavior analytics continue to attract venture capital funding.
7.2% CAGR
$8.6$11.6
2019 2021
Venture and Growth Equity Investing ($ in billions)

Importance of Identity Ransomware Proliferation Acceleration of Zero Trust
Trend Companies are reassessing their identity management protocols as identity expands beyond people to include devices, robots, and software.
Cybercrime is estimated to cost the world in excess of $6 trillion annually by 2021, up from $3 trillion in 2015.
As hacker complexity increases, companies must verify both internal and external credentials (network segmentation, lateral movement limitations, etc.).
Private Companies to Watch
$1.0B
$4.9B
$9.2B
2015 2018 2021 YTD
Momentum in Cybersecurity Sector Driven by Multiple Trends
6
$760K
$1.9M
2020 2021
Avg. Cost to Rectify Ransomware
Sources: Sophos: The State of Ransomware 2021, 451 Research, Cybersecurity Ventures.
Identity Access Management M&A
Verify Who Contextualize Request
Secure AdminEnvironment
Grant Lease Privilege
Adaptive Control
Audit Everything
API
Zero Trust Framework

0.0x
2.0x
4.0x
6.0x
8.0x
10.0x
12.0x
14.0x
16.0x
18.0x
Jun-20 Aug-20 Sep-20 Nov-20 Dec-20 Feb-21 Mar-21 May-21 Jun-21
High Growth Security Low Growth Security Security Services
Select Public Multiples – Forward 12 Months
Sources: S&P Capital IQ, Market data as of June 30, 2021.Note: Indices contain public companies on the following pages and are weighted by market capitalization.
EV/NTM Revenue
1.9x
3.6x
14.7x
7
0.0x
5.0x
10.0x
15.0x
20.0x
25.0x
30.0x
35.0x
0.0% 5.0% 10.0% 15.0% 20.0% 25.0% 30.0% 35.0% 40.0%
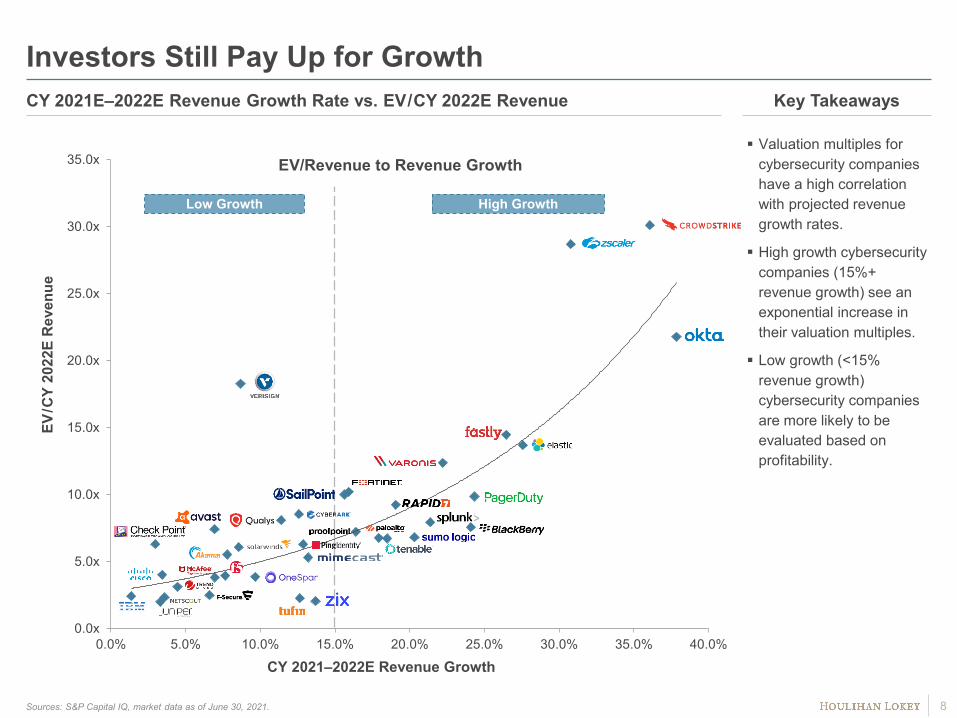
EV/Revenue to Revenue Growth
Investors Still Pay Up for Growth
8
Key Takeaways
CY 2021–2022E Revenue Growth
EV/C
Y 20
22E
Rev
enue
Valuation multiples for cybersecurity companies have a high correlation with projected revenue growth rates.
High growth cybersecurity companies (15%+ revenue growth) see an exponential increase in their valuation multiples.
Low growth (<15% revenue growth) cybersecurity companies are more likely to be evaluated based on profitability.
Sources: S&P Capital IQ, market data as of June 30, 2021.
CY 2021E–2022E Revenue Growth Rate vs. EV/CY 2022E Revenue
Low Growth High Growth
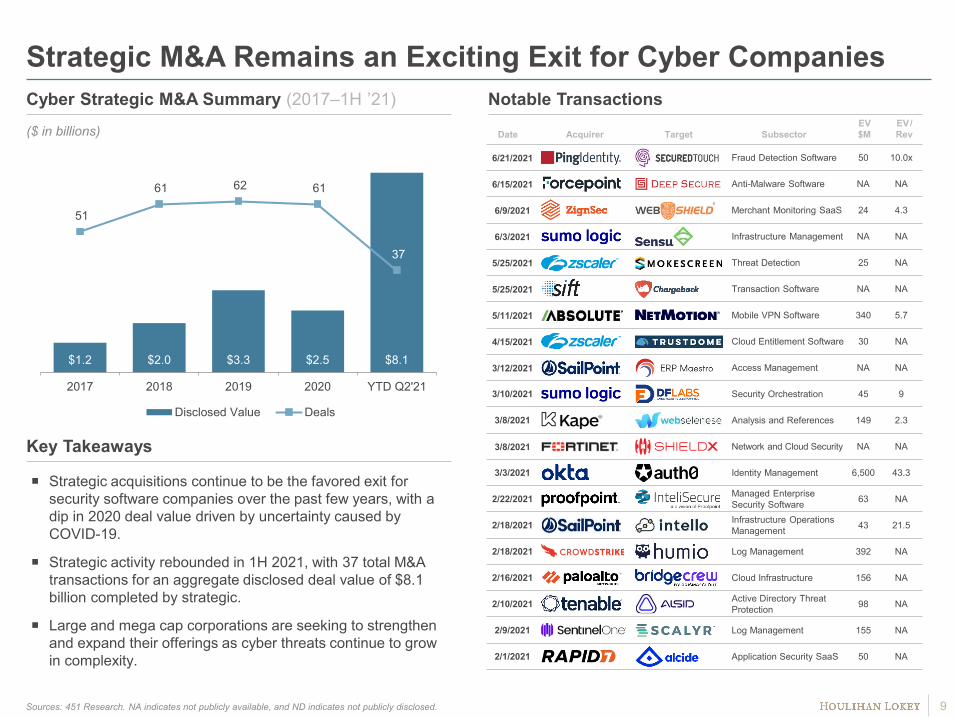
$1.2 $2.0 $3.3 $2.5 $8.1
51
61 62 61
37
2017 2018 2019 2020 YTD Q2'21
Disclosed Value Deals
Strategic M&A Remains an Exciting Exit for Cyber Companies
Sources: 451 Research. NA indicates not publicly available, and ND indicates not publicly disclosed. 9
Date Acquirer Target SubsectorEV $M
EV/ Rev
6/21/2021 Fraud Detection Software 50 10.0x
6/15/2021 Anti-Malware Software NA NA
6/9/2021 Merchant Monitoring SaaS 24 4.3
6/3/2021 Infrastructure Management NA NA
5/25/2021 Threat Detection 25 NA
5/25/2021 Transaction Software NA NA
5/11/2021 Mobile VPN Software 340 5.7
4/15/2021 Cloud Entitlement Software 30 NA
3/12/2021 Access Management NA NA
3/10/2021 Security Orchestration 45 9
3/8/2021 Analysis and References 149 2.3
3/8/2021 Network and Cloud Security NA NA
3/3/2021 Identity Management 6,500 43.3
2/22/2021 Managed Enterprise Security Software 63 NA
2/18/2021 Infrastructure Operations Management 43 21.5
2/18/2021 Log Management 392 NA
2/16/2021 Cloud Infrastructure 156 NA
2/10/2021 Active Directory Threat Protection 98 NA
2/9/2021 Log Management 155 NA
2/1/2021 Application Security SaaS 50 NA
Notable Transactions
Key Takeaways
Strategic acquisitions continue to be the favored exit for security software companies over the past few years, with a dip in 2020 deal value driven by uncertainty caused by COVID-19.
Strategic activity rebounded in 1H 2021, with 37 total M&A transactions for an aggregate disclosed deal value of $8.1 billion completed by strategic.
Large and mega cap corporations are seeking to strengthen and expand their offerings as cyber threats continue to grow in complexity.
($ in billions)
Cyber Strategic M&A Summary (2017–1H ’21)
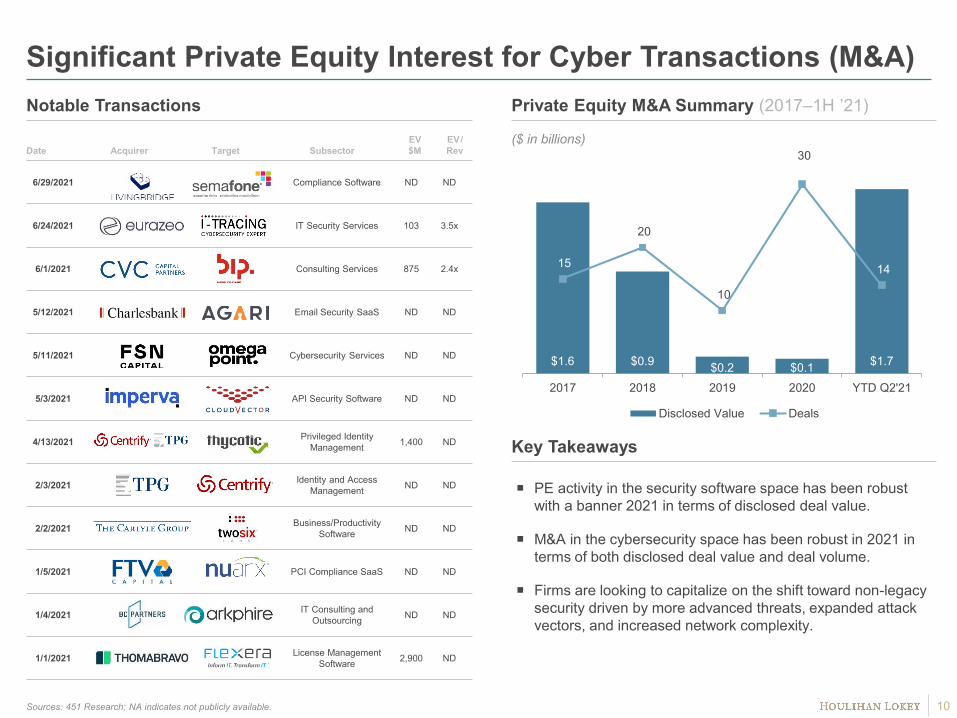
$1.6 $0.9 $0.2 $0.1 $1.7
15
20
10
30
14
2017 2018 2019 2020 YTD Q2'21
Disclosed Value Deals
Date Acquirer Target SubsectorEV $M
EV/ Rev
6/29/2021 Compliance Software ND ND
6/24/2021 IT Security Services 103 3.5x
6/1/2021 Consulting Services 875 2.4x
5/12/2021 Email Security SaaS ND ND
5/11/2021 Cybersecurity Services ND ND
5/3/2021 API Security Software ND ND
4/13/2021 Privileged Identity Management 1,400 ND
2/3/2021 Identity and AccessManagement ND ND
2/2/2021 Business/Productivity Software ND ND
1/5/2021 PCI Compliance SaaS ND ND
1/4/2021 IT Consulting and Outsourcing ND ND
1/1/2021 License Management Software 2,900 ND
Significant Private Equity Interest for Cyber Transactions (M&A)
PE activity in the security software space has been robust with a banner 2021 in terms of disclosed deal value.
M&A in the cybersecurity space has been robust in 2021 in terms of both disclosed deal value and deal volume.
Firms are looking to capitalize on the shift toward non-legacy security driven by more advanced threats, expanded attack vectors, and increased network complexity.
Private Equity M&A Summary (2017–1H ’21)
Key Takeaways
Sources: 451 Research; NA indicates not publicly available.
($ in billions)
10
Notable Transactions

$5.8 $7.9 $8.6 $10.5 $11.6
1,011 1,030 1,041928
460
2017 2018 2019 2020 1H 2021
Capital Invested Deals
Cyber Is Drawing Growth Equity, As WellSecurity Private Funding Summary (2017–Q2 ’21)
Private Funding Volume by Round (2017–Q2 ’21)
Sources: PitchBook.com and S&P Capital IQ; NA indicates not publicly available.
Seed / AngelSeries
ASeries
BSeries
CSeries
DMedian Post-MoneyValuation $9.0 $32.0 $91.0 $185.6 $495.0
($ in billions)
Percent of Dealsby Round
Deal Valuationby Round
($ in millions)
11
Deal Date Lead Investor Target Subsector Transaction Value $M
6/24/2021 Blockchain Data Mgmt. Software $100M
6/24/2021 Zero Trust Software $225
6/23/2021 Security Info and Event Management $200
6/22/2021 Authentication Software $543
6/21/2021 DevSecOpsSoftware $205
6/9/2021 B2C Identity Mgmt. Software $150
3/30/2021 Data Management Software $374
3/26/2021 Blockchain Data Mgmt. Software $100
3/18/2021 Identity Access Management $100
3/8/2021 Cloud Security $210
2/1/2021 Cyber Insurance Software $175
1/7/2021 Cloud Security $525
Notable Transactions
41%
29%
16%
7%7% Seed / Angel
Series A
Series B
Series C
Series D+
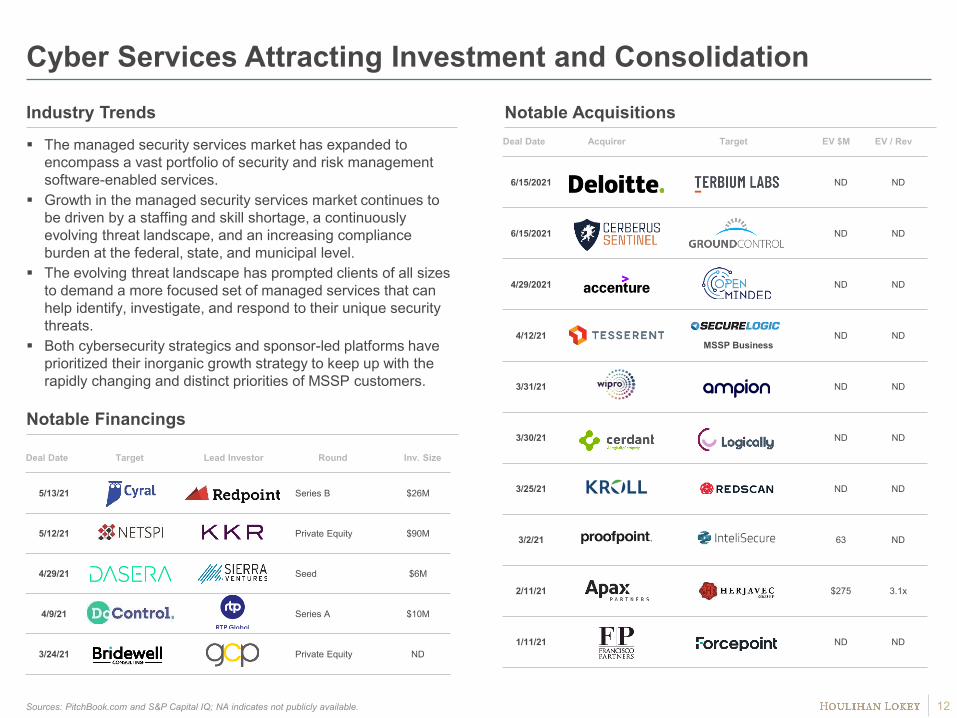
Cyber Services Attracting Investment and Consolidation
Sources: PitchBook.com and S&P Capital IQ; NA indicates not publicly available. 12
The managed security services market has expanded to encompass a vast portfolio of security and risk management software-enabled services.
Growth in the managed security services market continues to be driven by a staffing and skill shortage, a continuously evolving threat landscape, and an increasing compliance burden at the federal, state, and municipal level.
The evolving threat landscape has prompted clients of all sizes to demand a more focused set of managed services that can help identify, investigate, and respond to their unique security threats.
Both cybersecurity strategics and sponsor-led platforms have prioritized their inorganic growth strategy to keep up with the rapidly changing and distinct priorities of MSSP customers.
Deal Date Acquirer Target EV $M EV / Rev
6/15/2021 ND ND
6/15/2021 ND ND
4/29/2021 ND ND
4/12/21MSSP Business
ND ND
3/31/21 ND ND
3/30/21 ND ND
3/25/21 ND ND
3/2/21 63 ND
2/11/21 $275 3.1x
1/11/21 ND ND
Notable AcquisitionsIndustry Trends
Notable Financings
Deal Date Target Lead Investor Round Inv. Size
5/13/21 Series B $26M
5/12/21 Private Equity $90M
4/29/21 Seed $6M
4/9/21 Series A $10M
3/24/21 Private Equity ND

35.0x30.1x 28.7x
21.8x
14.5x 13.7x 12.4x 10.5x 10.2x 10.0x 9.9x 9.2x 7.9x 7.6x 7.2x 6.8x 6.8x 6.7x
NM NM NM NM NM NM NM NM NM NM NM NM NM NM NM NM NM NM
4.2x 3.6x 2.5x 2.1x 1.1x 0.9x
25.9x
15.9x
n.a.
12.x
5.5x 7.x
Public Company Benchmarking: EV/CY 2022E Revenue and EBITDA
Source: S&P Capital IQ as of June 30, 2021; NM indicates not meaningful or EV/EBITDA >50x.Sorted by 2020–2021E Revenue Growth. 13
High Growth Cyber (15%+ Revenue Growth)
Low Growth Cyber (<15% Revenue Growth)
Security ServicesMedian EV /2022E Revenue: 2.3xMedian EV /2022E EBITDA: 12.0x
Median EV /2022E Revenue: 4.0xMedian EV /2022E EBITDA: 12.4x
Median EV/2022E Revenue: 10.1xMedian EV /2022E EBITDA: NM
EV /2022E Revenue EV /2022E EBITDA
18.3x
8.5x 8.1x 7.4x 6.3x 6.3x 6.1x 5.5x 5.3x 4.7x 4.1x 4.0x 3.9x 3.9x 3.8x 3.1x 2.5x 2.4x 2.3x 2.3x 2.3x 2.1x 2.0x
25.7x
n.a.
20.1x
13.2x 12.9x
n.a.
13.6x 12.4x
19.9x
11.9x
17.8x
11.4x 10.9x
n.a.
9.5x 10.x
15.1x
9.6x
n.a. n.a. n.a.
9.3x 9.3x

71.5%
37.9% 36.1%30.8% 27.6% 26.6% 26.5% 24.3% 24.1% 22.2% 21.4% 20.3% 19.1% 18.5% 17.9% 16.4% 15.9% 15.6%
Median 2021–2022E Revenue Growth: 23.1%
Public Company Benchmarking: CY 2021–2022E Revenue Growth
Source: S&P Capital IQ as of June 30, 2021; NM indicates not meaningful or EV/EBITDA >30x.Sorted by EV/2021E Revenue. 14
Median 2021–2022E Revenue Growth: 5.8%
Median 2021–2022E Revenue Growth: 7.6%
High Growth Cyber (15%+ Revenue Growth)
Low Growth Cyber (<15% Revenue Growth)
Security Services
13.7% 13.2% 12.9% 12.8% 12.6% 12.6% 11.4%9.7%
8.7% 8.5% 7.8% 7.6% 6.9% 6.9% 6.6%4.5% 3.6% 3.4% 3.3% 3.0%
1.4% 1.4% 0.7%
11.4%9.3%
7.9%
3.7%2.8% 2.1%
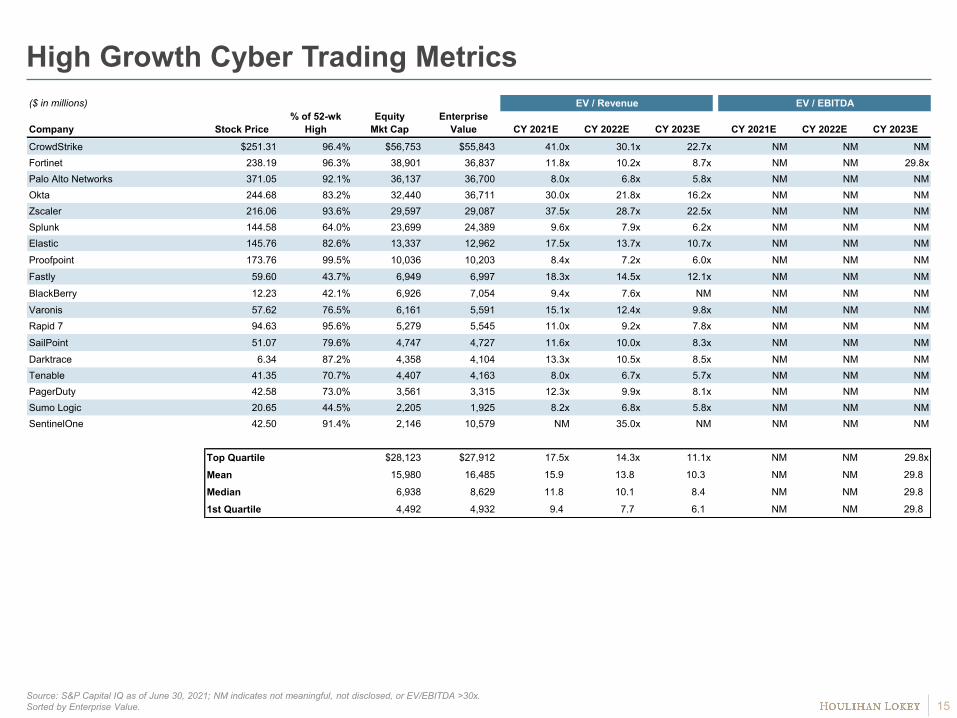
($ in millions) EV / Revenue EV / EBITDA
Company Stock Price% of 52-wk
HighEquity
Mkt CapEnterprise
Value CY 2021E CY 2022E CY 2023E CY 2021E CY 2022E CY 2023ECrowdStrike $251.31 96.4% $56,753 $55,843 41.0x 30.1x 22.7x NM NM NM Fortinet 238.19 96.3% 38,901 36,837 11.8x 10.2x 8.7x NM NM 29.8xPalo Alto Networks 371.05 92.1% 36,137 36,700 8.0x 6.8x 5.8x NM NM NM Okta 244.68 83.2% 32,440 36,711 30.0x 21.8x 16.2x NM NM NM Zscaler 216.06 93.6% 29,597 29,087 37.5x 28.7x 22.5x NM NM NM Splunk 144.58 64.0% 23,699 24,389 9.6x 7.9x 6.2x NM NM NM Elastic 145.76 82.6% 13,337 12,962 17.5x 13.7x 10.7x NM NM NM Proofpoint 173.76 99.5% 10,036 10,203 8.4x 7.2x 6.0x NM NM NM Fastly 59.60 43.7% 6,949 6,997 18.3x 14.5x 12.1x NM NM NM BlackBerry 12.23 42.1% 6,926 7,054 9.4x 7.6x NM NM NM NM Varonis 57.62 76.5% 6,161 5,591 15.1x 12.4x 9.8x NM NM NM Rapid 7 94.63 95.6% 5,279 5,545 11.0x 9.2x 7.8x NM NM NM SailPoint 51.07 79.6% 4,747 4,727 11.6x 10.0x 8.3x NM NM NM Darktrace 6.34 87.2% 4,358 4,104 13.3x 10.5x 8.5x NM NM NM Tenable 41.35 70.7% 4,407 4,163 8.0x 6.7x 5.7x NM NM NM PagerDuty 42.58 73.0% 3,561 3,315 12.3x 9.9x 8.1x NM NM NM Sumo Logic 20.65 44.5% 2,205 1,925 8.2x 6.8x 5.8x NM NM NM SentinelOne 42.50 91.4% 2,146 10,579 NM 35.0x NM NM NM NM
Top Quartile $28,123 $27,912 17.5x 14.3x 11.1x NM NM 29.8x
Mean 15,980 16,485 15.9 13.8 10.3 NM NM 29.8
Median 6,938 8,629 11.8 10.1 8.4 NM NM 29.8
1st Quartile 4,492 4,932 9.4 7.7 6.1 NM NM 29.8
High Growth Cyber Trading Metrics
15Source: S&P Capital IQ as of June 30, 2021; NM indicates not meaningful, not disclosed, or EV/EBITDA >30x.Sorted by Enterprise Value.

($ in millions) EV / Revenue EV / EBITDA
Company Stock Price% of 52-wk
HighEquity
Mkt CapEnterprise
Value CY 2021E CY 2022E CY 2023E CY 2021E CY 2022E CY 2023ECisco $53.00 95.8% $223,353 $212,312 4.1x 4.0x 3.9x 11.4x 11.4x NM
IBM 146.59 95.9% 131,517 182,821 2.5x 2.4x 2.4x 9.6x 9.6x 9.3x
VeriSign 227.69 98.4% 25,473 26,308 19.9x 18.3x 16.6x 28.4x 25.7x 23.0x
Akamai 116.60 93.3% 18,986 20,421 6.0x 5.5x 5.1x 13.4x 12.4x 11.4x
Check Point 116.13 83.4% 15,527 13,882 6.5x 6.3x 6.1x 13.3x 12.9x 12.8x
OpenText 50.80 98.0% 13,727 16,060 4.8x 4.7x NM 12.8x 11.9x NM
McAfee 28.02 95.4% 12,421 8,255 4.1x 3.8x 3.3x 11.4x 9.5x 7.6x
F5 186.66 86.4% 11,258 11,092 4.3x 3.9x 3.6x 11.9x 10.9x NM
Juniper 27.35 94.1% 8,893 9,486 2.0x 2.0x 1.9x 10.0x 9.3x 9.4x
Trend Micro 52.44 84.3% 7,313 5,201 3.2x 3.0x 2.9x 10.2x 9.7x 9.3x
Avast 6.76 81.0% 6,963 7,482 7.9x 7.4x 6.9x 14.2x 13.2x 12.4x
SolarWinds 33.78 69.4% 5,338 6,979 6.6x 6.1x 5.6x 15.3x 13.6x 11.8x
CyberArk 130.27 76.8% 5,112 4,714 9.6x 8.5x 7.1x NM NM NM
Qualys 100.69 67.6% 3,921 3,634 9.0x 8.1x 7.3x 21.8x 20.0x 17.5x
Mimecast 53.05 89.2% 3,487 3,362 6.0x 5.3x 4.4x 23.1x 19.9x 14.2x
NetScout 28.54 89.4% 2,114 2,032 2.4x 2.3x 2.3x NM NM NM
Ping Identity 22.90 60.6% 1,880 1,914 7.1x 6.3x 5.5x NM NM NM
OneSpan 25.54 76.6% 1,026 932 4.2x 3.9x NM NM NM NM
F-Secure 4.77 92.7% 756 741 2.7x 2.5x 2.3x 17.0x 15.1x 13.0x
Absolute Software 14.47 71.7% 717 587 4.6x 4.1x NM 20.2x 17.8x NM
Zix 7.05 68.0% 393 582 2.3x 2.1x 2.0x 10.6x 9.3x NM
Tufin 9.12 45.4% 340 275 2.6x 2.3x NM NM NM NM
Cyren 0.81 41.1% 61 74 2.3x 2.3x NM NM NM NM
Top Quartile $13,074 $12,487 6.5x 6.2x 6.0x 17.0x 15.1x 13.3x
Mean 21,764 23,441 5.4 5.0 5.0 15.0 13.7 12.6
Median 5,338 5,201 4.3 4.0 4.2 13.3 12.4 12.1
1st Quartile 1,453 1,423 2.6 2.5 2.5 11.4 9.7 9.4
Low Growth Cyber Trading Metrics
16Source: S&P Capital IQ as of June 30, 2021; NM indicates not meaningful, not disclosed, or EV/EBITDA >30x.Sorted by Enterprise Value.
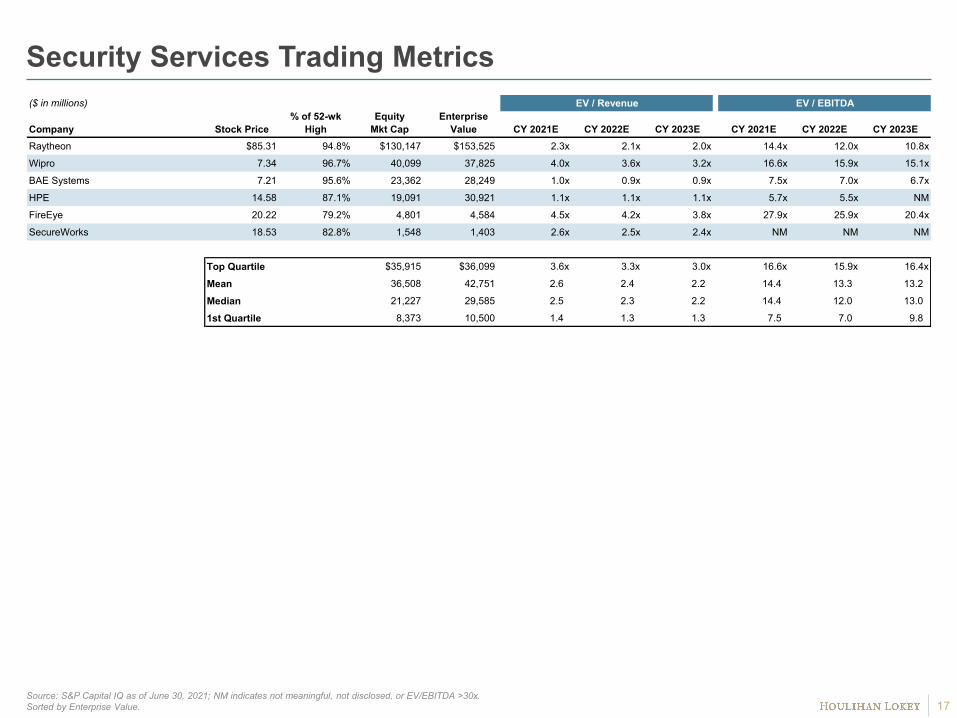
($ in millions) EV / Revenue EV / EBITDA
Company Stock Price% of 52-wk
HighEquity
Mkt CapEnterprise
Value CY 2021E CY 2022E CY 2023E CY 2021E CY 2022E CY 2023ERaytheon $85.31 94.8% $130,147 $153,525 2.3x 2.1x 2.0x 14.4x 12.0x 10.8x
Wipro 7.34 96.7% 40,099 37,825 4.0x 3.6x 3.2x 16.6x 15.9x 15.1x
BAE Systems 7.21 95.6% 23,362 28,249 1.0x 0.9x 0.9x 7.5x 7.0x 6.7x
HPE 14.58 87.1% 19,091 30,921 1.1x 1.1x 1.1x 5.7x 5.5x NM
FireEye 20.22 79.2% 4,801 4,584 4.5x 4.2x 3.8x 27.9x 25.9x 20.4x
SecureWorks 18.53 82.8% 1,548 1,403 2.6x 2.5x 2.4x NM NM NM
Top Quartile $35,915 $36,099 3.6x 3.3x 3.0x 16.6x 15.9x 16.4x
Mean 36,508 42,751 2.6 2.4 2.2 14.4 13.3 13.2
Median 21,227 29,585 2.5 2.3 2.2 14.4 12.0 13.0
1st Quartile 8,373 10,500 1.4 1.3 1.3 7.5 7.0 9.8
Security Services Trading Metrics
17Source: S&P Capital IQ as of June 30, 2021; NM indicates not meaningful, not disclosed, or EV/EBITDA >30x.Sorted by Enterprise Value.
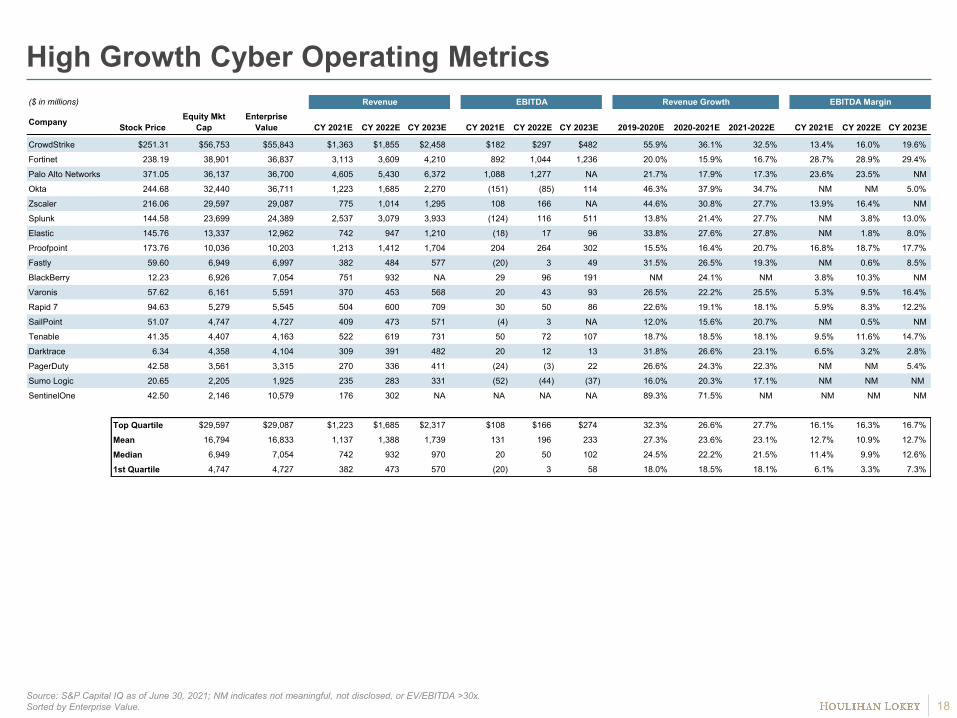
($ in millions) Revenue EBITDA Revenue Growth EBITDA Margin
Company Stock PriceEquity Mkt
CapEnterprise
Value CY 2021E CY 2022E CY 2023E CY 2021E CY 2022E CY 2023E 2019-2020E 2020-2021E 2021-2022E CY 2021E CY 2022E CY 2023E
CrowdStrike $251.31 $56,753 $55,843 $1,363 $1,855 $2,458 $182 $297 $482 55.9% 36.1% 32.5% 13.4% 16.0% 19.6%
Fortinet 238.19 38,901 36,837 3,113 3,609 4,210 892 1,044 1,236 20.0% 15.9% 16.7% 28.7% 28.9% 29.4%
Palo Alto Networks 371.05 36,137 36,700 4,605 5,430 6,372 1,088 1,277 NA 21.7% 17.9% 17.3% 23.6% 23.5% NM
Okta 244.68 32,440 36,711 1,223 1,685 2,270 (151) (85) 114 46.3% 37.9% 34.7% NM NM 5.0%
Zscaler 216.06 29,597 29,087 775 1,014 1,295 108 166 NA 44.6% 30.8% 27.7% 13.9% 16.4% NM
Splunk 144.58 23,699 24,389 2,537 3,079 3,933 (124) 116 511 13.8% 21.4% 27.7% NM 3.8% 13.0%
Elastic 145.76 13,337 12,962 742 947 1,210 (18) 17 96 33.8% 27.6% 27.8% NM 1.8% 8.0%
Proofpoint 173.76 10,036 10,203 1,213 1,412 1,704 204 264 302 15.5% 16.4% 20.7% 16.8% 18.7% 17.7%
Fastly 59.60 6,949 6,997 382 484 577 (20) 3 49 31.5% 26.5% 19.3% NM 0.6% 8.5%
BlackBerry 12.23 6,926 7,054 751 932 NA 29 96 191 NM 24.1% NM 3.8% 10.3% NM
Varonis 57.62 6,161 5,591 370 453 568 20 43 93 26.5% 22.2% 25.5% 5.3% 9.5% 16.4%
Rapid 7 94.63 5,279 5,545 504 600 709 30 50 86 22.6% 19.1% 18.1% 5.9% 8.3% 12.2%
SailPoint 51.07 4,747 4,727 409 473 571 (4) 3 NA 12.0% 15.6% 20.7% NM 0.5% NM
Tenable 41.35 4,407 4,163 522 619 731 50 72 107 18.7% 18.5% 18.1% 9.5% 11.6% 14.7%
Darktrace 6.34 4,358 4,104 309 391 482 20 12 13 31.8% 26.6% 23.1% 6.5% 3.2% 2.8%
PagerDuty 42.58 3,561 3,315 270 336 411 (24) (3) 22 26.6% 24.3% 22.3% NM NM 5.4%
Sumo Logic 20.65 2,205 1,925 235 283 331 (52) (44) (37) 16.0% 20.3% 17.1% NM NM NM
SentinelOne 42.50 2,146 10,579 176 302 NA NA NA NA 89.3% 71.5% NM NM NM NM
Top Quartile $29,597 $29,087 $1,223 $1,685 $2,317 $108 $166 $274 32.3% 26.6% 27.7% 16.1% 16.3% 16.7%
Mean 16,794 16,833 1,137 1,388 1,739 131 196 233 27.3% 23.6% 23.1% 12.7% 10.9% 12.7%
Median 6,949 7,054 742 932 970 20 50 102 24.5% 22.2% 21.5% 11.4% 9.9% 12.6%
1st Quartile 4,747 4,727 382 473 570 (20) 3 58 18.0% 18.5% 18.1% 6.1% 3.3% 7.3%
High Growth Cyber Operating Metrics
18Source: S&P Capital IQ as of June 30, 2021; NM indicates not meaningful, not disclosed, or EV/EBITDA >30x.Sorted by Enterprise Value.

($ in millions) Revenue EBITDA Revenue Growth EBITDA Margin
Company Stock PriceEquity Mkt
CapEnterprise
Value CY 2021E CY 2022E CY 2023E CY 2021E CY 2022E CY 2023E 2019-2020E 2020-2021E 2021-2022E CY 2021E CY 2022E CY 2023E
Cisco $53.00 $223,353 $212,312 $51,260 $53,015 $54,861 $18,685 $18,552 NA 6.7% 3.4% 3.5% 36.5% 35.0% NM
IBM 146.59 131,517 182,821 74,398 75,404 76,704 19,021 19,130 19,707 1.1% 1.4% 1.7% 25.6% 25.4% 25.7%
VeriSign 227.69 25,473 26,308 1,324 1,439 1,582 928 1,025 1,144 4.6% 8.7% 10.0% 70.1% 71.3% 72.3%
Akamai 116.60 18,986 20,421 3,431 3,698 3,993 1,519 1,652 1,798 7.3% 7.8% 8.0% 44.3% 44.7% 45.0%
Check Point 116.13 15,527 13,882 2,140 2,203 2,265 1,043 1,080 1,087 3.6% 3.0% 2.8% 48.8% 49.0% 48.0%
OpenText 50.80 13,727 16,060 3,367 3,390 NA 1,258 1,349 NA 2.0% 0.7% NM 37.4% 39.8% NM
McAfee 28.02 12,421 8,255 2,021 2,161 2,528 722 869 1,089 NM 6.9% 17.0% 35.7% 40.2% 43.1%
F5 186.66 11,258 11,092 2,609 2,808 3,073 930 1,016 NA 8.4% 7.6% 9.4% 35.6% 36.2% NM
Juniper 27.35 8,893 9,486 4,648 4,801 4,886 952 1,015 1,013 4.6% 3.3% 1.8% 20.5% 21.1% 20.7%
Trend Micro 52.44 7,313 5,201 1,645 1,719 1,807 512 534 558 NM 4.5% 5.1% 31.1% 31.1% 30.9%
Avast 6.76 6,963 7,482 943 1,008 1,084 528 565 606 5.6% 6.9% 7.5% 56.0% 56.0% 55.8%
SolarWinds 33.78 5,338 6,979 1,058 1,148 1,243 456 513 590 3.8% 8.5% 8.3% 43.1% 44.7% 47.5%
CyberArk 130.27 5,112 4,714 490 552 668 39 40 81 5.6% 12.6% 20.9% 7.9% 7.3% 12.2%
Qualys 100.69 3,921 3,634 403 449 496 166 181 207 11.1% 11.4% 10.4% 41.3% 40.4% 41.8%
Mimecast 53.05 3,487 3,362 560 634 756 145 169 237 16.2% 13.2% 19.4% 26.0% 26.7% 31.3%
NetScout 28.54 2,114 2,032 844 874 895 NA NA NA NM 3.6% 2.4% NM NM NM
Ping Identity 22.90 1,880 1,914 269 304 345 25 31 42 10.6% 12.9% 13.6% 9.1% 10.3% 12.3%
OneSpan 25.54 1,026 932 220 242 NA (0) 15 NA 2.1% 9.7% NM NM 6.3% NM
F-Secure 4.77 756 741 279 297 316 44 49 57 3.5% 6.6% 6.2% 15.6% 16.5% 18.1%
Absolute Software 14.47 717 587 126 143 NA 29 33 NA 13.3% 12.8% NM 22.9% 23.2% NM
Zix 7.05 393 582 249 283 296 55 62 NA 14.1% 13.7% 4.5% 22.1% 22.0% NM
Tufin 9.12 340 275 108 121 NA (30) (26) NA 6.7% 12.6% NM NM NM NM
Cyren 0.81 61 74 32 33 NA NA NA NA NM 1.4% NM NM NM NM
Top Quartile $13,074 $12,487 $2,374 $2,506 $2,937 $952 $1,025 $1,089 9.5% 12.0% 10.3% 42.2% 41.4% 46.8%
Mean 21,764 23,441 6,627 6,814 8,767 2,239 2,279 2,015 6.9% 7.5% 8.5% 33.1% 32.3% 36.0%
Median 5,338 5,201 943 1,008 1,413 512 534 598 5.6% 7.6% 7.8% 35.6% 33.0% 36.5%
1st Quartile 1,453 1,423 274 301 690 44 49 215 3.7% 3.5% 3.7% 22.5% 21.8% 22.0%
Low Growth Cyber Operating Metrics
19Source: S&P Capital IQ as of June 30, 2021; NM indicates not meaningful, not disclosed, or EV/EBITDA >30x.Sorted by Enterprise Value.
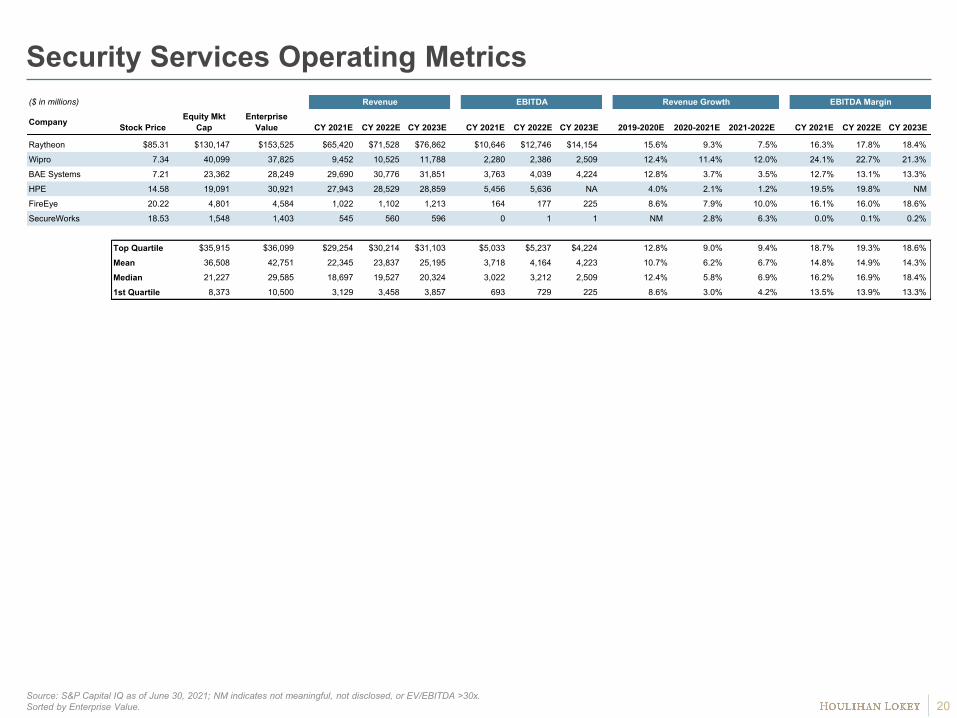
($ in millions) Revenue EBITDA Revenue Growth EBITDA Margin
Company Stock PriceEquity Mkt
CapEnterprise
Value CY 2021E CY 2022E CY 2023E CY 2021E CY 2022E CY 2023E 2019-2020E 2020-2021E 2021-2022E CY 2021E CY 2022E CY 2023E
Raytheon $85.31 $130,147 $153,525 $65,420 $71,528 $76,862 $10,646 $12,746 $14,154 15.6% 9.3% 7.5% 16.3% 17.8% 18.4%
Wipro 7.34 40,099 37,825 9,452 10,525 11,788 2,280 2,386 2,509 12.4% 11.4% 12.0% 24.1% 22.7% 21.3%
BAE Systems 7.21 23,362 28,249 29,690 30,776 31,851 3,763 4,039 4,224 12.8% 3.7% 3.5% 12.7% 13.1% 13.3%
HPE 14.58 19,091 30,921 27,943 28,529 28,859 5,456 5,636 NA 4.0% 2.1% 1.2% 19.5% 19.8% NM
FireEye 20.22 4,801 4,584 1,022 1,102 1,213 164 177 225 8.6% 7.9% 10.0% 16.1% 16.0% 18.6%
SecureWorks 18.53 1,548 1,403 545 560 596 0 1 1 NM 2.8% 6.3% 0.0% 0.1% 0.2%
Top Quartile $35,915 $36,099 $29,254 $30,214 $31,103 $5,033 $5,237 $4,224 12.8% 9.0% 9.4% 18.7% 19.3% 18.6%
Mean 36,508 42,751 22,345 23,837 25,195 3,718 4,164 4,223 10.7% 6.2% 6.7% 14.8% 14.9% 14.3%
Median 21,227 29,585 18,697 19,527 20,324 3,022 3,212 2,509 12.4% 5.8% 6.9% 16.2% 16.9% 18.4%
1st Quartile 8,373 10,500 3,129 3,458 3,857 693 729 225 8.6% 3.0% 4.2% 13.5% 13.9% 13.3%
Security Services Operating Metrics
20Source: S&P Capital IQ as of June 30, 2021; NM indicates not meaningful, not disclosed, or EV/EBITDA >30x.Sorted by Enterprise Value.
© 2021 Houlihan Lokey. All rights reserved. This material may not be reproduced in any format by any means or redistributed without the prior written consent of Houlihan Lokey.
Houlihan Lokey is a trade name for Houlihan Lokey, Inc., and its subsidiaries and affiliates, which include those in (i) the United States: Houlihan Lokey Capital, Inc., an SEC-registered broker-dealer and member of FINRA (www.finra.org) and SIPC (www.sipc.org) (investment banking services); Houlihan Lokey Financial Advisors, Inc. (financial advisory services); HL Finance, LLC (syndicated leveraged finance platform); and Houlihan Lokey Real Estate Group, Inc. (real estate advisory services); (ii) Europe: Houlihan Lokey EMEA, LLP, and Houlihan Lokey (Corporate Finance) Limited, authorized and regulated by the U.K. Financial Conduct Authority; Houlihan Lokey (Europe) GmbH, authorized and regulated by the German Federal Financial Supervisory Authority (Bundesanstalt für Finanzdienstleistungsaufsicht); Houlihan Lokey GmbH; Houlihan Lokey S.p.A.; Houlihan Lokey (Netherlands) B.V.; Houlihan Lokey (España), S.A.; and Houlihan Lokey (Corporate Finance), S.A.; (iii) the United Arab Emirates, Dubai International Financial Centre (Dubai): Houlihan Lokey (MEA Financial Advisory) Limited, regulated by the Dubai Financial Services Authority for the provision of advising on financial products, arranging deals in investments, and arranging credit and advising on credit to professional clients only; (iv) Singapore: Houlihan Lokey (Singapore) Private Limited, an “exempt corporate finance adviser” able to provide exempt corporate finance advisory services to accredited investors only; (v) Hong Kong SAR: Houlihan Lokey (China) Limited, licensed in Hong Kong by the Securities and Futures Commission to conduct Type 1, 4, and 6 regulated activities to professional investors only; (vi) China: Houlihan Lokey Howard & Zukin Investment Consulting (Beijing) Co., Limited (financial advisory services); (vii) Japan: Houlihan Lokey K.K. (financial advisory services); and (viii) Australia: Houlihan Lokey (Australia) Pty Limited (ABN 74 601 825 227), a company incorporated in Australia and licensed by the Australian Securities and Investments Commission (AFSL number 474953) in respect of financial services provided to wholesale clients only. In the European Economic Area (EEA), Dubai, Singapore, Hong Kong, and Australia, this communication is directed to intended recipients, including actual or potential professional clients (EEA and Dubai), accredited investors (Singapore), professional investors (Hong Kong), and wholesale clients (Australia), respectively. Other persons, such as retail clients, are NOT the intended recipients of our communications or services and should not act upon this communication.
Houlihan Lokey gathers its data from sources it considers reliable; however, it does not guarantee the accuracy or completeness of the information provided within this presentation. The material presented reflects information known to the authors at the time this presentation was written, and this information is subject to change. Houlihan Lokey makes no representations or warranties, expressed or implied, regarding the accuracy of this material. The views expressed in this material accurately reflect the personal views of the authors regarding the subject securities and issuers and do not necessarily coincide with those of Houlihan Lokey. Officers, directors, and partners in the Houlihan Lokey group of companies may have positions in the securities of the companies discussed. This presentation does not constitute advice or a recommendation, offer, or solicitation with respect to the securities of any company discussed herein, is not intended to provide information upon which to base an investment decision, and should not be construed as such. Houlihan Lokey or its affiliates may from time to time provide investment banking or related services to these companies. Like all Houlihan Lokey employees, the authors of this presentation receive compensation that is affected by overall firm profitability.
21
Disclaimer

CORPORATE FINANCE
FINANCIAL RESTRUCTURINGFINANCIAL AND VALUATION ADVISORY
HL.com
Related Documents