CVD Risk Prediction: Basic Concepts, Current Status, and Future Directions Donald M. Lloyd-Jones MD ScM FACC FAHA Chair and Associate Professor Department of Preventive Medicine Director, Program in Risk Estimation, Communication and Prevention Medical Director, Clinical Trials Unit Bluhm Cardiovascular Institute, Dept. of Medicine Northwestern University Feinberg School of Medicine

CVD Risk Prediction: Basic Concepts, Current Status, and Future Directions Donald M. Lloyd-Jones MD ScM FACC FAHA Chair and Associate Professor Department.
Dec 18, 2015
Welcome message from author
This document is posted to help you gain knowledge. Please leave a comment to let me know what you think about it! Share it to your friends and learn new things together.
Transcript

CVD Risk Prediction: Basic Concepts, Current Status, and Future Directions
Donald M. Lloyd-Jones MD ScM FACC FAHAChair and Associate Professor
Department of Preventive Medicine Director, Program in Risk Estimation, Communication and
PreventionMedical Director, Clinical Trials Unit
Bluhm Cardiovascular Institute, Dept. of Medicine Northwestern University Feinberg School of Medicine

Disclosures
• None

Predicting the FuturePhilosophical Perspectives
• “Prediction is very difficult, especially about the future.” - Niels Bohr (Yogi Berra?)
• “There are many methods for predicting the future. For example, you can read horoscopes, tea leaves, tarot cards, or crystal balls. Collectively, these methods are known as ‘nutty methods.’ Or you can put well-researched facts into sophisticated computer models, more commonly referred to as ‘a complete waste of time.’” - Scott Adams (Dilbert)

Circulation 2010; 121; 1768-1777
April 20, 2010

Current Paradigm for Risk Estimation and Treatment: ATP-III
Estimate 10-year risk (FRS)
<10% >20% or DM10-20%
Further testing
Lifestyleand drug therapy
Lifestylemodification
“Intensity of prevention efforts should match the absolute risk of the patient”

Risk Factor Units Value Notes
Gender m
Age years 45
Total Cholesterol mg/dL 230
HDL mg/dL 40
Systolic Blood Pressure mmHg 135
Treatment for Hypertension {Only if SBP>120} yes (y) or no (n) n
Current Smoker yes (y) or no (n) n
Time Frame for Risk Estimate 10 years
Your Risk 5%
ATP-III Risk Estimator
Your Risk Estimate Comparative Risks for Lowest = Total Chol<160, HDL>60, Optimal SBP (<120), No Trt for Htn, Non-Smoker Same Age and Gender Low = Total Chol 160-199, HDL 50-59, Normal SBP (<130), No Trt for Htn, Non-Smoker
What doesWhat doesthis mean?this mean?

Hmmm….
• Seems unsatisfying
• But is it “wrong?”
• Can we do better?
• How do we know if we are doing better?

How Do We Measure the Performance of a Screening/Risk Prediction Test?
• NOT by anecdote
• NOR (solely) by independent RR
Circulation 2009

How Do We Measure the Performance of a Screening/Risk Prediction Test?
• We should use:– Sensitivity/specifity/predictive value– Discrimination
• Area under the ROC curve (AUC; C statistic)
– Calibration• Hosmer/Lemeshow and others
– Informativeness criteria• AIC, BIC
– Likelihood ratios (LR+ and LR-)– Reclassification (NRI, IDI)

NRI and IDI
• Net reclassification improvement (NRI)– Among those with events
No. moved up – No. moved down
Total number with events
– Among those without eventsNo. moved down – No. moved up
Total number without events
• Integrated Discrimination Index (IDI)– Represents difference in R2 between models– Also a good indicator of how far people move
}Sum = NRIRange -2 to +2

A Couple of Risk Scores to Help You Assess Risk in Your Patients
FRS 1991
FRS 1998
FRS/ATP-IIISCORE
QRISK
SCORE – S. Europe
SCORE – N. EuropeSCORE - Greece
ARIC Genetic RS
Reynolds for Women
Reynolds for Men
Cuore
FRS CVD 2008
PROCAM

Criticisms of Risk Scores
• “Risk scores don’t work, because they try to estimate risk for an individual based on average risk in a population”
• Uncertainty about performance
• Applicability to other race/ethnic groups
• Does not incorporate other/novel risk markers we might believe to be important
• Not useful for young adults, women

Area Under the Curve (AUC) or C Statistic for FRS
Study Design Sex AUC
Women’s Heath Prospective W 0.81
Rotterdam Study Nested C/C W/M 0.773
MONICA Germany Prospective M 0.735
Framingham Offspring Prospective W/M 0.74
Framingham Heart Prospective W/M 0.78
Cardiovascular Health Prospective W/M 0.73
Lloyd-Jones, Ann Intern Med 2006

Transportability of FRS
• D’Agostino et al, JAMA 2001– Well-calibrated and performed well in white and
black men and women– Ranked risk appropriately but consistently over-
estimated absolute risk in Puerto Rican, Japanese-American, Native American, and Chinese
– After recalibration to population CHD rates, performed very well
• Chambless et al, AJE 2003– Similar AUC and calibration for AA and whites in
ARIC

A Couple of Biomarkers to “Help” You Assess Risk in Your Patients
CRP
BNP
sICAM-1PAI-1/tPA
Lp-PLA2
CAC score
D-dimer
HcyE-selectin
Fibrinogen
Leptin
Microalbuminuria
IL-6
IL-18
Factor VIII
MMP-1
Lp(a)CMV Ab
WBC countHSV-1 Ab
C-IMT

Biomarkers and CHD PredictionARIC Study
Folsom AR, Archives 2006

0
5
10
15
20
25
0-1% 2-4% 5-9% >=10%
Mu
ltiv
aria
ble
RR
fo
r C
VD
Framingham Estimated 10-Year CHD Risk
CRP<1.01.0-3.0>3.0
Does CRP Add to Risk Prediction?
Ridker, NEJM 2002
AUC – CRP: 0.81AUC + CRP: 0.81

Multimarkers and CHD Prediction Cardiovascular Health Study
Shlipak, M. G. et al. JAMA 2005;293:1737-1745.
Traditional: Smoking, DM, Sys HTN, LVH, Low PA, EtOHNovel: IL-6, CRP, Fn, Lp(a), Anemia, FVIII
AUC-: 0.73AUC+: 0.72
AUC-: 0.73AUC+: 0.74
No CKD CKD

Paynter et al. JAMA 2010; 303: 631
• 19,303 women from the WHS followed for median >12 years
• 101 SNPs from literature associated with CVD or intermediate phenotypes (12 with CVD)
• Created a genetic risk score based on number of risk alleles; Range: 73-125 (4-19)
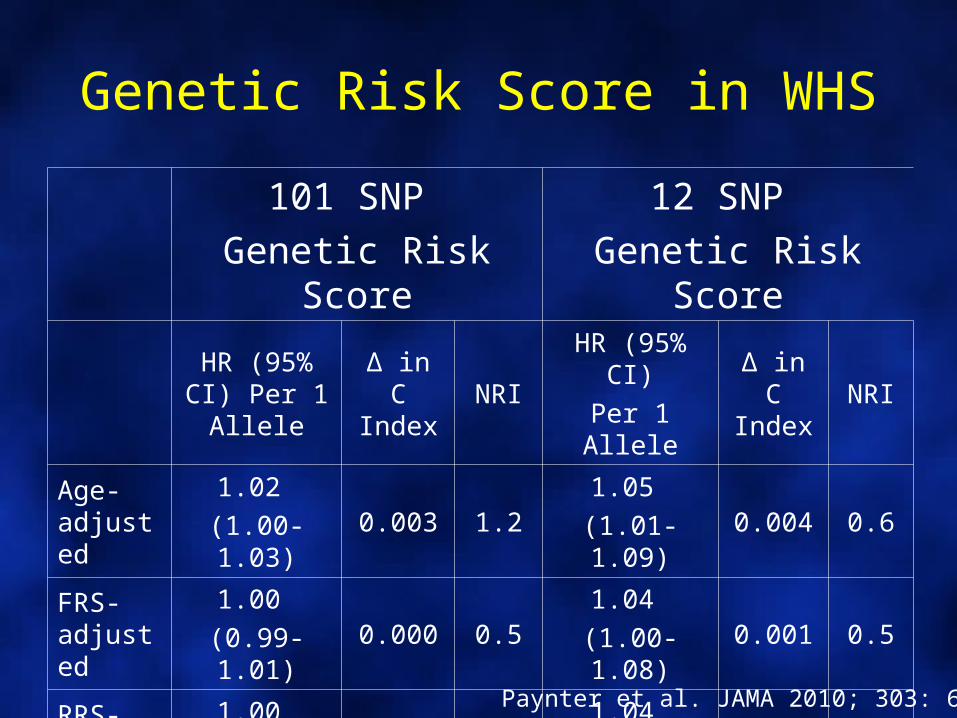
Genetic Risk Score in WHS
101 SNP
Genetic Risk Score
12 SNP
Genetic Risk Score
HR (95% CI) Per 1 Allele
Δ in C Index
NRIHR (95% CI)
Per 1 AlleleΔ in C Index
NRI
Age-adjusted
1.02
(1.00-1.03)0.003 1.2
1.05
(1.01-1.09)0.004 0.6
FRS-adjusted
1.00
(0.99-1.01)0.000 0.5
1.04
(1.00-1.08)0.001 0.5
RRS-adjusted
1.00
(0.99-1.01)0.000 0.4
1.04
(1.00-1.07)0.000 0.8
Paynter et al. JAMA 2010; 303: 631

Screening for Coronary Calcium
RF-Adj HR
6.84
7.083.89
1.0 (ref)
MESA Study (Detrano, NEJM 2008)
C statisticsTraditional RFs: 0.79Plus CAC: 0.83

JAMA 2010; 303: 1610-1616
April 28, 2010
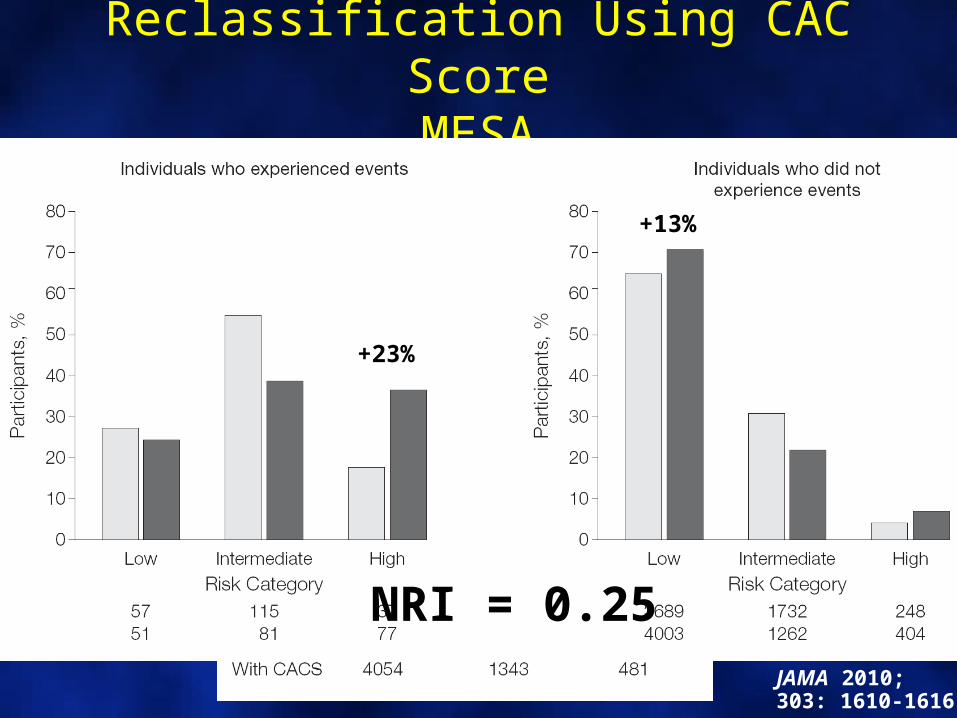
Reclassification Using CAC ScoreMESA
JAMA 2010; 303: 1610-1616
+23%
+13%
NRI = 0.25

C-IMT, Plaque and CHD Events
• 13,145 asx ppts in the ARIC Study– Mean age 54 y– 25% African-American
• Used ARIC-based traditional RF score to estimate 10-y risk for CHD (incl. revasc)
• Added C-IMT +/- plaque
• 1812 CHD events over 15 y
Nambi et al, JACC 2010; 55: 1600
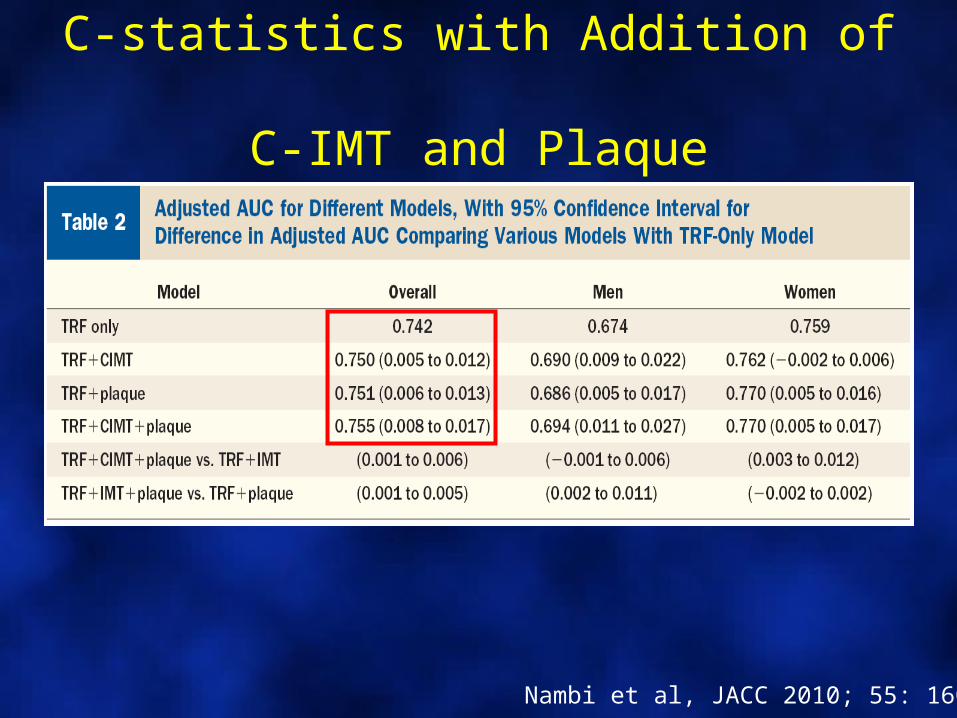
C-statistics with Addition of C-IMT and Plaque
Nambi et al, JACC 2010; 55: 1600

Reclassification with Addition of C-IMT and Plaque
Nambi et al, JACC 2010; 55: 1600
Reclassified 23% (8.6%, 37.5%, 38.3% and 21.5%)NRI 0.099 [0.217 in intermediate]/ IDI 0.011

Summary• Existing biomarkers for clinical prediction
– Used in isolation are ineffective– Used in the context of 10 year risk estimation equations that
contain age and established, causal and treatable/modifiable risk factors, are very unlikely to lead us to the promised land of perfect discrimination or substantial reclassification
– Also misclassify people, leading to inappropriate down-staging of risk
– Might be useful as niche tests in sequential testing schemes for patients on the fence
• Disease screening appears promising, but requires more study for optimal implementation in a cost-effective and safe manner

Can longer-term risk estimatesprovide a useful adjunct to
10-year risk estimates?
0
5
10
15
20
25
30
Total cholesterol (mg/dL)160200240160200240
2535
45HDL-c
(mg/dL)Pre
dic
ted
10-
Yea
r R
isk
(%)
Smoker Non-smoker
SBP 130 mm Hg
0
5
10
15
20
25
30
Total cholesterol (mg/dL)160200240160200240
2535
45HDL-c
(mg/dL)Pre
dic
ted
10-
Yea
r R
isk
(%)
Smoker Non-smoker
SBP 150 mm Hg
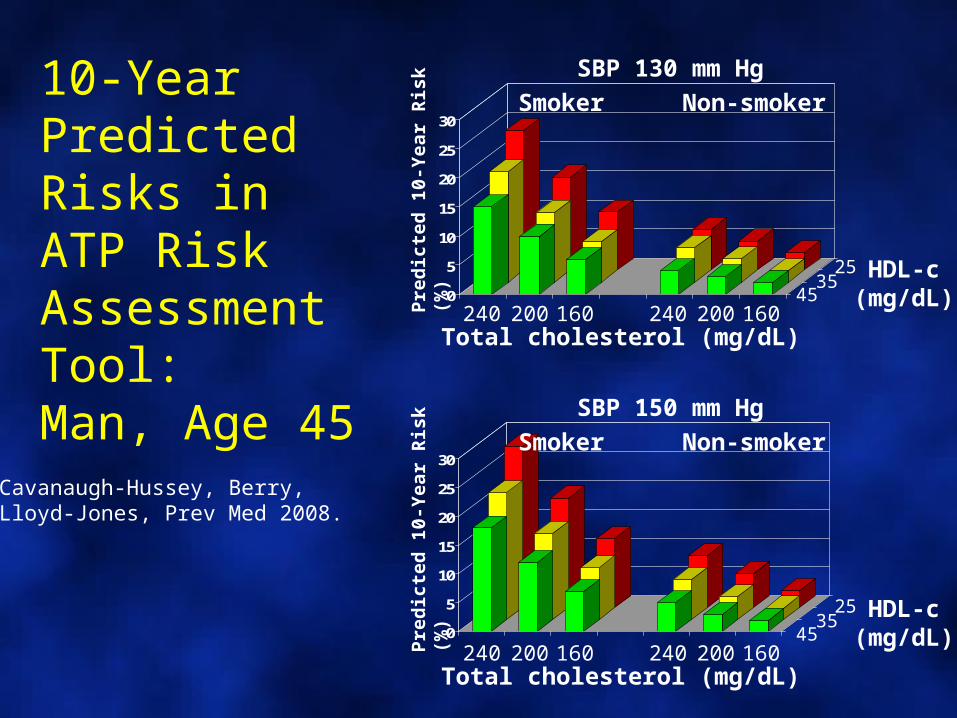
10-Year Predicted Risks in ATP Risk Assessment Tool:Man, Age 45
Cavanaugh-Hussey, Berry,Lloyd-Jones, Prev Med 2008.

0
5
10
15
20
25
30
Total cholesterol (mg/dL)160200240160200240
3545
55HDL-c
(mg/dL)Pre
dic
ted
10-
Yea
r R
isk
(%)
Smoker Non-smoker
SBP 150 mm Hg
0
5
10
15
20
25
30
Total cholesterol (mg/dL)160200240160200240
3545
55HDL-c
(mg/dL)Pre
dic
ted
10-
Yea
r R
isk
(%)
Smoker Non-smoker
SBP 130 mm Hg10-Year Predicted Risks in ATP Risk Assessment Tool:Woman, Age 55
Cavanaugh-Hussey, Berry,Lloyd-Jones, Prev Med 2008.

Implications
• Vast majority of younger adults are considered to be at “low risk”
– Weight of age – 10-year risk window– Clinical treatment thresholds imposed
• BUT low risk ≠ “no risk”• Additional means for risk estimation and
communication needed to help men age <45 and women age <65
– Importance of addressing multiple moderate or single elevated risk factors for long-term CHD prevention

Rationale: Lifetime Risk Estimation
• Lifetime risk– The absolute cumulative risk of an individual
developing a given disease before death– Accounts for risk of disease of interest,
remaining life expectancy, and competing causes of death
– Reflects real-life risks better than Kaplan-Meier cumulative incidence

All Optimal
Not Optimal
Elevated
SBP/
DBP<120 and
<80120-139 or
80-89
140-159 or
90-99
≥160 or
≥100
TC <180 180-199 200-239 ≥240
DM No No No Yes
Smoking No No No Yes
Aggregate Risk Factor Burden
Lloyd-Jones, Circulation 2006; 113: 791-798
1 Major
≥2 Major

Lifetime Risk for ASCVD by RF Strata Framingham Heart Study, Age 50
0
0.1
0.2
0.3
0.4
0.5
0.6
0.7
50 60 70 80 900
0.1
0.2
0.3
0.4
0.5
0.6
0.7
50 60 70 80 90Attained Age
Ad
just
ed C
um
ula
tive
In
cid
ence
5%
36%
50%
69%
8%
27%
50%
Men Women
46%
39%
Lloyd-Jones, Circulation 2006
2 Major RFs1 Major RF1 Elevated RF1 Not Optimal RFOptimal RFs

0
2
4
6
8
10
12
14
16
18
20
20-29 30-39 40-49 50-59 60-79
Distributions of 10-Year and Lifetime Risk Strata by Age and Sex
US Adults, NHANES 2003-2006
0
2
4
6
8
10
12
14
16
18
20
20-29 30-39 40-49 50-59 60-79
Marma, Circ CQO 2010Age
Ind
ivid
ual
s (m
illio
ns)
High 10Low 10/High LifeLow 10/Low Life
Men Women
56% (87,000,000) have low short-term
but high lifetime predicted risk

A New Risk Estimator?Risk for Endpoint
Risk Factor Units Value Endpoint 10-Year Lifetime
Gender M or F M
Age years 45
Total Cholesterol mg/dL 230
HDL-Cholesterol mg/dL 40
Systolic Blood Pressure mm Hg 135
Treatment for Hypertension (if SBP >120) Y or N N
Current Smoker Y or N N

A New Risk Estimator?Risk for Endpoint
Risk Factor Units Value Endpoint 10-Year Lifetime
Gender M or F M Hard CHD 1.4% 42%
Age years 45
Total Cholesterol mg/dL 230 F/NF Stroke 0.2% 21%
HDL-Cholesterol mg/dL 40
Systolic Blood Pressure mm Hg 135
Total ASCVD
1.5% 46%
Treatment for Hypertension (if SBP >120) Y or N N
Vascular Age 54
Current Smoker Y or N N
Estimated Life-Years Lost
>10

The Future of Risk Prediction as a Strategy for CVD Prevention
• We need to understand – How well this approach works in clinical practice– How to improve adoption– How to optimize utilization
• Consider– Expanding endpoint to include all major CVD
endpoints (helps women)– Age-specific risk equations (but tough)– Long-term and lifetime risk estimation as an adjunct to
10-year risk
Related Documents