Cut Scores, Student Growth and College/Career Readiness: 2011-2012 Data Dialogues Stan Masters Lenawee ISD January 17, 2012

Cut Scores, Student Growth and College/Career Readiness: 2011-2012 Data Dialogues Stan Masters Lenawee ISD January 17, 2012.
Dec 27, 2015
Welcome message from author
This document is posted to help you gain knowledge. Please leave a comment to let me know what you think about it! Share it to your friends and learn new things together.
Transcript
Cut Scores, Student Growth and College/Career Readiness: 2011-2012 Data Dialogues
Stan MastersLenawee ISD
January 17, 2012
• Data Dialogues around “hot topics” for 2011-2012 are occurring in Lenawee County.
• Using data stored in DataDirector provides ways to create reports that can be used in these dialogues.
• Participants will learn about using data to have conversations that deepen understanding of these "hot topics."
• Participants should bring their username and password for DataDirector.
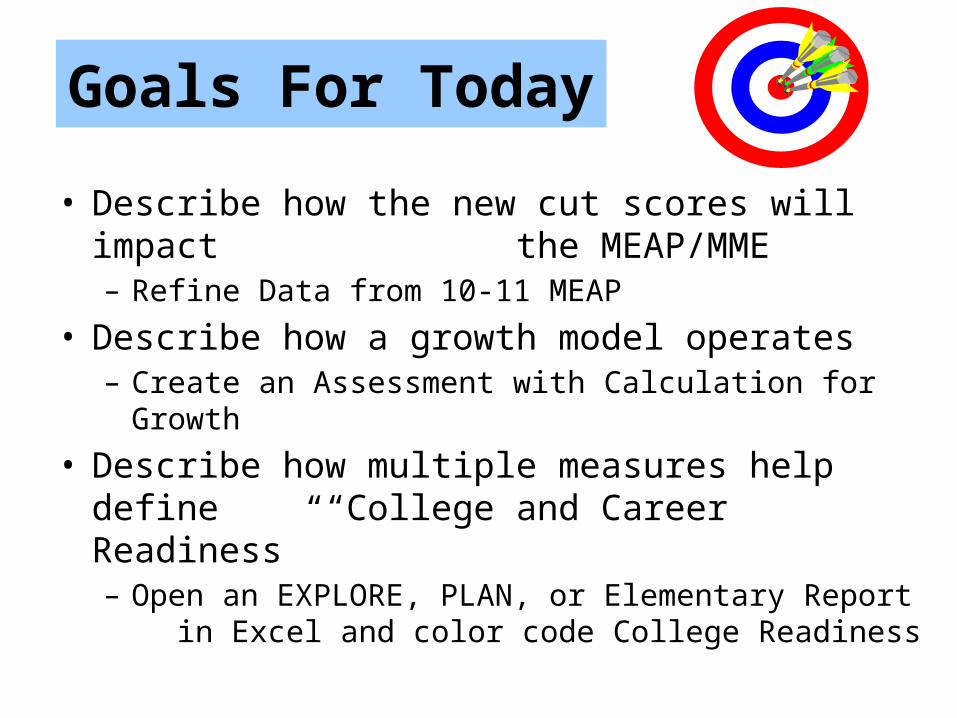
Goals For Today
• Describe how the new cut scores will impact the MEAP/MME– Refine Data from 10-11 MEAP
• Describe how a growth model operates – Create an Assessment with Calculation for Growth
• Describe how multiple measures help define “College and Career Readiness” – Open an EXPLORE, PLAN, or Elementary Report
in Excel and color code College Readiness
Norms for Our Work
• Participate actively• Actively listen• Seek application• Press for clarification• Honor time agreements and confidentiality• Keep ‘side bars’ to a minimum and on topic• Take care of adult learning needs
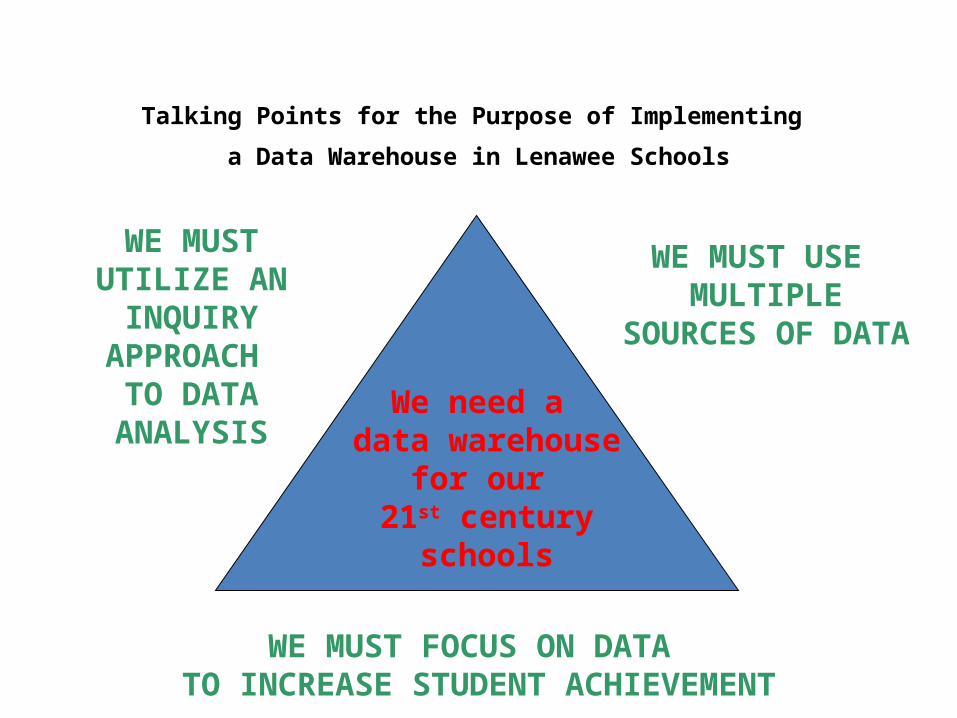
WE MUST UTILIZE AN INQUIRY APPROACH
TO DATA ANALYSIS
WE MUST USE MULTIPLE SOURCES
OF DATA
We need a data warehouse
for our 21st century schools
WE MUST FOCUS ON DATA TO INCREASE STUDENT ACHIEVEMENT
Talking Points for the Purpose of Implementing
a Data Warehouse in Lenawee Schools
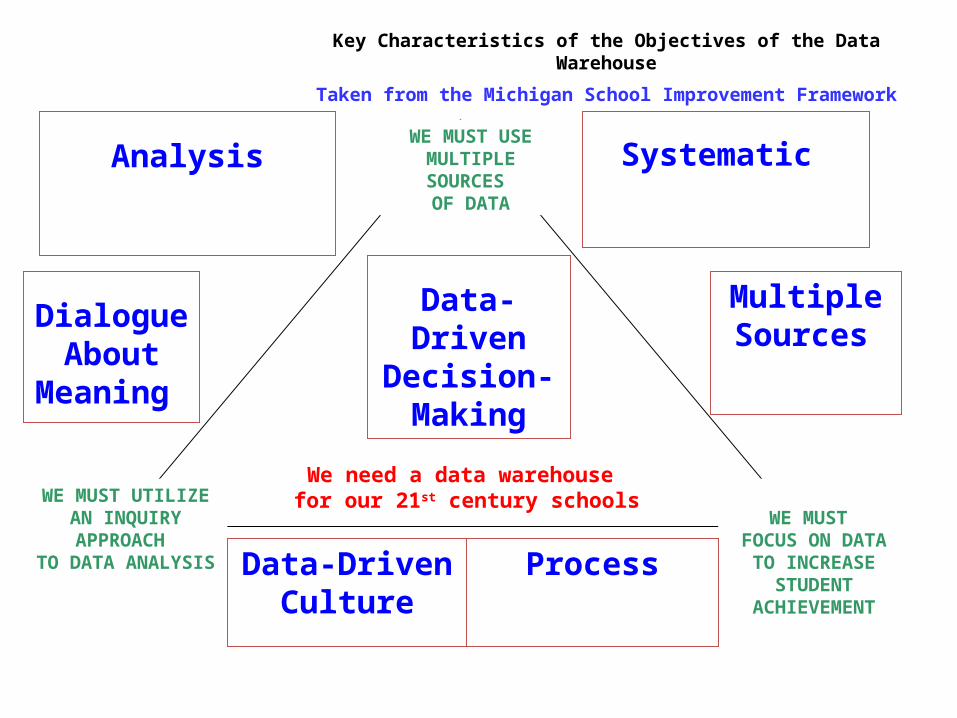
Dialogue About
Meaning
Systematic
Multiple Sources
Analysis
WE MUST UTILIZE AN INQUIRY APPROACH
TO DATA ANALYSIS
WE MUST USE MULTIPLE SOURCES
OF DATA
We need a data warehouse for our 21st century schools
WE MUST FOCUS ON DATA TO INCREASE STUDENT
ACHIEVEMENTData-Driven
CultureProcess
Data-DrivenDecision-Making
Key Characteristics of the Objectives of the Data Warehouse
Taken from the Michigan School Improvement Framework
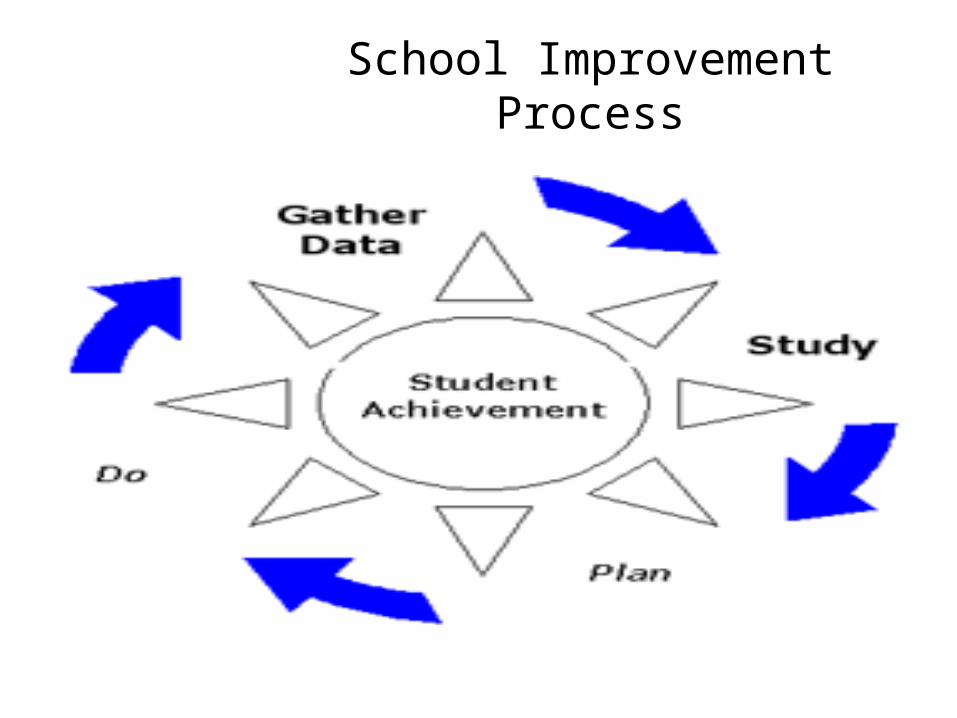
School Improvement Process
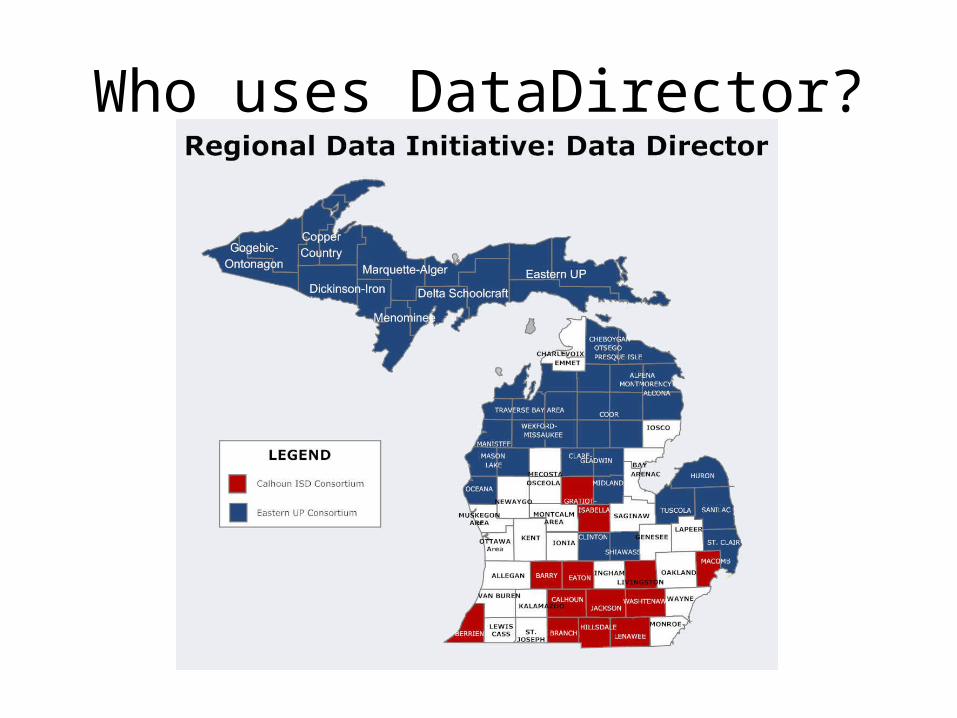
Who uses DataDirector?
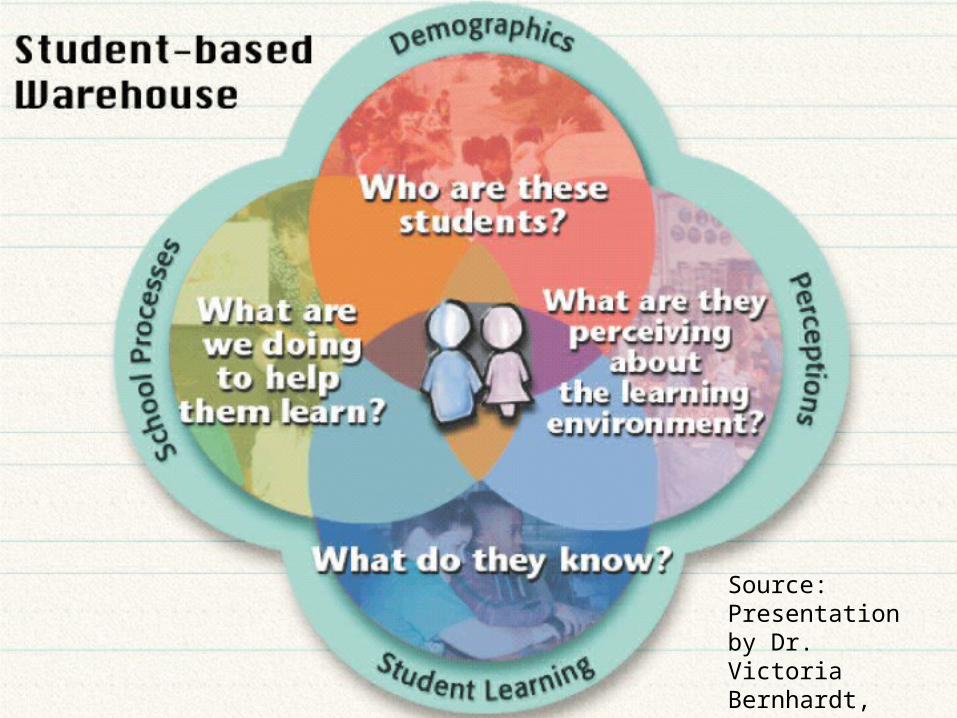
Source: Presentation by Dr. Victoria Bernhardt, April 2007
LISD Data DirectorStan MastersCoordinator of
Instructional Data Services
• “Data out”• Creation and analysis of
data-driven reports
Mike HusbandData Entry Specialist
• “Data in”• Organization of data to
add to the warehouse
FERPA/HIPAA Pre-Test
To be considered an “education record,” information must be maintained in the student’s cumulative or permanent folder.
• False, because any record that has a student name is an educational record.
FERPA/HIPAA Pre-Test
FERPA grants parents the right to have a copy of any education record.
• True
FERPA/HIPAA Pre-Test
You are in charge of a staff meeting to study student achievement on school improvement goals. As part of your meeting, you are showing a report to the entire staff that shows student scores on a common local assessment. The report shows the student names. In addition, you have given them a paper copy of the report.
It is a violation of FERPA to display the results of the assessment to the entire staff.
The exception would be a group of teachers working on a specific student strategies, as they are a specific population that then has a “legitimate educational interest” in the information.
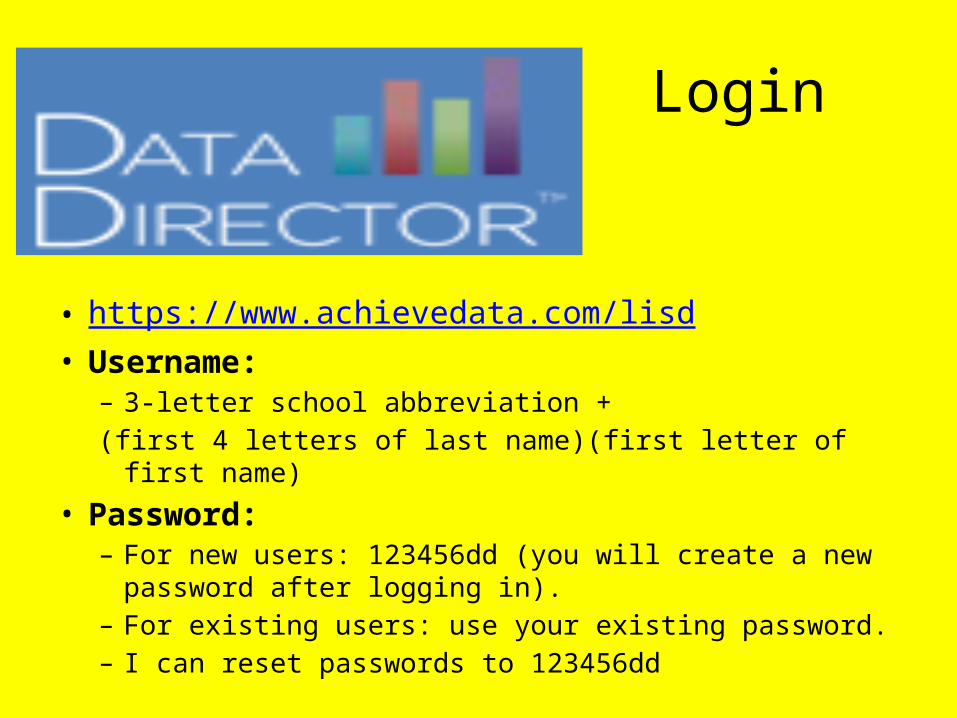
Login
• https://www.achievedata.com/lisd• Username:
– 3-letter school abbreviation +(first 4 letters of last name)(first letter of first name)
• Password: – For new users: 123456dd (you will create a new password
after logging in). – For existing users: use your existing password.– I can reset passwords to 123456dd
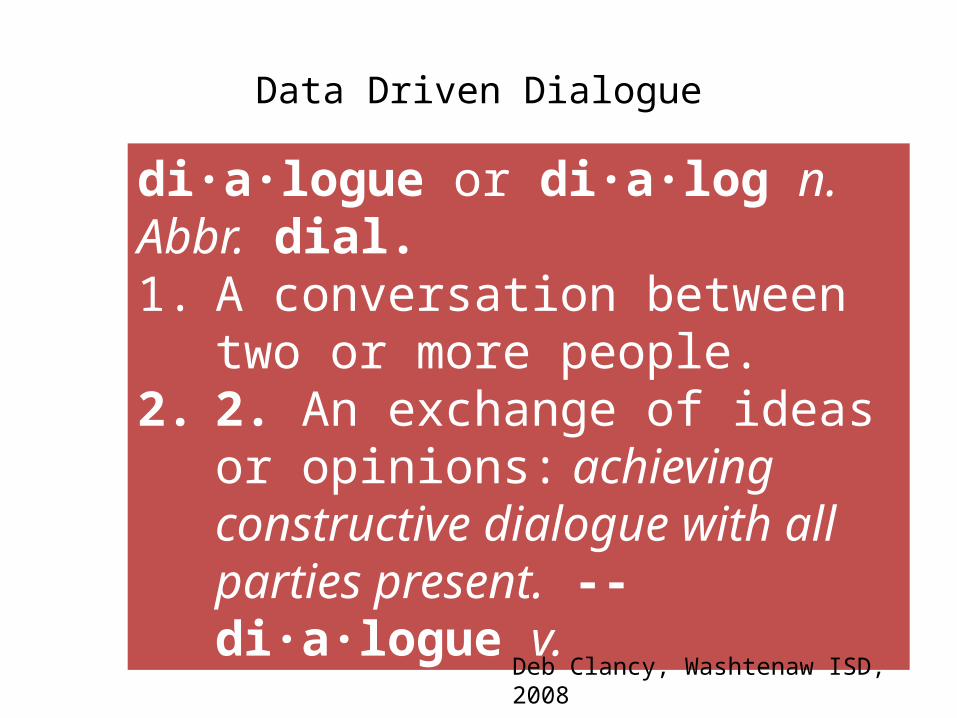
Data Driven Dialogue
di·a·logue or di·a·log n. Abbr. dial. 1. A conversation between two or
more people. 2. 2. An exchange of ideas or
opinions: achieving constructive dialogue with all parties present. --di·a·logue v.
Deb Clancy, Washtenaw ISD, 2008
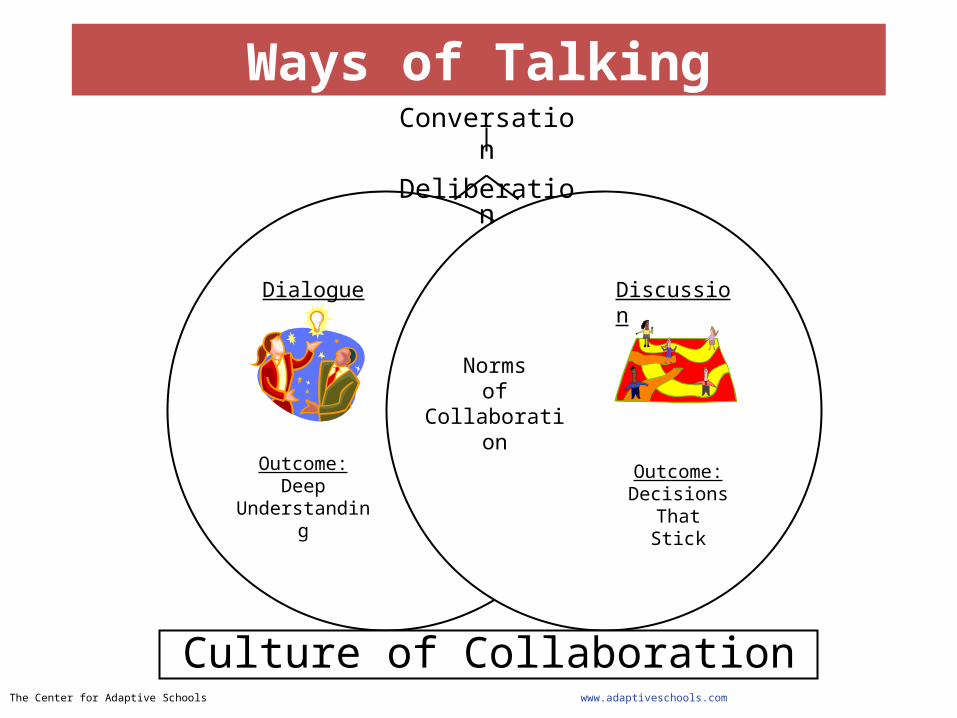
Ways of Talking
Normsof
Collaboration
Dialogue Discussion
Outcome:Deep
Understanding
Outcome:DecisionsThat Stick
Culture of Collaboration
Conversation
Deliberation
The Center for Adaptive Schools www.adaptiveschools.com
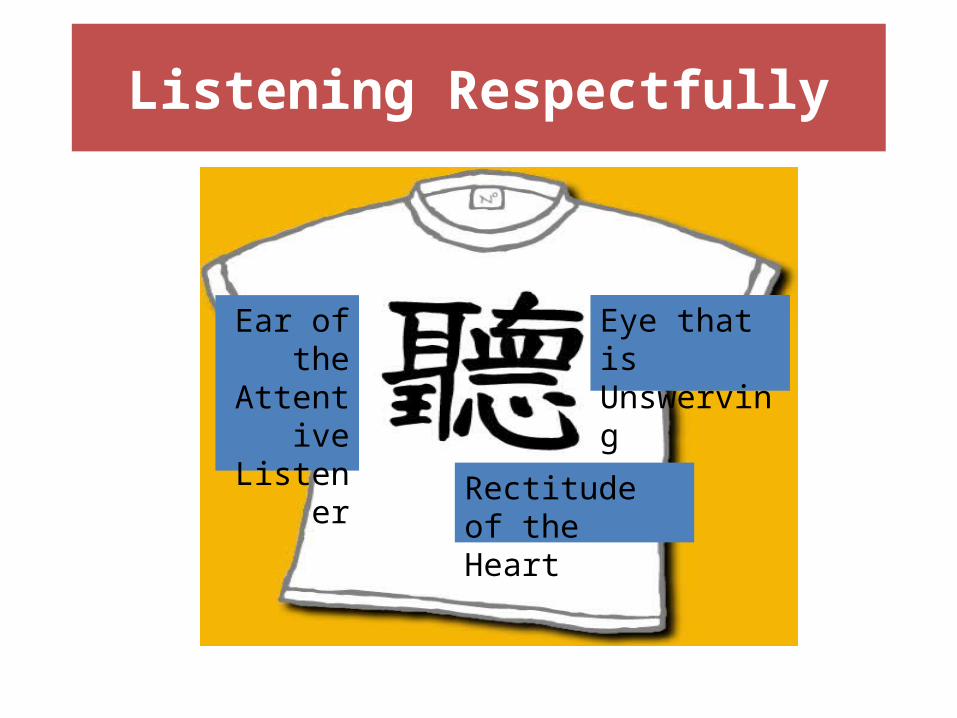
Listening Respectfully
Ear of the
Attentive
Listener
Rectitude of the Heart
Eye that is Unswerving
What do you need to monitor?
• Progress on school improvement goals• Tracking individual student progress• Prioritize key indicators• Support teaching and learning
Source: “Developing a Monitoring Plan”. Maryland Department of Education. Accessed May 25, 2010 from http://mdk12.org/data/progress/developing.html
How do you develop a monitoring plan?
• Identify specific learning indicators• Create data collection templates• Schedule assessment calendar
– collaborative collection and analysis
Source: “Developing a Monitoring Plan”. Maryland Department of Education. Accessed May 25, 2010 from http://mdk12.org/data/progress/developing.html
Video Source: Reeves, D. (2009). “Planning for the New Year”. Accessed May 25, 2010 from http://www.leadandlearn.com/webinars
Cut Scores
Old Cut Scores
• Scaled Scores represent the stable score on the assessment that is reported for each student.
• Floor of “Meets” performance level was calculated as (Grade level X 100)
3rd grade “Meets” = 3 X 100 = 300
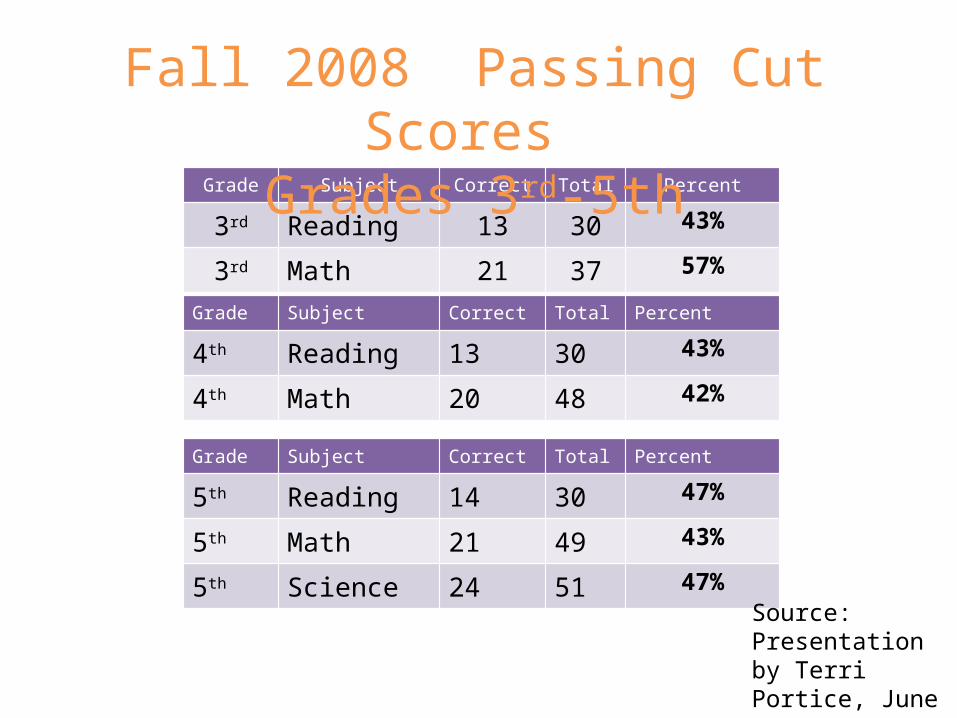
Grade Subject Correct Total Percent
3rd Reading 13 30 43%
3rd Math 21 37 57%
Fall 2008 Passing Cut Scores Grades 3rd-5th
Grade Subject Correct Total Percent
4th Reading 13 30 43%
4th Math 20 48 42%
Grade Subject Correct Total Percent
5th Reading 14 30 47%
5th Math 21 49 43%
5th Science 24 51 47%
Source: Presentation by Terri Portice, June 29, 2009
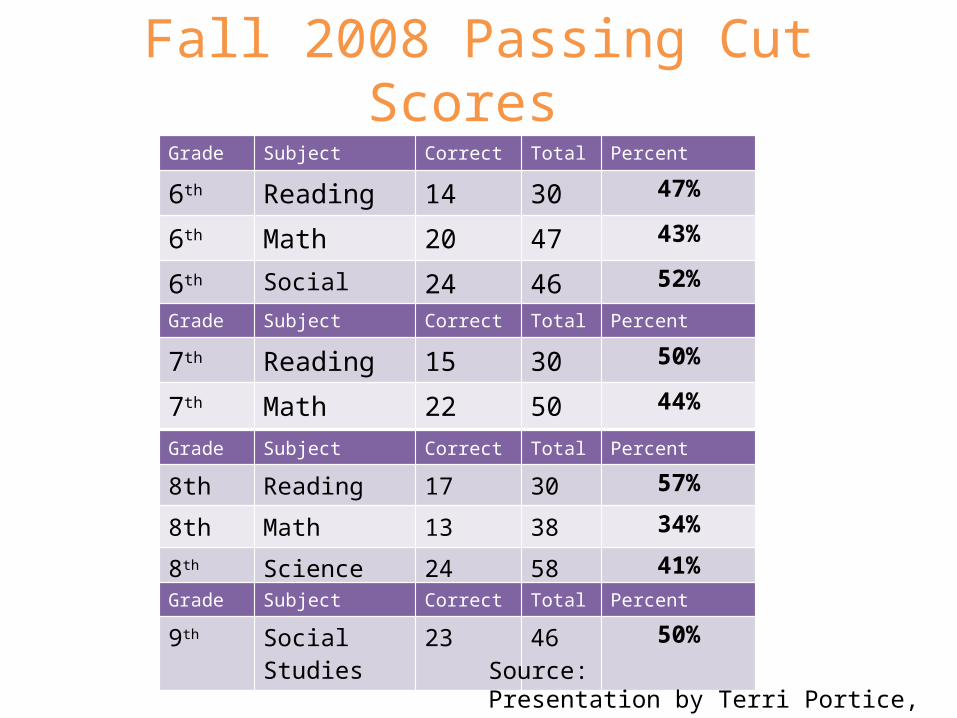
Fall 2008 Passing Cut Scores Grades 6th – 9th
Grade Subject Correct Total Percent
6th Reading 14 30 47%
6th Math 20 47 43%
6th Social Studies 24 46 52%
Grade Subject Correct Total Percent
7th Reading 15 30 50%
7th Math 22 50 44%
Grade Subject Correct Total Percent
8th Reading 17 30 57%
8th Math 13 38 34%
8th Science 24 58 41%
Grade Subject Correct Total Percent
9th Social Studies 23 46 50%
Source: Presentation by Terri Portice, June 29, 2009
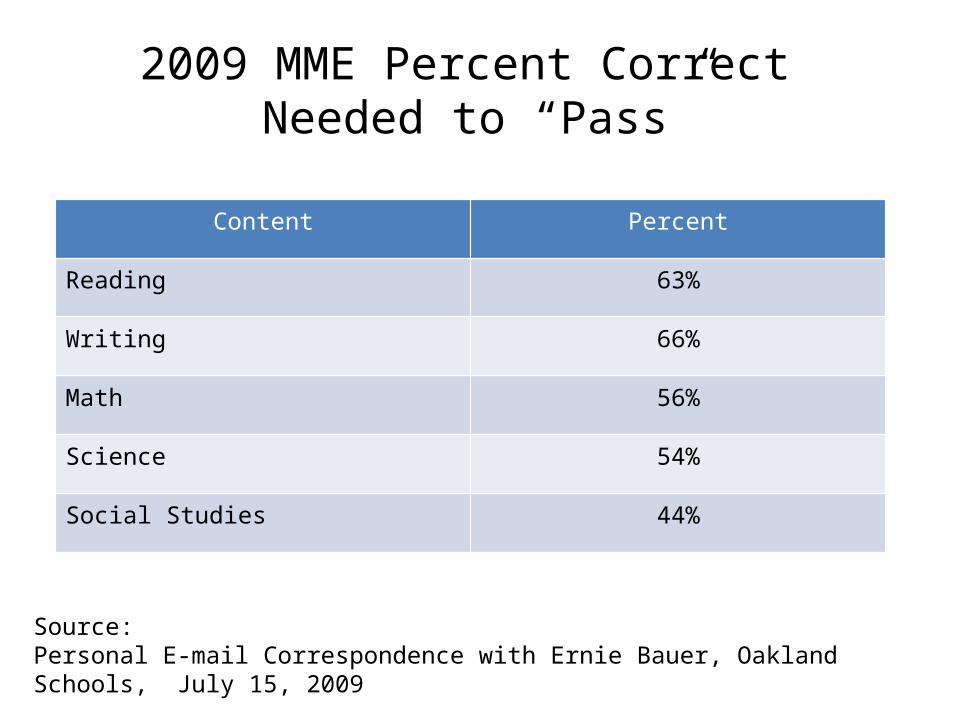
2009 MME Percent Correct Needed to “Pass”
Content Percent
Reading 63%
Writing 66%
Math 56%
Science 54%
Social Studies 44%
Source: Personal E-mail Correspondence with Ernie Bauer, Oakland Schools, July 15, 2009
Change in Cut Scores for MEAP and MME
Comparing “Old” vs “New”Using Fall 2010 and Spring 2011 data
Michigan and Lenawee

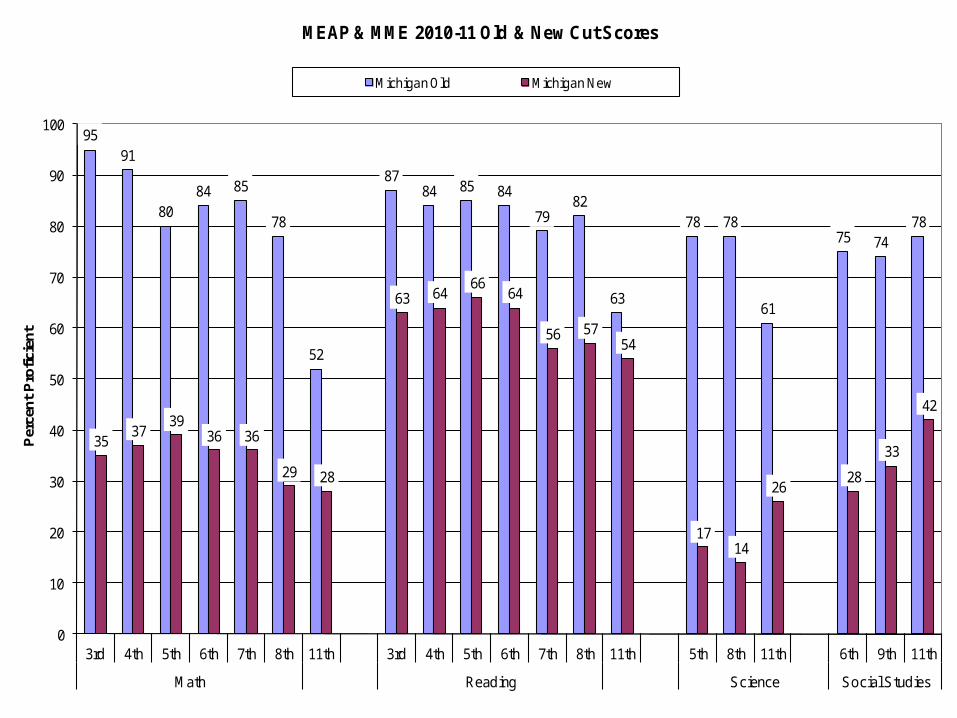
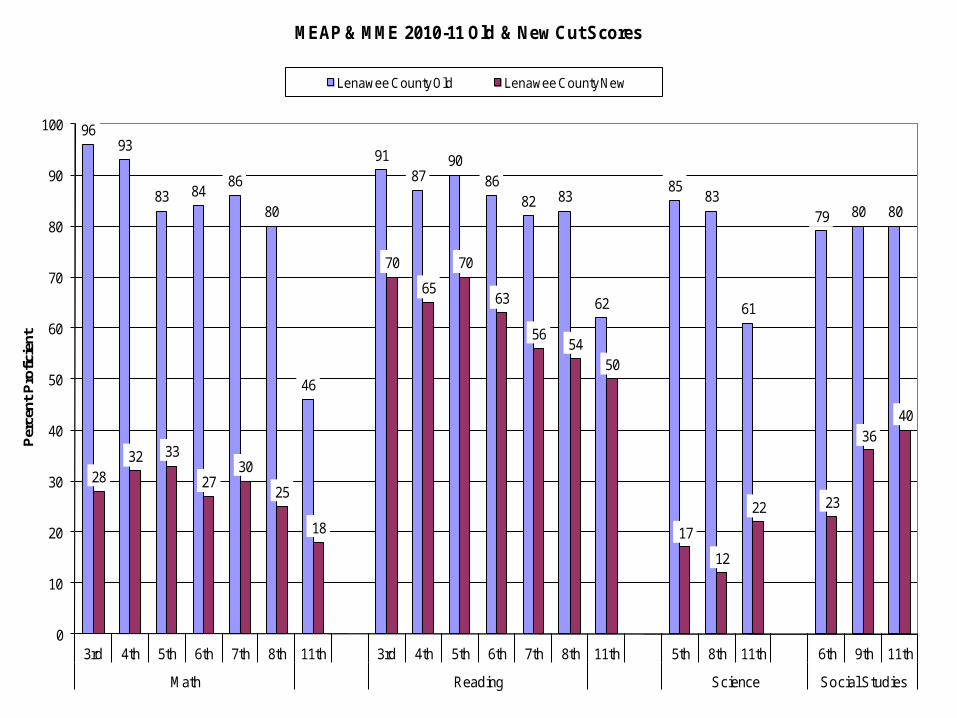
• Open MEAP or MME Percent Proficient Report• Click on Percentage of Students Proficient• Make This a Report• Refine the data to Reflect the New Cut Scores
Predictions Observations Inferences I predict . . . I can count . . . I believe that the
data suggests . . . because, …
9591
8084 85
78
52
8784 85 84
7982
63
78 78
61
75 7478
3537
3936 36
29 28
63 6466
64
56 5754
1714
2628
33
42
0
10
20
30
40
50
60
70
80
90
100
3rd 4th 5th 6th 7th 8th 11th 3rd 4th 5th 6th 7th 8th 11th 5th 8th 11th 6th 9th 11th
Math Reading Science Social Studies
Per
cen
t P
rofi
cien
tMEAP & MME 2010-11 Old & New Cut Scores
Michigan Old Michigan New
9693
83 8486
80
46
9187
9086
82 83
62
8583
61
79 80 80
2832 33
2730
25
18
70
65
70
63
5654
50
17
12
22 23
3640
0
10
20
30
40
50
60
70
80
90
100
3rd 4th 5th 6th 7th 8th 11th 3rd 4th 5th 6th 7th 8th 11th 5th 8th 11th 6th 9th 11th
Math Reading Science Social Studies
Per
cent
Pro
ficie
ntMEAP & MME 2010-11 Old & New Cut Scores
Lenawee County Old Lenawee County New
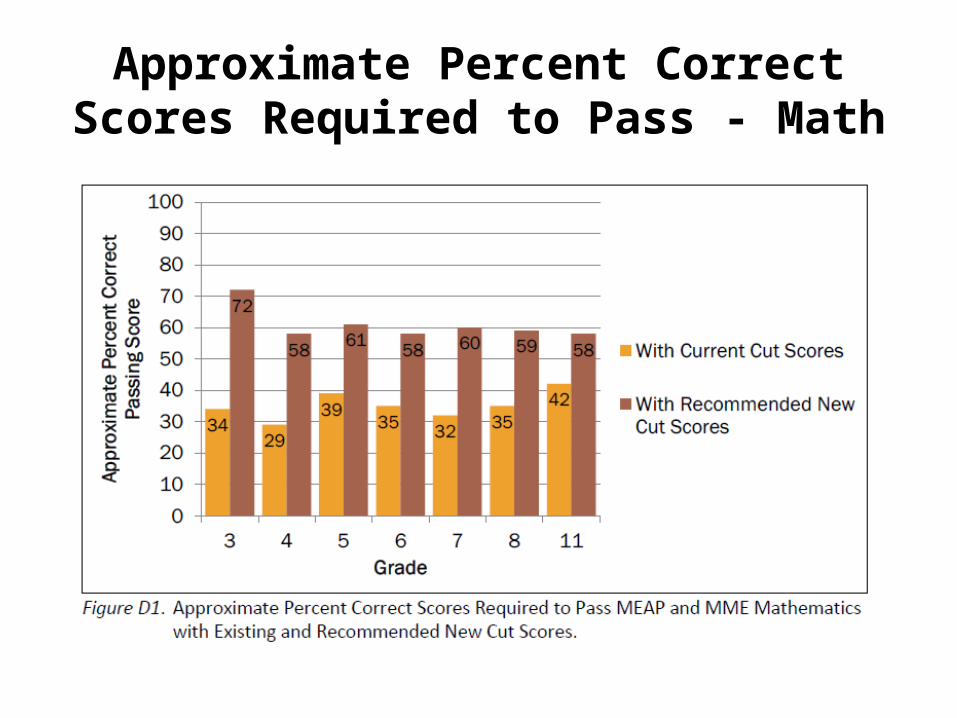
Approximate Percent Correct Scores Required to Pass - Math
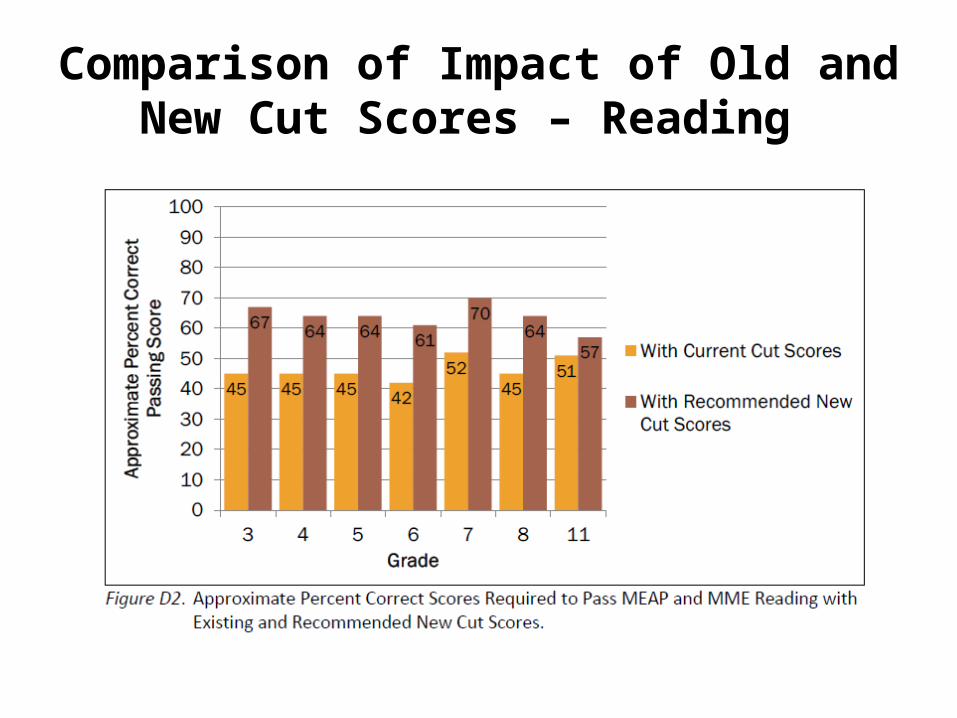
Comparison of Impact of Old and New Cut Scores – Reading
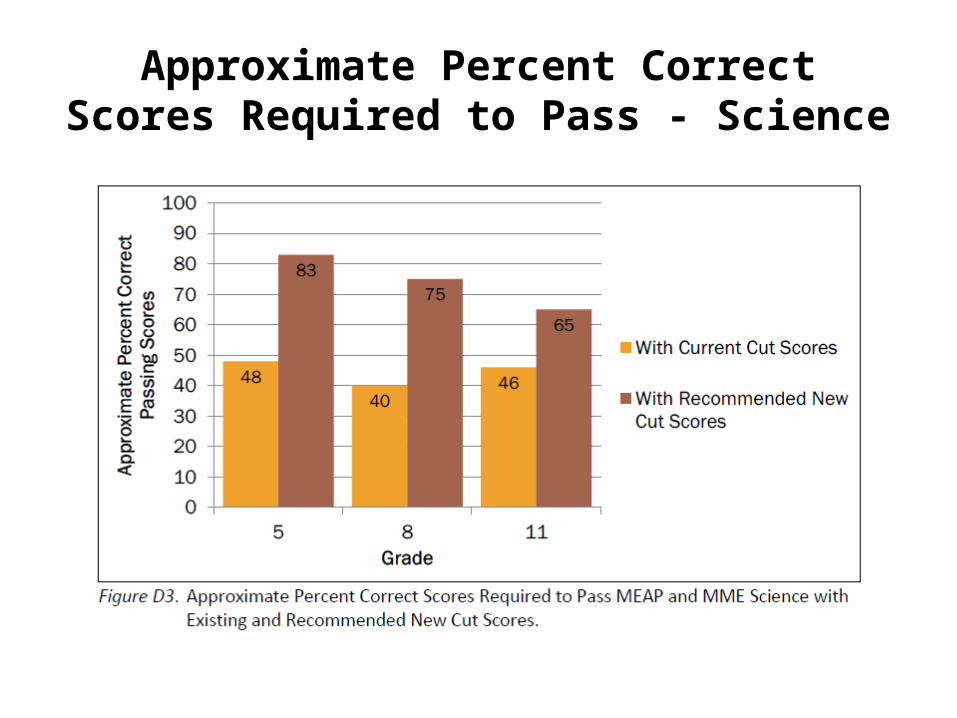
Approximate Percent Correct Scores Required to Pass - Science
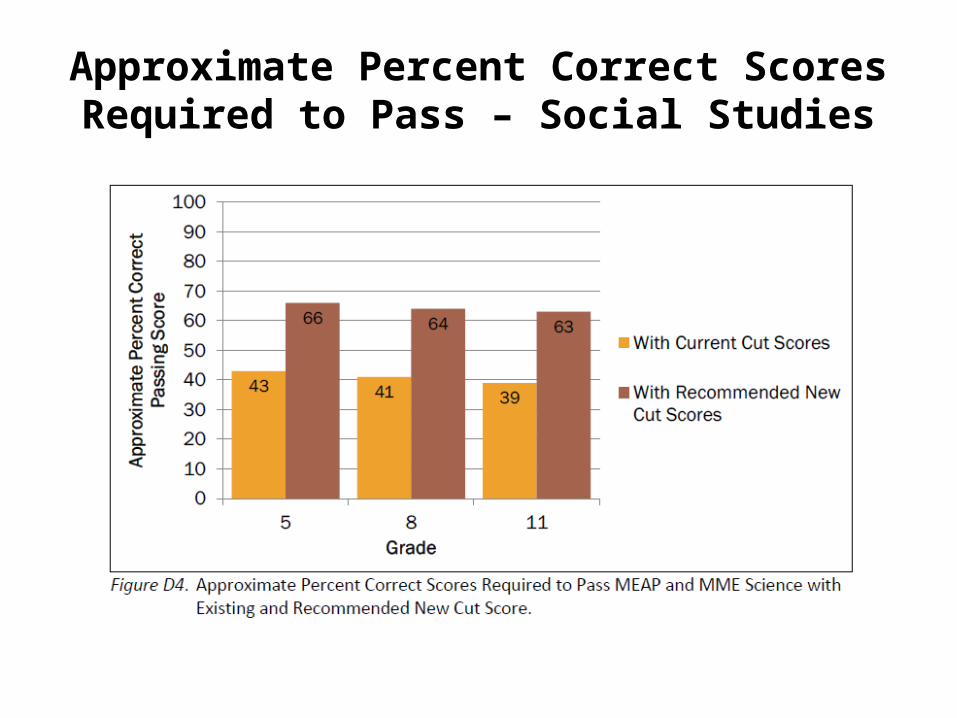
Approximate Percent Correct Scores Required to Pass – Social Studies

Growth Models
37
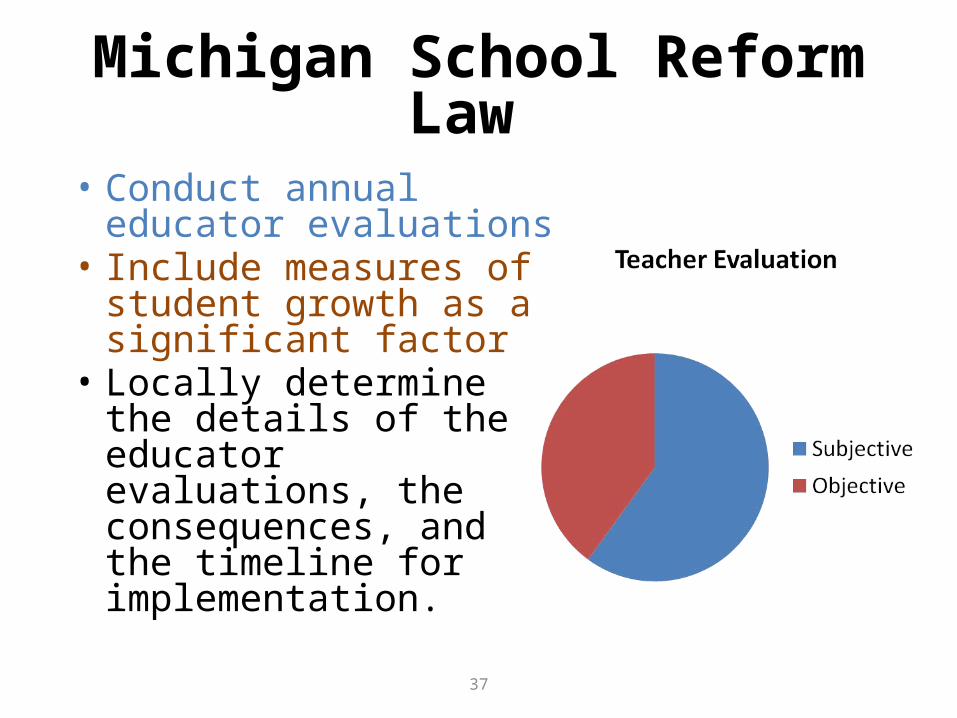
Michigan School Reform Law
• Conduct annual educator evaluations
• Include measures of student growth as a significant factor
• Locally determine the details of the educator evaluations, the consequences, and the timeline for implementation.
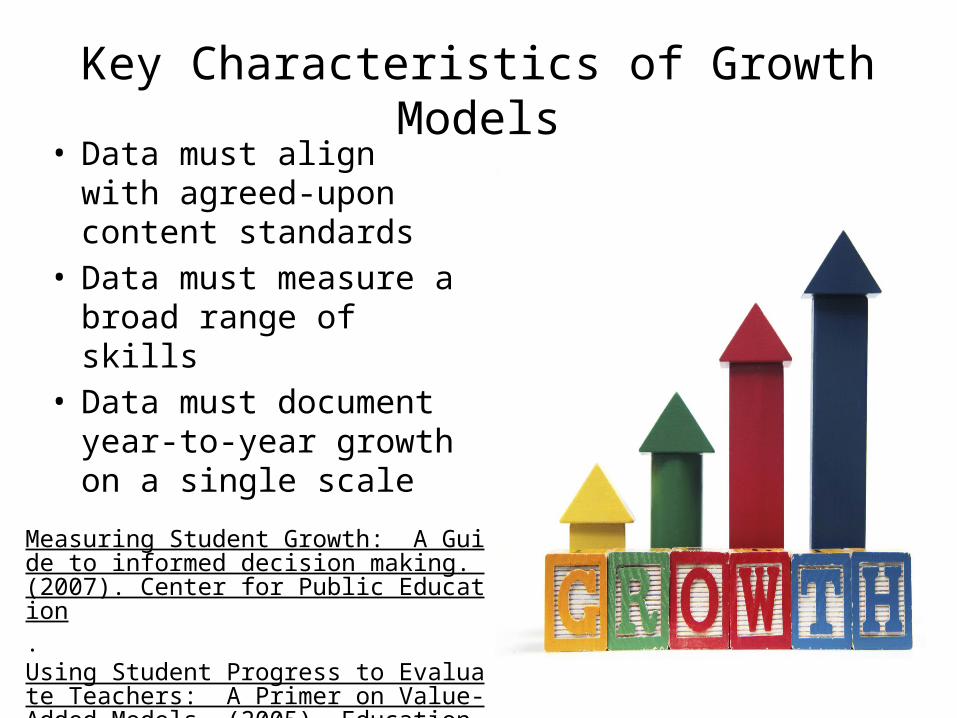
Key Characteristics of Growth Models• Data must align with
agreed-upon content standards
• Data must measure a broad range of skills
• Data must document year-to-year growth on a single scale
Measuring Student Growth: A Guide to informed decision making. (2007). Center for Public Education.Using Student Progress to Evaluate Teachers: A Primer on Value-Added Models. (2005). Education Testing Service.
Growth Models
• Improvement Model• Performance Index• Simple Growth• Growth to Proficiency• Value-Added
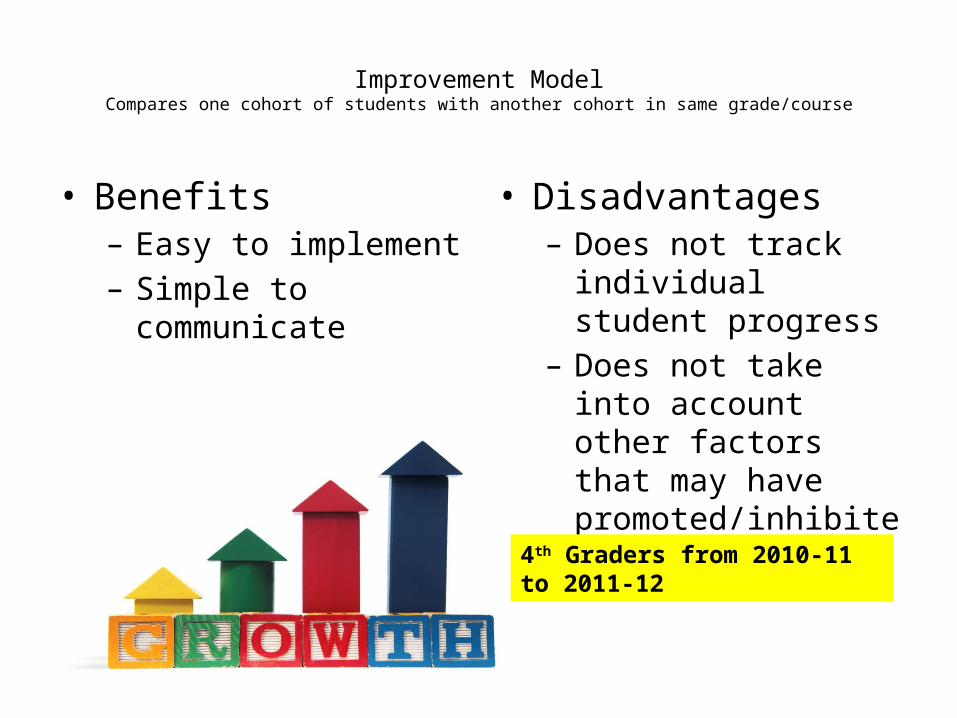
Improvement ModelCompares one cohort of students with another cohort in same grade/course
• Benefits– Easy to implement– Simple to communicate
• Disadvantages– Does not track individual
student progress– Does not take into
account other factors that may have promoted/inhibited growth
4th Graders from 2010-11 to 2011-12
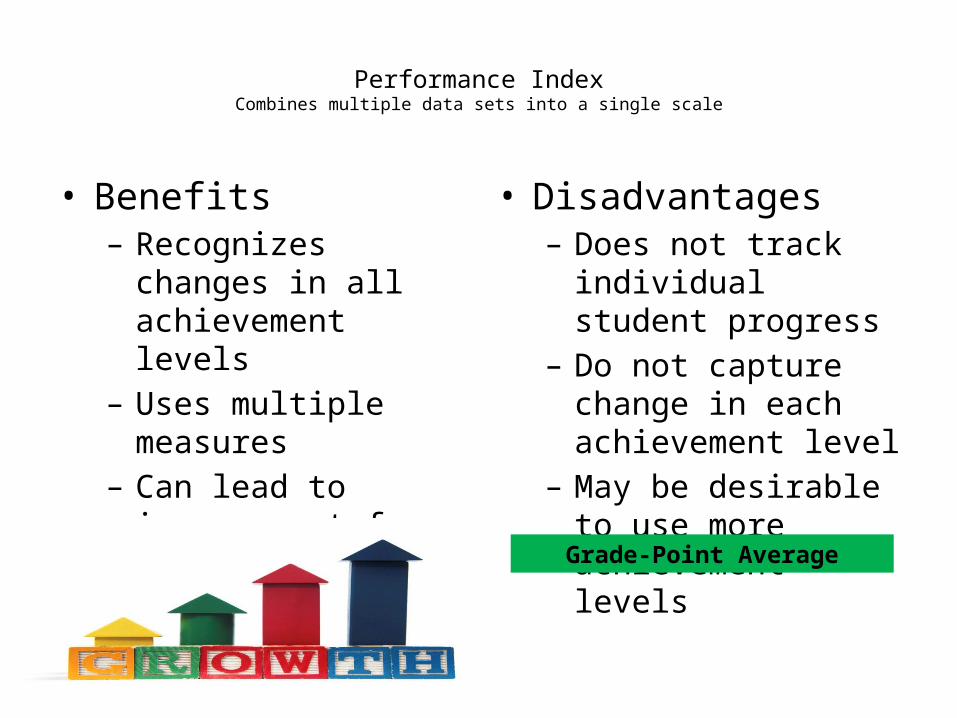
Performance IndexCombines multiple data sets into a single scale
• Benefits– Recognizes changes in all
achievement levels– Uses multiple measures– Can lead to
improvement for all students, not just “bubble” students
• Disadvantages– Does not track individual
student progress– Do not capture change in
each achievement level– May be desirable to use
more achievement levels
Grade-Point Average
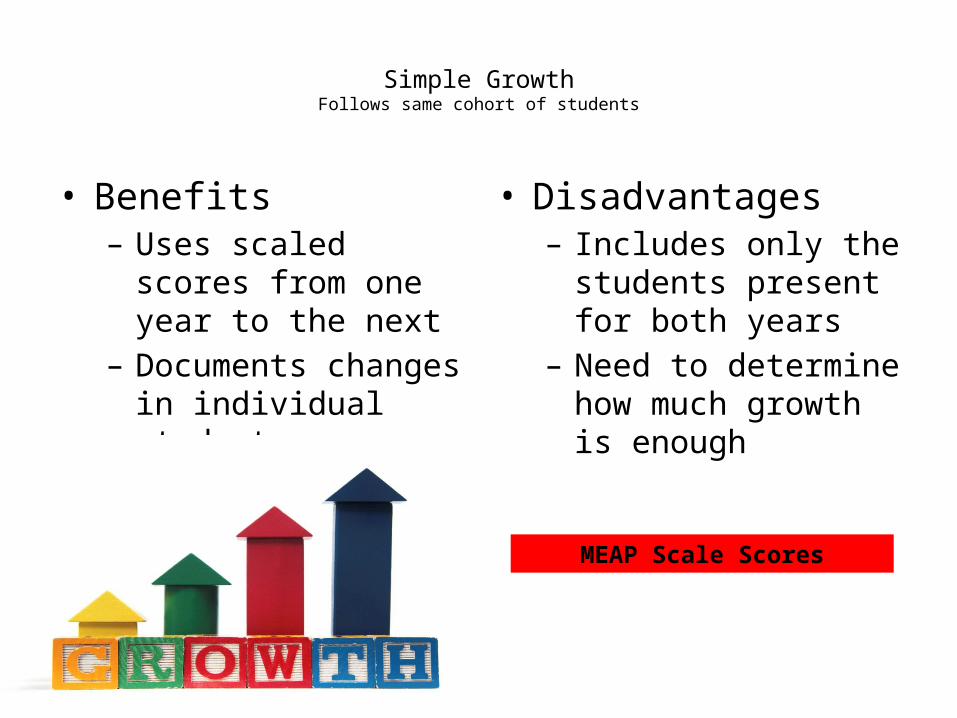
Simple GrowthFollows same cohort of students
• Benefits– Uses scaled scores from
one year to the next– Documents changes in
individual students
• Disadvantages– Includes only the
students present for both years
– Need to determine how much growth is enough
MEAP Scale Scores
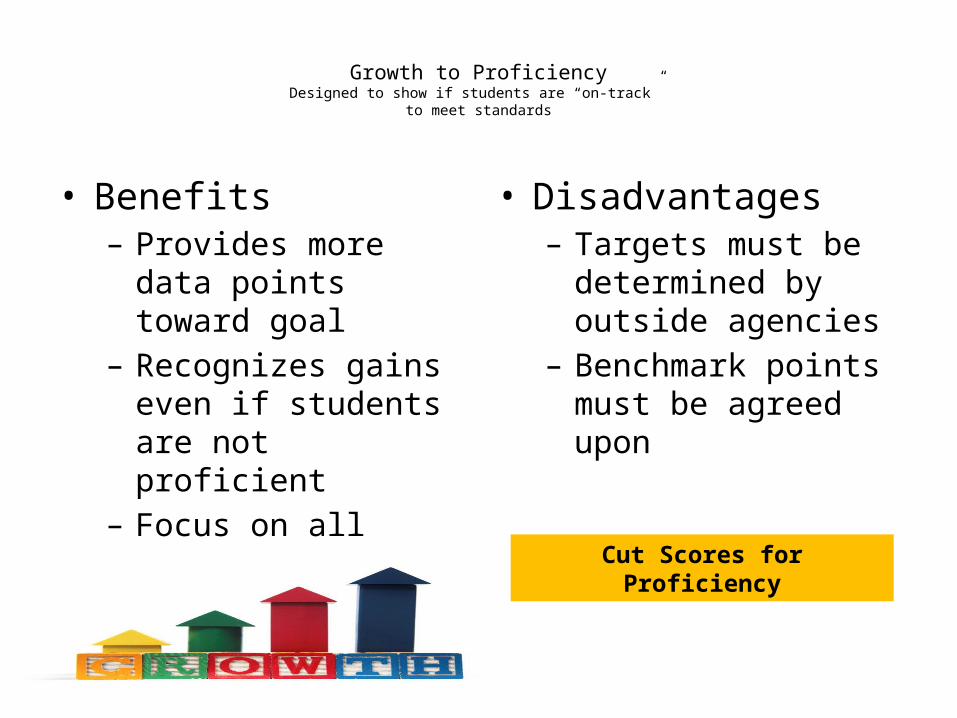
Growth to ProficiencyDesigned to show if students are “on-track”
to meet standards
• Benefits– Provides more data
points toward goal– Recognizes gains even if
students are not proficient
– Focus on all students, not just “bubble” students
• Disadvantages– Targets must be
determined by outside agencies
– Benchmark points must be agreed upon
Cut Scores for Proficiency
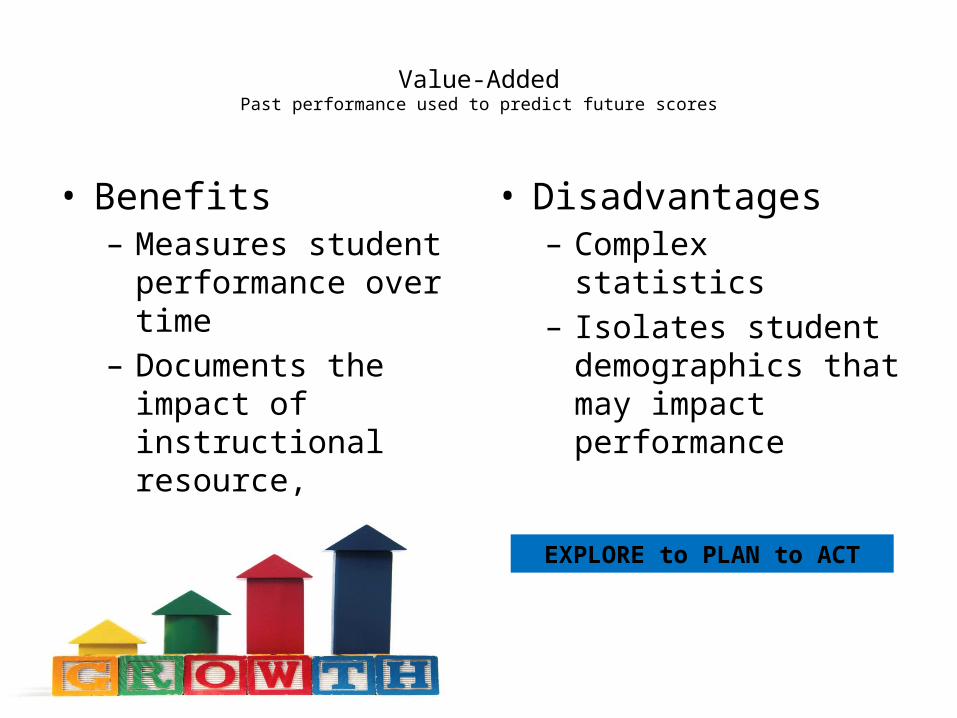
Value-AddedPast performance used to predict future scores
• Benefits– Measures student
performance over time– Documents the impact
of instructional resource, program, or school process on the change
• Disadvantages– Complex statistics– Isolates student
demographics that may impact performance
EXPLORE to PLAN to ACT
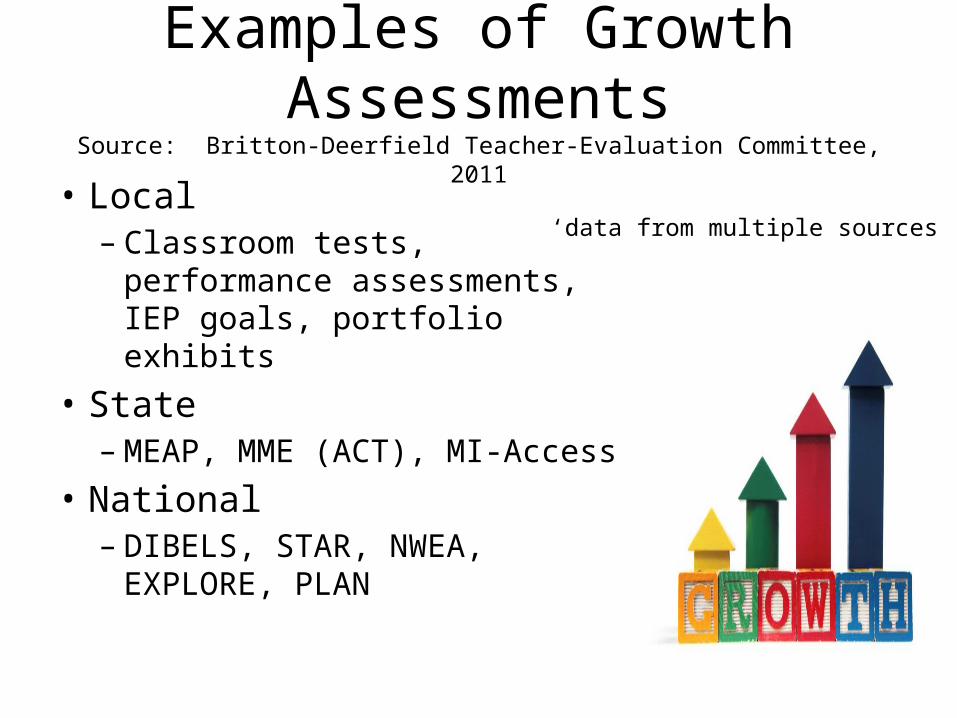
Examples of Growth AssessmentsSource: Britton-Deerfield Teacher-Evaluation Committee, 2011
• Local– Classroom tests, performance
assessments, IEP goals, portfolio exhibits
• State– MEAP, MME (ACT), MI-Access
• National– DIBELS, STAR, NWEA, EXPLORE,
PLAN
‘data from multiple sources ’
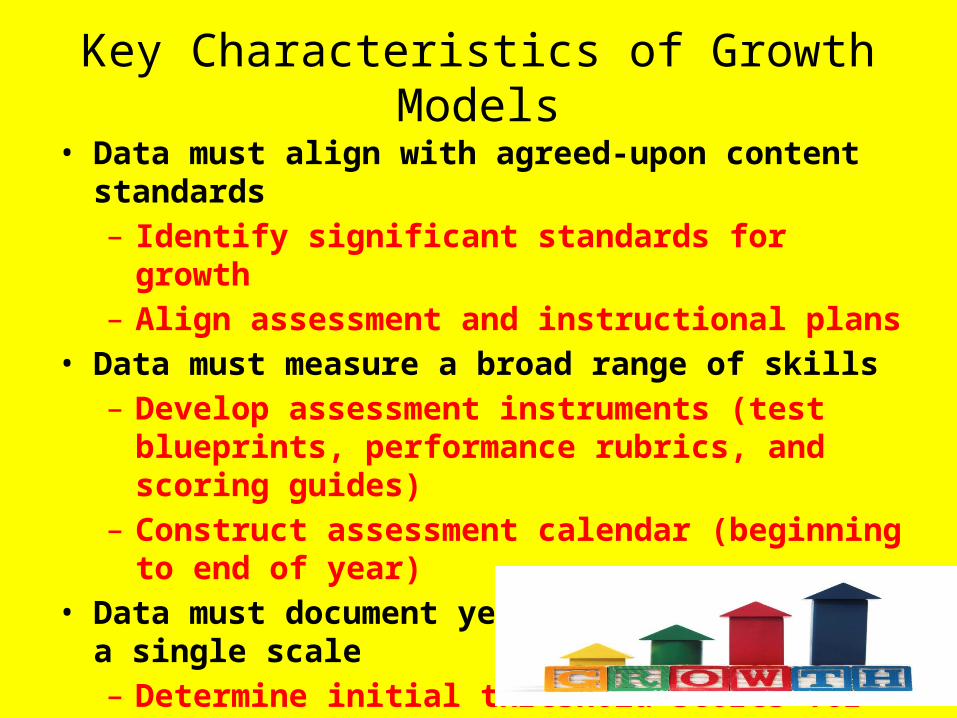
Key Characteristics of Growth Models• Data must align with agreed-upon content standards
– Identify significant standards for growth– Align assessment and instructional plans
• Data must measure a broad range of skills– Develop assessment instruments (test blueprints,
performance rubrics, and scoring guides)– Construct assessment calendar (beginning to end of year)
• Data must document year-to-year growth on a single scale– Determine initial threshold scores for determining growth
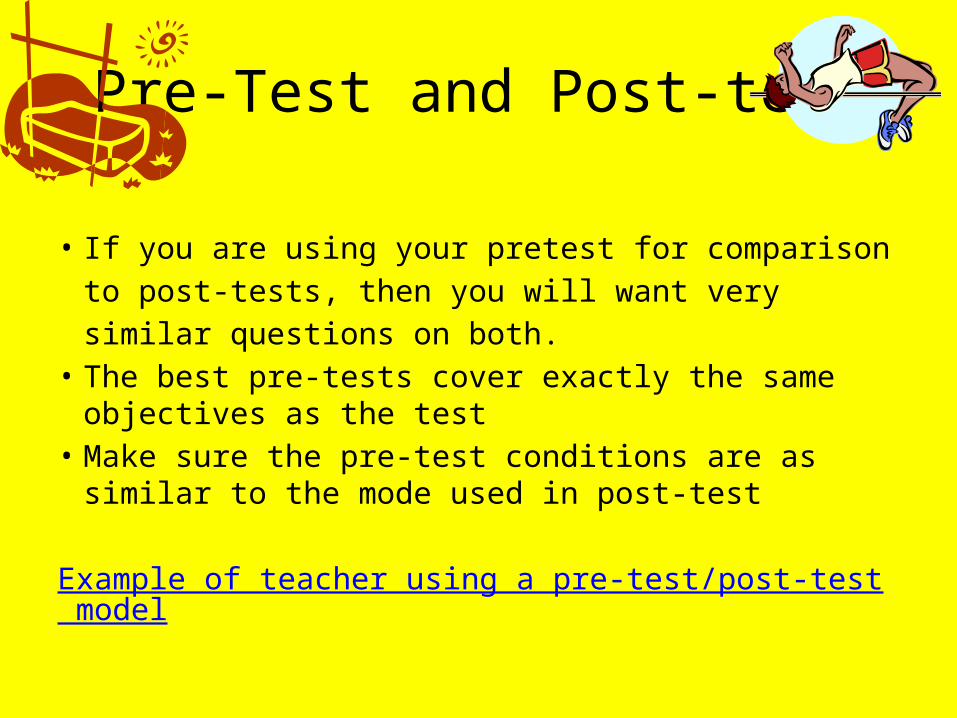
Pre-Test and Post-test
• If you are using your pretest for comparison to post-tests, then you will want very similar questions on both.
• The best pre-tests cover exactly the same objectives as the test
• Make sure the pre-test conditions are as similar to the mode used in post-test
Example of teacher using a pre-test/post-test model
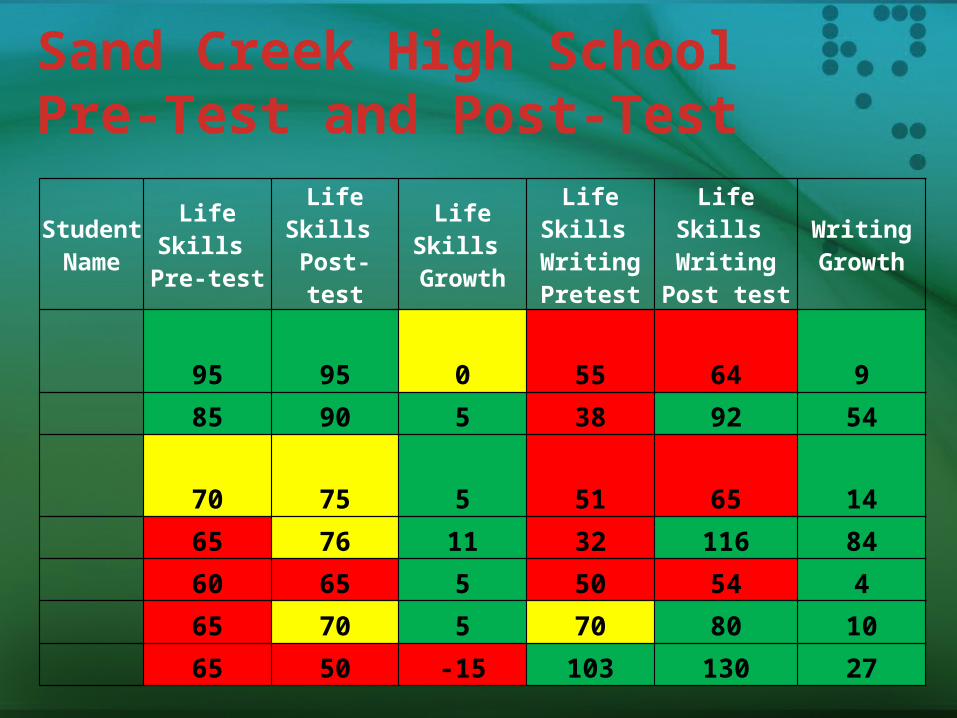
Sand Creek High SchoolPre-Test and Post-Test
Student Name
Life Skills Pre-test
Life Skills Post-test
Life Skills Growth
Life Skills Writing Pretest
Life Skills Writing Post
test
WritingGrowth
95 95 0 55 64 9
85 90 5 38 92 54
70 75 5 51 65 14
65 76 11 32 116 84
60 65 5 50 54 4
65 70 5 70 80 10
65 50 -15 103 130 27
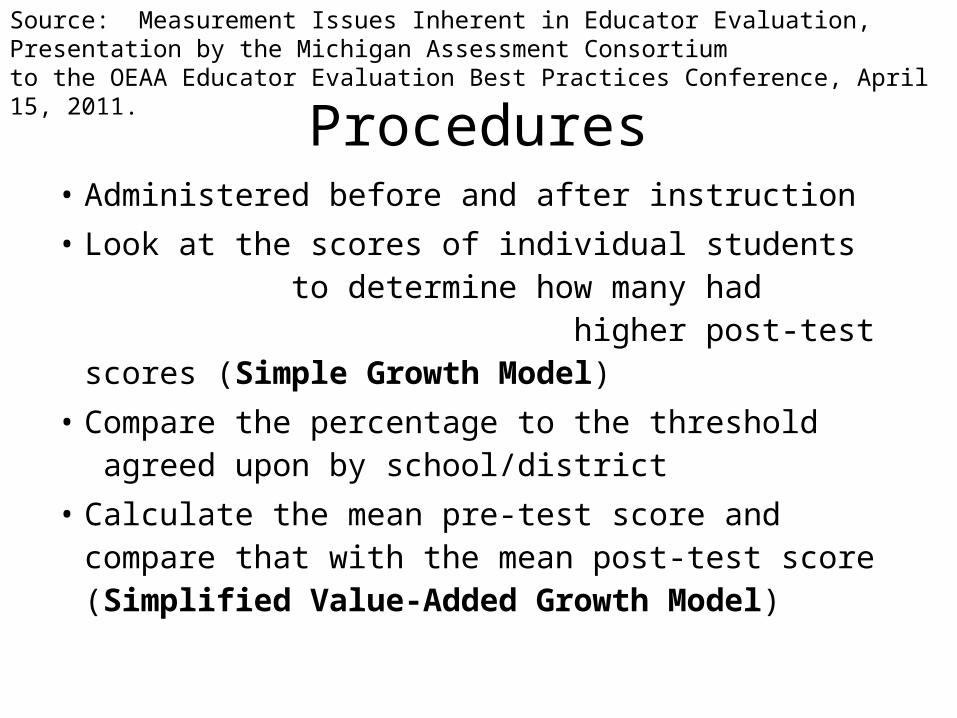
Procedures• Administered before and after instruction• Look at the scores of individual students
to determine how many had higher post-test scores (Simple Growth Model)
• Compare the percentage to the threshold agreed upon by school/district
• Calculate the mean pre-test score and compare that with the mean post-test score (Simplified Value-Added Growth Model)
Source: Measurement Issues Inherent in Educator Evaluation, Presentation by the Michigan Assessment Consortium to the OEAA Educator Evaluation Best Practices Conference, April 15, 2011.
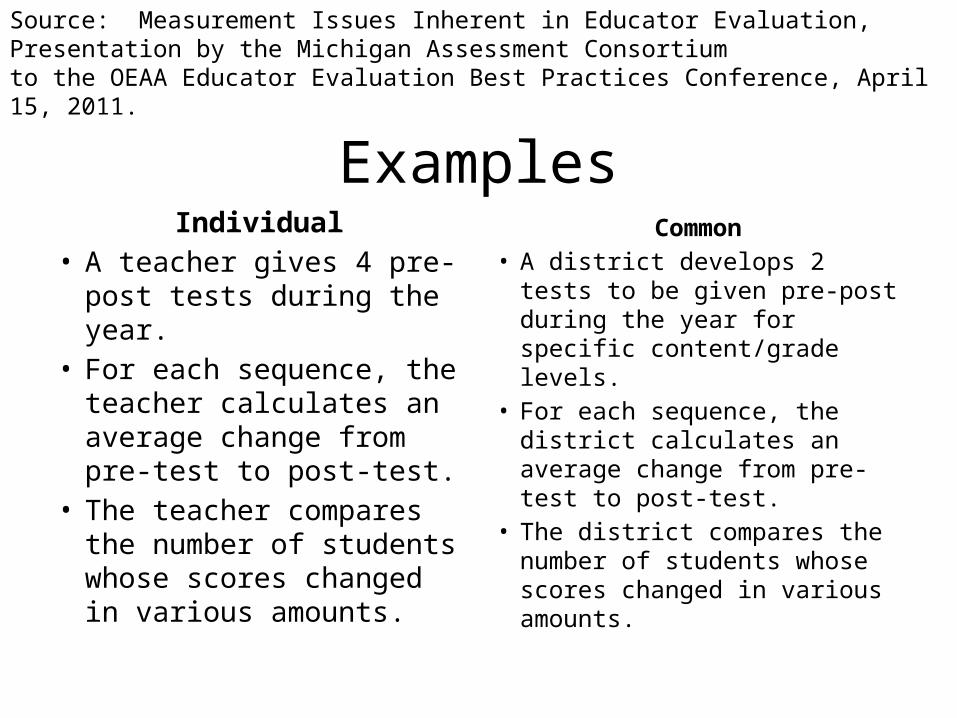
ExamplesIndividual
• A teacher gives 4 pre-post tests during the year.
• For each sequence, the teacher calculates an average change from pre-test to post-test.
• The teacher compares the number of students whose scores changed in various amounts.
Common• A district develops 2 tests to
be given pre-post during the year for specific content/grade levels.
• For each sequence, the district calculates an average change from pre-test to post-test.
• The district compares the number of students whose scores changed in various amounts.
Source: Measurement Issues Inherent in Educator Evaluation, Presentation by the Michigan Assessment Consortium to the OEAA Educator Evaluation Best Practices Conference, April 15, 2011.
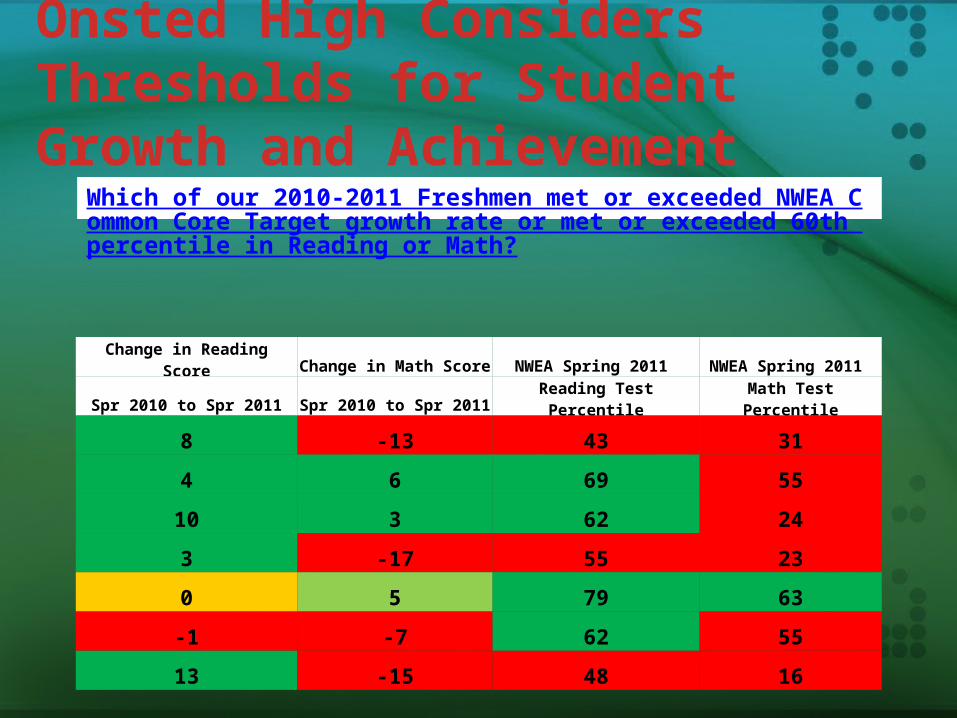
Onsted High Considers Thresholds for Student Growth and Achievement
Which of our 2010-2011 Freshmen met or exceeded NWEA Common Core Target growth rate or met or exceeded 60th percentile in Reading or Math?
Change in Reading Score Change in Math Score NWEA Spring 2011 NWEA Spring 2011
Spr 2010 to Spr 2011 Spr 2010 to Spr 2011 Reading Test Percentile Math Test Percentile
8 -13 43 31
4 6 69 55
10 3 62 24
3 -17 55 23
0 5 79 63
-1 -7 62 55
13 -15 48 16
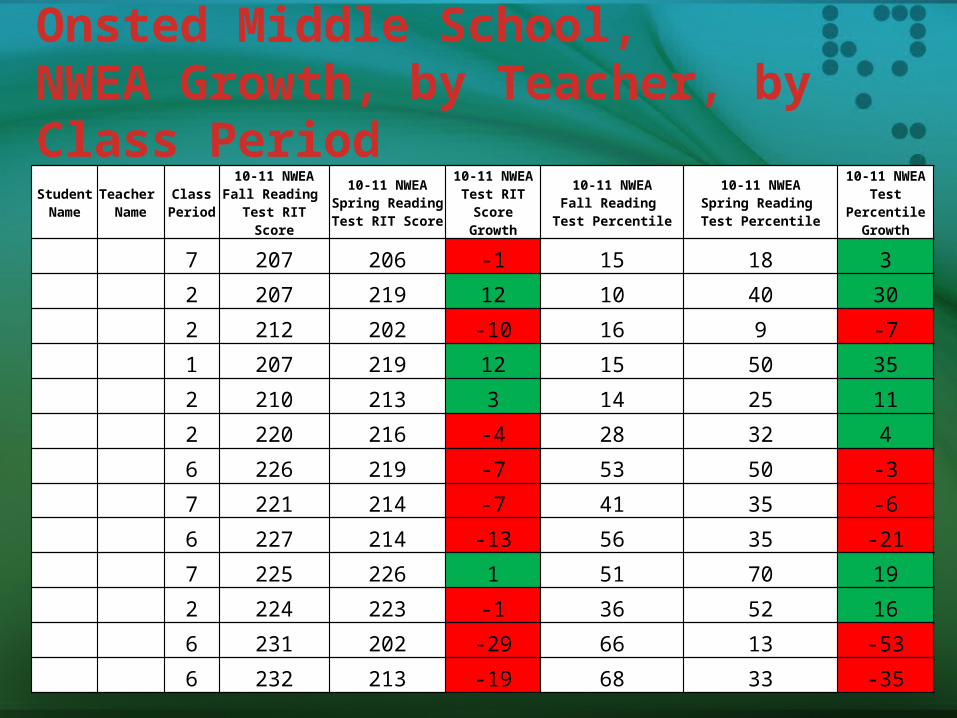
Onsted Middle School,NWEA Growth, by Teacher, by Class PeriodStudent Name
Teacher Name
Class Period
10-11 NWEAFall Reading
Test RIT Score
10-11 NWEASpring Reading Test RIT Score
10-11 NWEATest RIT Score
Growth
10-11 NWEAFall Reading
Test Percentile
10-11 NWEASpring Reading Test Percentile
10-11 NWEATest Percentile
Growth
7 207 206 -1 15 18 3
2 207 219 12 10 40 30
2 212 202 -10 16 9 -7
1 207 219 12 15 50 35
2 210 213 3 14 25 11
2 220 216 -4 28 32 4
6 226 219 -7 53 50 -3
7 221 214 -7 41 35 -6
6 227 214 -13 56 35 -21
7 225 226 1 51 70 19
2 224 223 -1 36 52 16
6 231 202 -29 66 13 -53
6 232 213 -19 68 33 -35
• Create an Assessment with Calculation for Growth– Pretest/Posttest– Calculation
Field

“On Target” “Off Target”
College and Career Readiness
56
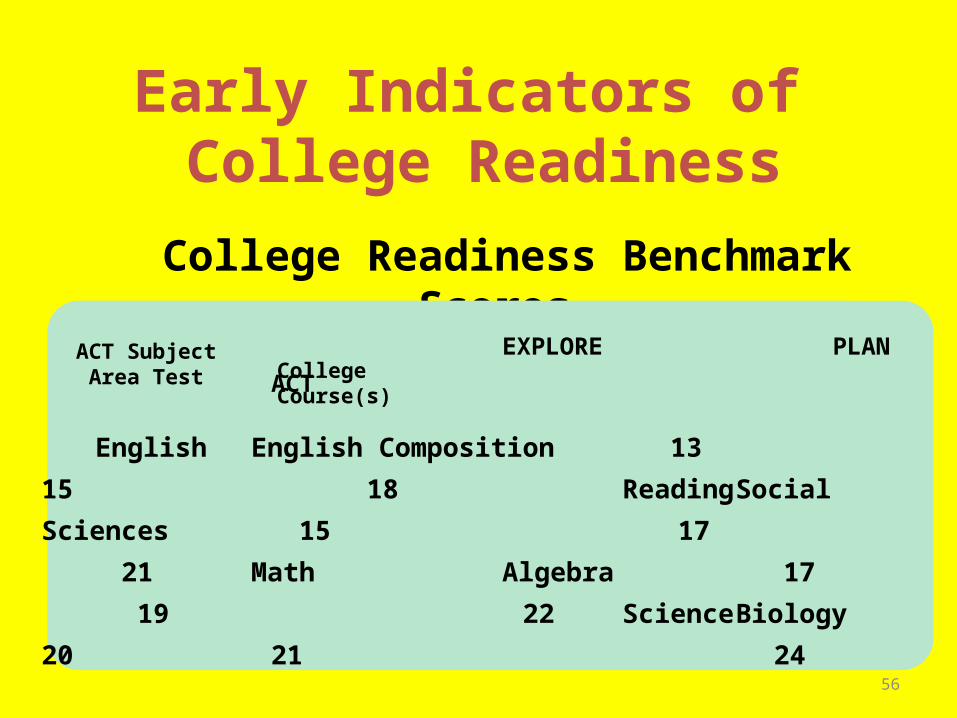
College Readiness Benchmark Scores
Early Indicators of College Readiness
EXPLORE PLAN ACT
English English Composition 13 15 18
Reading Social Sciences 15 17 21
Math Algebra 17 19 22
Science Biology 20 21 24
ACT SubjectArea Test College Course(s)
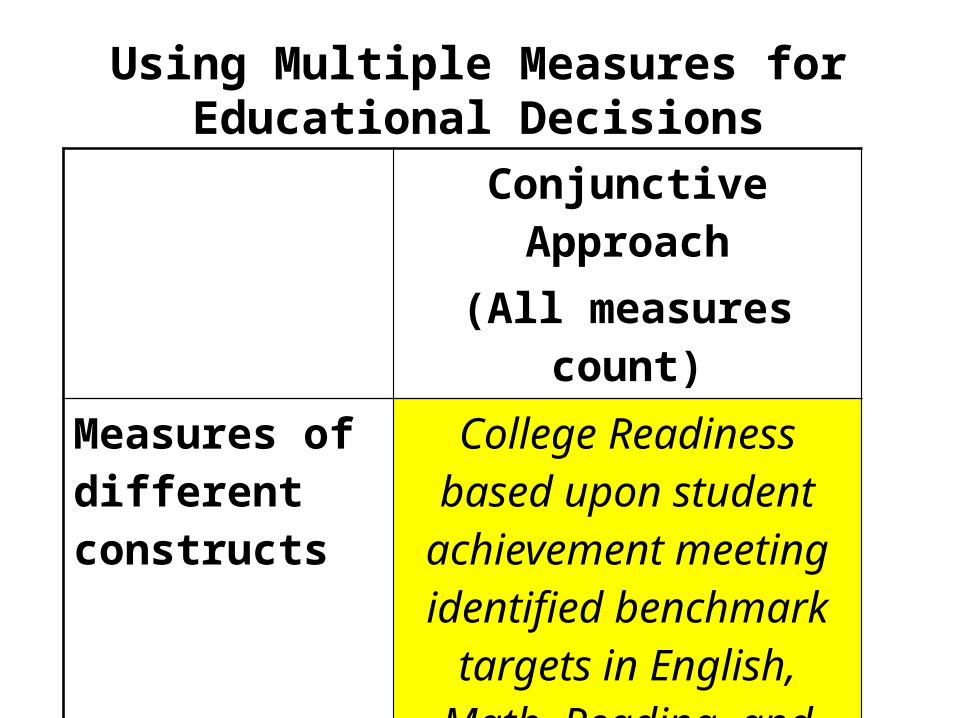
Using Multiple Measures for Educational Decisions
Conjunctive Approach
(All measures count)
Measures of different constructs
College Readiness based upon student
achievement meeting identified benchmark
targets in English, Math, Reading, and
Science
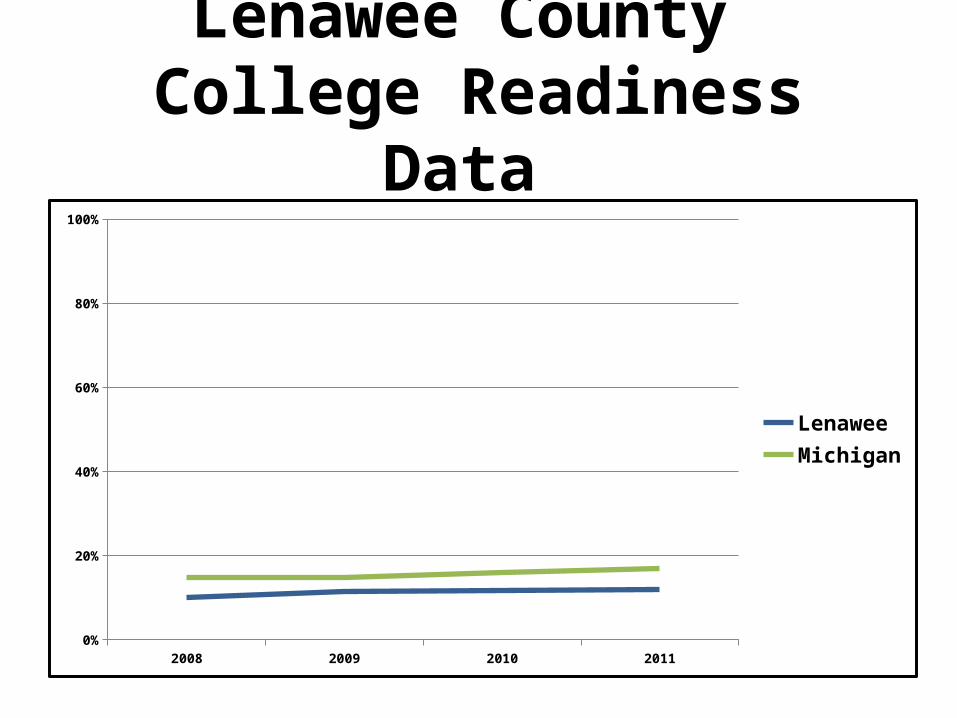
Lenawee County College Readiness Data
2008 2009 2010 20110%
20%
40%
60%
80%
100%
LenaweeMichigan
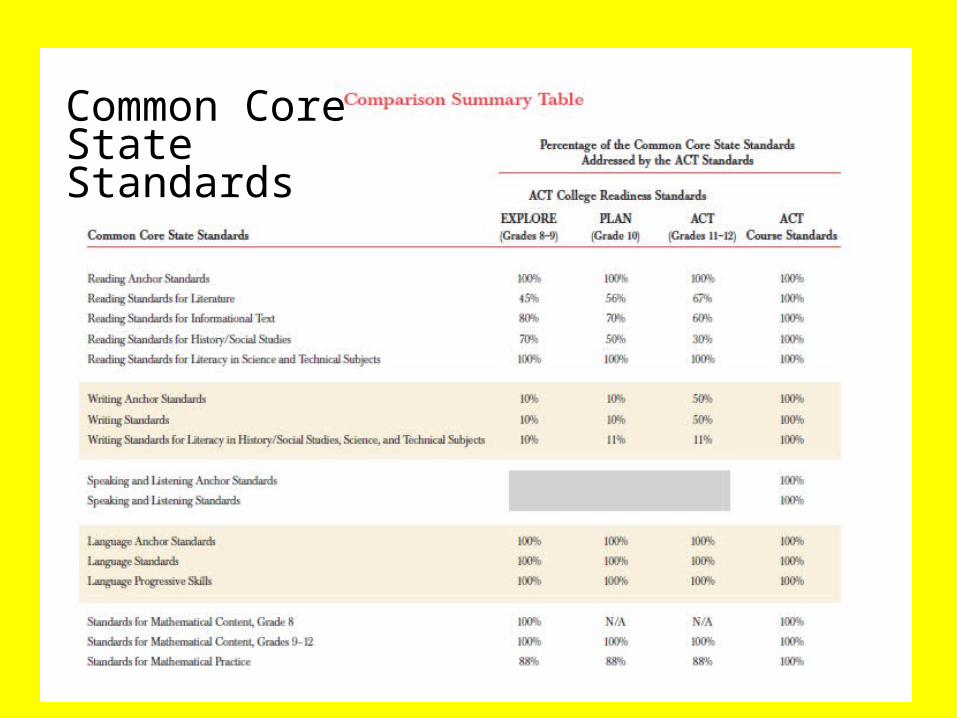
Common Core State Standards
College and Career Readiness WORKSHOPS
How important are the Michigan Merit Curriculum courses?
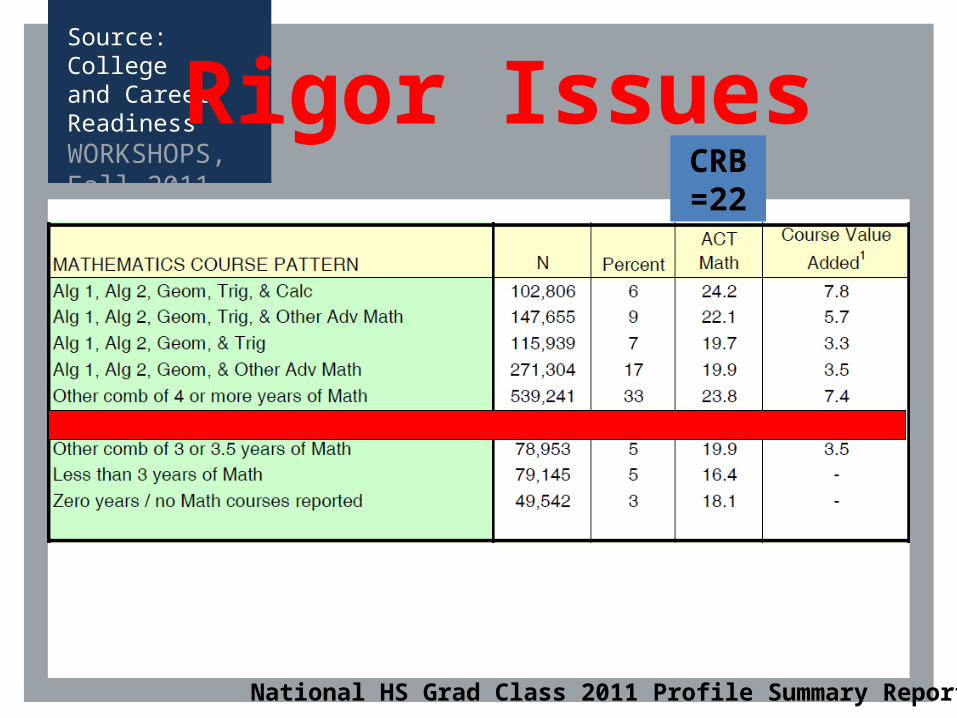
Source: College and Career Readiness WORKSHOPS, Fall 2011
Rigor Issues
National HS Grad Class 2011 Profile Summary Report
CRB=22
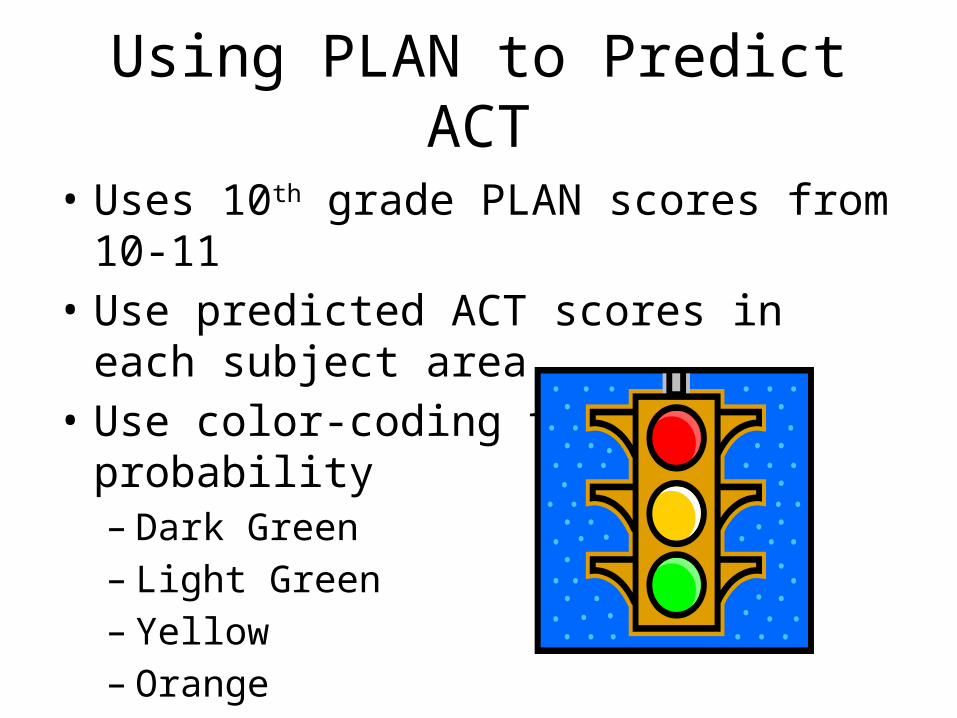
Using PLAN to Predict ACT
• Uses 10th grade PLAN scores from 10-11• Use predicted ACT scores in each subject area• Use color-coding to indicate probability
– Dark Green– Light Green– Yellow– Orange– Red
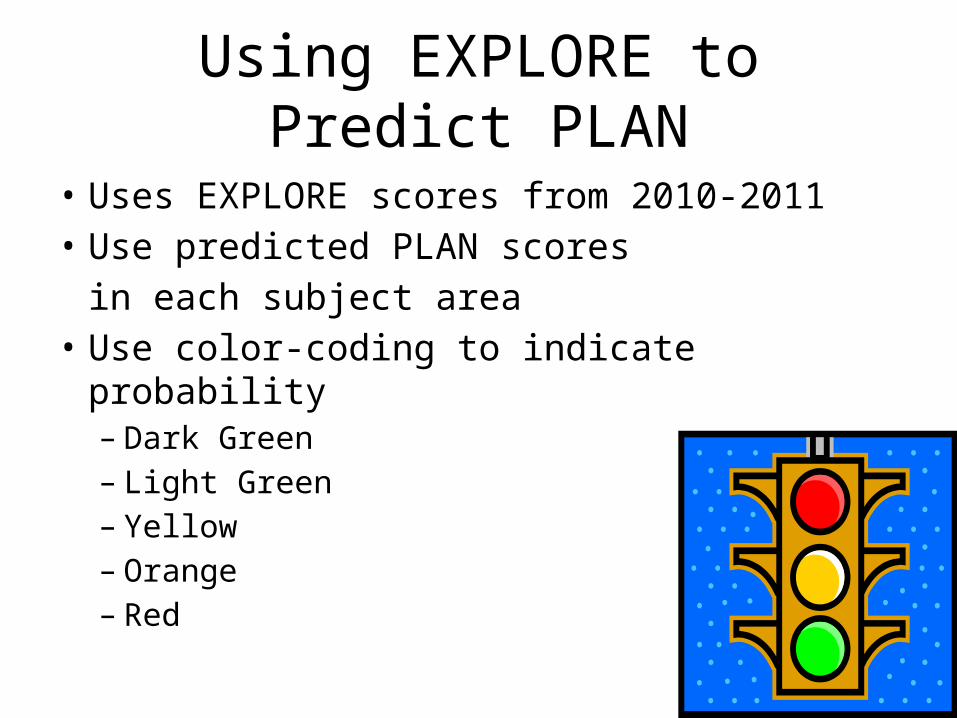
Using EXPLORE to Predict PLAN
• Uses EXPLORE scores from 2010-2011• Use predicted PLAN scores
in each subject area• Use color-coding to indicate probability
– Dark Green– Light Green– Yellow– Orange– Red
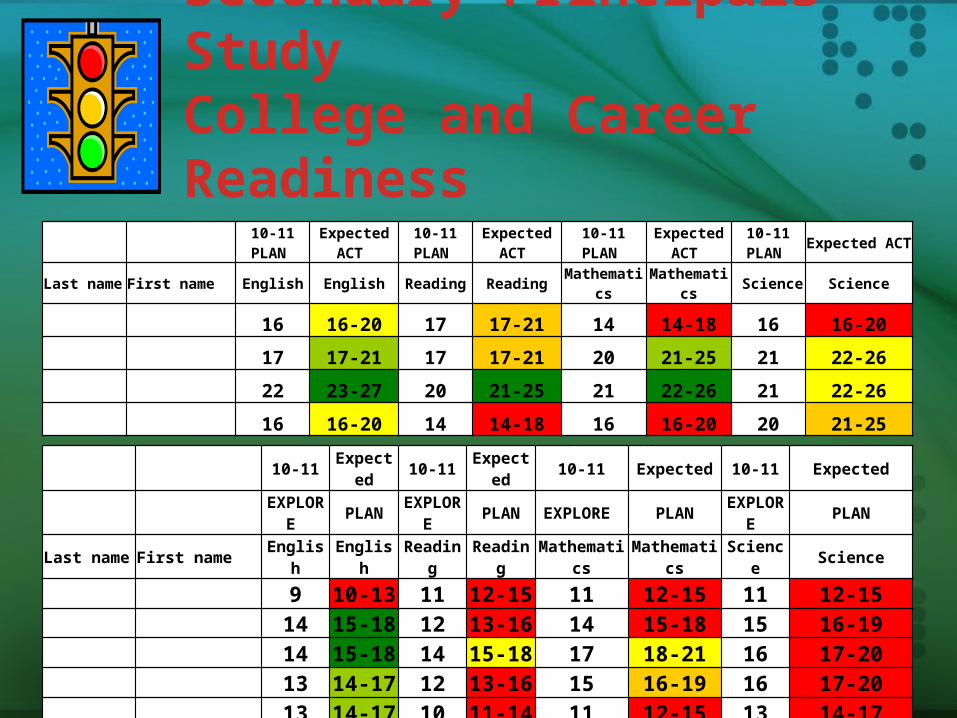
Secondary Principals Study College and Career Readiness
10-11 PLAN Expected ACT 10-11 PLAN Expected ACT 10-11 PLAN Expected ACT 10-11 PLAN Expected ACT
Last name First name English English Reading Reading Mathematics Mathematics Science Science
16 16-20 17 17-21 14 14-18 16 16-20
17 17-21 17 17-21 20 21-25 21 22-26
22 23-27 20 21-25 21 22-26 21 22-26
16 16-20 14 14-18 16 16-20 20 21-25
10-11 Expected 10-11 Expected 10-11 Expected 10-11 Expected
EXPLORE PLAN EXPLORE PLAN EXPLORE PLAN EXPLORE PLAN
Last name First name English English Reading Reading Mathematics Mathematics Science Science
9 10-13 11 12-15 11 12-15 11 12-1514 15-18 12 13-16 14 15-18 15 16-1914 15-18 14 15-18 17 18-21 16 17-2013 14-17 12 13-16 15 16-19 16 17-2013 14-17 10 11-14 11 12-15 13 14-17
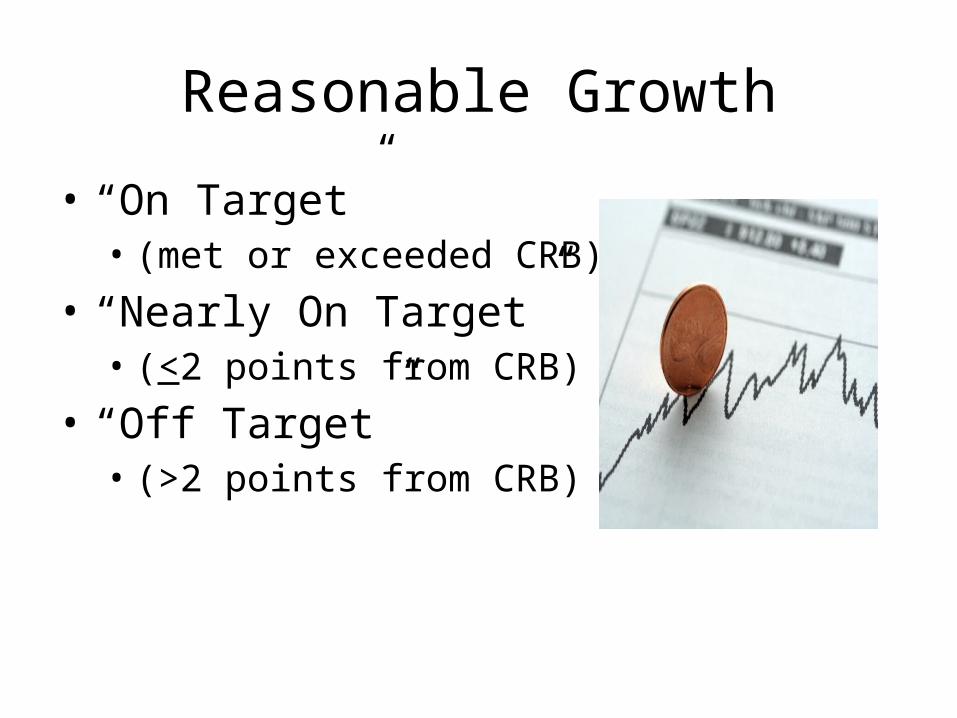
Reasonable Growth
• “On Target” • (met or exceeded CRB)
• “Nearly On Target” • (<2 points from CRB)
• “Off Target” • (>2 points from CRB)
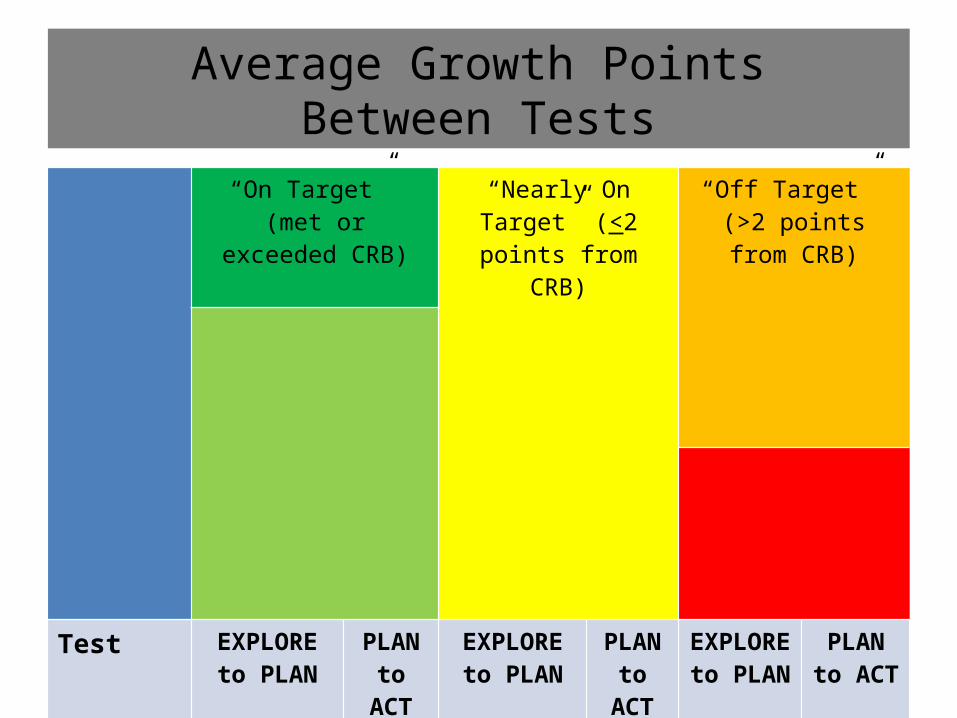
Average Growth PointsBetween Tests
“On Target” (met or exceeded CRB)
“Nearly On Target” (<2 points from CRB)
“Off Target” (>2 points from CRB)
Test EXPLORE to PLAN
PLAN to ACT
EXPLORE to PLAN
PLAN to ACT
EXPLORE to PLAN
PLAN to ACT
English 2-3 2-3 3-4 1 3-4 1
Math 2-3 2-3 1-2 1-2 2-3 1-2
Reading 1-2 4-5 3-4 2-3 3-4 1-2
Science 1-2 2-3 1-2 2-3 2-3 1
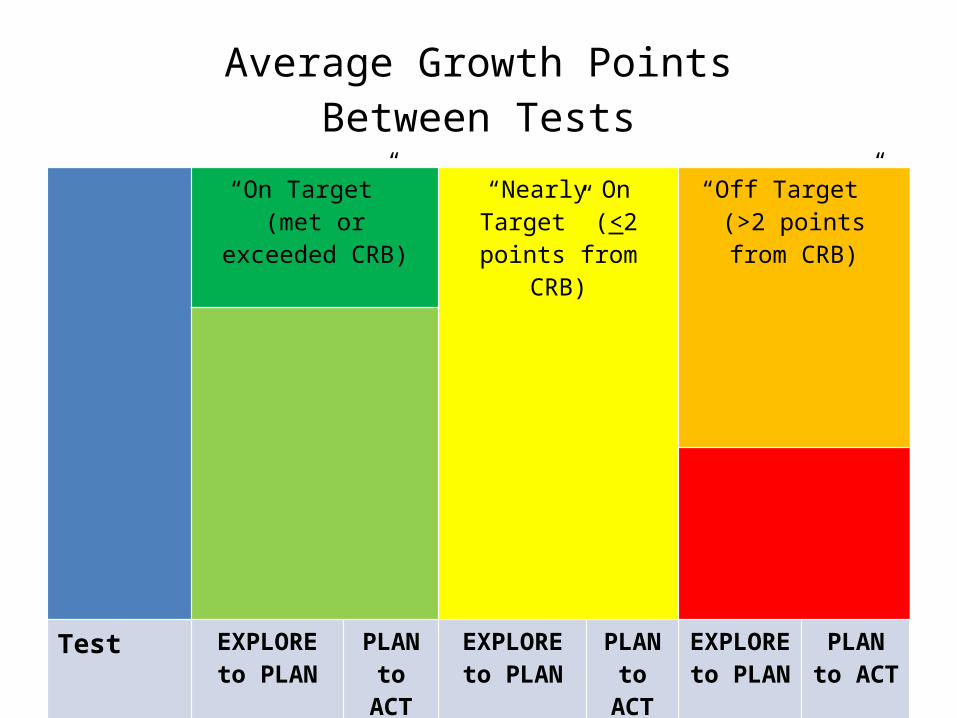
Analysis of EXPLORE to PLAN
• English and Reading – Stronger relationship
• if low in English, then low in Reading
– language usage vs. reading comprehension?• Math achievement is low
– 8th grade math vs. Algebra I?• Low achievement in Science
– 8th grade Science course?
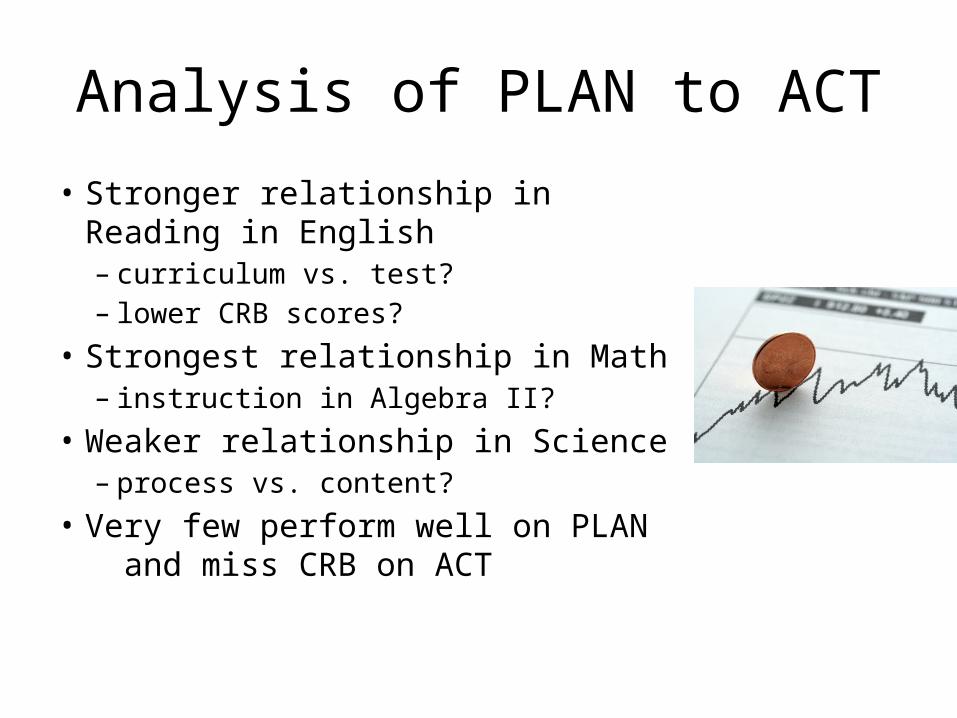
Analysis of PLAN to ACT
• Stronger relationship in Reading in English– curriculum vs. test?– lower CRB scores?
• Strongest relationship in Math– instruction in Algebra II?
• Weaker relationship in Science– process vs. content?
• Very few perform well on PLAN and miss CRB on ACT
Assessment Calendars
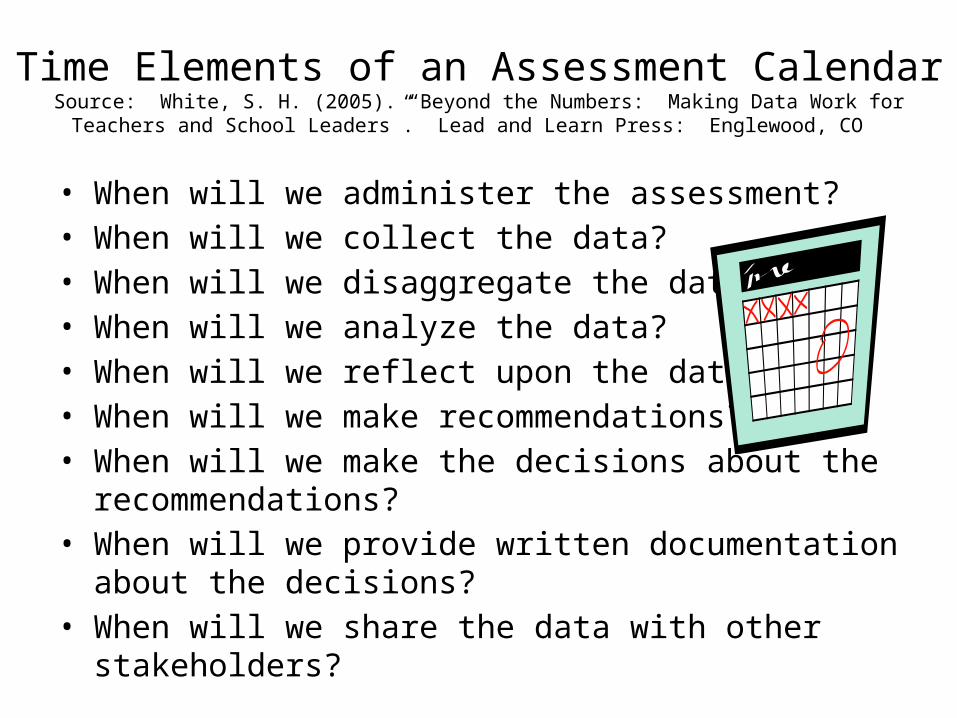
Time Elements of an Assessment CalendarSource: White, S. H. (2005). “Beyond the Numbers: Making Data Work for Teachers and School
Leaders”. Lead and Learn Press: Englewood, CO
• When will we administer the assessment?• When will we collect the data?• When will we disaggregate the data?• When will we analyze the data?• When will we reflect upon the data?• When will we make recommendations?• When will we make the decisions about the
recommendations?• When will we provide written documentation about the
decisions?• When will we share the data with other stakeholders?
College and Career Readiness WORKSHOPS
How important is the middle school to college readiness?
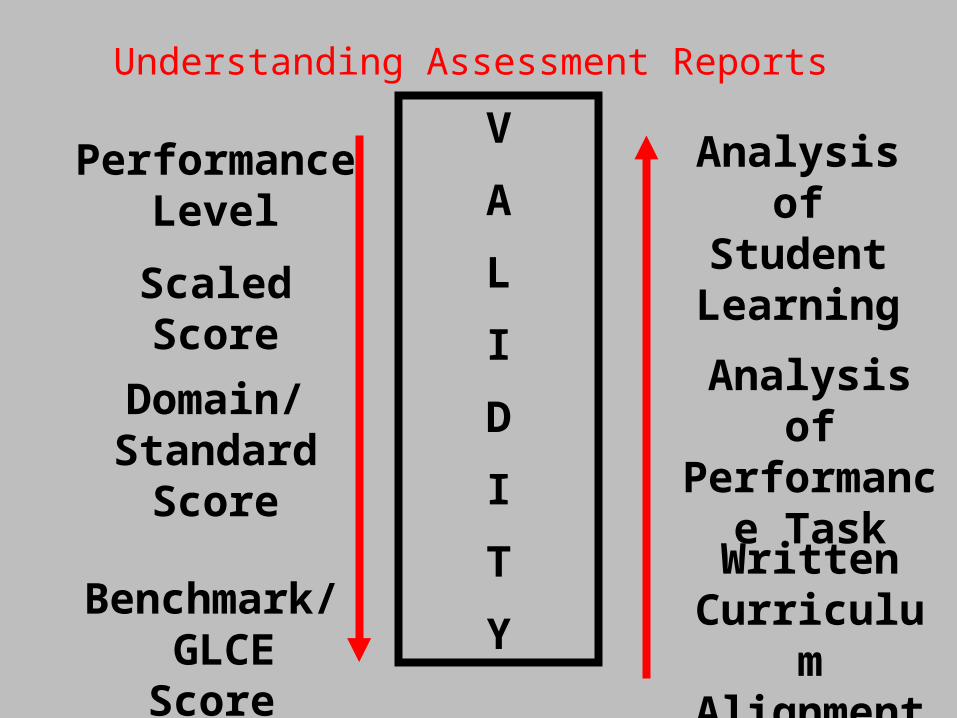
Performance Level
Scaled Score
Understanding Assessment Reports
Domain/ Standard Score
Benchmark/ GLCE Score
Written Curriculum Alignment
Analysis of Performance
Task
Analysis of Student Learning
V
A
L
I
D
I
T
Y
PLAN and EXPLORE Item Analysis
• Use test booklets from 11-12 testing– Order extra materials for
your staff (no cost)– Review items from the
booklet and the student responses
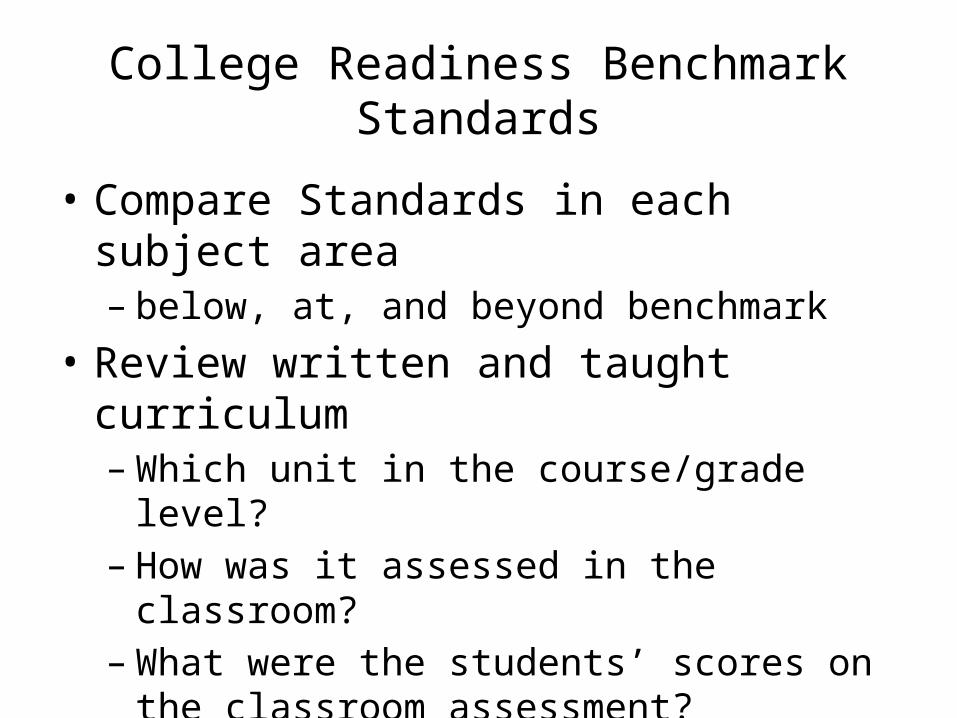
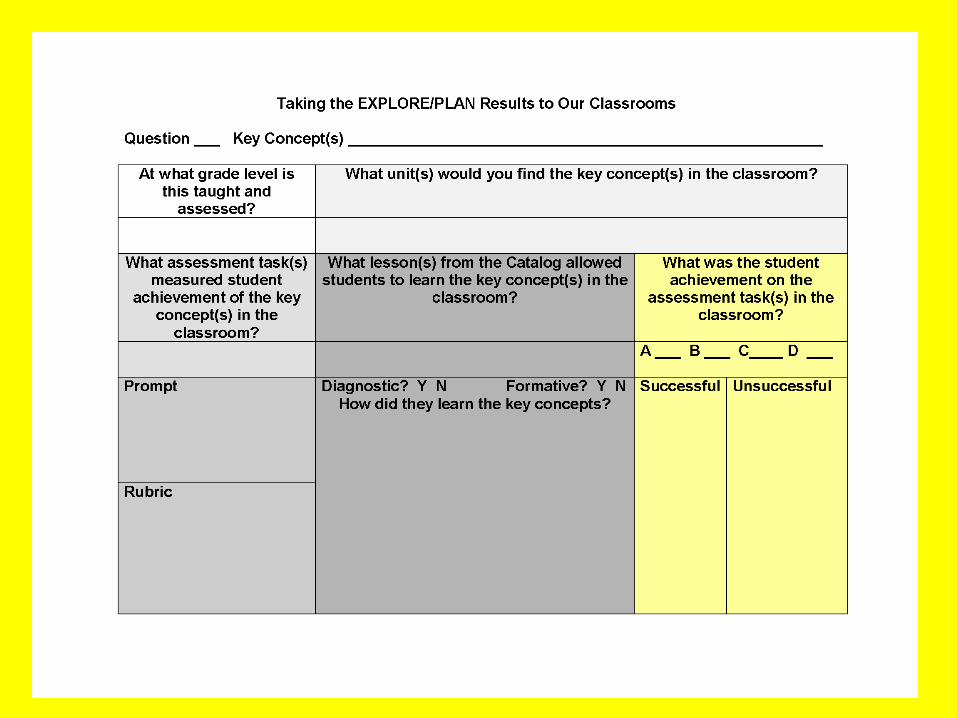
College Readiness Benchmark Standards
• Compare Standards in each subject area– below, at, and beyond benchmark
• Review written and taught curriculum– Which unit in the course/grade level?– How was it assessed in the classroom?– What were the students’ scores on the classroom
assessment?• Explore lesson plans and activities
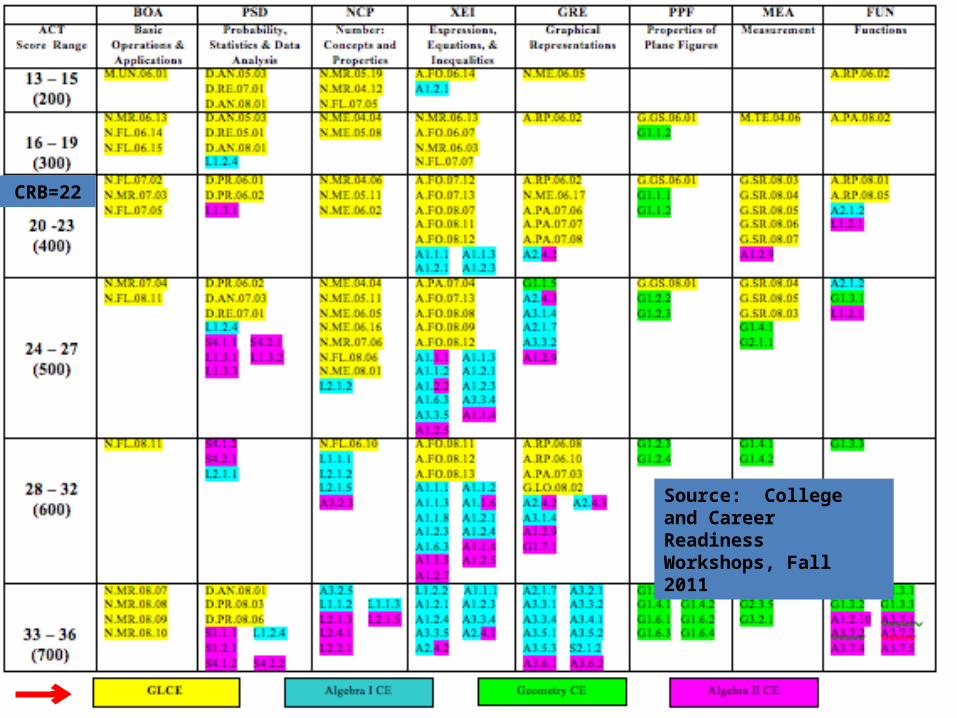
College and Career
Readiness
Source: College and Career Readiness Workshops, Fall 2011
CRB=22
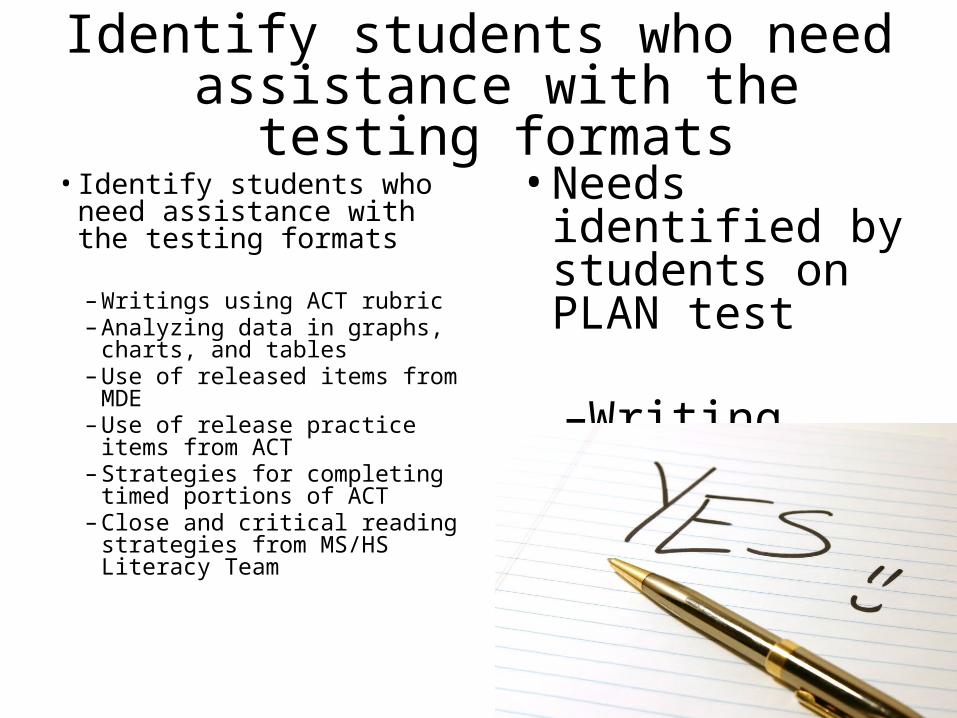
Identify students who need assistance with the testing formats
• Needs identified by students on PLAN test
– Writing– Reading– Math– Study Skills
• Identify students who need assistance with the testing formats
– Writings using ACT rubric– Analyzing data in graphs,
charts, and tables– Use of released items from
MDE– Use of release practice items
from ACT– Strategies for completing
timed portions of ACT – Close and critical reading
strategies from MS/HS Literacy Team
ACT Moodle Course
Using College and Career Readiness Standards as a Tool for School Improvement
College and Career Readiness WORKSHOPS
What are the academic achievements, educational
plans, and parental educational attainments
of our students?
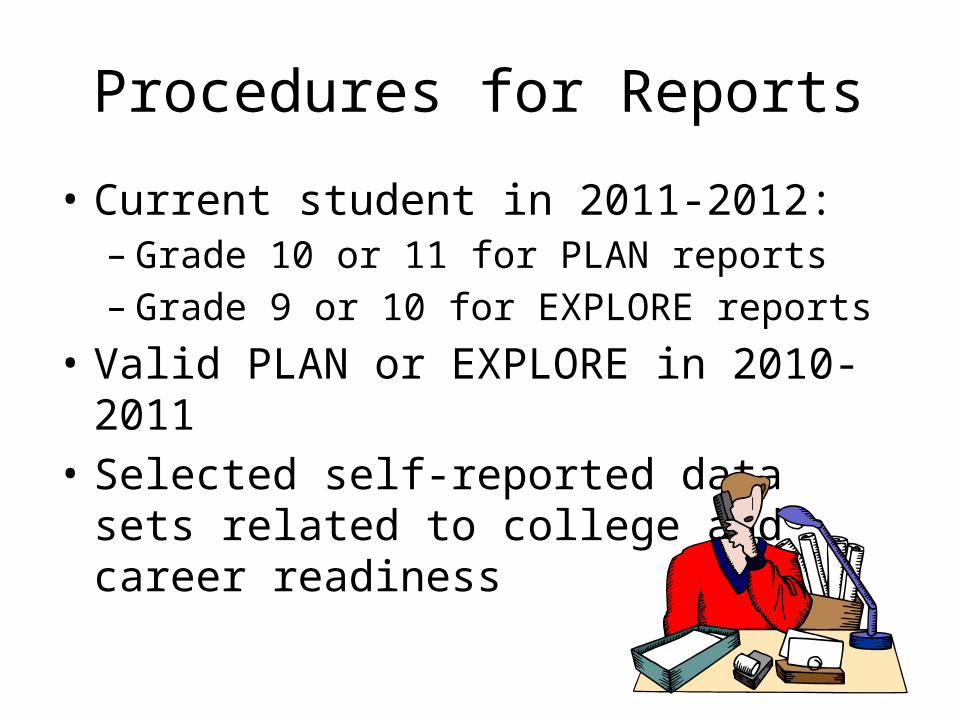
Procedures for Reports
• Current student in 2011-2012:– Grade 10 or 11 for PLAN reports– Grade 9 or 10 for EXPLORE reports
• Valid PLAN or EXPLORE in 2010-2011• Selected self-reported data sets related to
college and career readiness
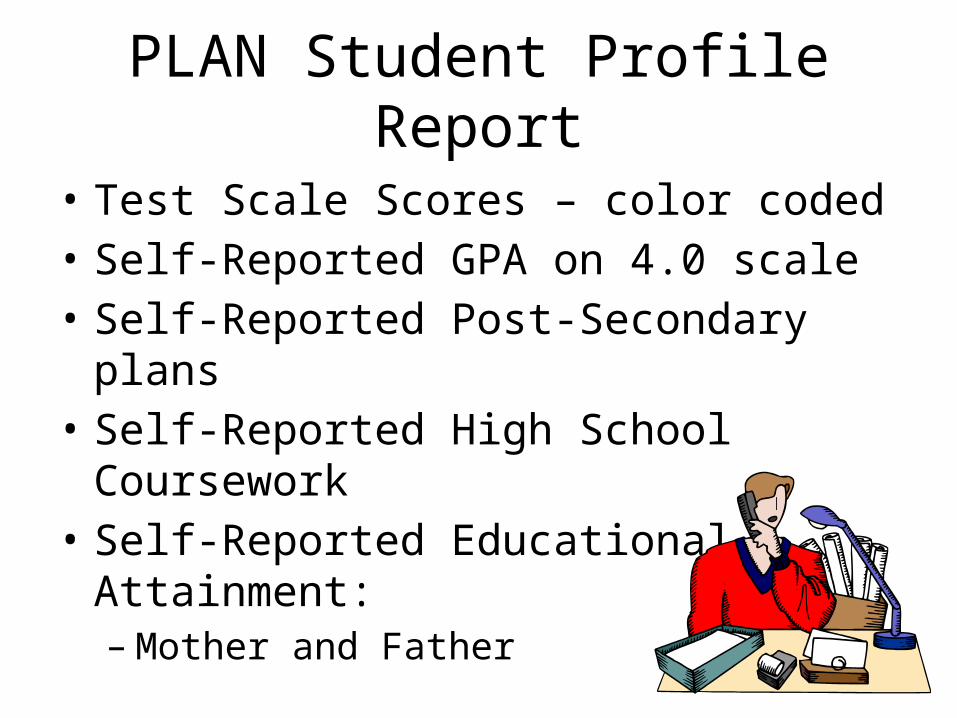
PLAN Student Profile Report
• Test Scale Scores – color coded• Self-Reported GPA on 4.0 scale• Self-Reported Post-Secondary plans• Self-Reported High School Coursework• Self-Reported Educational Attainment:
– Mother and Father
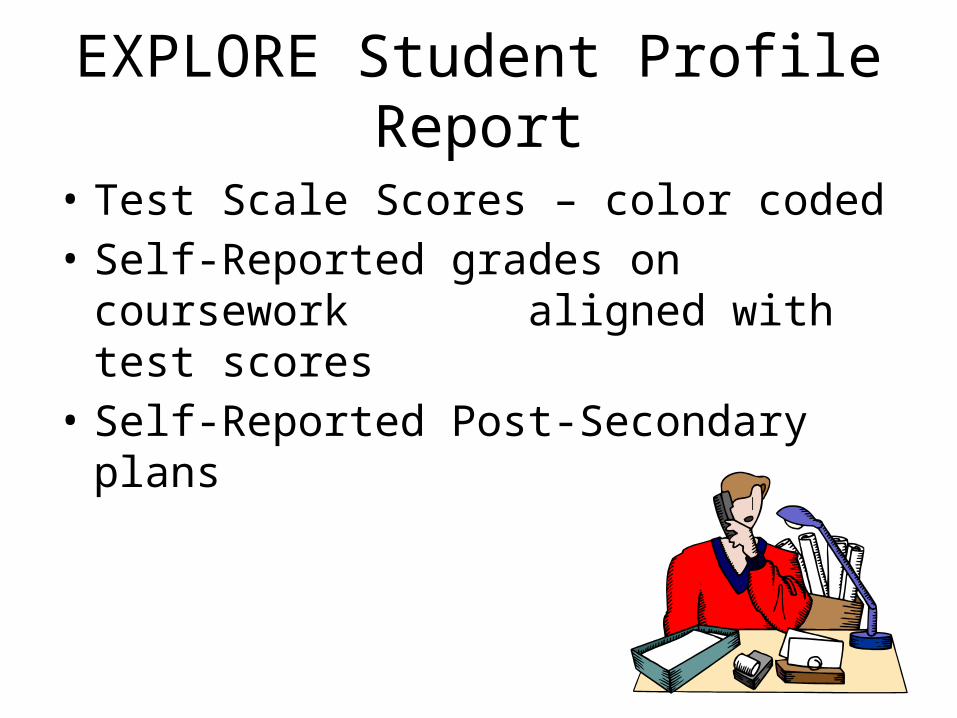
EXPLORE Student Profile Report
• Test Scale Scores – color coded• Self-Reported grades on coursework
aligned with test scores• Self-Reported Post-Secondary plans
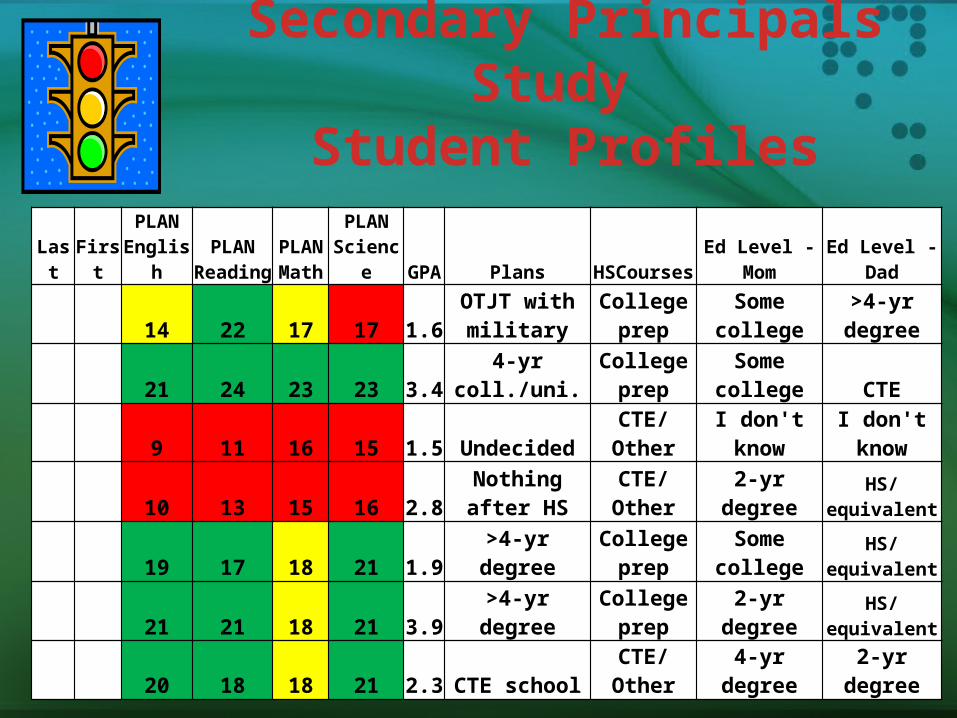
Secondary Principals Study Student Profiles
Last FirstPLAN
EnglishPLAN
ReadingPLAN Math
PLAN Science GPA Plans HSCourses Ed Level - Mom Ed Level - Dad
14 22 17 17 1.6OTJT with military
College prep Some college >4-yr degree
21 24 23 23 3.4 4-yr coll./uni.College
prep Some college CTE
9 11 16 15 1.5 Undecided CTE/Other I don't know I don't know
10 13 15 16 2.8Nothing after
HS CTE/Other 2-yr degree HS/equivalent
19 17 18 21 1.9 >4-yr degreeCollege
prep Some college HS/equivalent
21 21 18 21 3.9 >4-yr degreeCollege
prep 2-yr degree HS/equivalent
20 18 18 21 2.3 CTE school CTE/Other 4-yr degree 2-yr degree
Questions to Consider
• What is the relationship between CCR test scores and grades?
• What is the relationship between CCR test scores and post-secondary plans?
• What is the relationship between post-secondary plans and parents’ educational attainment?
What are some other data sets to consider for “College and Career Readiness”?
• Standards Met• Credits Earned• Courses Taken• Grades Earned
• EDP Completion• Resume Completion• Interview Completion• Application Completion
• Open an EXPLORE, PLAN, or Elementary Report in Excel
• Determine College Readiness with color coding

Cut Scores, Student Growth and College/Career Readiness: 2011-2012 Data Dialogues
Stan MastersLenawee ISD
January 17, 2012

Goals For Today
• Describe how the new cut scores will impact the MEAP/MME– Refine Data from 10-11 MEAP
• Describe how a growth model operates – Create an Assessment with Calculation for Growth
• Describe how multiple measures help define “College and Career Readiness” – Open an EXPLORE, PLAN, or Elementary Report
in Excel and color code College Readiness
Related Documents