Customer Service Excellence 2022 June, 2022 Insights from Europe – Nordic version

Welcome message from author
This document is posted to help you gain knowledge. Please leave a comment to let me know what you think about it! Share it to your friends and learn new things together.
Transcript
Customer Service
Excellence 2022
June, 2022
Insights from Europe – Nordic version
2
Contents
02Methodology and Demographics
P A G E 7
03Customer perspective
Deep-dive in contact channels and why customers contact customer service
P A G E 1 1
Employee perspective
How we resolve customer issues
P A G E 1 7
04Manager perspective
CS, ES and KPIs - how we measure performance
P A G E 2 1
05Board perspective
Priorities and upcoming investment plans
P A G E 2 5
0601Introduction
Executive summary
P A G E 3

3
Introduction
01
4
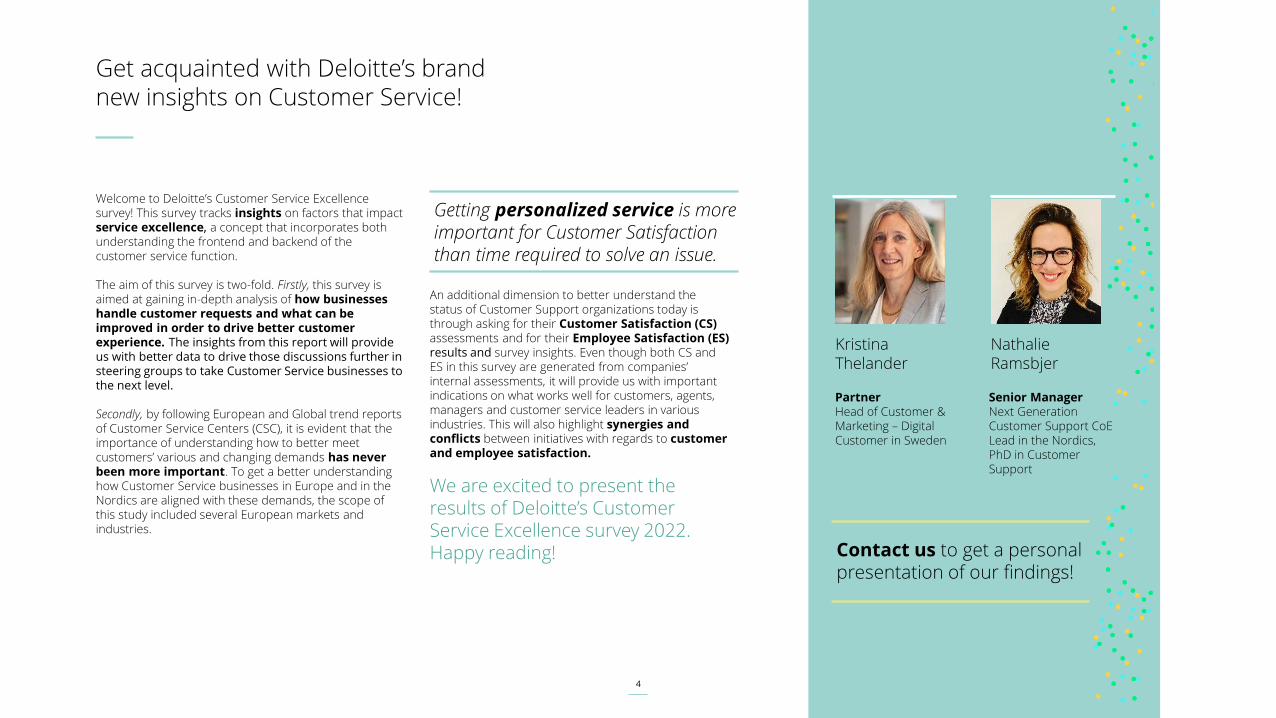
Get acquainted with Deloitte’s brandnew insights on Customer Service!
Welcome to Deloitte’s Customer Service Excellence survey! This survey tracks insights on factors that impactservice excellence, a concept that incorporates both understanding the frontend and backend of the customer service function.
The aim of this survey is two-fold. Firstly, this survey is aimed at gaining in-depth analysis of how businesses handle customer requests and what can be improved in order to drive better customer experience. The insights from this report will provide us with better data to drive those discussions further in steering groups to take Customer Service businesses to the next level.
Secondly, by following European and Global trend reports of Customer Service Centers (CSC), it is evident that the importance of understanding how to better meet customers’ various and changing demands has never been more important. To get a better understanding how Customer Service businesses in Europe and in the Nordics are aligned with these demands, the scope of this study included several European markets and industries.
An additional dimension to better understand the status of Customer Support organizations today is through asking for their Customer Satisfaction (CS) assessments and for their Employee Satisfaction (ES) results and survey insights. Even though both CS and ES in this survey are generated from companies’ internal assessments, it will provide us with important indications on what works well for customers, agents, managers and customer service leaders in various industries. This will also highlight synergies and conflicts between initiatives with regards to customer and employee satisfaction.
We are excited to present the results of Deloitte’s Customer Service Excellence survey 2022. Happy reading!
Kristina Thelander
PartnerHead of Customer & Marketing – Digital Customer in Sweden
Nathalie Ramsbjer
Senior ManagerNext Generation Customer Support CoELead in the Nordics, PhD in Customer Support
Getting personalized service is more important for Customer Satisfaction than time required to solve an issue.
Contact us to get a personal presentation of our findings!
5
Executive summary 1/2
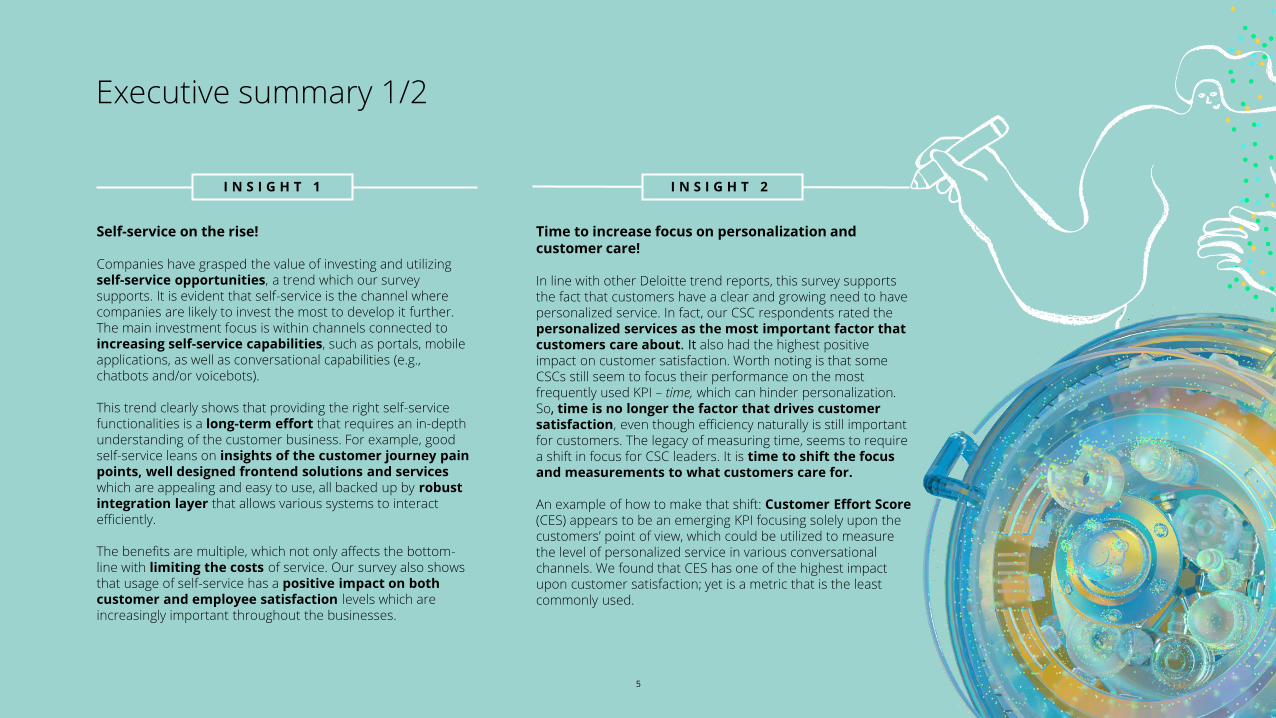
Self-service on the rise!
Companies have grasped the value of investing and utilizing self-service opportunities, a trend which our survey supports. It is evident that self-service is the channel where companies are likely to invest the most to develop it further. The main investment focus is within channels connected to increasing self-service capabilities, such as portals, mobile applications, as well as conversational capabilities (e.g., chatbots and/or voicebots).
This trend clearly shows that providing the right self-service functionalities is a long-term effort that requires an in-depth understanding of the customer business. For example, good self-service leans on insights of the customer journey pain points, well designed frontend solutions and services which are appealing and easy to use, all backed up by robust integration layer that allows various systems to interact efficiently.
The benefits are multiple, which not only affects the bottom-line with limiting the costs of service. Our survey also shows that usage of self-service has a positive impact on both customer and employee satisfaction levels which are increasingly important throughout the businesses.
Time to increase focus on personalization and customer care!
In line with other Deloitte trend reports, this survey supports the fact that customers have a clear and growing need to have personalized service. In fact, our CSC respondents rated the personalized services as the most important factor that customers care about. It also had the highest positive impact on customer satisfaction. Worth noting is that some CSCs still seem to focus their performance on the most frequently used KPI – time, which can hinder personalization. So, time is no longer the factor that drives customer satisfaction, even though efficiency naturally is still important for customers. The legacy of measuring time, seems to require a shift in focus for CSC leaders. It is time to shift the focus and measurements to what customers care for.
An example of how to make that shift: Customer Effort Score (CES) appears to be an emerging KPI focusing solely upon the customers’ point of view, which could be utilized to measure the level of personalized service in various conversational channels. We found that CES has one of the highest impact upon customer satisfaction; yet is a metric that is the least commonly used.
I N S I G H T 1 I N S I G H T 2
6
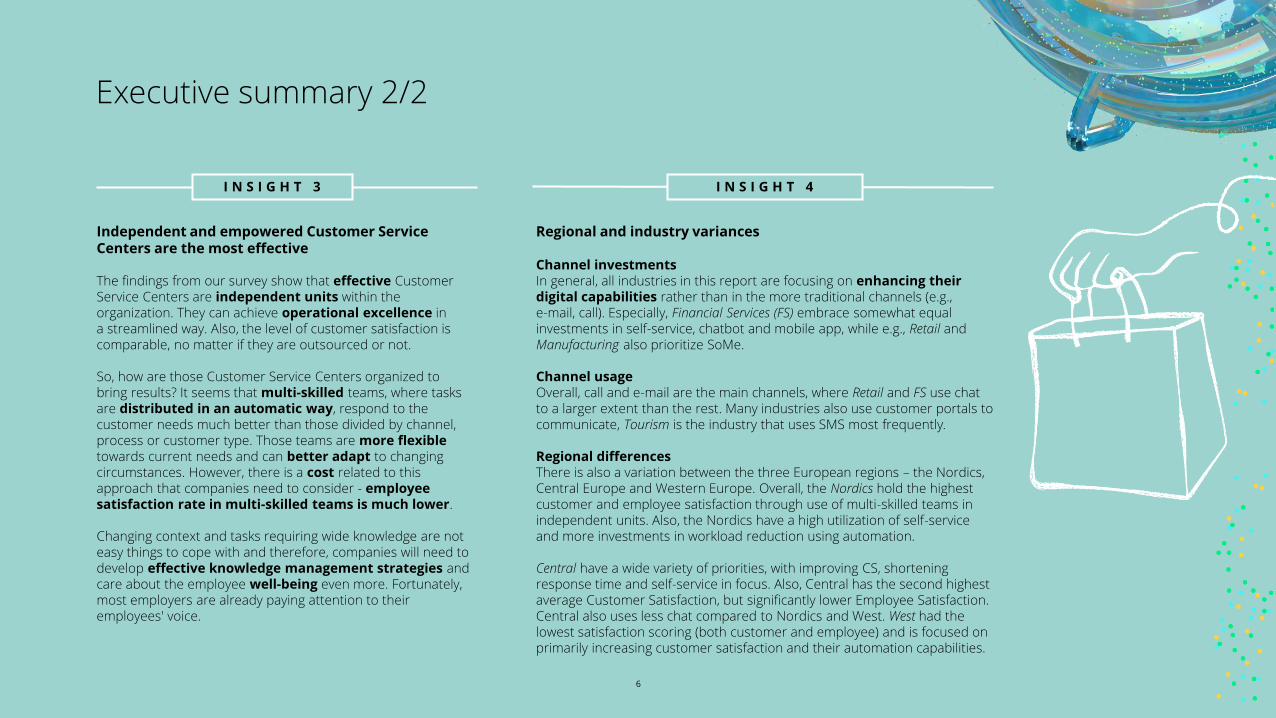
Executive summary 2/2
Independent and empowered Customer Service Centers are the most effective
The findings from our survey show that effective Customer Service Centers are independent units within the organization. They can achieve operational excellence in a streamlined way. Also, the level of customer satisfaction is comparable, no matter if they are outsourced or not.
So, how are those Customer Service Centers organized to bring results? It seems that multi-skilled teams, where tasks are distributed in an automatic way, respond to the customer needs much better than those divided by channel, process or customer type. Those teams are more flexible towards current needs and can better adapt to changing circumstances. However, there is a cost related to this approach that companies need to consider - employee satisfaction rate in multi-skilled teams is much lower.
Changing context and tasks requiring wide knowledge are not easy things to cope with and therefore, companies will need to develop effective knowledge management strategies and care about the employee well-being even more. Fortunately, most employers are already paying attention to their employees' voice.
Regional and industry variances
Channel investmentsIn general, all industries in this report are focusing on enhancing their digital capabilities rather than in the more traditional channels (e.g., e-mail, call). Especially, Financial Services (FS) embrace somewhat equal investments in self-service, chatbot and mobile app, while e.g., Retail and Manufacturing also prioritize SoMe.
Channel usageOverall, call and e-mail are the main channels, where Retail and FS use chat to a larger extent than the rest. Many industries also use customer portals to communicate, Tourism is the industry that uses SMS most frequently.
Regional differencesThere is also a variation between the three European regions – the Nordics, Central Europe and Western Europe. Overall, the Nordics hold the highest customer and employee satisfaction through use of multi-skilled teams in independent units. Also, the Nordics have a high utilization of self-service and more investments in workload reduction using automation.
Central have a wide variety of priorities, with improving CS, shortening response time and self-service in focus. Also, Central has the second highest average Customer Satisfaction, but significantly lower Employee Satisfaction. Central also uses less chat compared to Nordics and West. West had the lowest satisfaction scoring (both customer and employee) and is focused on primarily increasing customer satisfaction and their automation capabilities.
I N S I G H T 3 I N S I G H T 4

7
02Methodology & Demographics
8
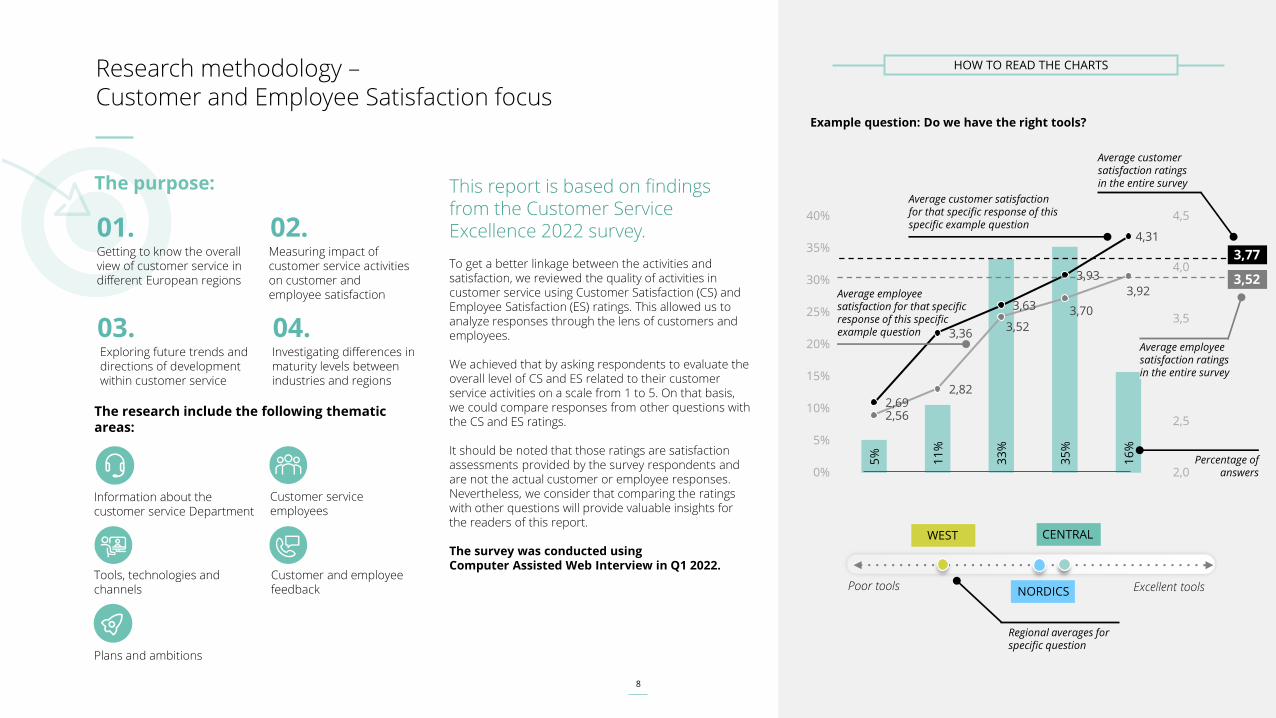
HOW TO READ THE CHARTSResearch methodology –Customer and Employee Satisfaction focus
This report is based on findings from the Customer Service Excellence 2022 survey.
To get a better linkage between the activities and satisfaction, we reviewed the quality of activities in customer service using Customer Satisfaction (CS) and Employee Satisfaction (ES) ratings. This allowed us to analyze responses through the lens of customers and employees.
We achieved that by asking respondents to evaluate the overall level of CS and ES related to their customer service activities on a scale from 1 to 5. On that basis, we could compare responses from other questions with the CS and ES ratings.
It should be noted that those ratings are satisfaction assessments provided by the survey respondents and are not the actual customer or employee responses. Nevertheless, we consider that comparing the ratings with other questions will provide valuable insights for the readers of this report.
The survey was conducted using Computer Assisted Web Interview in Q1 2022.
01.Getting to know the overall view of customer service in different European regions
03.Exploring future trends and directions of development within customer service
04.Investigating differences in maturity levels between industries and regions
The purpose:
Information about the customer service Department
02.Measuring impact of customer service activities on customer and employee satisfaction
5%
11
%
33
%
35
%
16
%
2,69
3,36
3,63
3,93
4,31
2,56
2,82
3,52
3,70
3,92
2,0
2,5
3,0
3,5
4,0
4,5
0%
5%
10%
15%
20%
25%
30%
35%
40%
Example question: Do we have the right tools?
Poor tools
Average employee satisfaction for that specific response of this specific example question
Average customer satisfaction ratings in the entire survey
Percentage of answers
Average customer satisfaction for that specific response of this specific example question
Regional averages for specific question
Excellent tools
The research include the following thematic areas:
Customer service employees
Tools, technologies and channels
Customer and employee feedback
Plans and ambitions
CENTRAL
3,77
3,52
Average employee satisfaction ratings in the entire survey
NORDICS
WEST
9
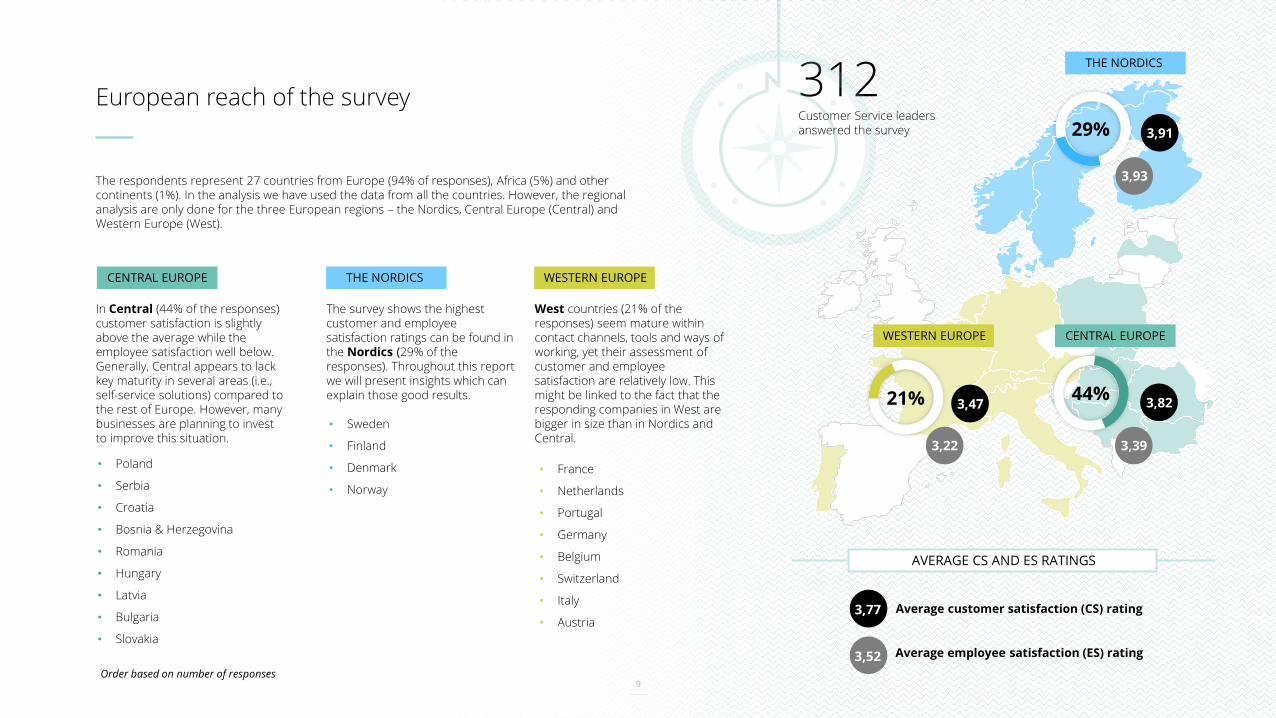
European reach of the survey
The survey shows the highest customer and employee satisfaction ratings can be found in the Nordics (29% of the responses). Throughout this report we will present insights which can explain those good results.
The respondents represent 27 countries from Europe (94% of responses), Africa (5%) and other continents (1%). In the analysis we have used the data from all the countries. However, the regional analysis are only done for the three European regions – the Nordics, Central Europe (Central) and Western Europe (West).
Average customer satisfaction (CS) rating
Average employee satisfaction (ES) rating
AVERAGE CS AND ES RATINGS
29%
44%21%
In Central (44% of the responses) customer satisfaction is slightly above the average while the employee satisfaction well below. Generally, Central appears to lack key maturity in several areas (i.e., self-service solutions) compared to the rest of Europe. However, many businesses are planning to invest to improve this situation.
West countries (21% of the responses) seem mature within contact channels, tools and ways of working, yet their assessment of customer and employee satisfaction are relatively low. This might be linked to the fact that the responding companies in West are bigger in size than in Nordics and Central.
• Sweden
• Finland
• Denmark
• Norway
• Poland
• Serbia
• Croatia
• Bosnia & Herzegovina
• Romania
• Hungary
• Latvia
• Bulgaria
• Slovakia
• France
• Netherlands
• Portugal
• Germany
• Belgium
• Switzerland
• Italy
• Austria
Order based on number of responses
312 Customer Service leaders answered the survey
3,77
3,52
3,47
3,22
3,82
3,39
3,91
3,93
THE NORDICSCENTRAL EUROPE WESTERN EUROPE
THE NORDICS
WESTERN EUROPE CENTRAL EUROPE
10
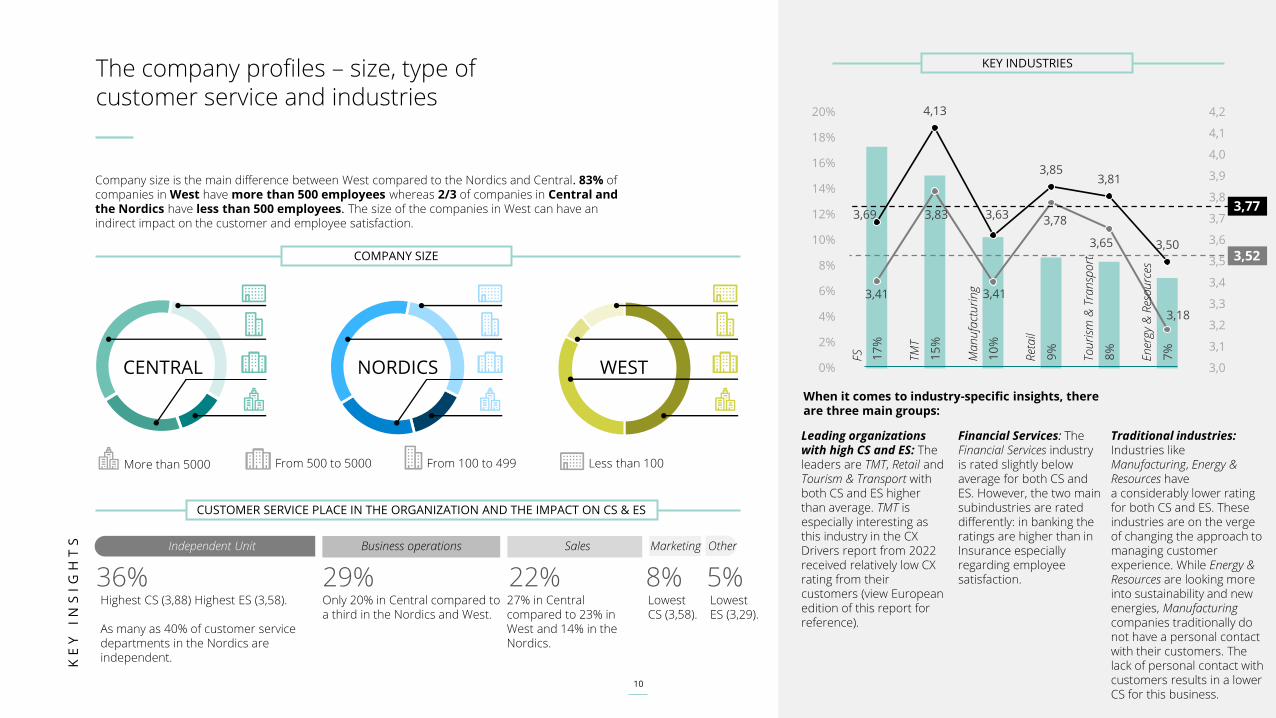
The company profiles – size, type of customer service and industries
36% 22%29% 8% 5%Highest CS (3,88) Highest ES (3,58).
As many as 40% of customer service departments in the Nordics are independent.
Only 20% in Central compared to a third in the Nordics and West.
27% in Central compared to 23% in West and 14% in the Nordics.
Lowest ES (3,29).
Lowest CS (3,58).
17
%
15
%
10
%
9%
8%
7%
3,69
4,13
3,63
3,853,81
3,50
3,41
3,83
3,41
3,78
3,65
3,18
3,0
3,1
3,2
3,3
3,4
3,5
3,6
3,7
3,8
3,9
4,0
4,1
4,2
0%
2%
4%
6%
8%
10%
12%
14%
16%
18%
20%
Company size is the main difference between West compared to the Nordics and Central. 83% of companies in West have more than 500 employees whereas 2/3 of companies in Central and the Nordics have less than 500 employees. The size of the companies in West can have an indirect impact on the customer and employee satisfaction.
When it comes to industry-specific insights, there are three main groups:
KEY INDUSTRIES
CENTRAL
More than 5000 From 500 to 5000 From 100 to 499 Less than 100
NORDICS WEST
FS TMT
Ma
nu
fact
uri
ng
Ret
ail
Tou
rism
& T
ran
spo
rt
En
ergy
& R
eso
urc
es
Independent Unit SalesBusiness operations Marketing
KE
Y
IN
SI
GH
TS
Leading organizations with high CS and ES: The leaders are TMT, Retail and Tourism & Transport with both CS and ES higher than average. TMT is especially interesting as this industry in the CX Drivers report from 2022 received relatively low CX rating from their customers (view European edition of this report for reference).
Financial Services: The Financial Services industry is rated slightly below average for both CS and ES. However, the two main subindustries are rated differently: in banking the ratings are higher than in Insurance especially regarding employee satisfaction.
Traditional industries: Industries like Manufacturing, Energy & Resources have a considerably lower rating for both CS and ES. These industries are on the verge of changing the approach to managing customer experience. While Energy & Resources are looking more into sustainability and new energies, Manufacturingcompanies traditionally do not have a personal contact with their customers. The lack of personal contact with customers results in a lower CS for this business.
3,77
3,52
Other
COMPANY SIZE
CUSTOMER SERVICE PLACE IN THE ORGANIZATION AND THE IMPACT ON CS & ES
11
03Customer perspective: Deep-dive in contact channels and why customers contact customer service
12
Why are customers contacting us and what do they actually care about?
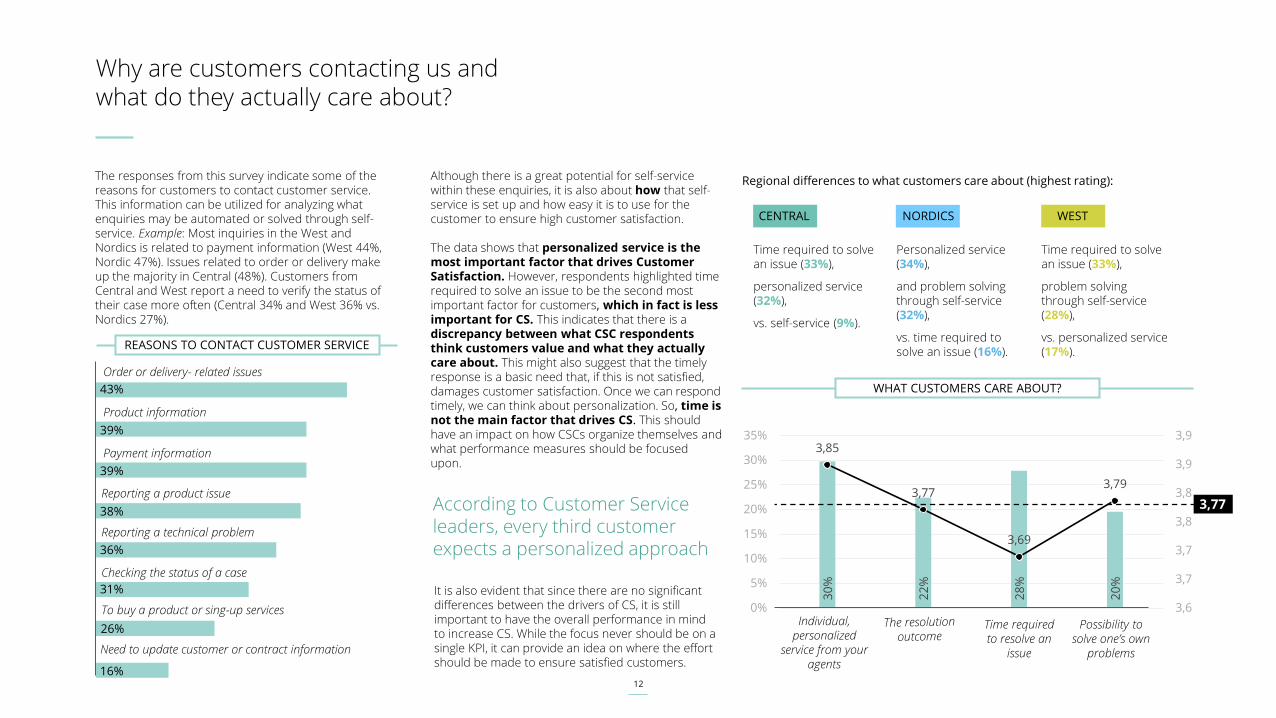
The responses from this survey indicate some of the reasons for customers to contact customer service. This information can be utilized for analyzing what enquiries may be automated or solved through self-service. Example: Most inquiries in the West and Nordics is related to payment information (West 44%, Nordic 47%). Issues related to order or delivery make up the majority in Central (48%). Customers from Central and West report a need to verify the status of their case more often (Central 34% and West 36% vs. Nordics 27%).
Although there is a great potential for self-service within these enquiries, it is also about how that self-service is set up and how easy it is to use for the customer to ensure high customer satisfaction.
The data shows that personalized service is the most important factor that drives Customer Satisfaction. However, respondents highlighted time required to solve an issue to be the second most important factor for customers, which in fact is less important for CS. This indicates that there is a discrepancy between what CSC respondents think customers value and what they actually care about. This might also suggest that the timely response is a basic need that, if this is not satisfied, damages customer satisfaction. Once we can respond timely, we can think about personalization. So, time is not the main factor that drives CS. This should have an impact on how CSCs organize themselves and what performance measures should be focused upon.
30
%
22
%
28
%
20
%
3,85
3,77
3,69
3,79
3,6
3,7
3,7
3,8
3,8
3,9
3,9
0%
5%
10%
15%
20%
25%
30%
35%
According to Customer Service leaders, every third customer expects a personalized approach
It is also evident that since there are no significant differences between the drivers of CS, it is still important to have the overall performance in mind to increase CS. While the focus never should be on a single KPI, it can provide an idea on where the effort should be made to ensure satisfied customers.
Regional differences to what customers care about (highest rating):
Personalized service (34%),
and problem solving through self-service (32%),
vs. time required to solve an issue (16%).
Time required to solve an issue (33%),
personalized service (32%),
vs. self-service (9%).
Time required to solve an issue (33%),
problem solving through self-service (28%),
vs. personalized service (17%).
Individual, personalized
service from your agents
Time required to resolve an
issue
Possibility to solve one’s own
problems
3,77
Checking the status of a case
31%
Need to update customer or contract information
16%
Payment information
39%
To buy a product or sing-up services
26%
Product information
39%
Order or delivery- related issues
43%
Reporting a product issue
38%
Reporting a technical problem
36%
REASONS TO CONTACT CUSTOMER SERVICE
WHAT CUSTOMERS CARE ABOUT?
CENTRAL NORDICS WEST
13
The way Customer Service Centers are organized affects their results
36
%
29
%
22
%
5%
8%
3,88
3,78
3,653,71
3,583,58
3,533,53
3,29
3,38
2,9
3,0
3,1
3,2
3,3
3,4
3,5
3,6
3,7
3,8
3,9
4,0
0%
5%
10%
15%
20%
25%
30%
35%
40%
Customer Services is
an independent unit
Part of business
operations
Part of the Sales
organisation
Part of the
Marketing
organisation
Other
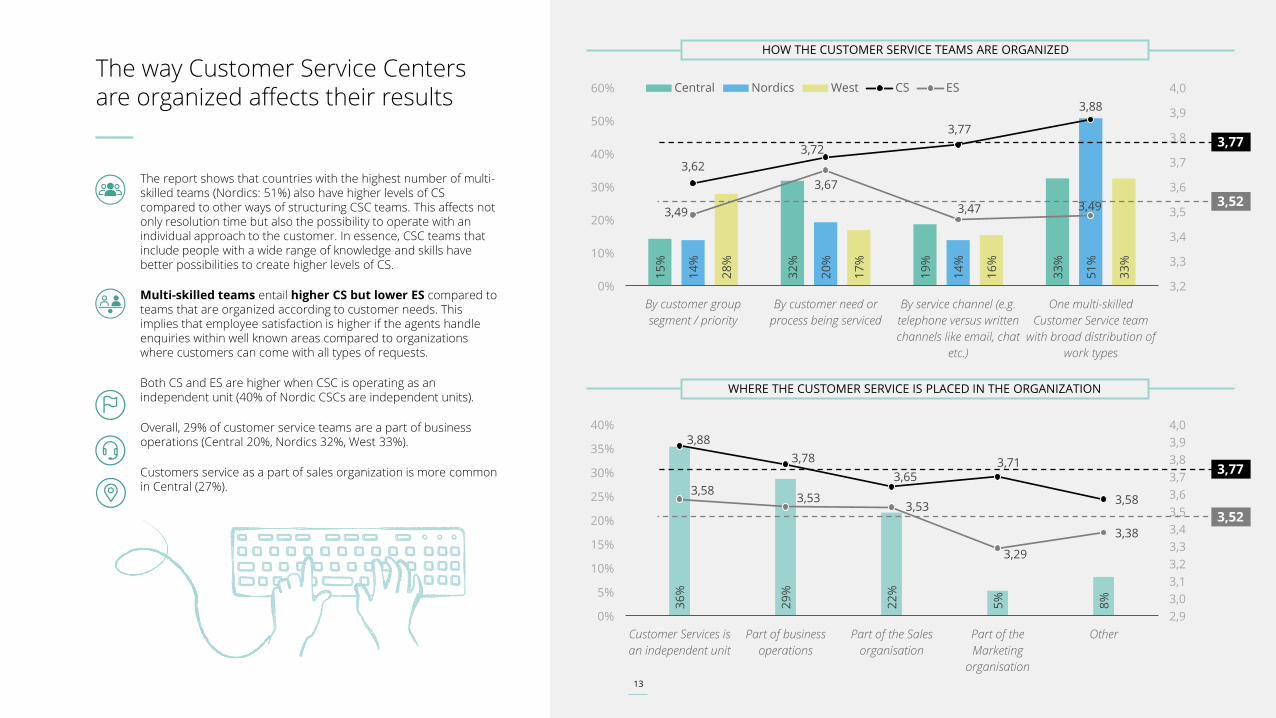
The report shows that countries with the highest number of multi-skilled teams (Nordics: 51%) also have higher levels of CS compared to other ways of structuring CSC teams. This affects not only resolution time but also the possibility to operate with an individual approach to the customer. In essence, CSC teams that include people with a wide range of knowledge and skills have better possibilities to create higher levels of CS.
Multi-skilled teams entail higher CS but lower ES compared to teams that are organized according to customer needs. This implies that employee satisfaction is higher if the agents handle enquiries within well known areas compared to organizations where customers can come with all types of requests.
Both CS and ES are higher when CSC is operating as an independent unit (40% of Nordic CSCs are independent units).
Overall, 29% of customer service teams are a part of business operations (Central 20%, Nordics 32%, West 33%).
Customers service as a part of sales organization is more common in Central (27%).
15
%
32
%
19
%
33
%
14
%
20
%
14
%
51
%
28
%
17
%
16
%
33
%
3,62
3,72
3,77
3,88
3,49
3,67
3,47 3,49
3,2
3,3
3,4
3,5
3,6
3,7
3,8
3,9
4,0
0%
10%
20%
30%
40%
50%
60%
By customer group
segment / priority
By customer need or
process being serviced
By service channel (e.g.
telephone versus written
channels like email, chat
etc.)
One multi-skilled
Customer Service team
with broad distribution of
work types
Central Nordics West CS ES
WHERE THE CUSTOMER SERVICE IS PLACED IN THE ORGANIZATION
3,77
3,52
3,77
3,52
13
HOW THE CUSTOMER SERVICE TEAMS ARE ORGANIZED
14
93
%
91
%
60
%
50
%
46
%
46
%
36
%
24
%
24
%
19
%
11
%
0%
10%
20%
30%
40%
50%
60%
70%
80%
90%
100%
Deep-dive on contact channels
E-m
ail
Ca
ll
Co
nta
ct f
orm
Ch
at
Cu
sto
mer
po
rta
l
SMS
Soci
al
Med
ia
Mo
bile
Ap
plic
ati
on
Vid
eo c
all
Web
site
fo
r n
ot
logged
in
cu
sto
mer
s
Oth
er c
ha
nn
els
80
%
82
%
53
%
23
%
38
%
35
%
23
%
14
%
16
%
13
%
9%
7%
35
%
11
%
11
%
1%
9% 3%
5% 2
5%
49
%
14
%
6%
29
%
16
%
0%
20%
40%
60%
80%
100%
Using Using & Investing Investing
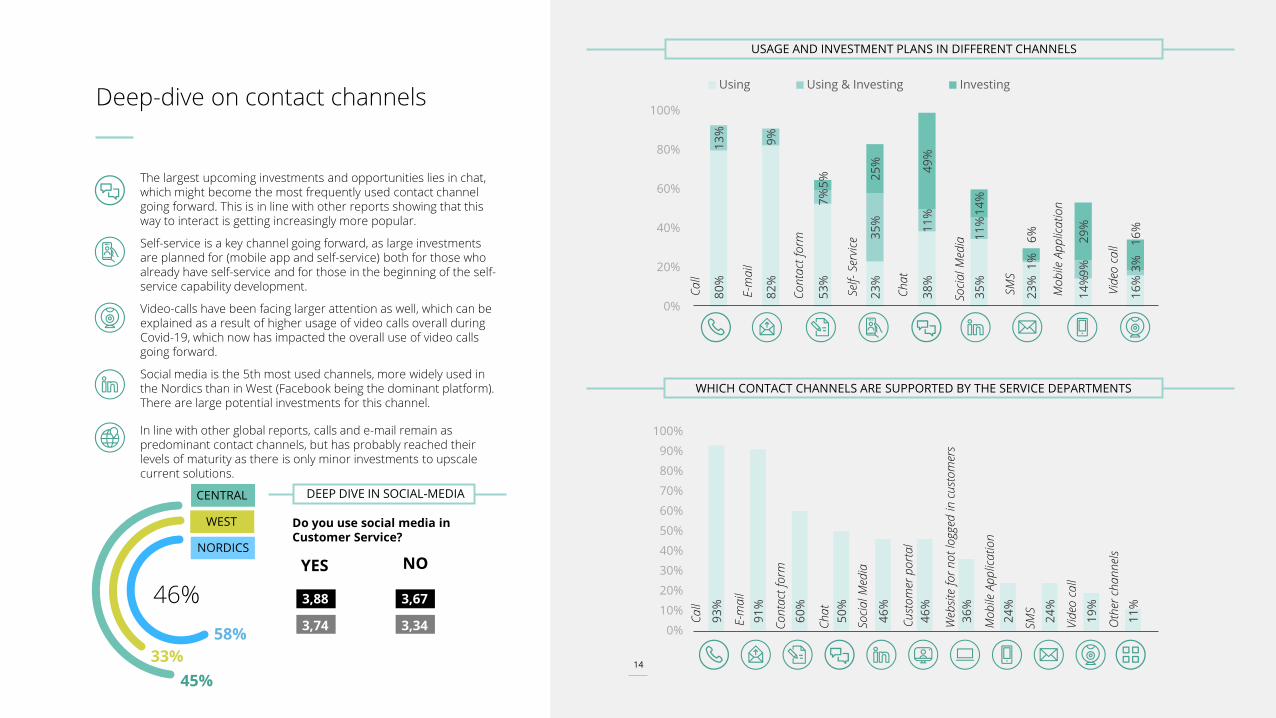
The largest upcoming investments and opportunities lies in chat, which might become the most frequently used contact channel going forward. This is in line with other reports showing that this way to interact is getting increasingly more popular.
Self-service is a key channel going forward, as large investments are planned for (mobile app and self-service) both for those who already have self-service and for those in the beginning of the self-service capability development.
Video-calls have been facing larger attention as well, which can be explained as a result of higher usage of video calls overall during Covid-19, which now has impacted the overall use of video calls going forward.
Social media is the 5th most used channels, more widely used in the Nordics than in West (Facebook being the dominant platform). There are large potential investments for this channel.
In line with other global reports, calls and e-mail remain as predominant contact channels, but has probably reached their levels of maturity as there is only minor investments to upscale current solutions.
Do you use social media in Customer Service?
E-m
ail
Ca
ll
Co
nta
ct f
orm
Ch
at
SMS
Soci
al
Med
ia
Mo
bile
Ap
plic
ati
on
Vid
eo c
all
Self-
Serv
ice
45%
33%
58%
46%
YES NO
WHICH CONTACT CHANNELS ARE SUPPORTED BY THE SERVICE DEPARTMENTS
3,88
3,74
3,67
3,34
USAGE AND INVESTMENT PLANS IN DIFFERENT CHANNELS
14
DEEP DIVE IN SOCIAL-MEDIACENTRAL
NORDICS
WEST
15
50%
55%
60%
63%
65%
CENTRAL
38%
CENTRAL
39%
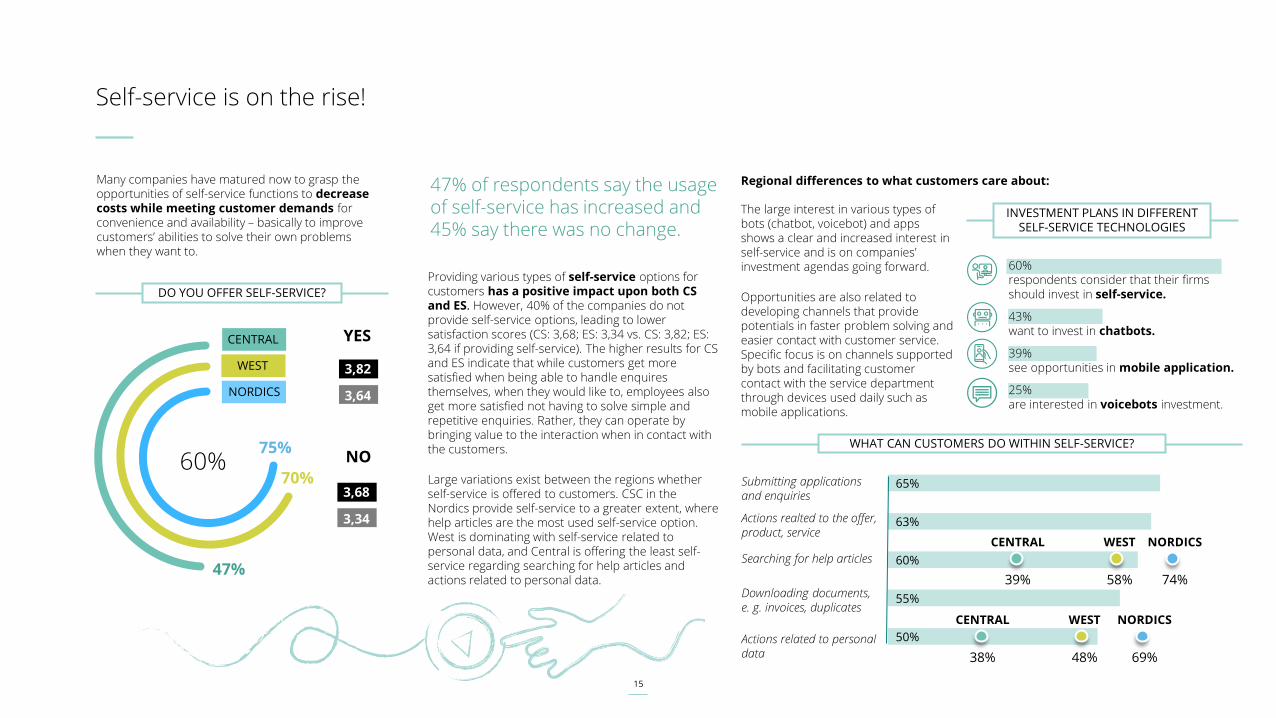
Self-service is on the rise!
60% respondents consider that their firms should invest in self-service.
43% want to invest in chatbots.
39% see opportunities in mobile application.
25% are interested in voicebots investment.
The large interest in various types of bots (chatbot, voicebot) and apps shows a clear and increased interest in self-service and is on companies’ investment agendas going forward.
Opportunities are also related to developing channels that provide potentials in faster problem solving and easier contact with customer service. Specific focus is on channels supported by bots and facilitating customer contact with the service department through devices used daily such as mobile applications.
Many companies have matured now to grasp the opportunities of self-service functions to decrease costs while meeting customer demands for convenience and availability – basically to improve customers’ abilities to solve their own problems when they want to.
Providing various types of self-service options for customers has a positive impact upon both CS and ES. However, 40% of the companies do not provide self-service options, leading to lower satisfaction scores (CS: 3,68; ES: 3,34 vs. CS: 3,82; ES: 3,64 if providing self-service). The higher results for CS and ES indicate that while customers get more satisfied when being able to handle enquires themselves, when they would like to, employees also get more satisfied not having to solve simple and repetitive enquiries. Rather, they can operate by bringing value to the interaction when in contact with the customers.
Large variations exist between the regions whether self-service is offered to customers. CSC in the Nordics provide self-service to a greater extent, where help articles are the most used self-service option. West is dominating with self-service related to personal data, and Central is offering the least self-service regarding searching for help articles and actions related to personal data.
47% of respondents say the usage of self-service has increased and 45% say there was no change.
47%
70%
75%60%
YES
3,82
3,64
NO
3,68
3,34
Regional differences to what customers care about:
WHAT CAN CUSTOMERS DO WITHIN SELF-SERVICE?
Submitting applications and enquiries
Actions realted to the offer, product, service
Searching for help articles
Downloading documents, e. g. invoices, duplicates
Actions related to personal data
WEST
58%
NORDICS
74%
WEST
48%
NORDICS
69%
DO YOU OFFER SELF-SERVICE?
INVESTMENT PLANS IN DIFFERENT SELF-SERVICE TECHNOLOGIES
CENTRAL
NORDICS
WEST
16
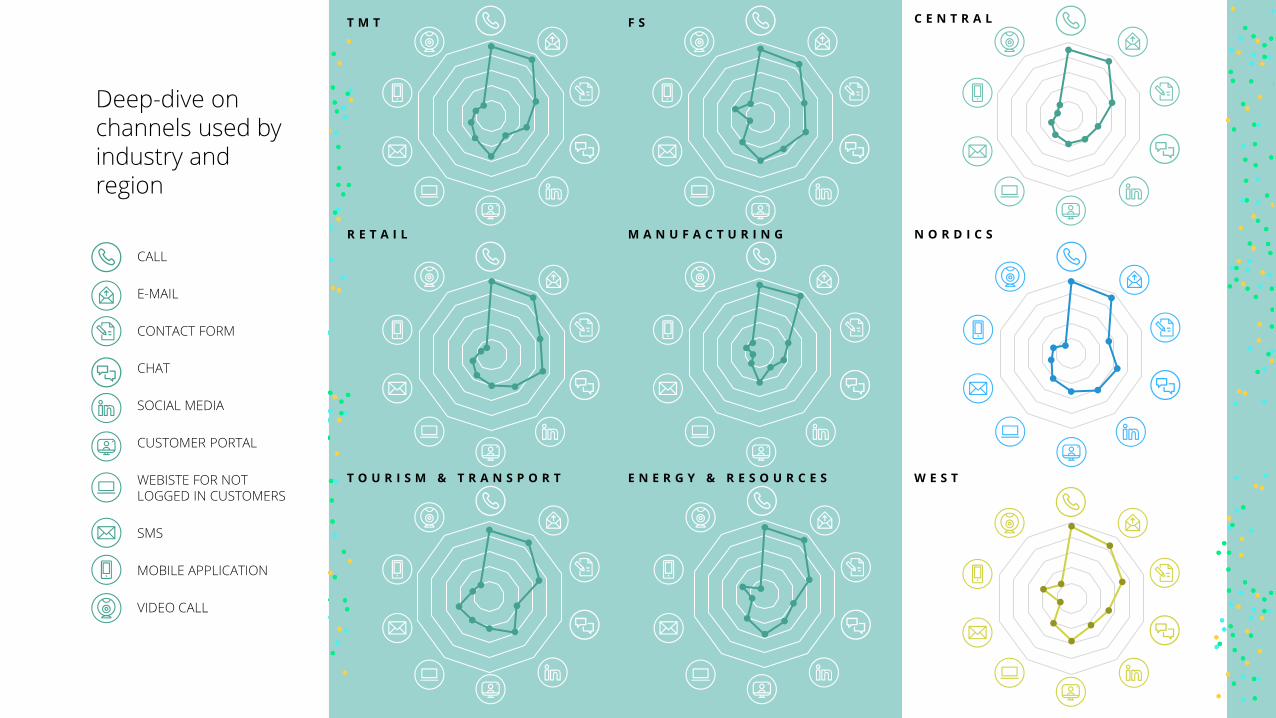
Deep-dive on channels used by industry and region
CALL
CONTACT FORM
CHAT
SOCIAL MEDIA
CUSTOMER PORTAL
WEBISTE FOR NOT LOGGED IN CUSTOMERS
SMS
MOBILE APPLICATION
VIDEO CALL
M A N U F A C T U R I N GR E T A I L
F ST M T
T O U R I S M & T R A N S P O R T E N E R G Y & R E S O U R C E S W E S T
N O R D I C S
C E N T R A L
17
04Employee perspective: How we resolve customer issues
18
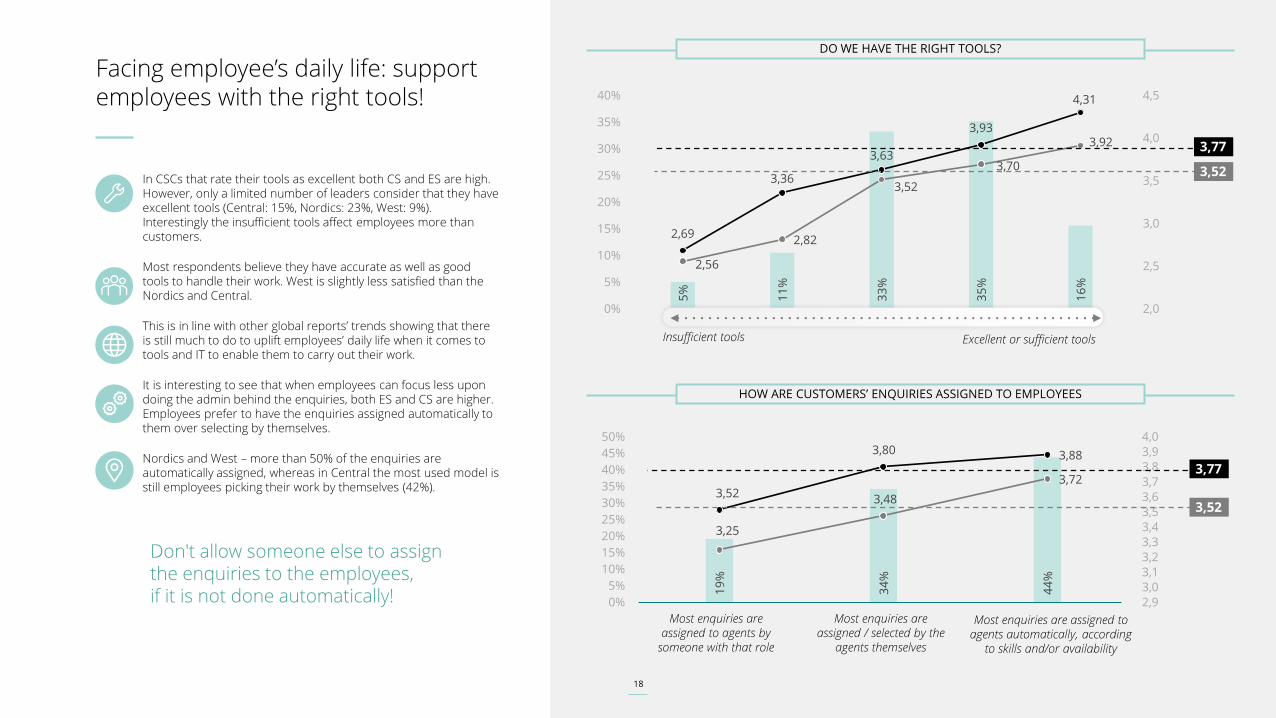
Facing employee’s daily life: support employees with the right tools!
5%
11
%
33
%
35
%
16
%
2,69
3,36
3,63
3,93
4,31
2,56
2,82
3,52
3,70
3,92
2,0
2,5
3,0
3,5
4,0
4,5
0%
5%
10%
15%
20%
25%
30%
35%
40%
19
%
34
%
44
%
3,52
3,80 3,88
3,25
3,48
3,72
2,9
3,03,13,2
3,33,4
3,5
3,63,7
3,83,9
4,0
0%
5%
10%
15%
20%
25%
30%
35%
40%
45%
50%
In CSCs that rate their tools as excellent both CS and ES are high. However, only a limited number of leaders consider that they have excellent tools (Central: 15%, Nordics: 23%, West: 9%). Interestingly the insufficient tools affect employees more than customers.
Most respondents believe they have accurate as well as good tools to handle their work. West is slightly less satisfied than the Nordics and Central.
This is in line with other global reports’ trends showing that there is still much to do to uplift employees’ daily life when it comes to tools and IT to enable them to carry out their work.
It is interesting to see that when employees can focus less upon doing the admin behind the enquiries, both ES and CS are higher. Employees prefer to have the enquiries assigned automatically to them over selecting by themselves.
Nordics and West – more than 50% of the enquiries are automatically assigned, whereas in Central the most used model is still employees picking their work by themselves (42%).
Don't allow someone else to assign the enquiries to the employees, if it is not done automatically!
DO WE HAVE THE RIGHT TOOLS?
Insufficient tools Excellent or sufficient tools
HOW ARE CUSTOMERS’ ENQUIRIES ASSIGNED TO EMPLOYEES
3,77
3,52
3,77
3,52
Most enquiries are assigned to agents by
someone with that role
Most enquiries are assigned / selected by the
agents themselves
Most enquiries are assigned to agents automatically, according
to skills and/or availability
18
19
What do we do to understand our employees and their satisfaction?
4%
7%
35
%
42
%
13
%
2,17
3,19
3,60
3,95
4,41
0,0
0,5
1,0
1,5
2,0
2,5
3,0
3,5
4,0
4,5
5,0
0%
5%
10%
15%
20%
25%
30%
35%
40%
45%
1 2 3 4 5
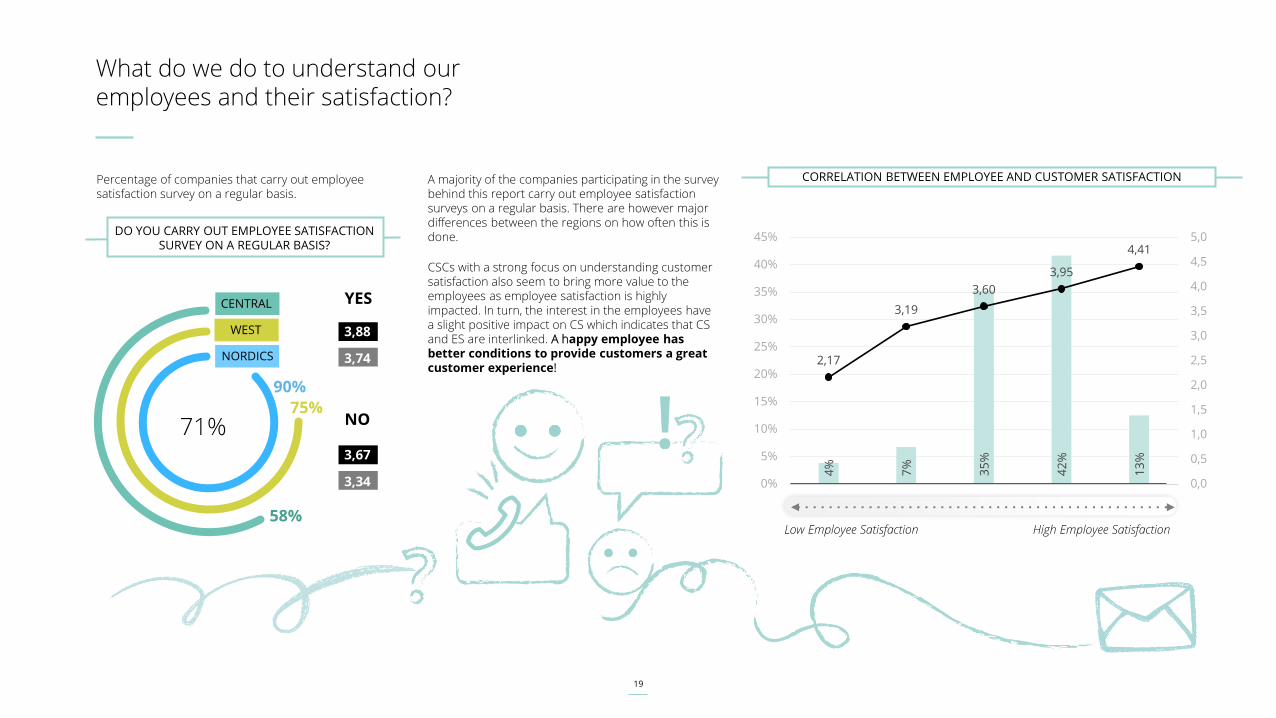
Percentage of companies that carry out employee satisfaction survey on a regular basis.
A majority of the companies participating in the survey behind this report carry out employee satisfaction surveys on a regular basis. There are however major differences between the regions on how often this is done.
CSCs with a strong focus on understanding customer satisfaction also seem to bring more value to the employees as employee satisfaction is highly impacted. In turn, the interest in the employees have a slight positive impact on CS which indicates that CS and ES are interlinked. A happy employee has better conditions to provide customers a great customer experience!
58%
75%
90%
71%
YES
3,88
3,74
NO
3,67
3,34
CORRELATION BETWEEN EMPLOYEE AND CUSTOMER SATISFACTION
Low Employee Satisfaction High Employee Satisfaction
DO YOU CARRY OUT EMPLOYEE SATISFACTION SURVEY ON A REGULAR BASIS?
CENTRAL
NORDICS
WEST
20
Employee empowerment through involvement
29
%
26
%
33
%
65
%
52
%
3,93
4,05
3,94
3,793,86
3,7
3,87
3,73
3,64 3,64
3,0
3,2
3,4
3,6
3,8
4,0
4,2
0%
10%
20%
30%
40%
50%
60%
70%
43
%
22
%
18
%
7%
9%
3,57
3,853,92
4,05
4,07
3,3
3,49
3,793,73
4,11
3,0
3,2
3,4
3,6
3,8
4,0
4,2
0%
5%
10%
15%
20%
25%
30%
35%
40%
45%
50%
1 2 3 4 5
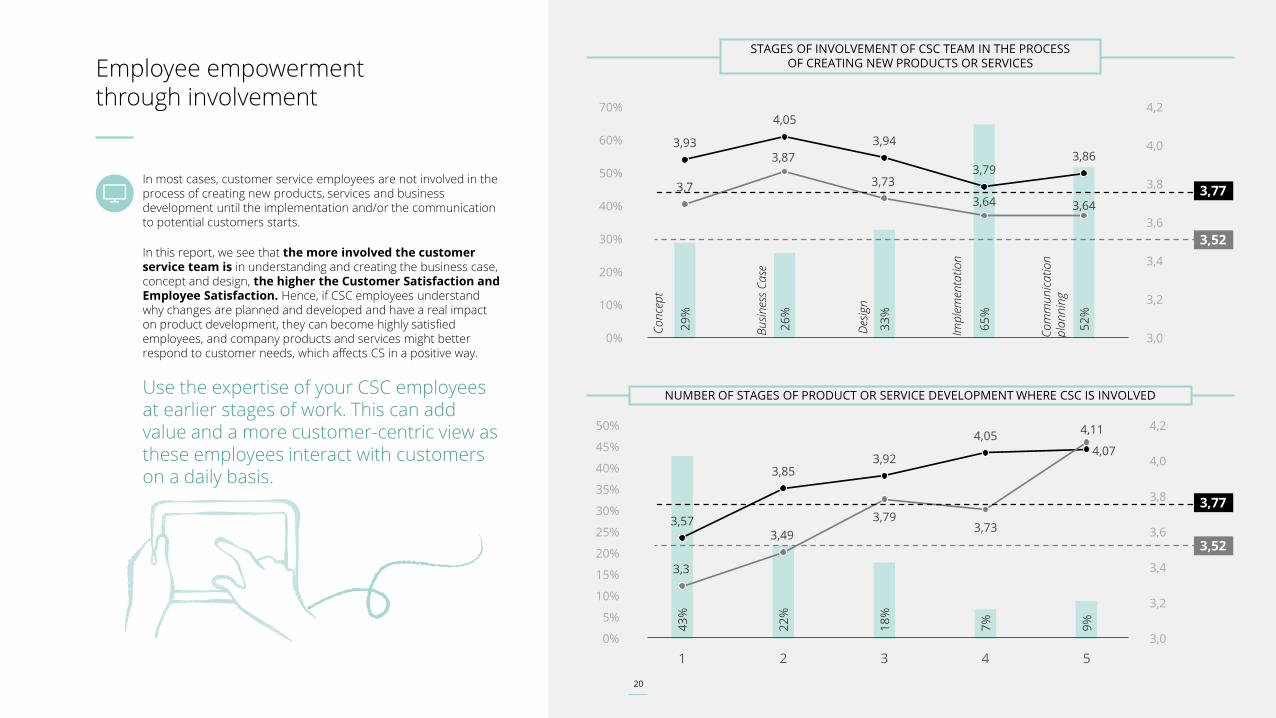
In most cases, customer service employees are not involved in the process of creating new products, services and business development until the implementation and/or the communication to potential customers starts.
In this report, we see that the more involved the customer service team is in understanding and creating the business case, concept and design, the higher the Customer Satisfaction and Employee Satisfaction. Hence, if CSC employees understand why changes are planned and developed and have a real impact on product development, they can become highly satisfied employees, and company products and services might better respond to customer needs, which affects CS in a positive way.
Use the expertise of your CSC employees at earlier stages of work. This can add value and a more customer-centric view as these employees interact with customers on a daily basis.
STAGES OF INVOLVEMENT OF CSC TEAM IN THE PROCESS OF CREATING NEW PRODUCTS OR SERVICES
NUMBER OF STAGES OF PRODUCT OR SERVICE DEVELOPMENT WHERE CSC IS INVOLVED
20
3,77
3,52
Co
nce
pt
Bu
sin
ess
Ca
se
Des
ign
Imp
lem
enta
tio
n
Co
mm
un
ica
tio
n
pla
nn
ing
3,77
3,52
21
05Manager perspective: CS, ES and KPIs - how we measure performance
22
Are we focusing on the right performance areas to succeed with Customer Satisfaction?
These are the most frequently used indicators to measure the performance of teams and individual employees:
1 2 3 4 5 6
23
%
16
%
24
%
18
%
11
%
8%
3,33
3,65
3,77
3,87
4,11 4,13
3,0
3,2
3,4
3,6
3,8
4,0
4,2
0%
10%
20%
30%
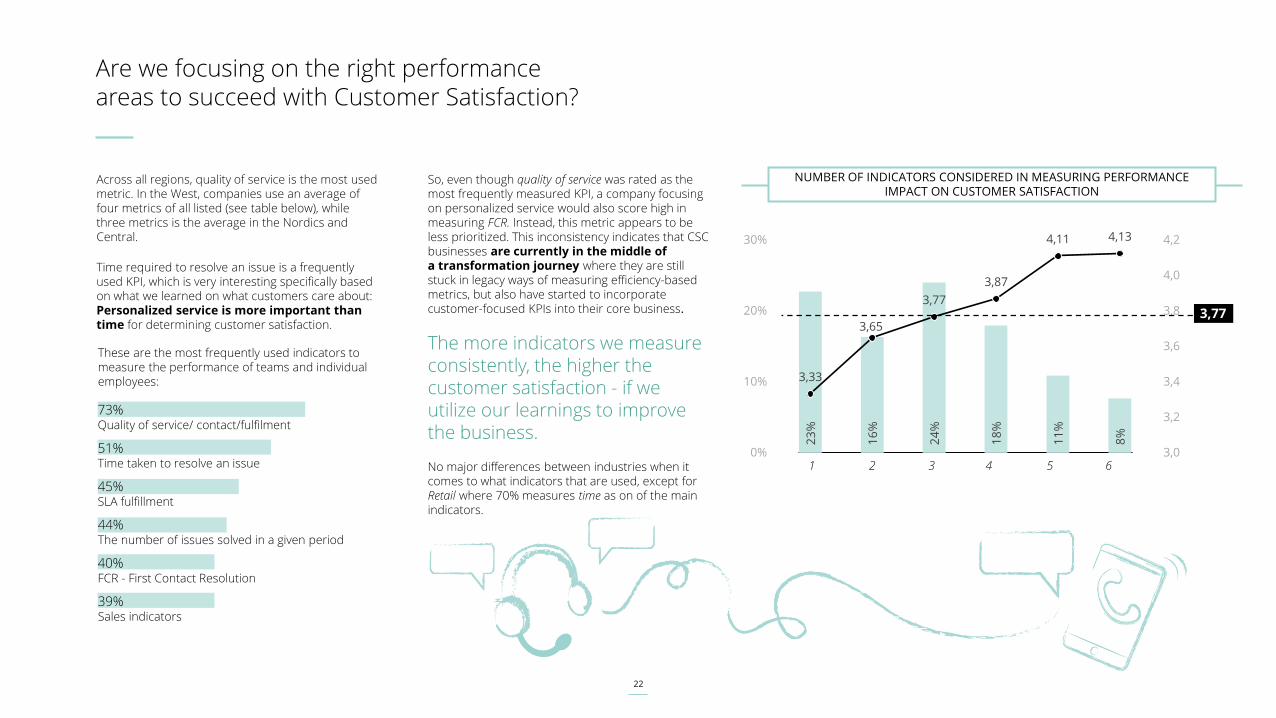
Across all regions, quality of service is the most used metric. In the West, companies use an average of four metrics of all listed (see table below), while three metrics is the average in the Nordics and Central.
Time required to resolve an issue is a frequently used KPI, which is very interesting specifically based on what we learned on what customers care about: Personalized service is more important than time for determining customer satisfaction.
NUMBER OF INDICATORS CONSIDERED IN MEASURING PERFORMANCE IMPACT ON CUSTOMER SATISFACTION
3,77
73% Quality of service/ contact/fulfilment
51% Time taken to resolve an issue
45% SLA fulfillment
44% The number of issues solved in a given period
40% FCR - First Contact Resolution
39% Sales indicators
So, even though quality of service was rated as the most frequently measured KPI, a company focusing on personalized service would also score high in measuring FCR. Instead, this metric appears to be less prioritized. This inconsistency indicates that CSC businesses are currently in the middle of a transformation journey where they are still stuck in legacy ways of measuring efficiency-based metrics, but also have started to incorporate customer-focused KPIs into their core business.
The more indicators we measure consistently, the higher the customer satisfaction - if we utilize our learnings to improve the business.
No major differences between industries when it comes to what indicators that are used, except for Retail where 70% measures time as on of the main indicators.
23
3,52
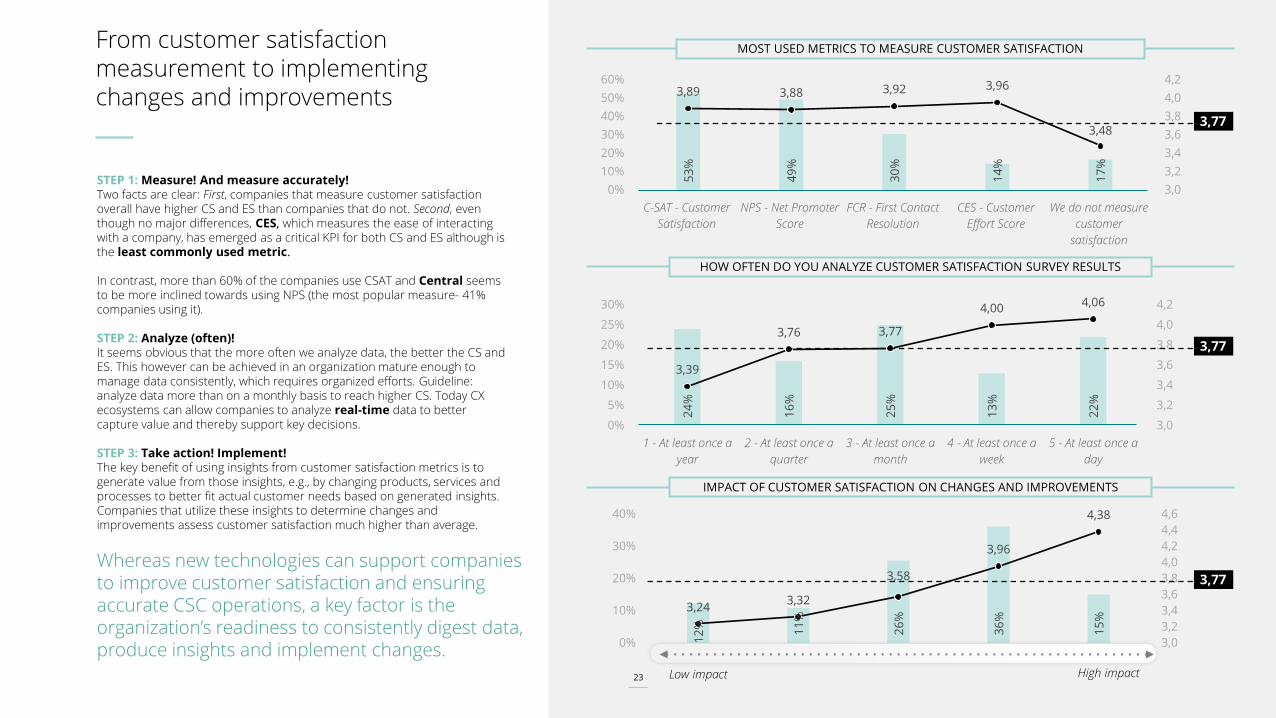
From customer satisfaction measurement to implementing changes and improvements
12
% 11
%
26
%
36
%
15
%
3,243,32
3,58
3,96
4,38
3,0
3,2
3,4
3,6
3,8
4,0
4,2
4,4
4,6
0%
10%
20%
30%
40%
24
%
16
%
25
%
13
%
22
%
3,39
3,76 3,77
4,004,06
3,0
3,2
3,4
3,6
3,8
4,0
4,2
0%
5%
10%
15%
20%
25%
30%
1 - At least once a
year
2 - At least once a
quarter
3 - At least once a
month
4 - At least once a
week
5 - At least once a
day
STEP 1: Measure! And measure accurately! Two facts are clear: First, companies that measure customer satisfaction overall have higher CS and ES than companies that do not. Second, even though no major differences, CES, which measures the ease of interacting with a company, has emerged as a critical KPI for both CS and ES although is the least commonly used metric.
In contrast, more than 60% of the companies use CSAT and Central seems to be more inclined towards using NPS (the most popular measure- 41% companies using it).
STEP 2: Analyze (often)!It seems obvious that the more often we analyze data, the better the CS and ES. This however can be achieved in an organization mature enough to manage data consistently, which requires organized efforts. Guideline: analyze data more than on a monthly basis to reach higher CS. Today CX ecosystems can allow companies to analyze real-time data to better capture value and thereby support key decisions.
STEP 3: Take action! Implement!The key benefit of using insights from customer satisfaction metrics is to generate value from those insights, e.g., by changing products, services and processes to better fit actual customer needs based on generated insights. Companies that utilize these insights to determine changes and improvements assess customer satisfaction much higher than average.
53
%
49
%
30
%
14
%
17
%
3,89 3,88 3,92 3,96
3,48
3,0
3,2
3,4
3,6
3,8
4,0
4,2
0%
10%
20%
30%
40%
50%
60%
C-SAT - Customer
Satisfaction
NPS - Net Promoter
Score
FCR - First Contact
Resolution
CES - Customer
Effort Score
We do not measure
customer
satisfaction
Whereas new technologies can support companies to improve customer satisfaction and ensuring accurate CSC operations, a key factor is the organization’s readiness to consistently digest data, produce insights and implement changes.
23
MOST USED METRICS TO MEASURE CUSTOMER SATISFACTION
HOW OFTEN DO YOU ANALYZE CUSTOMER SATISFACTION SURVEY RESULTS
3,77
Low impact High impact
3,77
IMPACT OF CUSTOMER SATISFACTION ON CHANGES AND IMPROVEMENTS
3,77
24
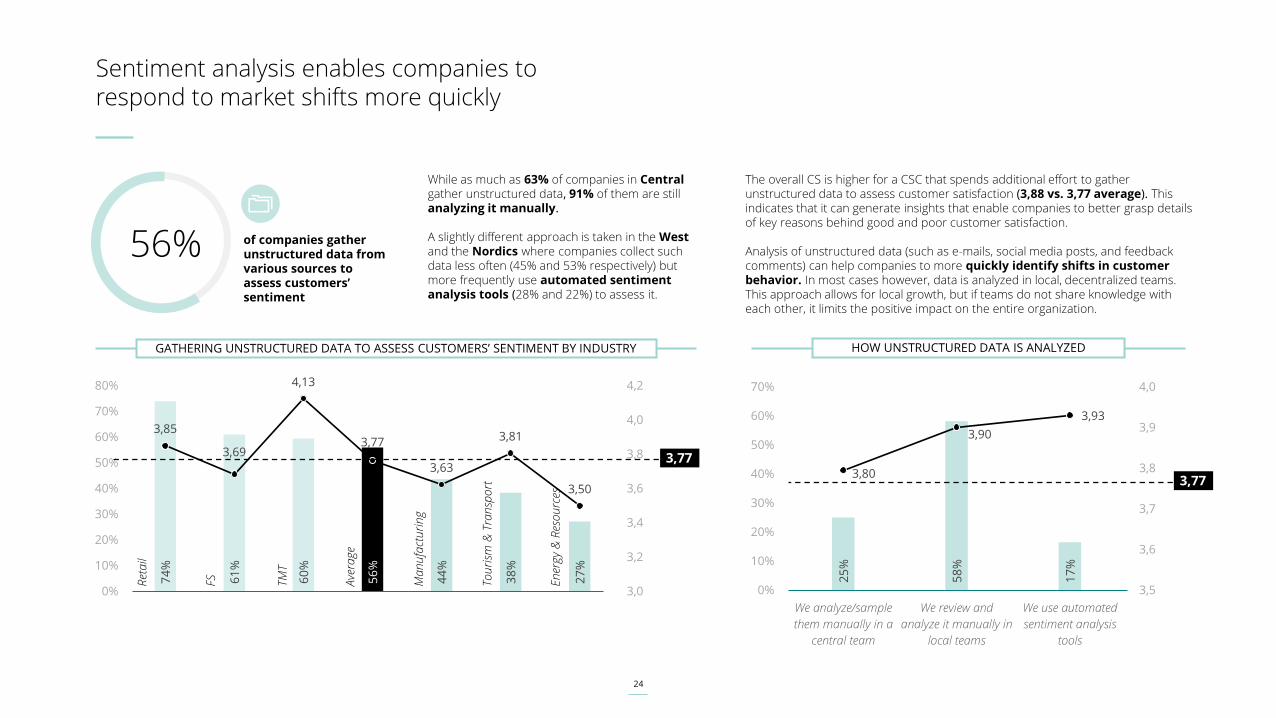
Sentiment analysis enables companies to respond to market shifts more quickly
56%
74
%
61
%
60
%
56
%
44
%
38
%
27
%
3,85
3,69
4,13
3,77
3,63
3,81
3,50
3,0
3,2
3,4
3,6
3,8
4,0
4,2
0%
10%
20%
30%
40%
50%
60%
70%
80%
The overall CS is higher for a CSC that spends additional effort to gather unstructured data to assess customer satisfaction (3,88 vs. 3,77 average). This indicates that it can generate insights that enable companies to better grasp details of key reasons behind good and poor customer satisfaction.
Analysis of unstructured data (such as e-mails, social media posts, and feedback comments) can help companies to more quickly identify shifts in customer behavior. In most cases however, data is analyzed in local, decentralized teams. This approach allows for local growth, but if teams do not share knowledge with each other, it limits the positive impact on the entire organization.
25
%
58
%
17
%
3,80
3,90
3,93
3,5
3,6
3,7
3,8
3,9
4,0
0%
10%
20%
30%
40%
50%
60%
70%
We analyze/sample
them manually in a
central team
We review and
analyze it manually in
local teams
We use automated
sentiment analysis
tools
While as much as 63% of companies in Central gather unstructured data, 91% of them are still analyzing it manually.
A slightly different approach is taken in the West and the Nordics where companies collect such data less often (45% and 53% respectively) but more frequently use automated sentiment analysis tools (28% and 22%) to assess it.
GATHERING UNSTRUCTURED DATA TO ASSESS CUSTOMERS’ SENTIMENT BY INDUSTRY
of companies gather unstructured data from various sources to assess customers’ sentiment
Ret
ail
FS TMT
Ave
rage
Ma
nu
fact
uri
ng
Tou
rism
& T
ran
spo
rt
En
ergy
& R
eso
urc
es
3,77
3,77
HOW UNSTRUCTURED DATA IS ANALYZED
25
06Board perspective: Priorities and upcoming investment plans
26
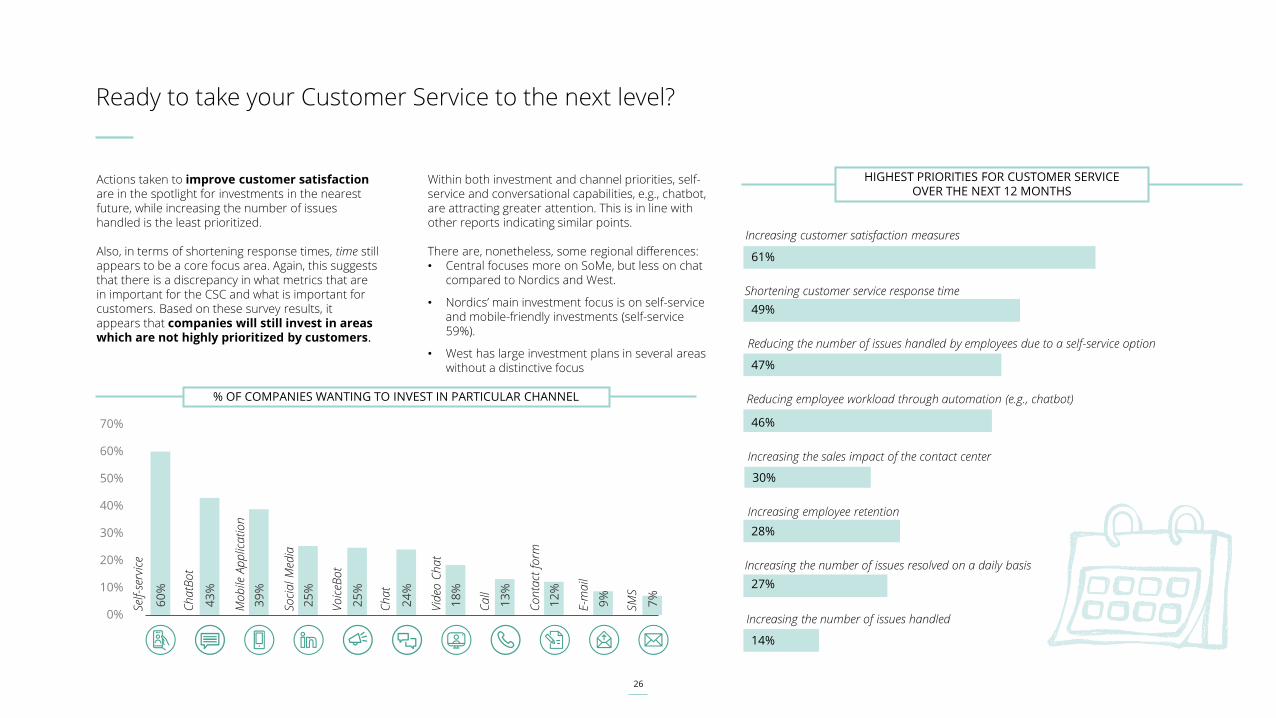
Ready to take your Customer Service to the next level?
Shortening customer service response time
49%
Increasing customer satisfaction measures
61%
Reducing the number of issues handled by employees due to a self-service option
47%
Reducing employee workload through automation (e.g., chatbot)
46%
Increasing the number of issues handled
14%
Increasing the number of issues resolved on a daily basis
27%
28%
Increasing employee retention
60
%
43
%
39
%
25
%
25
%
24
%
18
%
13
%
12
%
9%
7%
0%
10%
20%
30%
40%
50%
60%
70%
E-m
ail
Self-s
ervi
ce
Co
nta
ct f
orm
Ch
atB
ot
Ch
at
SMS
Soci
al
Med
ia
Mo
bile
Ap
plic
ati
on
Vo
iceB
ot
Actions taken to improve customer satisfaction are in the spotlight for investments in the nearest future, while increasing the number of issues handled is the least prioritized.
Also, in terms of shortening response times, time still appears to be a core focus area. Again, this suggests that there is a discrepancy in what metrics that are in important for the CSC and what is important for customers. Based on these survey results, it appears that companies will still invest in areas which are not highly prioritized by customers.
Within both investment and channel priorities, self-service and conversational capabilities, e.g., chatbot, are attracting greater attention. This is in line with other reports indicating similar points.
There are, nonetheless, some regional differences: • Central focuses more on SoMe, but less on chat
compared to Nordics and West.
• Nordics’ main investment focus is on self-service and mobile-friendly investments (self-service 59%).
• West has large investment plans in several areas without a distinctive focus
HIGHEST PRIORITIES FOR CUSTOMER SERVICE OVER THE NEXT 12 MONTHS
Vid
eo C
ha
t
Ca
ll
% OF COMPANIES WANTING TO INVEST IN PARTICULAR CHANNEL
Increasing the sales impact of the contact center
30%
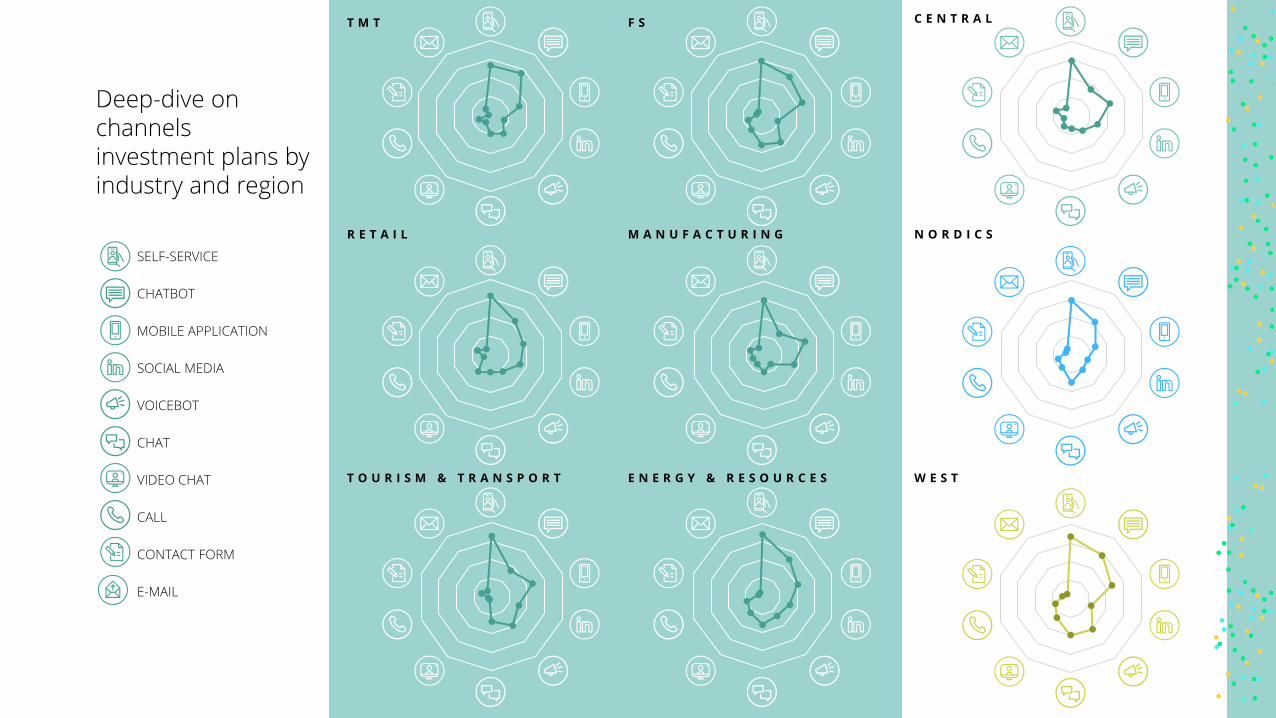
27
Deep-dive on channels investment plans by industry and region
SELF-SERVICE
CHATBOT
MOBILE APPLICATION
SOCIAL MEDIA
VOICEBOT
CHAT
VIDEO CHAT
CALL
CONTACT FORM
M A N U F A C T U R I N GR E T A I L
F ST M T
T O U R I S M & T R A N S P O R T E N E R G Y & R E S O U R C E S W E S T
N O R D I C S
C E N T R A L
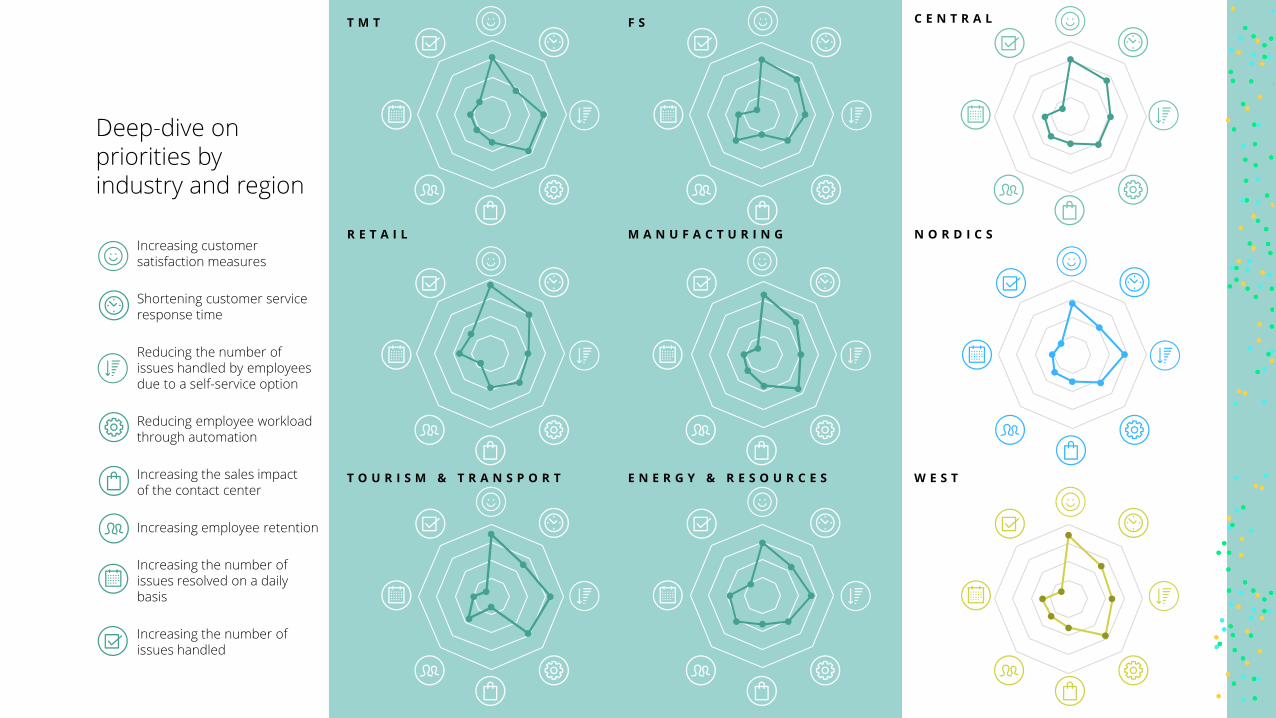
28
Deep-dive on priorities by industry and region
Increasing customer satisfaction measures
Shortening customer service response time
Reducing the number of issues handled by employees due to a self-service option
Reducing employee workload through automation
Increasing the sales impact of the contact center
Increasing employee retention
Increasing the number of issues resolved on a daily basis
Increasing the number of issues handled
M A N U F A C T U R I N GR E T A I L
F ST M T
T O U R I S M & T R A N S P O R T E N E R G Y & R E S O U R C E S W E S T
N O R D I C S
C E N T R A L
29
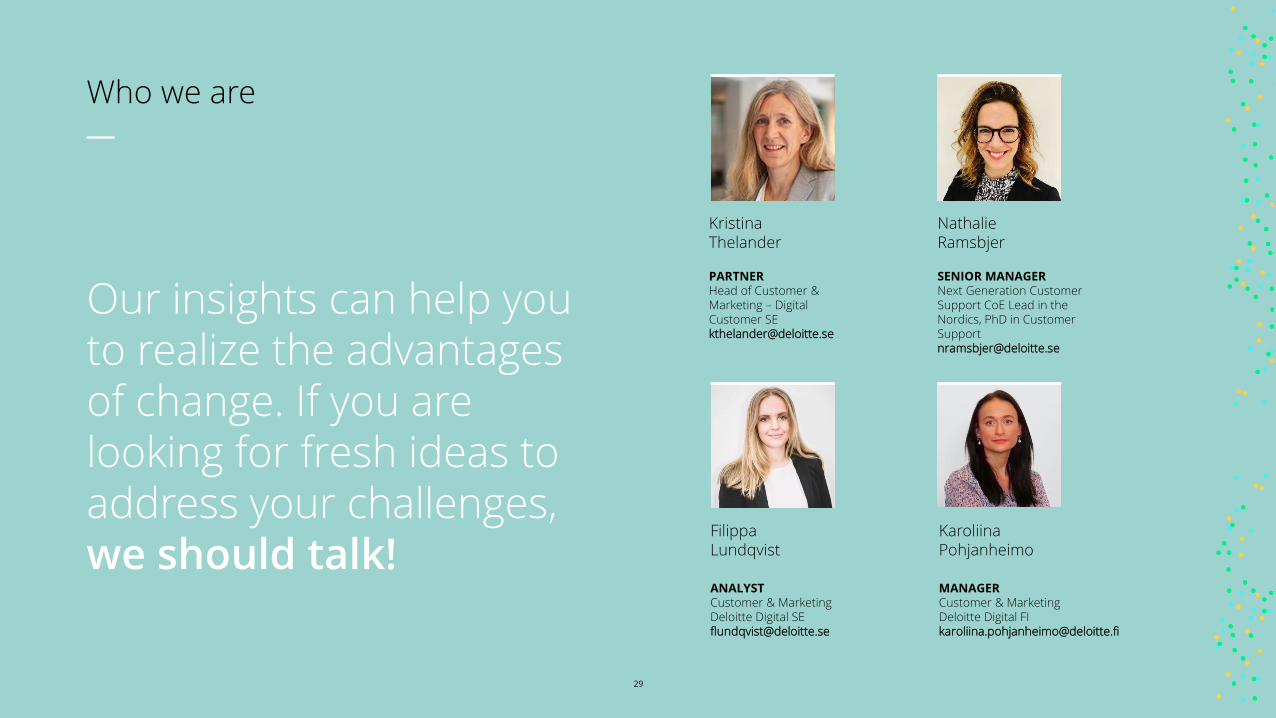
Filippa Lundqvist
ANALYSTCustomer & MarketingDeloitte Digital [email protected]
Kristina Thelander
PARTNERHead of Customer & Marketing – Digital Customer [email protected]
Nathalie Ramsbjer
SENIOR MANAGERNext Generation Customer Support CoE Lead in the Nordics, PhD in Customer [email protected]
KaroliinaPohjanheimo
MANAGERCustomer & MarketingDeloitte Digital [email protected]
Our insights can help you to realize the advantages of change. If you are looking for fresh ideas to address your challenges, we should talk!
Who we are
Deloitte refers to one or more of Deloitte Touche Tohmatsu Limited (“DTTL”), its global network of member firms, and their related entities (collectively, the
“Deloitte organization”). DTTL (also referred to as “Deloitte Global”) and each of its member firms and related entities are legally separate and independent
entities, which cannot obligate or bind each other in respect of third parties. DTTL and each DTTL member firm and related entity is liable only for its own acts
and omissions, and not those of each other. DTTL does not provide services to clients. Please see www.deloitte.com/about to learn more.
Deloitte provides industry-leading audit and assurance, tax and legal, consulting, financial advisory, and risk advisory services to nearly 90% of the Fortune
Global 500® and thousands of private companies. Our professionals deliver measurable and lasting results that help reinforce public trust in capital markets,
enable clients to transform and thrive, and lead the way toward a stronger economy, a more equitable society and a sustainable world. Building on its 175-plus
year history, Deloitte spans more than 150 countries and territories. Learn how Deloitte’s more than 345,000 people worldwide make an impact that matters at
www.deloitte.com.
Our advice is prepared solely for the use of the client. You may not disclose it or its contents to any other person without our prior written consent. No other
person may rely on the advice and we accept no responsibility to any other person.
© 2022 For more information, contact Deloitte AB.
Thank you.
Related Documents


