Limpopo Province - Office of the Premier - Customer Satisfaction Survey Internal Survey Chart: 1 Overall SL Percentage By Province by District for all Departments & Principles combined 60.9 55.9 55.7 53.9 53.5 48.3 54.7 0.0 10.0 20.0 30.0 40.0 50.0 60.0 70.0 Province / District Bohlabela Capricorn Mopani Sekhukhune Vhembe Waterberg Province

Welcome message from author
This document is posted to help you gain knowledge. Please leave a comment to let me know what you think about it! Share it to your friends and learn new things together.
Transcript
Limpopo Province - Office of the Premier - Customer Satisfaction Survey
Internal Survey
Chart: 1
Overall SL Percentage
By Province by District
for all Departments & Principles combined
60.9
55.9 55.753.9 53.5
48.3
54.7
0.0
10.0
20.0
30.0
40.0
50.0
60.0
70.0
Province / District
Bohlabela
Capricorn
Mopani
Sekhukhune
Vhembe
Waterberg
Province
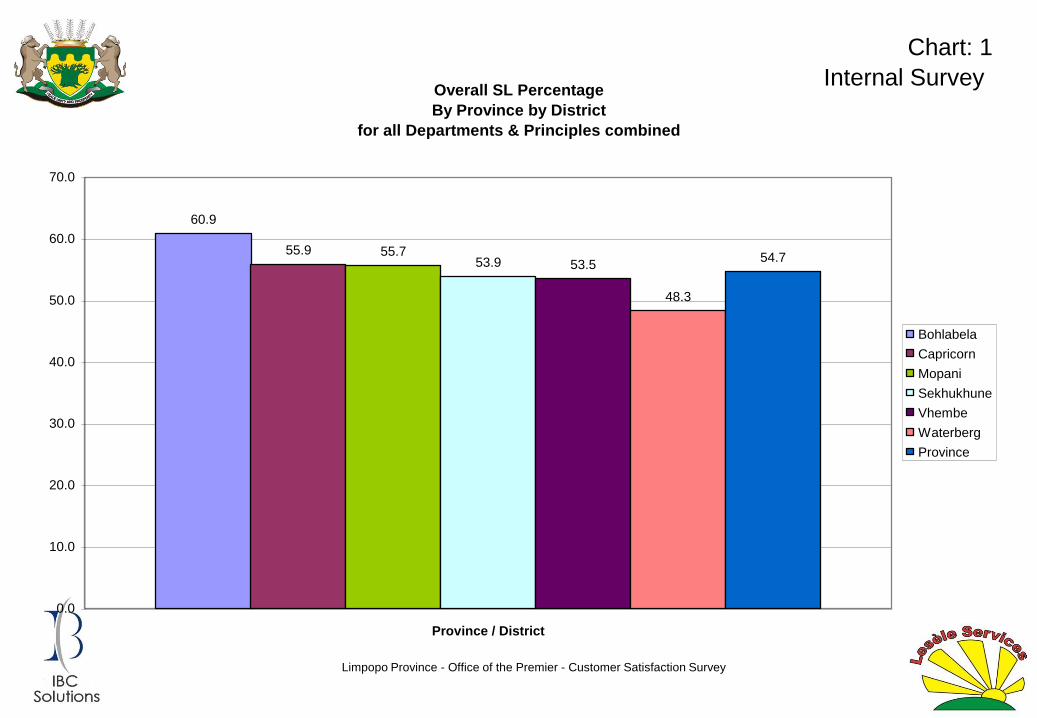
Limpopo Province - Office of the Premier - Customer Satisfaction Survey
Internal Survey
Chart: 2
SL Percentage
by Province by Department
for all Districts and Principles combined
51.2 51.0
57.6
50.9
37.4
68.4
65.3
44.7 44.3
37.3
54.6
0.0
10.0
20.0
30.0
40.0
50.0
60.0
70.0
80.0
Department / District
Agriculture
Education
Finance & Economic Development
Health & Welfare
Local Government & Housing
Office of the Premier
Public Works
Safety, Security & Liaison
Sport, Arts & Culture
Transport
Province
Limpopo Province - Office of the Premier - Customer Satisfaction Survey
Internal Survey
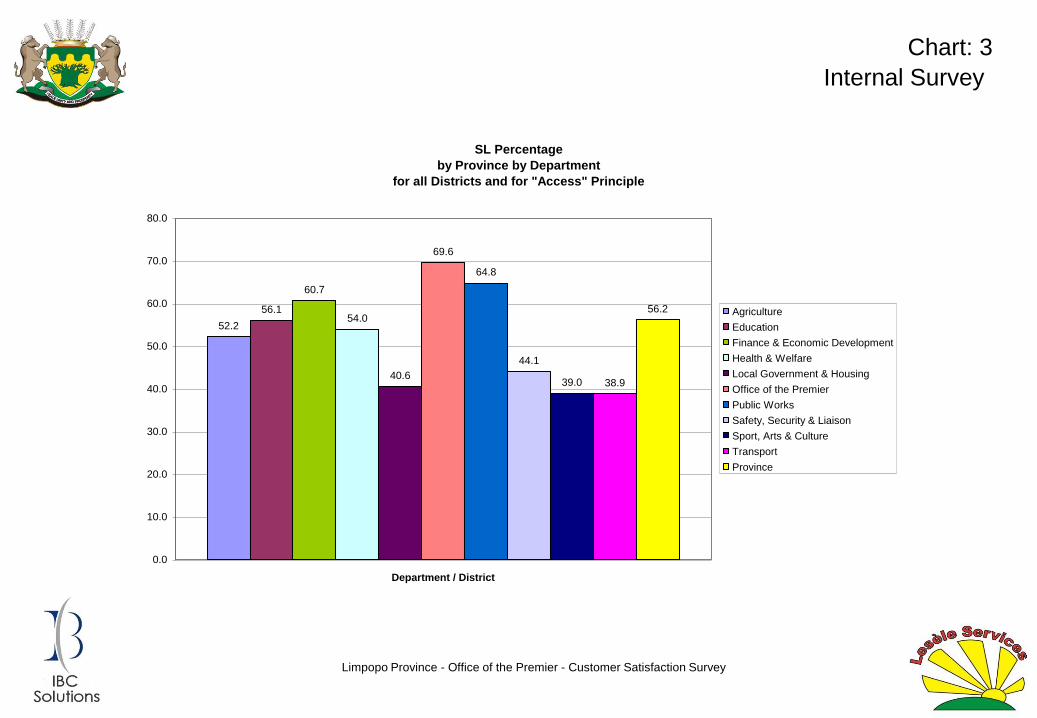
Chart: 3
SL Percentage
by Province by Department
for all Districts and for "Access" Principle
52.2
56.1
60.7
54.0
40.6
69.6
64.8
44.1
39.0 38.9
56.2
0.0
10.0
20.0
30.0
40.0
50.0
60.0
70.0
80.0
Department / District
Agriculture
Education
Finance & Economic Development
Health & Welfare
Local Government & Housing
Office of the Premier
Public Works
Safety, Security & Liaison
Sport, Arts & Culture
Transport
Province
Limpopo Province - Office of the Premier - Customer Satisfaction Survey
Internal Survey
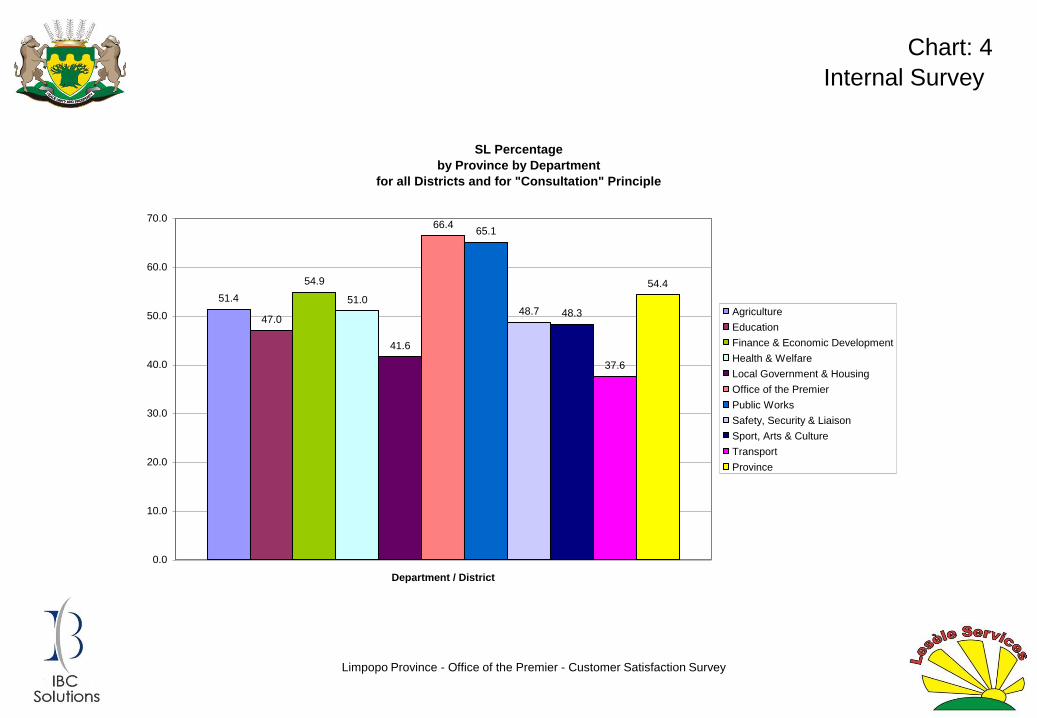
Chart: 4
SL Percentage
by Province by Department
for all Districts and for "Consultation" Principle
51.4
47.0
54.9
51.0
41.6
66.465.1
48.7 48.3
37.6
54.4
0.0
10.0
20.0
30.0
40.0
50.0
60.0
70.0
Department / District
Agriculture
Education
Finance & Economic Development
Health & Welfare
Local Government & Housing
Office of the Premier
Public Works
Safety, Security & Liaison
Sport, Arts & Culture
Transport
Province
Limpopo Province - Office of the Premier - Customer Satisfaction Survey
Internal Survey
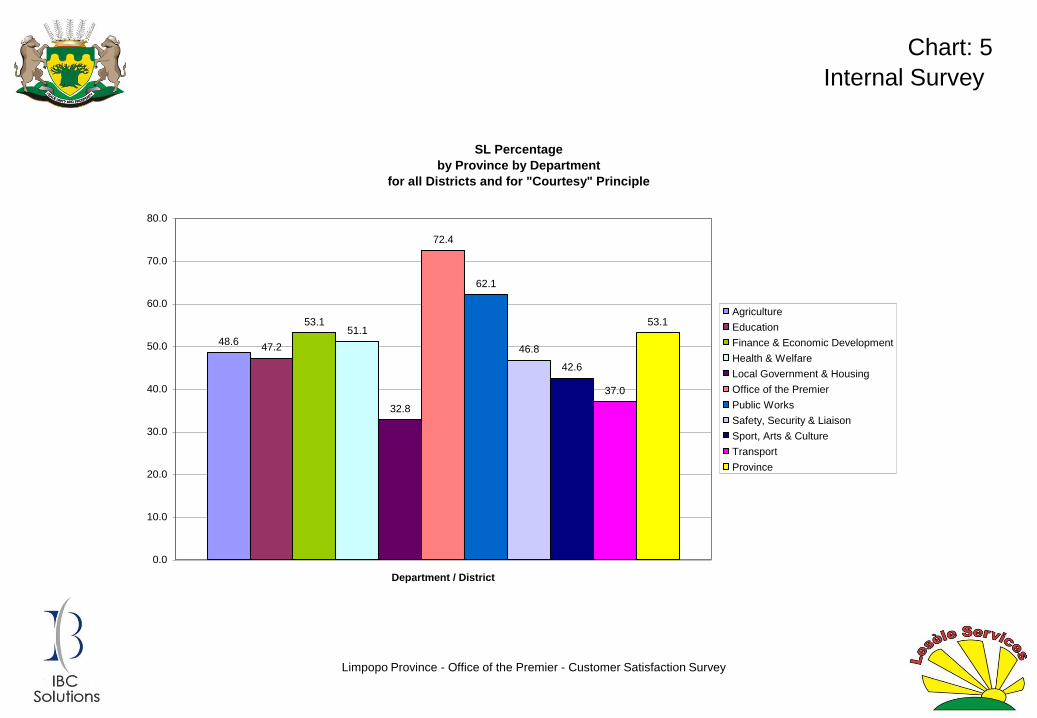
Chart: 5
SL Percentage
by Province by Department
for all Districts and for "Courtesy" Principle
48.647.2
53.151.1
32.8
72.4
62.1
46.8
42.6
37.0
53.1
0.0
10.0
20.0
30.0
40.0
50.0
60.0
70.0
80.0
Department / District
Agriculture
Education
Finance & Economic Development
Health & Welfare
Local Government & Housing
Office of the Premier
Public Works
Safety, Security & Liaison
Sport, Arts & Culture
Transport
Province
Limpopo Province - Office of the Premier - Customer Satisfaction Survey
Internal Survey
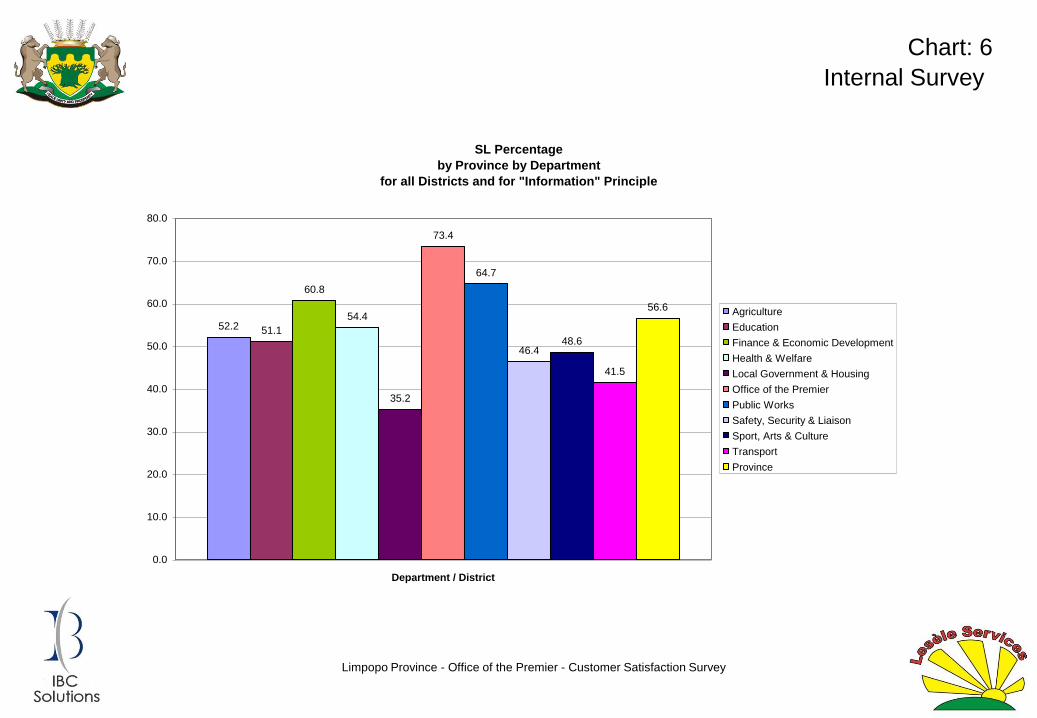
Chart: 6
SL Percentage
by Province by Department
for all Districts and for "Information" Principle
52.2 51.1
60.8
54.4
35.2
73.4
64.7
46.448.6
41.5
56.6
0.0
10.0
20.0
30.0
40.0
50.0
60.0
70.0
80.0
Department / District
Agriculture
Education
Finance & Economic Development
Health & Welfare
Local Government & Housing
Office of the Premier
Public Works
Safety, Security & Liaison
Sport, Arts & Culture
Transport
Province

Limpopo Province - Office of the Premier - Customer Satisfaction Survey
Internal Survey
Chart: 7
SL Percentage
by Province by Department
for all Districts and for "Openness & Transparency" Principle
50.9
54.2
62.5
53.1
39.0
70.868.1
47.946.6
41.6
57.2
0.0
10.0
20.0
30.0
40.0
50.0
60.0
70.0
80.0
Department / District
Agriculture
Education
Finance & Economic Development
Health & Welfare
Local Government & Housing
Office of the Premier
Public Works
Safety, Security & Liaison
Sport, Arts & Culture
Transport
Province
Limpopo Province - Office of the Premier - Customer Satisfaction Survey
Internal Survey
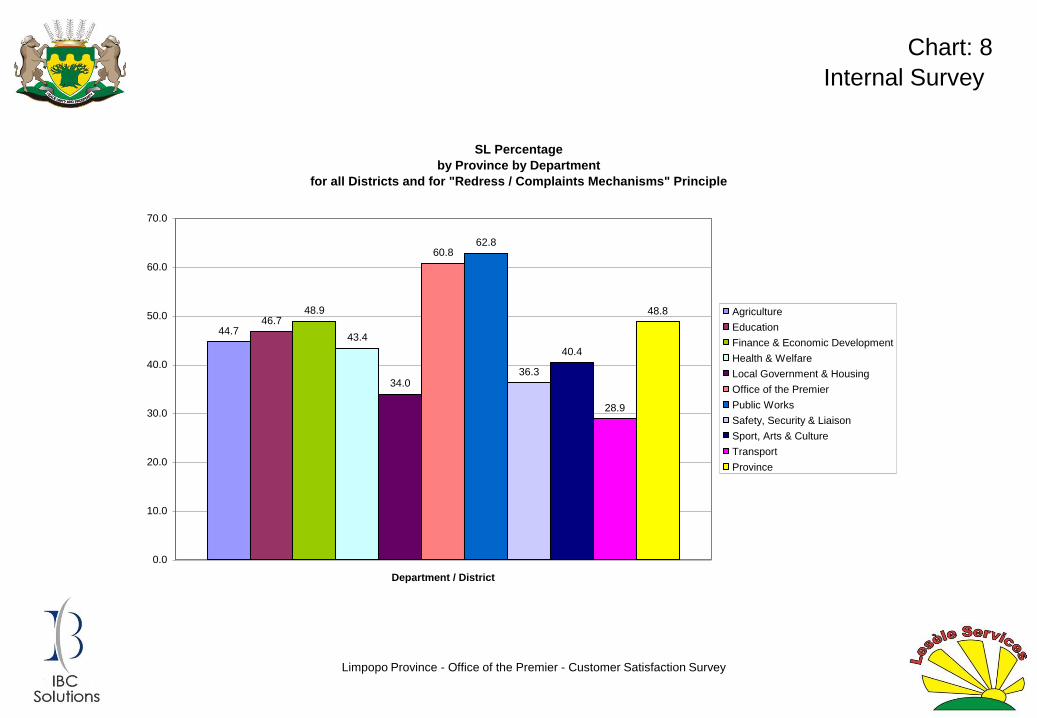
Chart: 8
SL Percentage
by Province by Department
for all Districts and for "Redress / Complaints Mechanisms" Principle
44.746.7
48.9
43.4
34.0
60.862.8
36.3
40.4
28.9
48.8
0.0
10.0
20.0
30.0
40.0
50.0
60.0
70.0
Department / District
Agriculture
Education
Finance & Economic Development
Health & Welfare
Local Government & Housing
Office of the Premier
Public Works
Safety, Security & Liaison
Sport, Arts & Culture
Transport
Province
Limpopo Province - Office of the Premier - Customer Satisfaction Survey
Internal Survey
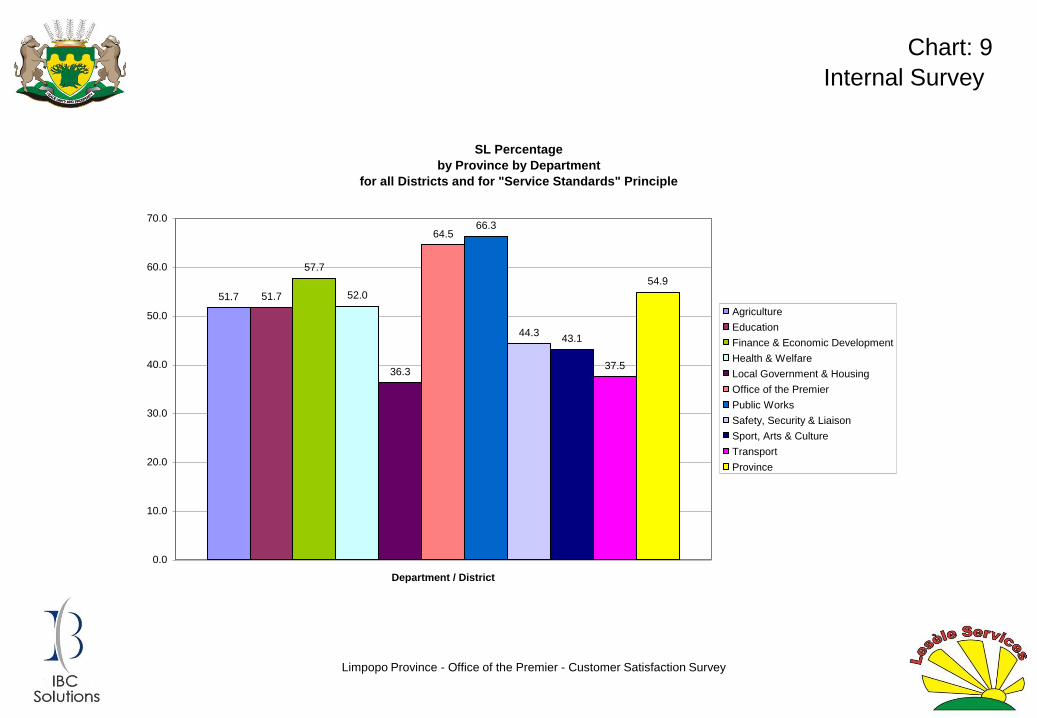
Chart: 9
SL Percentage
by Province by Department
for all Districts and for "Service Standards" Principle
51.7 51.7
57.7
52.0
36.3
64.566.3
44.343.1
37.5
54.9
0.0
10.0
20.0
30.0
40.0
50.0
60.0
70.0
Department / District
Agriculture
Education
Finance & Economic Development
Health & Welfare
Local Government & Housing
Office of the Premier
Public Works
Safety, Security & Liaison
Sport, Arts & Culture
Transport
Province
Limpopo Province - Office of the Premier - Customer Satisfaction Survey
Internal Survey
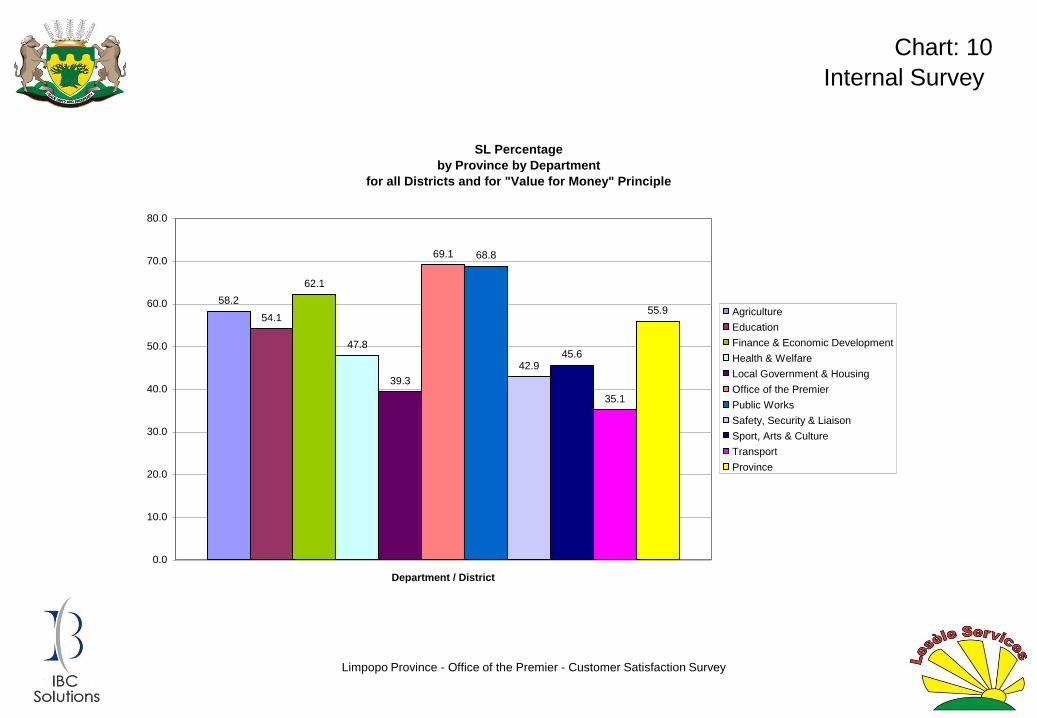
Chart: 10
SL Percentage
by Province by Department
for all Districts and for "Value for Money" Principle
58.2
54.1
62.1
47.8
39.3
69.1 68.8
42.945.6
35.1
55.9
0.0
10.0
20.0
30.0
40.0
50.0
60.0
70.0
80.0
Department / District
Agriculture
Education
Finance & Economic Development
Health & Welfare
Local Government & Housing
Office of the Premier
Public Works
Safety, Security & Liaison
Sport, Arts & Culture
Transport
Province
Limpopo Province - Office of the Premier - Customer Satisfaction Survey
Internal Survey
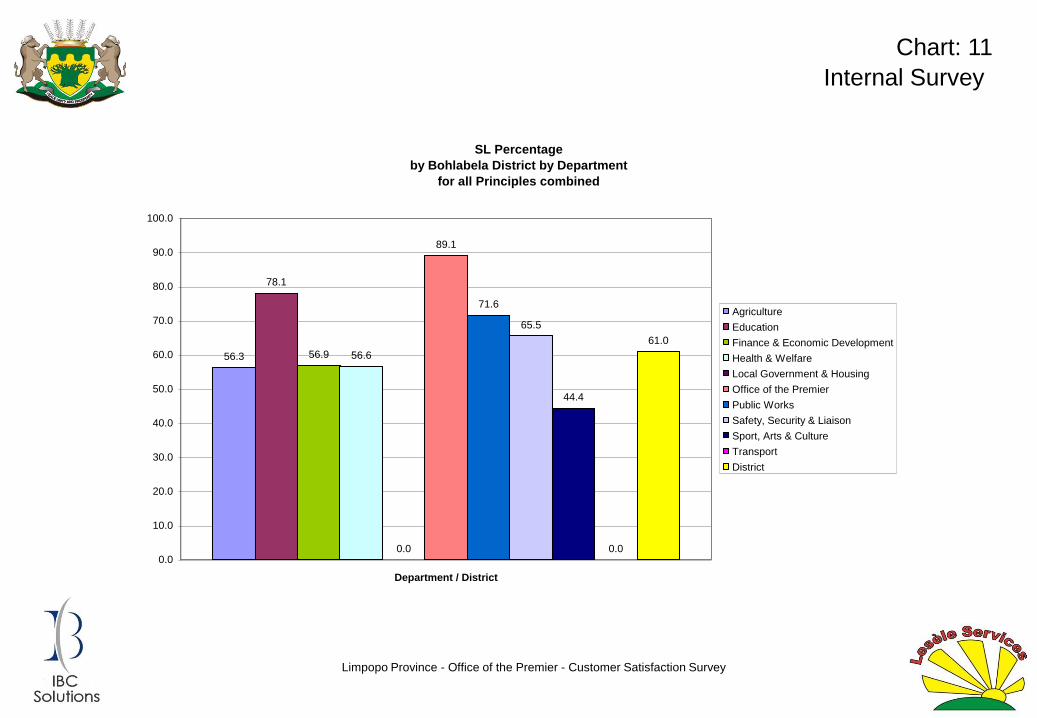
Chart: 11
SL Percentage
by Bohlabela District by Department
for all Principles combined
56.3
78.1
56.9 56.6
0.0
89.1
71.6
65.5
44.4
0.0
61.0
0.0
10.0
20.0
30.0
40.0
50.0
60.0
70.0
80.0
90.0
100.0
Department / District
Agriculture
Education
Finance & Economic Development
Health & Welfare
Local Government & Housing
Office of the Premier
Public Works
Safety, Security & Liaison
Sport, Arts & Culture
Transport
District

Limpopo Province - Office of the Premier - Customer Satisfaction Survey
Internal Survey
Chart: 12
SL Percentage
by Bohlabela District by Department
for "Access" Principle
59.4
79.2
53.8
60.2
0.0
90.6
67.4
56.3
40.6
0.0
61.2
0.0
10.0
20.0
30.0
40.0
50.0
60.0
70.0
80.0
90.0
100.0
Department / District
Agriculture
Education
Finance & Economic Development
Health & Welfare
Local Government & Housing
Office of the Premier
Public Works
Safety, Security & Liaison
Sport, Arts & Culture
Transport
District

Limpopo Province - Office of the Premier - Customer Satisfaction Survey
Internal Survey
Chart: 13
SL Percentage
by Bohlabela District by Department
for "Consultation" Principle
56.0
62.5
58.4
49.3
0.0
87.5
66.0
86.4
52.3
0.0
57.3
0.0
10.0
20.0
30.0
40.0
50.0
60.0
70.0
80.0
90.0
100.0
Department / District
Agriculture
Education
Finance & Economic Development
Health & Welfare
Local Government & Housing
Office of the Premier
Public Works
Safety, Security & Liaison
Sport, Arts & Culture
Transport
District

Limpopo Province - Office of the Premier - Customer Satisfaction Survey
Internal Survey
Chart: 14
SL Percentage
by Bohlabela District by Department
for "Courtesy" Principle
55.4
77.3
49.4
55.2
0.0
91.7
71.268.8
45.8
0.0
59.2
0.0
10.0
20.0
30.0
40.0
50.0
60.0
70.0
80.0
90.0
100.0
Department / District
Agriculture
Education
Finance & Economic Development
Health & Welfare
Local Government & Housing
Office of the Premier
Public Works
Safety, Security & Liaison
Sport, Arts & Culture
Transport
District
Limpopo Province - Office of the Premier - Customer Satisfaction Survey
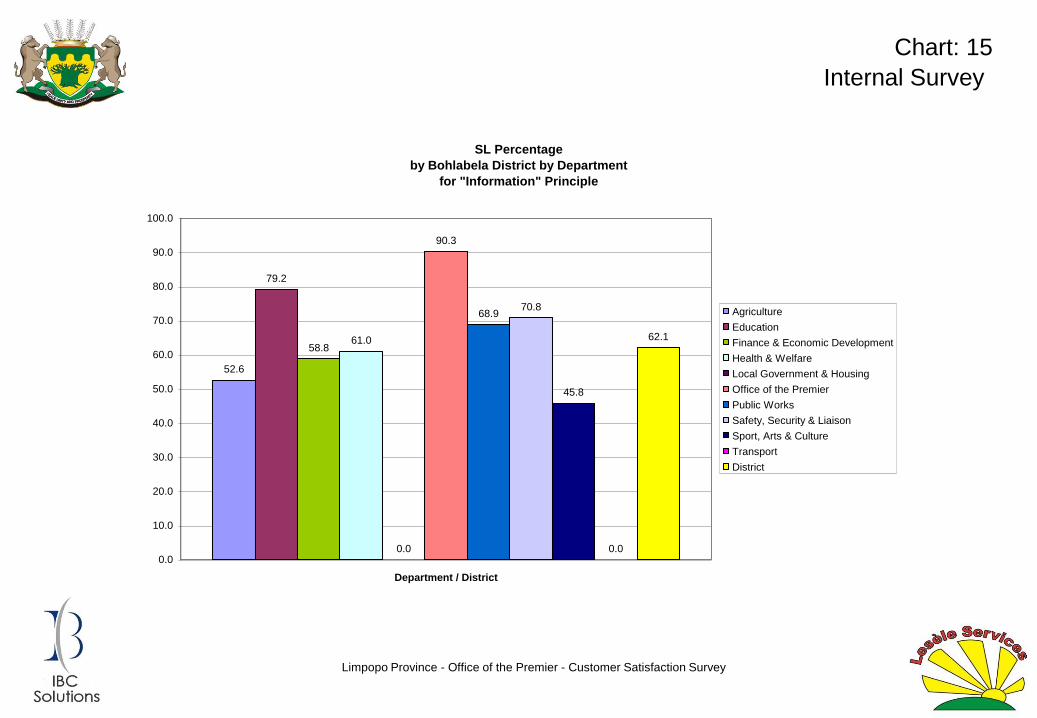
Internal Survey
Chart: 15
SL Percentage
by Bohlabela District by Department
for "Information" Principle
52.6
79.2
58.861.0
0.0
90.3
68.970.8
45.8
0.0
62.1
0.0
10.0
20.0
30.0
40.0
50.0
60.0
70.0
80.0
90.0
100.0
Department / District
Agriculture
Education
Finance & Economic Development
Health & Welfare
Local Government & Housing
Office of the Premier
Public Works
Safety, Security & Liaison
Sport, Arts & Culture
Transport
District
Limpopo Province - Office of the Premier - Customer Satisfaction Survey
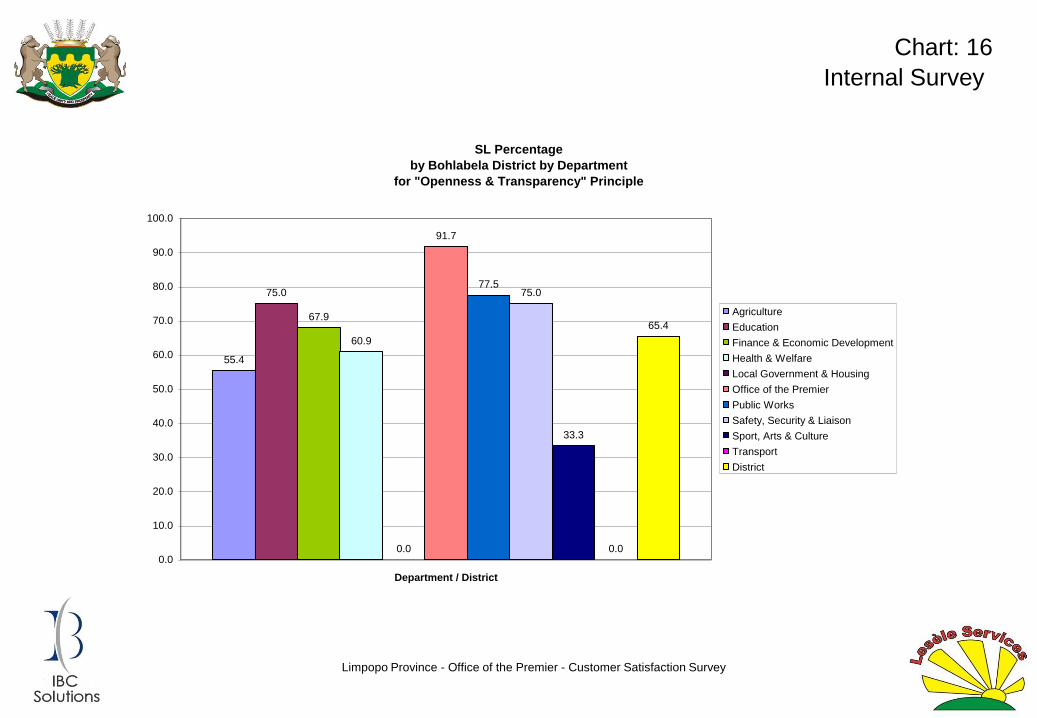
Internal Survey
Chart: 16
SL Percentage
by Bohlabela District by Department
for "Openness & Transparency" Principle
55.4
75.0
67.9
60.9
0.0
91.7
77.575.0
33.3
0.0
65.4
0.0
10.0
20.0
30.0
40.0
50.0
60.0
70.0
80.0
90.0
100.0
Department / District
Agriculture
Education
Finance & Economic Development
Health & Welfare
Local Government & Housing
Office of the Premier
Public Works
Safety, Security & Liaison
Sport, Arts & Culture
Transport
District
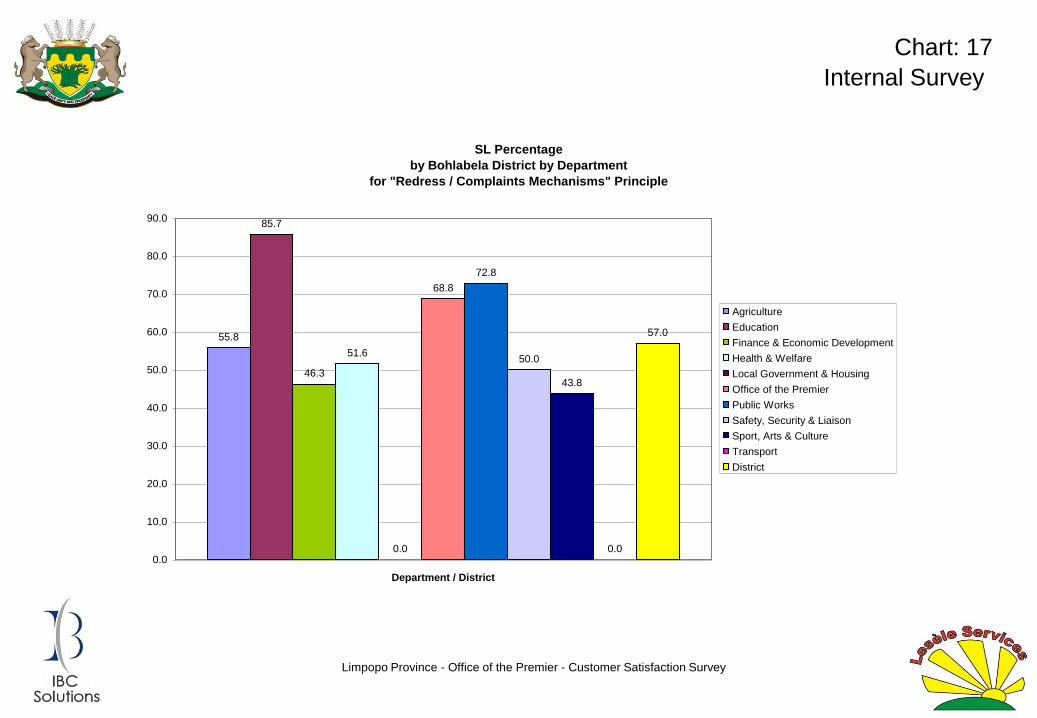
Limpopo Province - Office of the Premier - Customer Satisfaction Survey
Internal Survey
Chart: 17
SL Percentage
by Bohlabela District by Department
for "Redress / Complaints Mechanisms" Principle
55.8
85.7
46.3
51.6
0.0
68.8
72.8
50.0
43.8
0.0
57.0
0.0
10.0
20.0
30.0
40.0
50.0
60.0
70.0
80.0
90.0
Department / District
Agriculture
Education
Finance & Economic Development
Health & Welfare
Local Government & Housing
Office of the Premier
Public Works
Safety, Security & Liaison
Sport, Arts & Culture
Transport
District
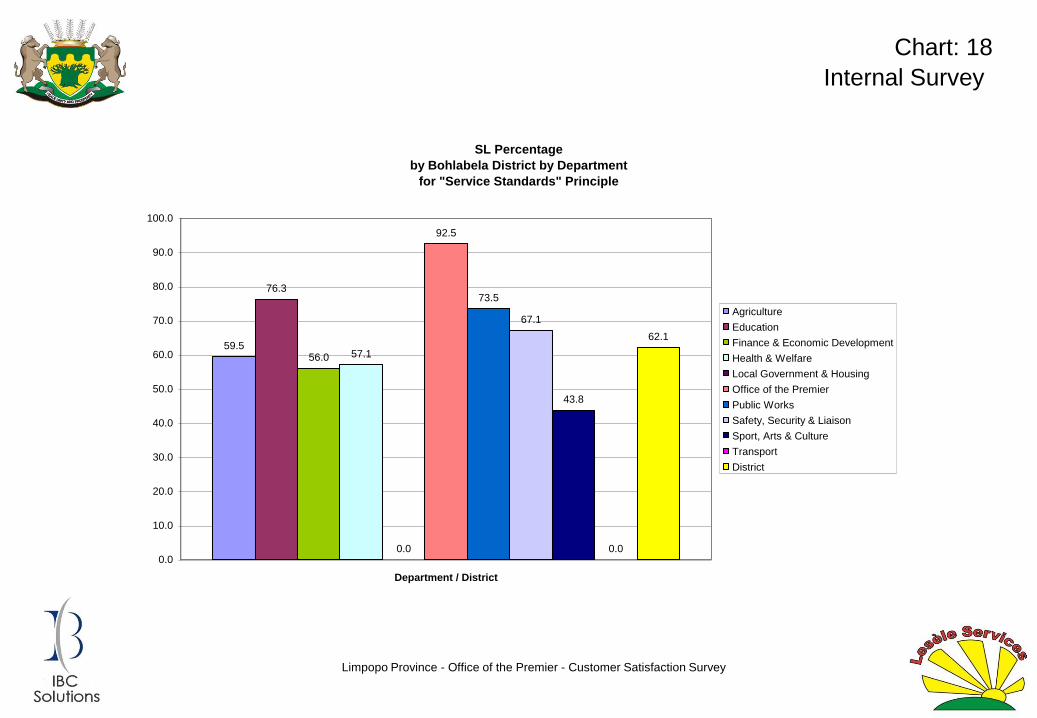
Limpopo Province - Office of the Premier - Customer Satisfaction Survey
Internal Survey
Chart: 18
SL Percentage
by Bohlabela District by Department
for "Service Standards" Principle
59.5
76.3
56.0 57.1
0.0
92.5
73.5
67.1
43.8
0.0
62.1
0.0
10.0
20.0
30.0
40.0
50.0
60.0
70.0
80.0
90.0
100.0
Department / District
Agriculture
Education
Finance & Economic Development
Health & Welfare
Local Government & Housing
Office of the Premier
Public Works
Safety, Security & Liaison
Sport, Arts & Culture
Transport
District

Limpopo Province - Office of the Premier - Customer Satisfaction Survey
Internal Survey
Chart: 19
SL Percentage
by Bohlabela District by Department
for "Value for Money" Principle
56.4
90.0
64.4
57.9
0.0
100.0
75.8
50.0 50.0
0.0
63.8
0.0
20.0
40.0
60.0
80.0
100.0
120.0
Department / District
Agriculture
Education
Finance & Economic Development
Health & Welfare
Local Government & Housing
Office of the Premier
Public Works
Safety, Security & Liaison
Sport, Arts & Culture
Transport
District

Limpopo Province - Office of the Premier - Customer Satisfaction Survey
Internal Survey
Chart: 20
SL Percentage
by Capricorn District by Department
for all Principles combined
63.6
37.8
60.7
47.3
58.6
70.072.6
53.8
49.5
43.6
56.2
0.0
10.0
20.0
30.0
40.0
50.0
60.0
70.0
80.0
Department / District
Agriculture
Education
Finance & Economic Development
Health & Welfare
Local Government & Housing
Office of the Premier
Public Works
Safety, Security & Liaison
Sport, Arts & Culture
Transport
District

Limpopo Province - Office of the Premier - Customer Satisfaction Survey
Internal Survey
Chart: 21
SL Percentage
by Capricorn District by Department
for "Access" Principle
60.5
49.2
66.8
51.9
60.3
71.7 72.0
54.9
42.7 42.6
57.1
0.0
10.0
20.0
30.0
40.0
50.0
60.0
70.0
80.0
Department / District
Agriculture
Education
Finance & Economic Development
Health & Welfare
Local Government & Housing
Office of the Premier
Public Works
Safety, Security & Liaison
Sport, Arts & Culture
Transport
District

Limpopo Province - Office of the Premier - Customer Satisfaction Survey
Internal Survey
Chart: 22
SL Percentage
by Capricorn District by Department
for "Consultation" Principle
62.2
31.4
58.8
48.7
65.266.7
71.1
50.247.4
37.9
54.0
0.0
10.0
20.0
30.0
40.0
50.0
60.0
70.0
80.0
Department / District
Agriculture
Education
Finance & Economic Development
Health & Welfare
Local Government & Housing
Office of the Premier
Public Works
Safety, Security & Liaison
Sport, Arts & Culture
Transport
District
Limpopo Province - Office of the Premier - Customer Satisfaction Survey
Internal Survey
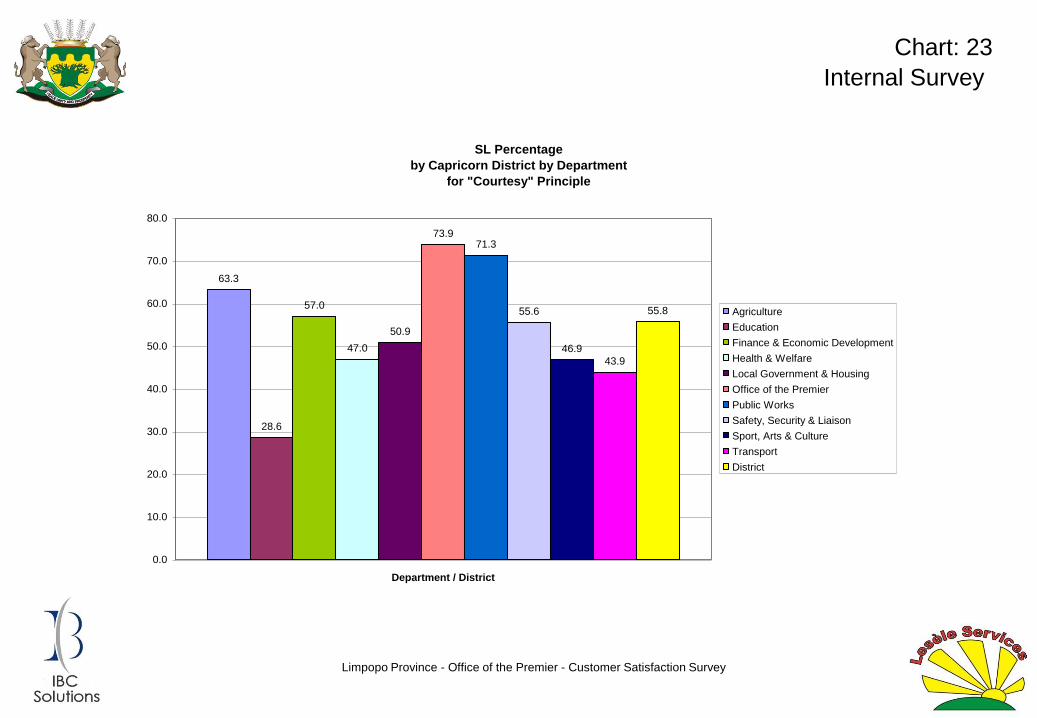
Chart: 23
SL Percentage
by Capricorn District by Department
for "Courtesy" Principle
63.3
28.6
57.0
47.0
50.9
73.971.3
55.6
46.9
43.9
55.8
0.0
10.0
20.0
30.0
40.0
50.0
60.0
70.0
80.0
Department / District
Agriculture
Education
Finance & Economic Development
Health & Welfare
Local Government & Housing
Office of the Premier
Public Works
Safety, Security & Liaison
Sport, Arts & Culture
Transport
District
Limpopo Province - Office of the Premier - Customer Satisfaction Survey
Internal Survey
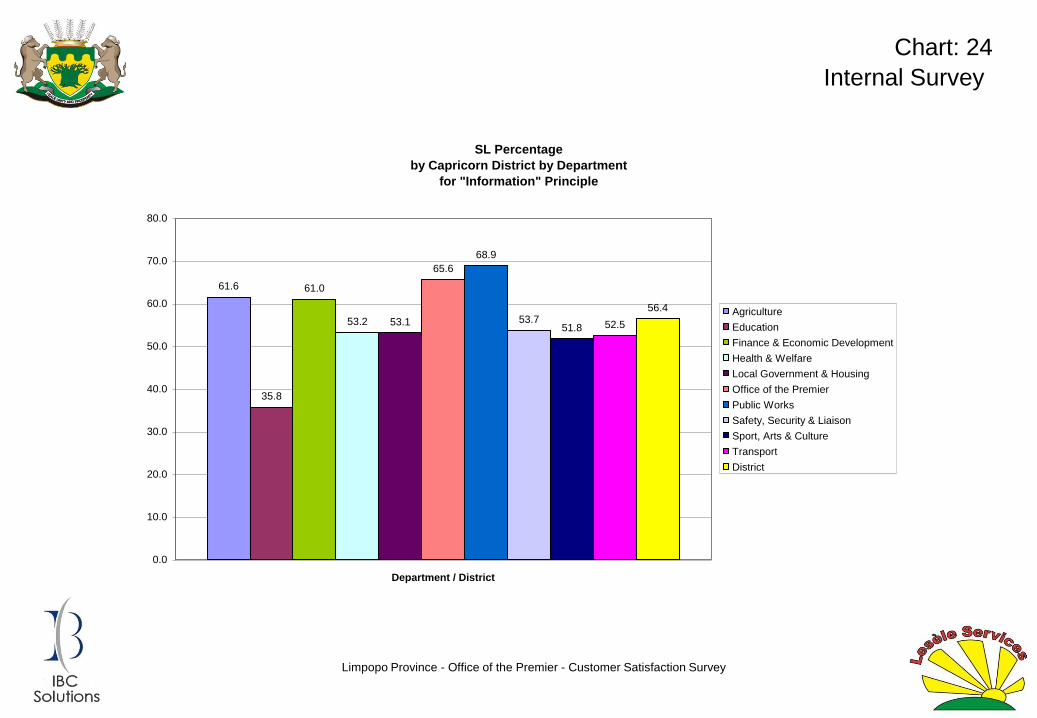
Chart: 24
SL Percentage
by Capricorn District by Department
for "Information" Principle
61.6
35.8
61.0
53.2 53.1
65.6
68.9
53.751.8 52.5
56.4
0.0
10.0
20.0
30.0
40.0
50.0
60.0
70.0
80.0
Department / District
Agriculture
Education
Finance & Economic Development
Health & Welfare
Local Government & Housing
Office of the Premier
Public Works
Safety, Security & Liaison
Sport, Arts & Culture
Transport
District

Limpopo Province - Office of the Premier - Customer Satisfaction Survey
Internal Survey
Chart: 25
SL Percentage
by Capricorn District by Department
for "Openness & Transparency" Principle
66.0
40.6
63.4
52.1
64.6
70.8
77.8
54.1
58.361.4
59.6
0.0
10.0
20.0
30.0
40.0
50.0
60.0
70.0
80.0
90.0
Department / District
Agriculture
Education
Finance & Economic Development
Health & Welfare
Local Government & Housing
Office of the Premier
Public Works
Safety, Security & Liaison
Sport, Arts & Culture
Transport
District
Limpopo Province - Office of the Premier - Customer Satisfaction Survey
Internal Survey
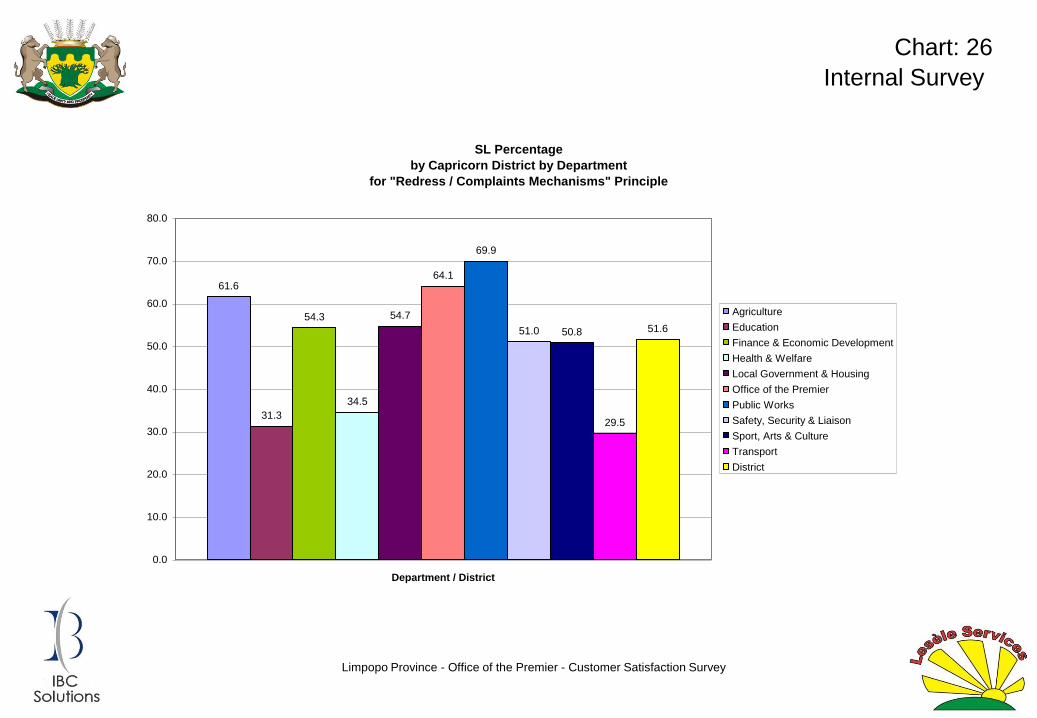
Chart: 26
SL Percentage
by Capricorn District by Department
for "Redress / Complaints Mechanisms" Principle
61.6
31.3
54.3
34.5
54.7
64.1
69.9
51.0 50.8
29.5
51.6
0.0
10.0
20.0
30.0
40.0
50.0
60.0
70.0
80.0
Department / District
Agriculture
Education
Finance & Economic Development
Health & Welfare
Local Government & Housing
Office of the Premier
Public Works
Safety, Security & Liaison
Sport, Arts & Culture
Transport
District
Limpopo Province - Office of the Premier - Customer Satisfaction Survey
Internal Survey
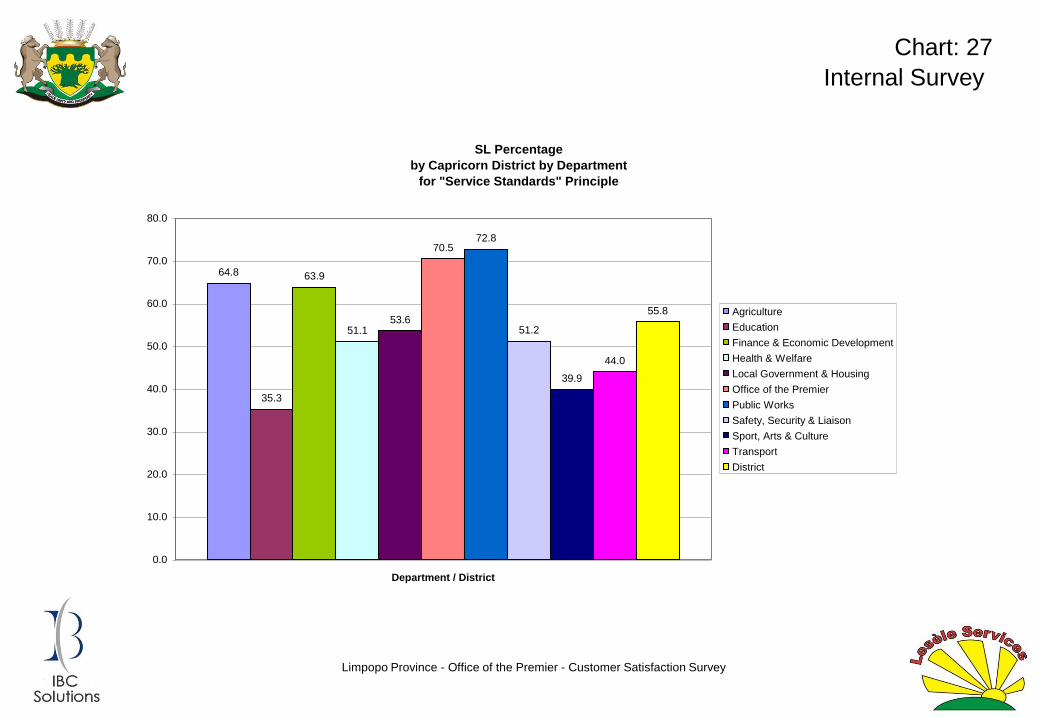
Chart: 27
SL Percentage
by Capricorn District by Department
for "Service Standards" Principle
64.8
35.3
63.9
51.153.6
70.572.8
51.2
39.9
44.0
55.8
0.0
10.0
20.0
30.0
40.0
50.0
60.0
70.0
80.0
Department / District
Agriculture
Education
Finance & Economic Development
Health & Welfare
Local Government & Housing
Office of the Premier
Public Works
Safety, Security & Liaison
Sport, Arts & Culture
Transport
District
Limpopo Province - Office of the Premier - Customer Satisfaction Survey
Internal Survey
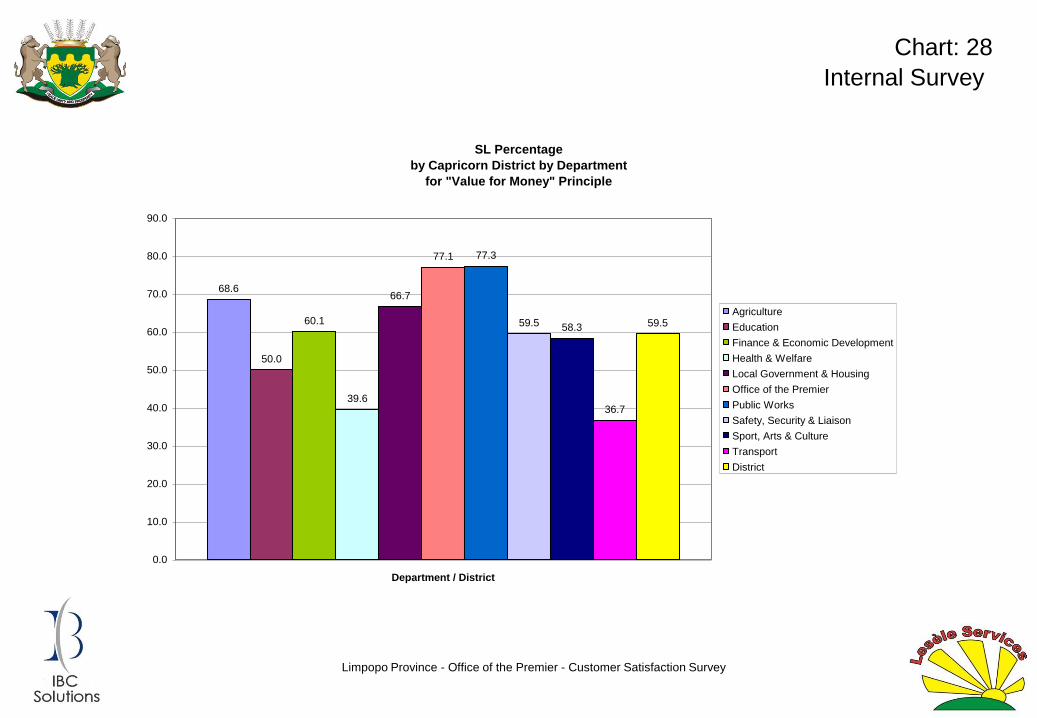
Chart: 28
SL Percentage
by Capricorn District by Department
for "Value for Money" Principle
68.6
50.0
60.1
39.6
66.7
77.1 77.3
59.5 58.3
36.7
59.5
0.0
10.0
20.0
30.0
40.0
50.0
60.0
70.0
80.0
90.0
Department / District
Agriculture
Education
Finance & Economic Development
Health & Welfare
Local Government & Housing
Office of the Premier
Public Works
Safety, Security & Liaison
Sport, Arts & Culture
Transport
District
Limpopo Province - Office of the Premier - Customer Satisfaction Survey
Internal Survey
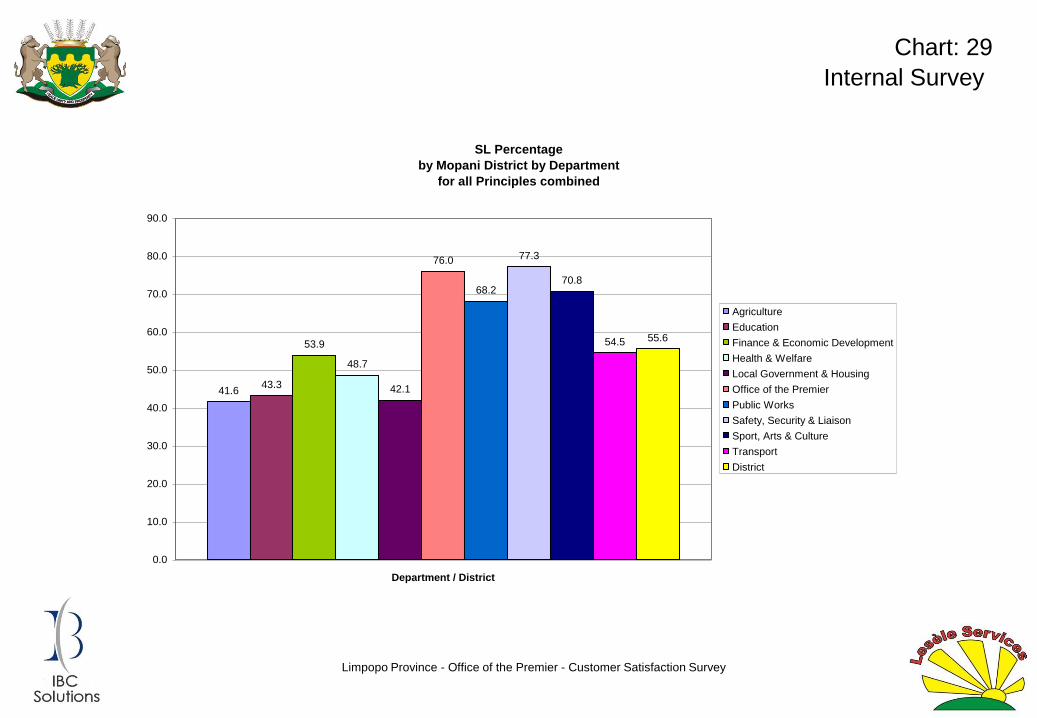
Chart: 29
SL Percentage
by Mopani District by Department
for all Principles combined
41.643.3
53.9
48.7
42.1
76.0
68.2
77.3
70.8
54.5 55.6
0.0
10.0
20.0
30.0
40.0
50.0
60.0
70.0
80.0
90.0
Department / District
Agriculture
Education
Finance & Economic Development
Health & Welfare
Local Government & Housing
Office of the Premier
Public Works
Safety, Security & Liaison
Sport, Arts & Culture
Transport
District
Limpopo Province - Office of the Premier - Customer Satisfaction Survey
Internal Survey
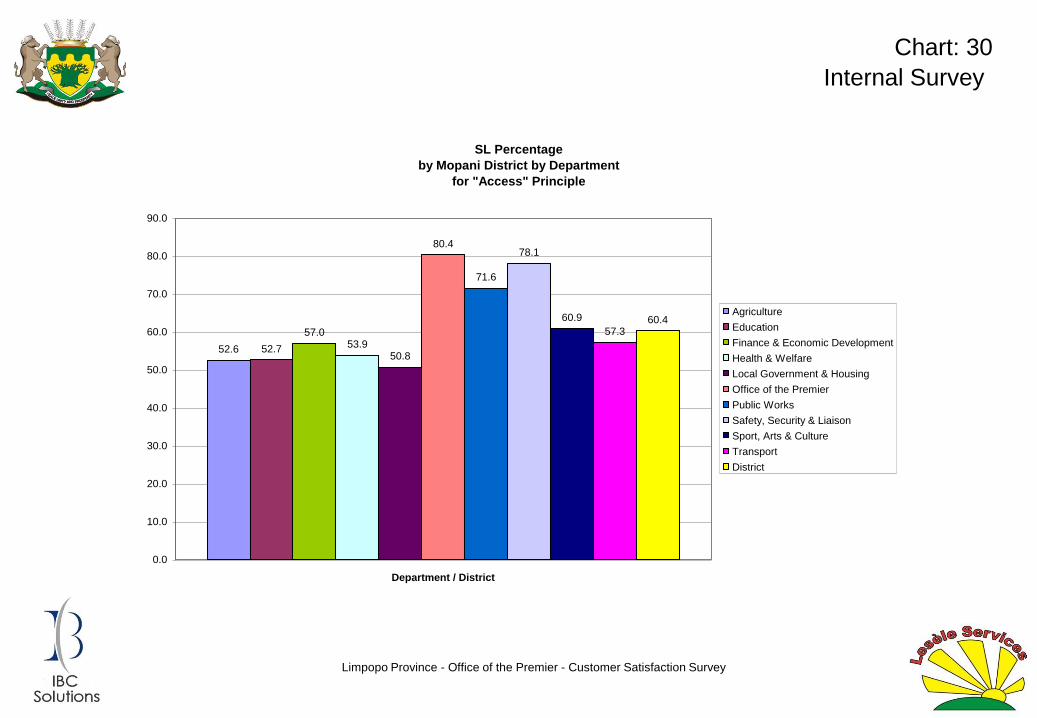
Chart: 30
SL Percentage
by Mopani District by Department
for "Access" Principle
52.6 52.7
57.053.9
50.8
80.4
71.6
78.1
60.9
57.360.4
0.0
10.0
20.0
30.0
40.0
50.0
60.0
70.0
80.0
90.0
Department / District
Agriculture
Education
Finance & Economic Development
Health & Welfare
Local Government & Housing
Office of the Premier
Public Works
Safety, Security & Liaison
Sport, Arts & Culture
Transport
District

Limpopo Province - Office of the Premier - Customer Satisfaction Survey
Internal Survey
Chart: 31
SL Percentage
by Mopani District by Department
for "Consultation" Principle
35.1
45.1
50.0 49.3
44.8
72.6 71.7
79.8
68.8
57.5 56.5
0.0
10.0
20.0
30.0
40.0
50.0
60.0
70.0
80.0
90.0
Department / District
Agriculture
Education
Finance & Economic Development
Health & Welfare
Local Government & Housing
Office of the Premier
Public Works
Safety, Security & Liaison
Sport, Arts & Culture
Transport
District
Limpopo Province - Office of the Premier - Customer Satisfaction Survey
Internal Survey
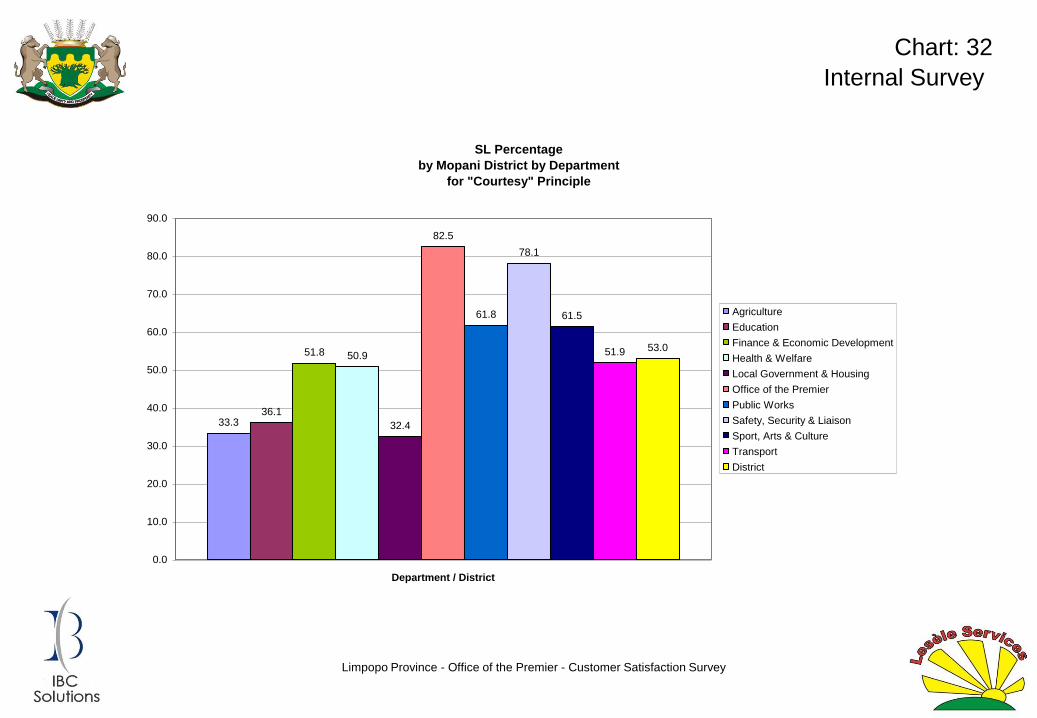
Chart: 32
SL Percentage
by Mopani District by Department
for "Courtesy" Principle
33.336.1
51.8 50.9
32.4
82.5
61.8
78.1
61.5
51.9 53.0
0.0
10.0
20.0
30.0
40.0
50.0
60.0
70.0
80.0
90.0
Department / District
Agriculture
Education
Finance & Economic Development
Health & Welfare
Local Government & Housing
Office of the Premier
Public Works
Safety, Security & Liaison
Sport, Arts & Culture
Transport
District

Limpopo Province - Office of the Premier - Customer Satisfaction Survey
Internal Survey
Chart: 33
SL Percentage
by Mopani District by Department
for "Information" Principle
44.7
41.1
59.5
52.1
40.5
79.4
68.7
77.574.3
55.657.4
0.0
10.0
20.0
30.0
40.0
50.0
60.0
70.0
80.0
90.0
Department / District
Agriculture
Education
Finance & Economic Development
Health & Welfare
Local Government & Housing
Office of the Premier
Public Works
Safety, Security & Liaison
Sport, Arts & Culture
Transport
District
Limpopo Province - Office of the Premier - Customer Satisfaction Survey
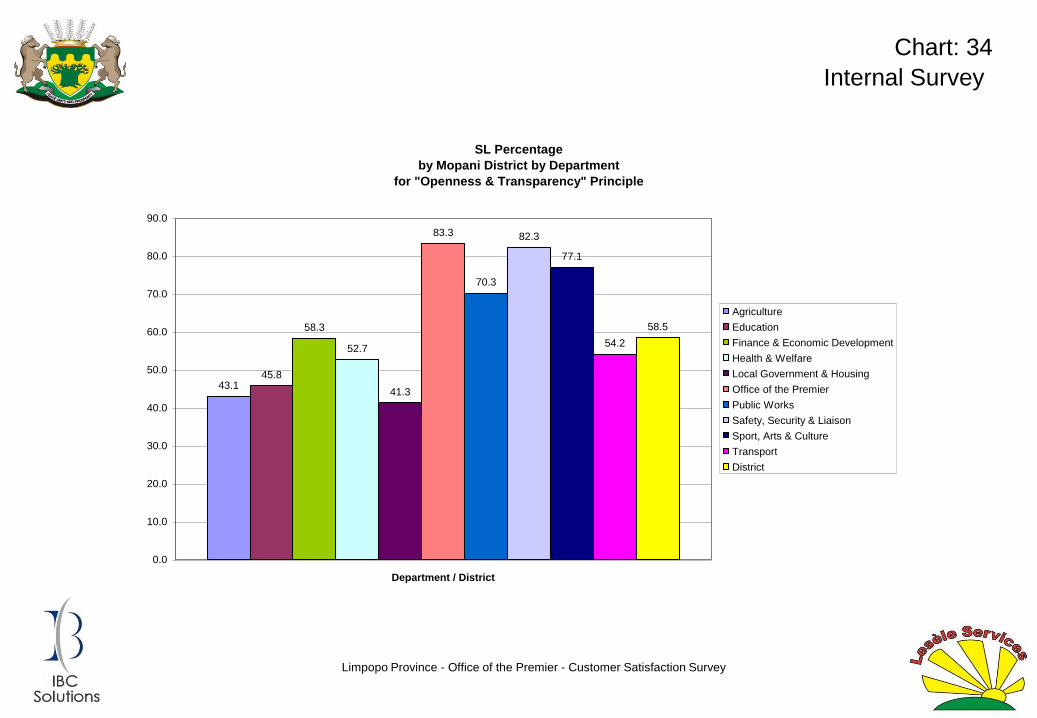
Internal Survey
Chart: 34
SL Percentage
by Mopani District by Department
for "Openness & Transparency" Principle
43.145.8
58.3
52.7
41.3
83.3
70.3
82.3
77.1
54.2
58.5
0.0
10.0
20.0
30.0
40.0
50.0
60.0
70.0
80.0
90.0
Department / District
Agriculture
Education
Finance & Economic Development
Health & Welfare
Local Government & Housing
Office of the Premier
Public Works
Safety, Security & Liaison
Sport, Arts & Culture
Transport
District

Limpopo Province - Office of the Premier - Customer Satisfaction Survey
Internal Survey
Chart: 35
SL Percentage
by Mopani District by Department
for "Redress / Complaints Mechanisms" Principle
34.4 34.4
44.5
40.8
36.7
69.2
59.7
67.0
75.0
44.6
47.6
0.0
10.0
20.0
30.0
40.0
50.0
60.0
70.0
80.0
Department / District
Agriculture
Education
Finance & Economic Development
Health & Welfare
Local Government & Housing
Office of the Premier
Public Works
Safety, Security & Liaison
Sport, Arts & Culture
Transport
District
Limpopo Province - Office of the Premier - Customer Satisfaction Survey
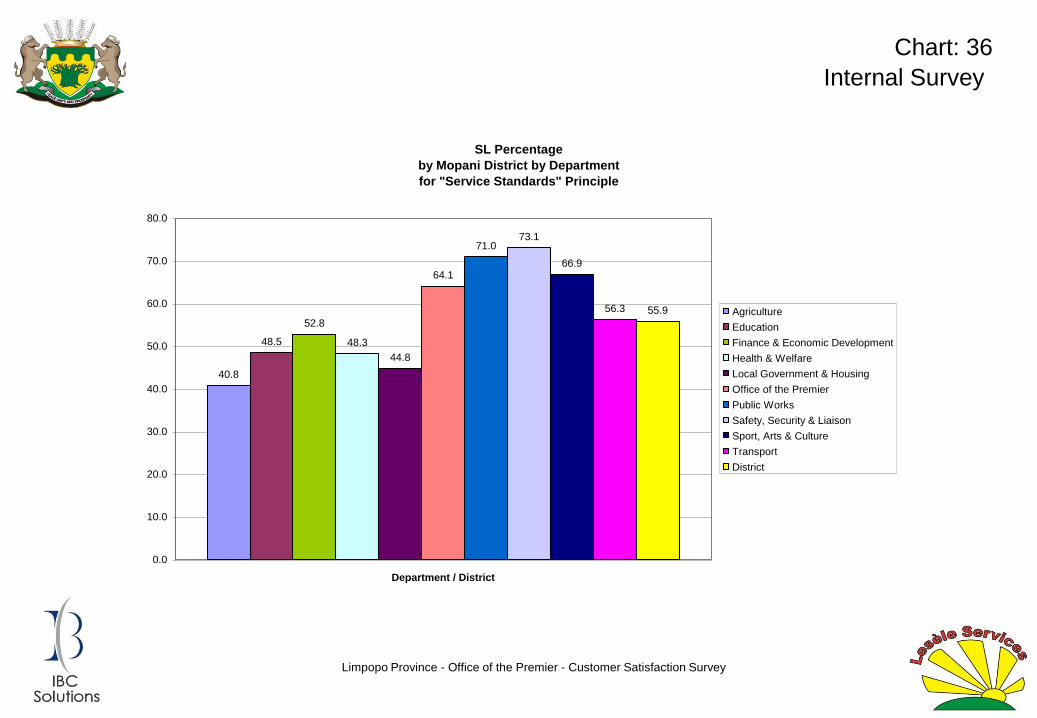
Internal Survey
Chart: 36
SL Percentage
by Mopani District by Department
for "Service Standards" Principle
40.8
48.5
52.8
48.3
44.8
64.1
71.073.1
66.9
56.3 55.9
0.0
10.0
20.0
30.0
40.0
50.0
60.0
70.0
80.0
Department / District
Agriculture
Education
Finance & Economic Development
Health & Welfare
Local Government & Housing
Office of the Premier
Public Works
Safety, Security & Liaison
Sport, Arts & Culture
Transport
District

Limpopo Province - Office of the Premier - Customer Satisfaction Survey
Internal Survey
Chart: 37
SL Percentage
by Mopani District by Department
for "Value for Money" Principle
49.2
42.4
57.1
41.3
45.5
76.7
70.7
82.1 81.8
58.9
55.3
0.0
10.0
20.0
30.0
40.0
50.0
60.0
70.0
80.0
90.0
Department / District
Agriculture
Education
Finance & Economic Development
Health & Welfare
Local Government & Housing
Office of the Premier
Public Works
Safety, Security & Liaison
Sport, Arts & Culture
Transport
District
Limpopo Province - Office of the Premier - Customer Satisfaction Survey
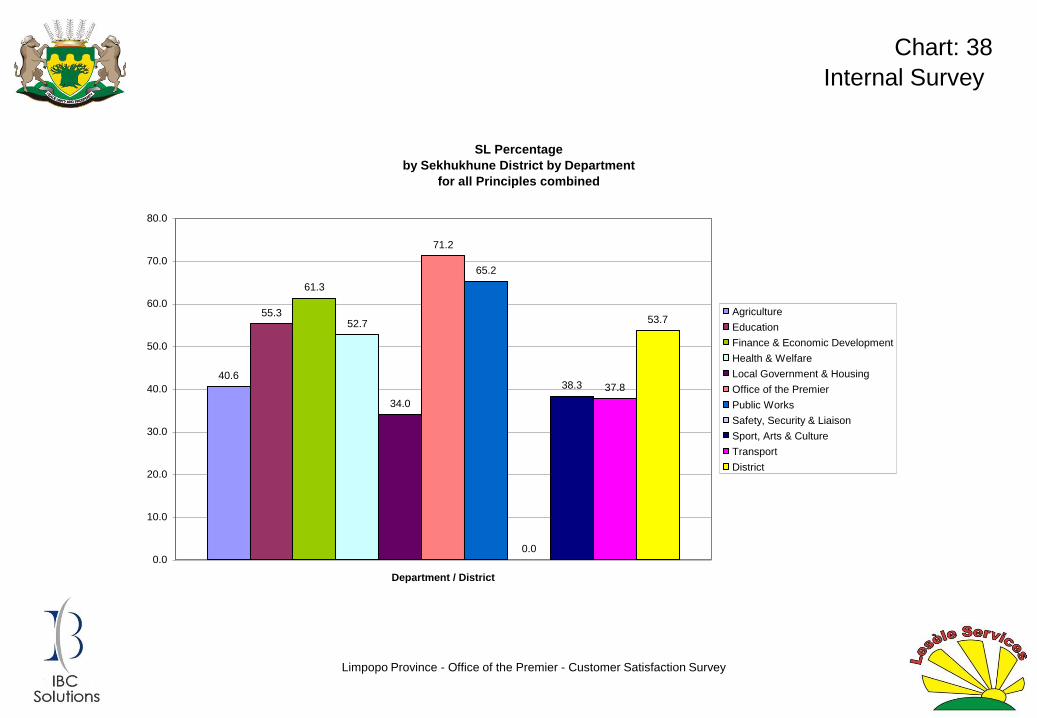
Internal Survey
Chart: 38
SL Percentage
by Sekhukhune District by Department
for all Principles combined
40.6
55.3
61.3
52.7
34.0
71.2
65.2
0.0
38.3 37.8
53.7
0.0
10.0
20.0
30.0
40.0
50.0
60.0
70.0
80.0
Department / District
Agriculture
Education
Finance & Economic Development
Health & Welfare
Local Government & Housing
Office of the Premier
Public Works
Safety, Security & Liaison
Sport, Arts & Culture
Transport
District

Limpopo Province - Office of the Premier - Customer Satisfaction Survey
Internal Survey
Chart: 39
SL Percentage
by Sekhukhune District by Department
for "Access" Principle
35.0
56.3
65.2
53.1
40.6
65.6
59.3
0.0
38.540.2
53.4
0.0
10.0
20.0
30.0
40.0
50.0
60.0
70.0
Department / District
Agriculture
Education
Finance & Economic Development
Health & Welfare
Local Government & Housing
Office of the Premier
Public Works
Safety, Security & Liaison
Sport, Arts & Culture
Transport
District
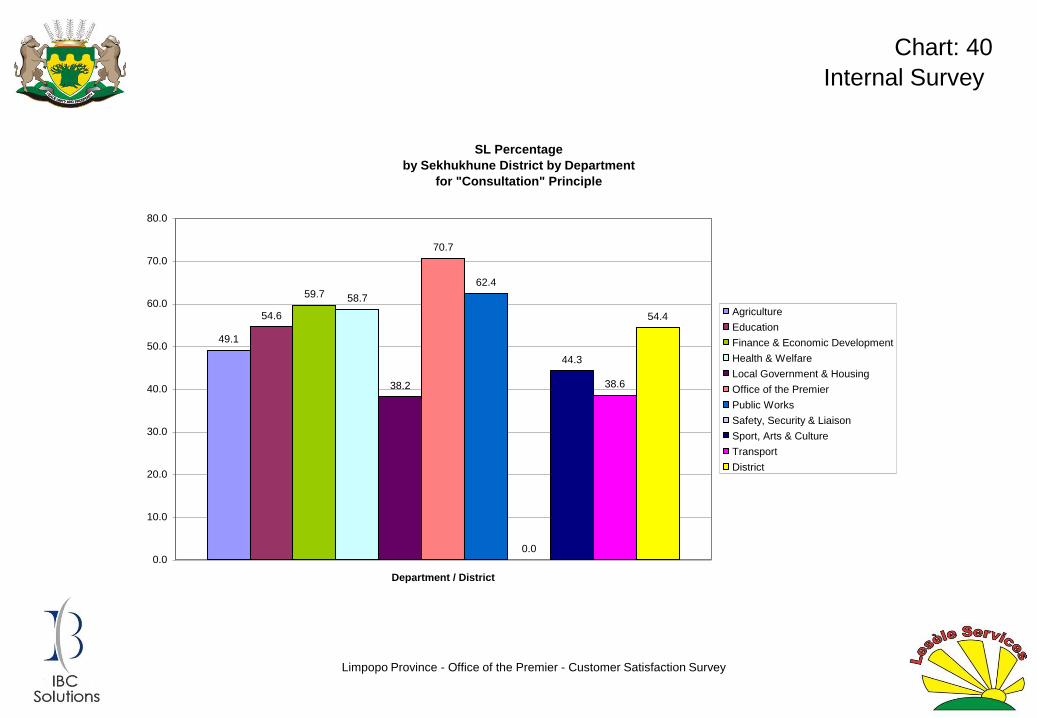
Limpopo Province - Office of the Premier - Customer Satisfaction Survey
Internal Survey
Chart: 40
SL Percentage
by Sekhukhune District by Department
for "Consultation" Principle
49.1
54.6
59.7 58.7
38.2
70.7
62.4
0.0
44.3
38.6
54.4
0.0
10.0
20.0
30.0
40.0
50.0
60.0
70.0
80.0
Department / District
Agriculture
Education
Finance & Economic Development
Health & Welfare
Local Government & Housing
Office of the Premier
Public Works
Safety, Security & Liaison
Sport, Arts & Culture
Transport
District
Limpopo Province - Office of the Premier - Customer Satisfaction Survey
Internal Survey
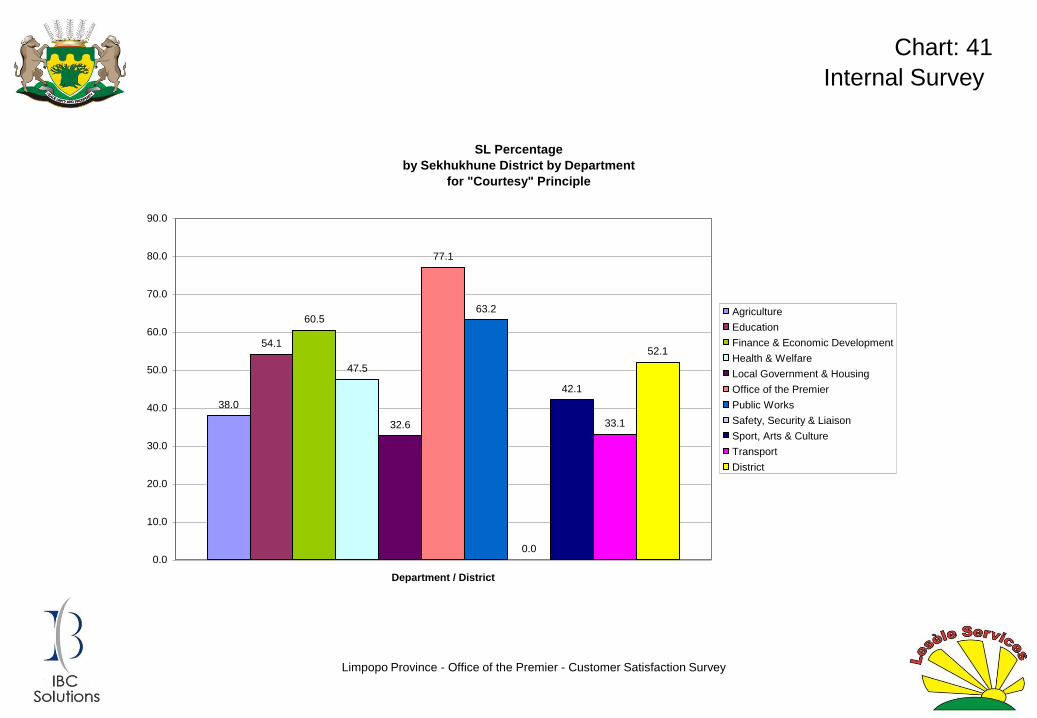
Chart: 41
SL Percentage
by Sekhukhune District by Department
for "Courtesy" Principle
38.0
54.1
60.5
47.5
32.6
77.1
63.2
0.0
42.1
33.1
52.1
0.0
10.0
20.0
30.0
40.0
50.0
60.0
70.0
80.0
90.0
Department / District
Agriculture
Education
Finance & Economic Development
Health & Welfare
Local Government & Housing
Office of the Premier
Public Works
Safety, Security & Liaison
Sport, Arts & Culture
Transport
District
Limpopo Province - Office of the Premier - Customer Satisfaction Survey
Internal Survey
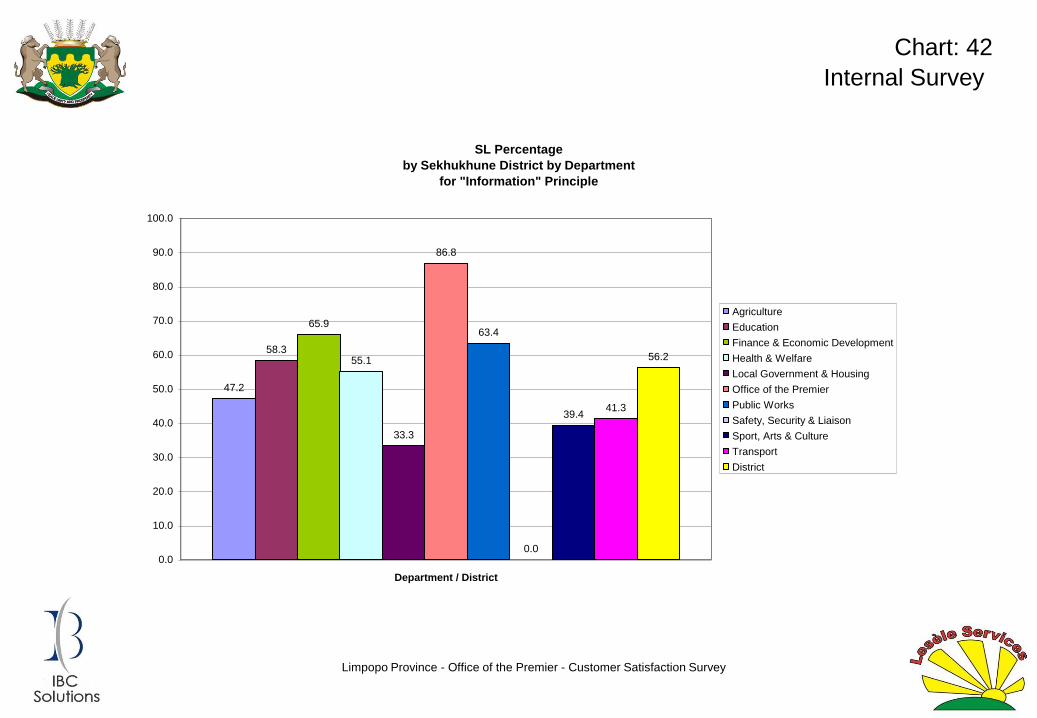
Chart: 42
SL Percentage
by Sekhukhune District by Department
for "Information" Principle
47.2
58.3
65.9
55.1
33.3
86.8
63.4
0.0
39.441.3
56.2
0.0
10.0
20.0
30.0
40.0
50.0
60.0
70.0
80.0
90.0
100.0
Department / District
Agriculture
Education
Finance & Economic Development
Health & Welfare
Local Government & Housing
Office of the Premier
Public Works
Safety, Security & Liaison
Sport, Arts & Culture
Transport
District

Limpopo Province - Office of the Premier - Customer Satisfaction Survey
Internal Survey
Chart: 43
SL Percentage
by Sekhukhune District by Department
for "Openness & Transparency" Principle
31.7
57.0
63.7
56.3
33.3
72.9
64.9
0.0
43.1 42.4
55.1
0.0
10.0
20.0
30.0
40.0
50.0
60.0
70.0
80.0
Department / District
Agriculture
Education
Finance & Economic Development
Health & Welfare
Local Government & Housing
Office of the Premier
Public Works
Safety, Security & Liaison
Sport, Arts & Culture
Transport
District

Limpopo Province - Office of the Premier - Customer Satisfaction Survey
Internal Survey
Chart: 44
SL Percentage
by Sekhukhune District by Department
for "Redress / Complaints Mechanisms" Principle
28.8
49.151.9
49.5
35.4
79.7
66.1
0.0
27.128.9
49.0
0.0
10.0
20.0
30.0
40.0
50.0
60.0
70.0
80.0
90.0
Department / District
Agriculture
Education
Finance & Economic Development
Health & Welfare
Local Government & Housing
Office of the Premier
Public Works
Safety, Security & Liaison
Sport, Arts & Culture
Transport
District
Limpopo Province - Office of the Premier - Customer Satisfaction Survey
Internal Survey
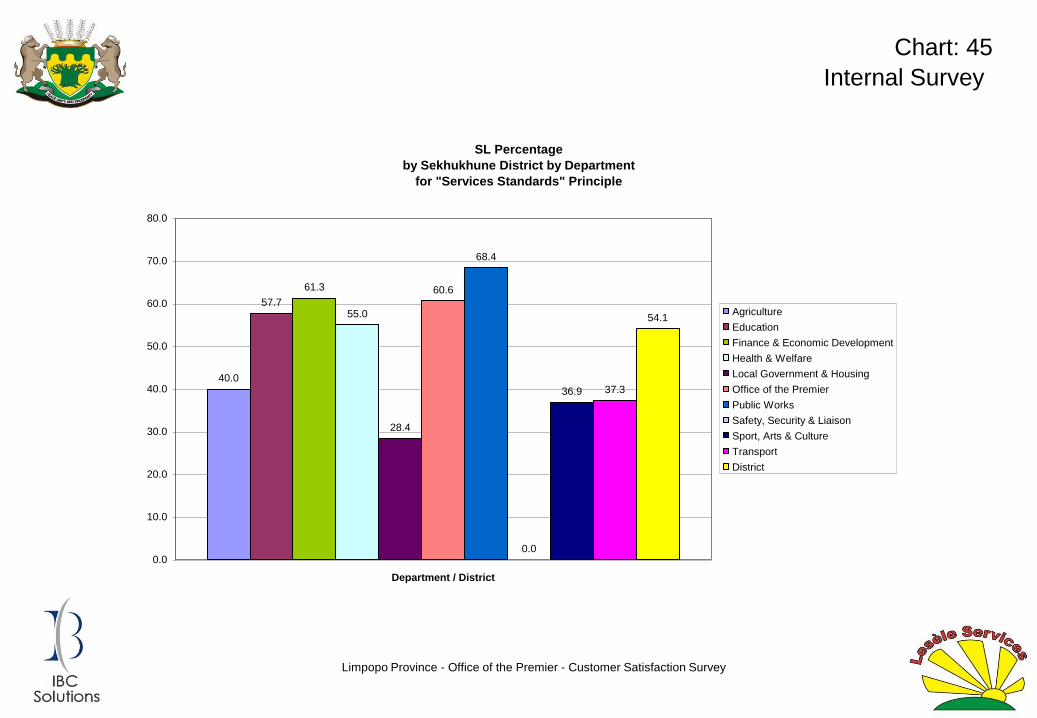
Chart: 45
SL Percentage
by Sekhukhune District by Department
for "Services Standards" Principle
40.0
57.7
61.3
55.0
28.4
60.6
68.4
0.0
36.9 37.3
54.1
0.0
10.0
20.0
30.0
40.0
50.0
60.0
70.0
80.0
Department / District
Agriculture
Education
Finance & Economic Development
Health & Welfare
Local Government & Housing
Office of the Premier
Public Works
Safety, Security & Liaison
Sport, Arts & Culture
Transport
District
Limpopo Province - Office of the Premier - Customer Satisfaction Survey
Internal Survey
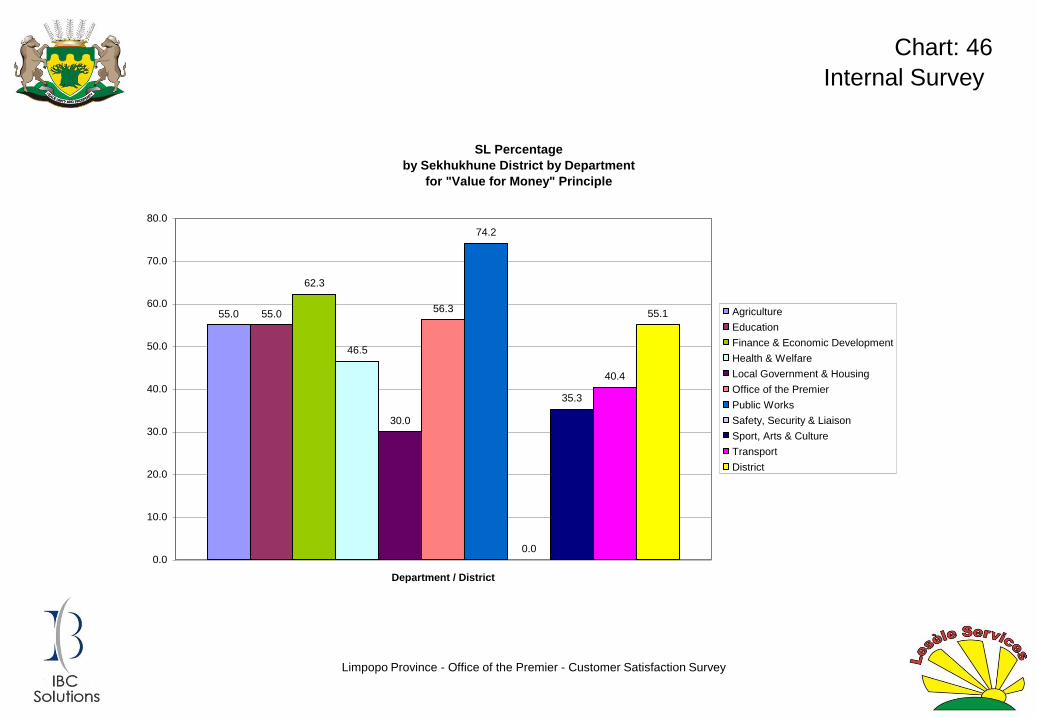
Chart: 46
SL Percentage
by Sekhukhune District by Department
for "Value for Money" Principle
55.0 55.0
62.3
46.5
30.0
56.3
74.2
0.0
35.3
40.4
55.1
0.0
10.0
20.0
30.0
40.0
50.0
60.0
70.0
80.0
Department / District
Agriculture
Education
Finance & Economic Development
Health & Welfare
Local Government & Housing
Office of the Premier
Public Works
Safety, Security & Liaison
Sport, Arts & Culture
Transport
District

Limpopo Province - Office of the Premier - Customer Satisfaction Survey
Internal Survey
Chart: 47
SL Percentage
by Vhembe District by Department
for all Principles combined
68.4
50.3
68.7
46.8
49.8 50.5
61.5
15.9
0.0
47.6
53.3
0.0
10.0
20.0
30.0
40.0
50.0
60.0
70.0
80.0
Department / District
Agriculture
Education
Finance & Economic Development
Health & Welfare
Local Government & Housing
Office of the Premier
Public Works
Safety, Security & Liaison
Sport, Arts & Culture
Transport
District
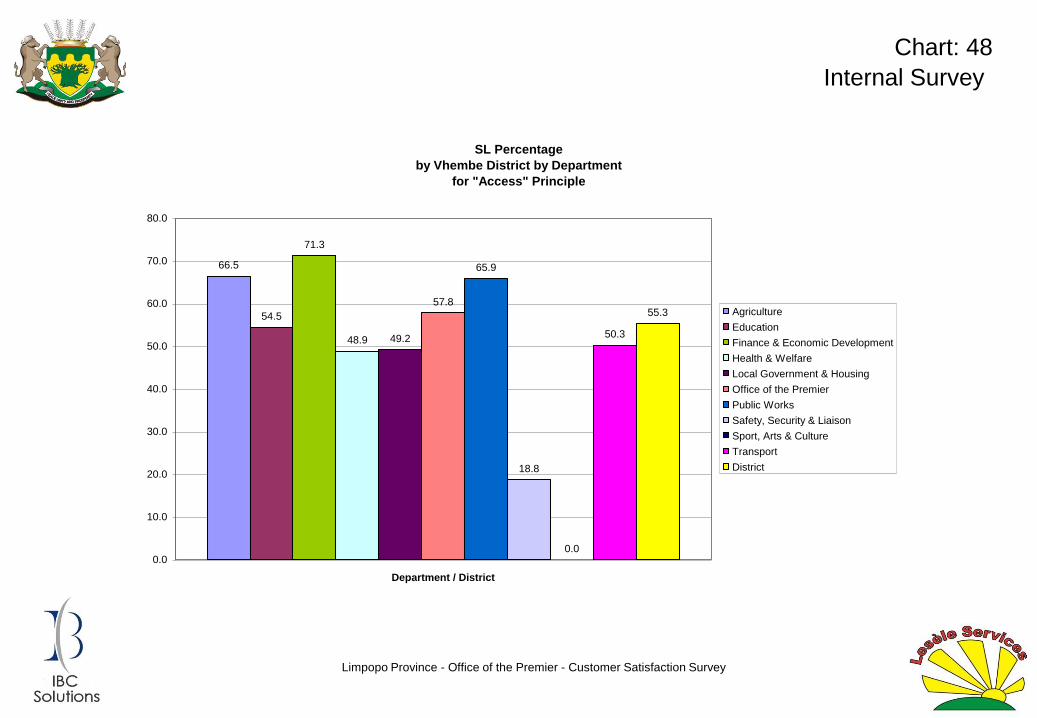
Limpopo Province - Office of the Premier - Customer Satisfaction Survey
Internal Survey
Chart: 48
SL Percentage
by Vhembe District by Department
for "Access" Principle
66.5
54.5
71.3
48.9 49.2
57.8
65.9
18.8
0.0
50.3
55.3
0.0
10.0
20.0
30.0
40.0
50.0
60.0
70.0
80.0
Department / District
Agriculture
Education
Finance & Economic Development
Health & Welfare
Local Government & Housing
Office of the Premier
Public Works
Safety, Security & Liaison
Sport, Arts & Culture
Transport
District
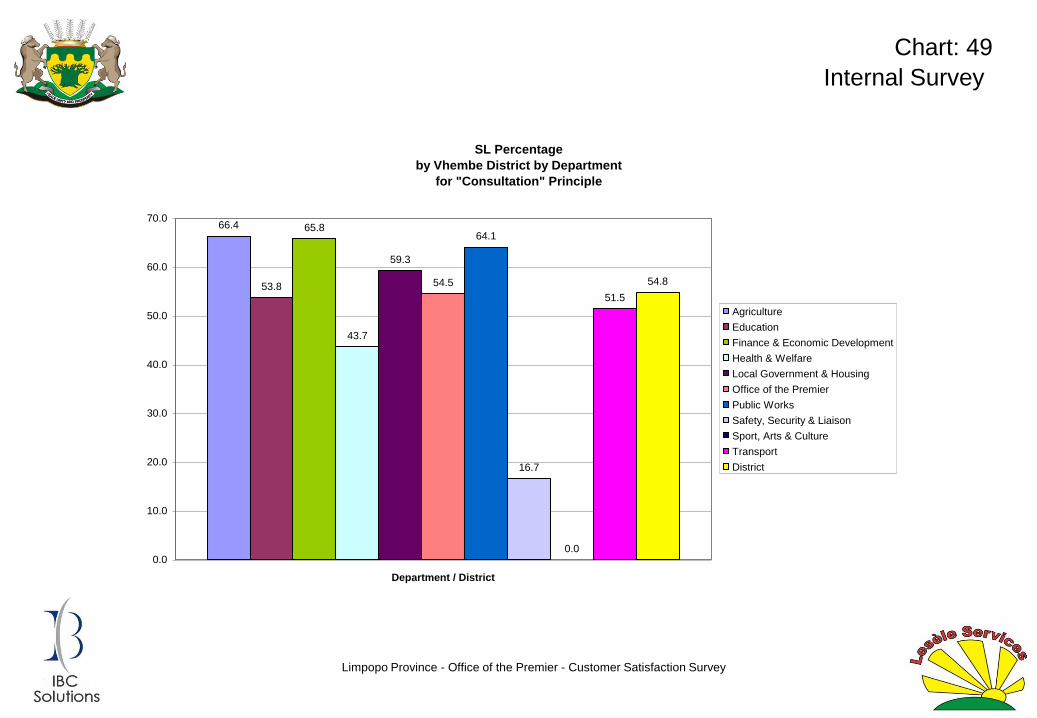
Limpopo Province - Office of the Premier - Customer Satisfaction Survey
Internal Survey
Chart: 49
SL Percentage
by Vhembe District by Department
for "Consultation" Principle
66.4
53.8
65.8
43.7
59.3
54.5
64.1
16.7
0.0
51.5
54.8
0.0
10.0
20.0
30.0
40.0
50.0
60.0
70.0
Department / District
Agriculture
Education
Finance & Economic Development
Health & Welfare
Local Government & Housing
Office of the Premier
Public Works
Safety, Security & Liaison
Sport, Arts & Culture
Transport
District

Limpopo Province - Office of the Premier - Customer Satisfaction Survey
Internal Survey
Chart: 50
SL Percentage
by Vhembe District by Department
for "Courtesy" Principle
66.3
47.3
64.2
49.6
44.1
55.2
58.9
22.9
0.0
48.5
52.6
0.0
10.0
20.0
30.0
40.0
50.0
60.0
70.0
Department / District
Agriculture
Education
Finance & Economic Development
Health & Welfare
Local Government & Housing
Office of the Premier
Public Works
Safety, Security & Liaison
Sport, Arts & Culture
Transport
District
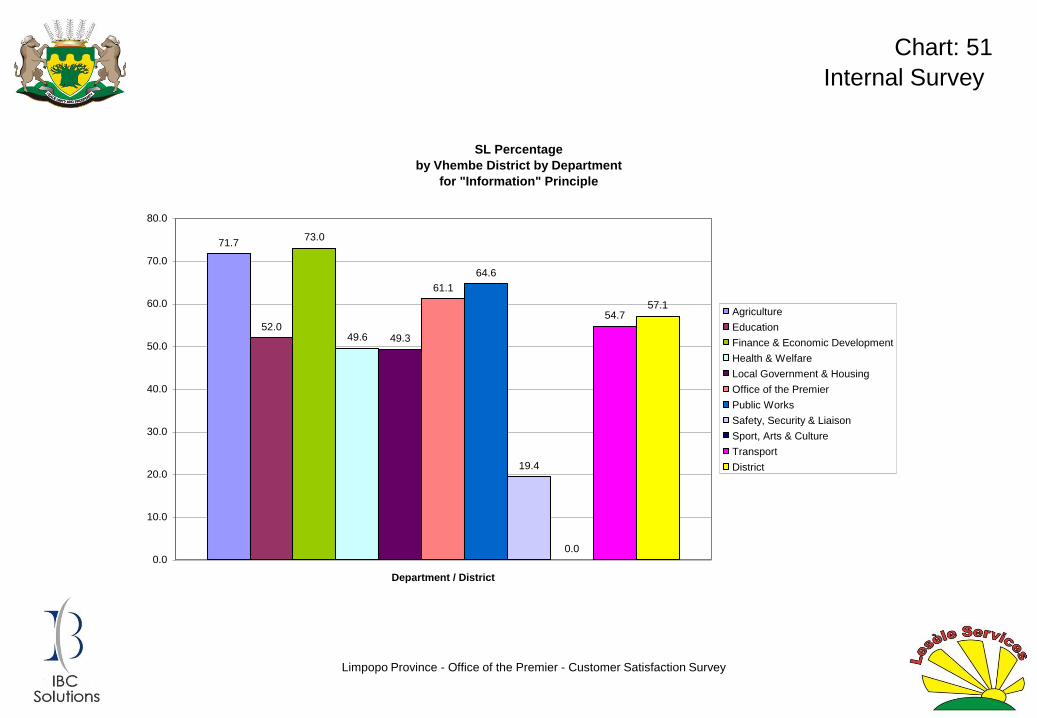
Limpopo Province - Office of the Premier - Customer Satisfaction Survey
Internal Survey
Chart: 51
SL Percentage
by Vhembe District by Department
for "Information" Principle
71.7
52.0
73.0
49.6 49.3
61.1
64.6
19.4
0.0
54.757.1
0.0
10.0
20.0
30.0
40.0
50.0
60.0
70.0
80.0
Department / District
Agriculture
Education
Finance & Economic Development
Health & Welfare
Local Government & Housing
Office of the Premier
Public Works
Safety, Security & Liaison
Sport, Arts & Culture
Transport
District

Limpopo Province - Office of the Premier - Customer Satisfaction Survey
Internal Survey
Chart: 52
SL Percentage
by Vhembe District by Department
for "Openness & Transparency" Principle
71.7
56.5
75.8
47.149.0 50.0
62.1
20.8
0.0
47.3
54.6
0.0
10.0
20.0
30.0
40.0
50.0
60.0
70.0
80.0
Department / District
Agriculture
Education
Finance & Economic Development
Health & Welfare
Local Government & Housing
Office of the Premier
Public Works
Safety, Security & Liaison
Sport, Arts & Culture
Transport
District
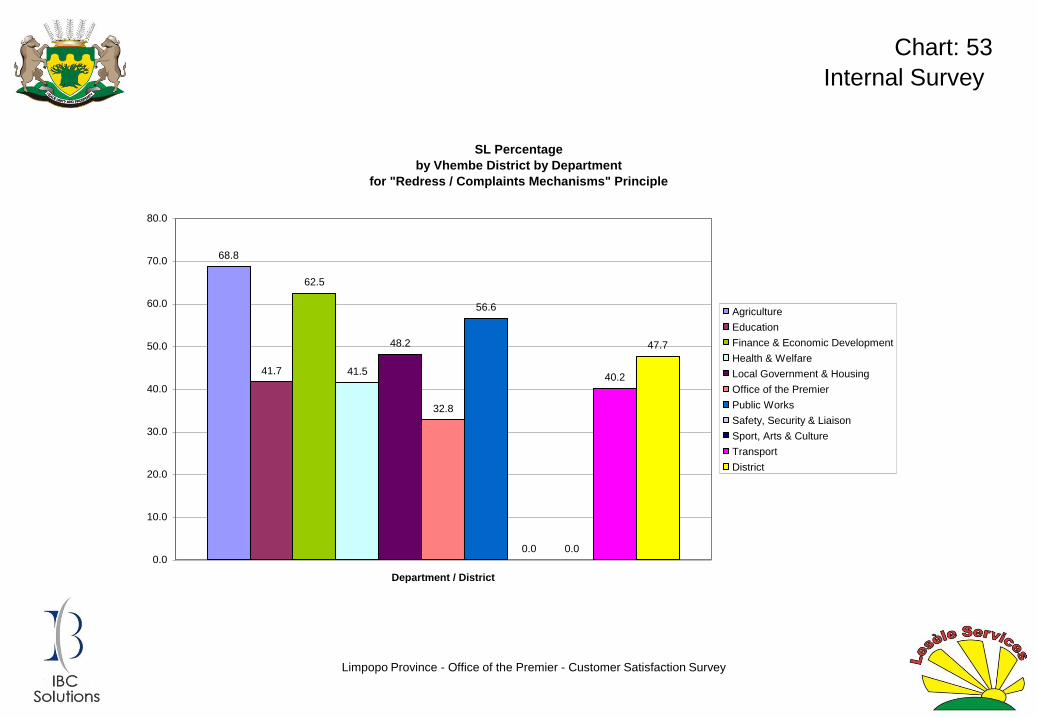
Limpopo Province - Office of the Premier - Customer Satisfaction Survey
Internal Survey
Chart: 53
SL Percentage
by Vhembe District by Department
for "Redress / Complaints Mechanisms" Principle
68.8
41.7
62.5
41.5
48.2
32.8
56.6
0.0 0.0
40.2
47.7
0.0
10.0
20.0
30.0
40.0
50.0
60.0
70.0
80.0
Department / District
Agriculture
Education
Finance & Economic Development
Health & Welfare
Local Government & Housing
Office of the Premier
Public Works
Safety, Security & Liaison
Sport, Arts & Culture
Transport
District
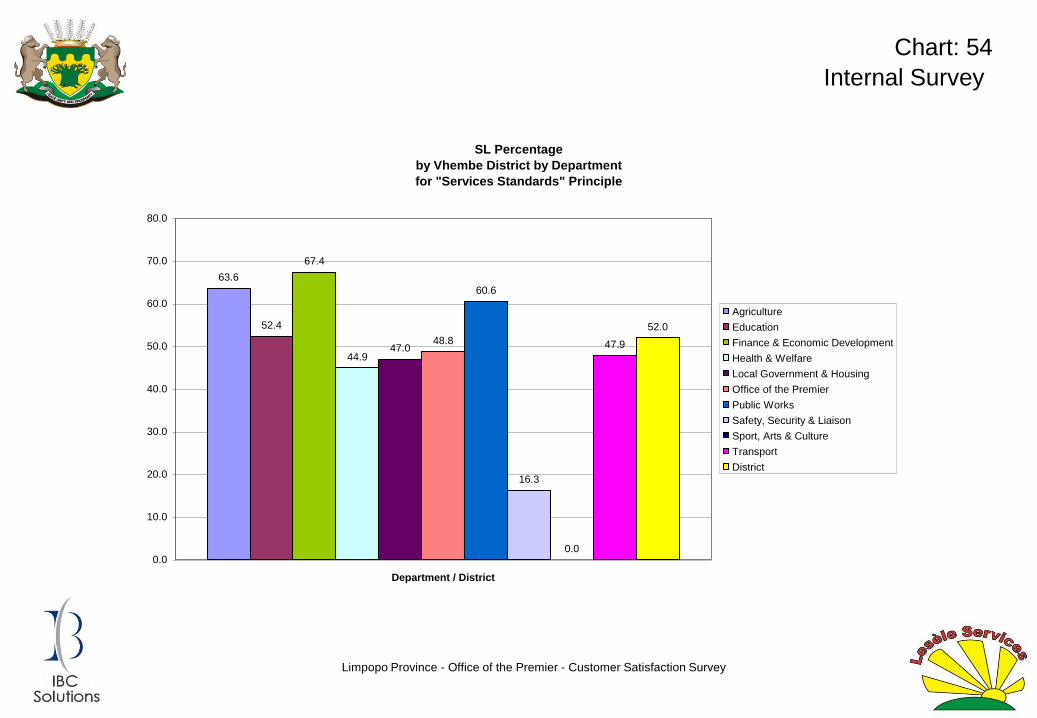
Limpopo Province - Office of the Premier - Customer Satisfaction Survey
Internal Survey
Chart: 54
SL Percentage
by Vhembe District by Department
for "Services Standards" Principle
63.6
52.4
67.4
44.947.0
48.8
60.6
16.3
0.0
47.9
52.0
0.0
10.0
20.0
30.0
40.0
50.0
60.0
70.0
80.0
Department / District
Agriculture
Education
Finance & Economic Development
Health & Welfare
Local Government & Housing
Office of the Premier
Public Works
Safety, Security & Liaison
Sport, Arts & Culture
Transport
District
Limpopo Province - Office of the Premier - Customer Satisfaction Survey
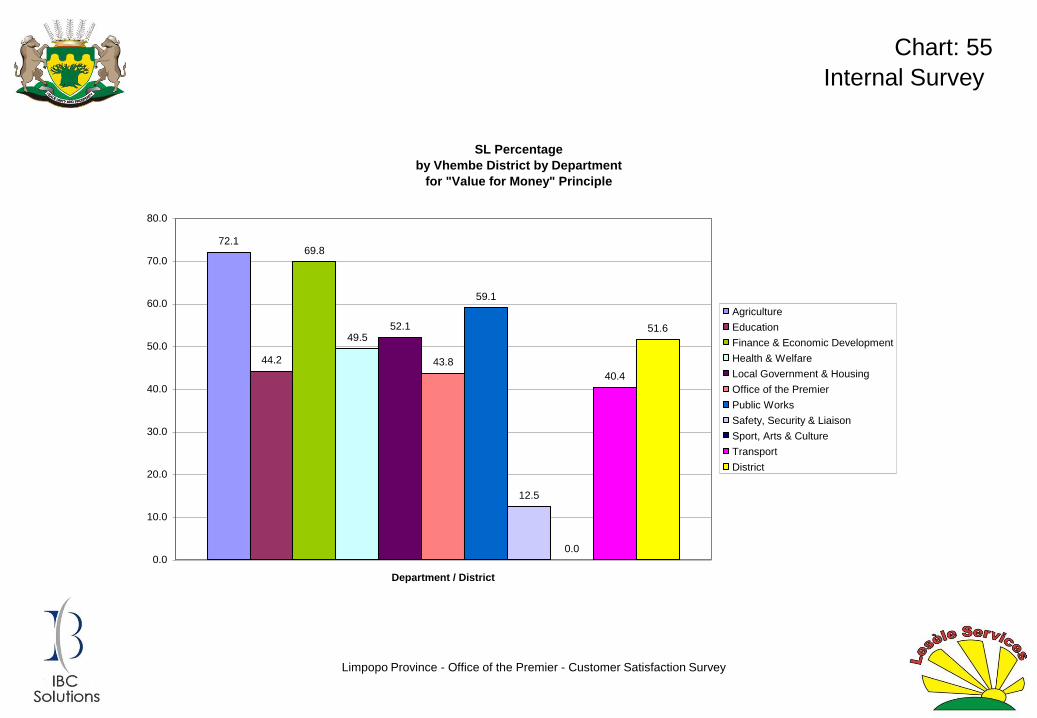
Internal Survey
Chart: 55
SL Percentage
by Vhembe District by Department
for "Value for Money" Principle
72.1
44.2
69.8
49.552.1
43.8
59.1
12.5
0.0
40.4
51.6
0.0
10.0
20.0
30.0
40.0
50.0
60.0
70.0
80.0
Department / District
Agriculture
Education
Finance & Economic Development
Health & Welfare
Local Government & Housing
Office of the Premier
Public Works
Safety, Security & Liaison
Sport, Arts & Culture
Transport
District
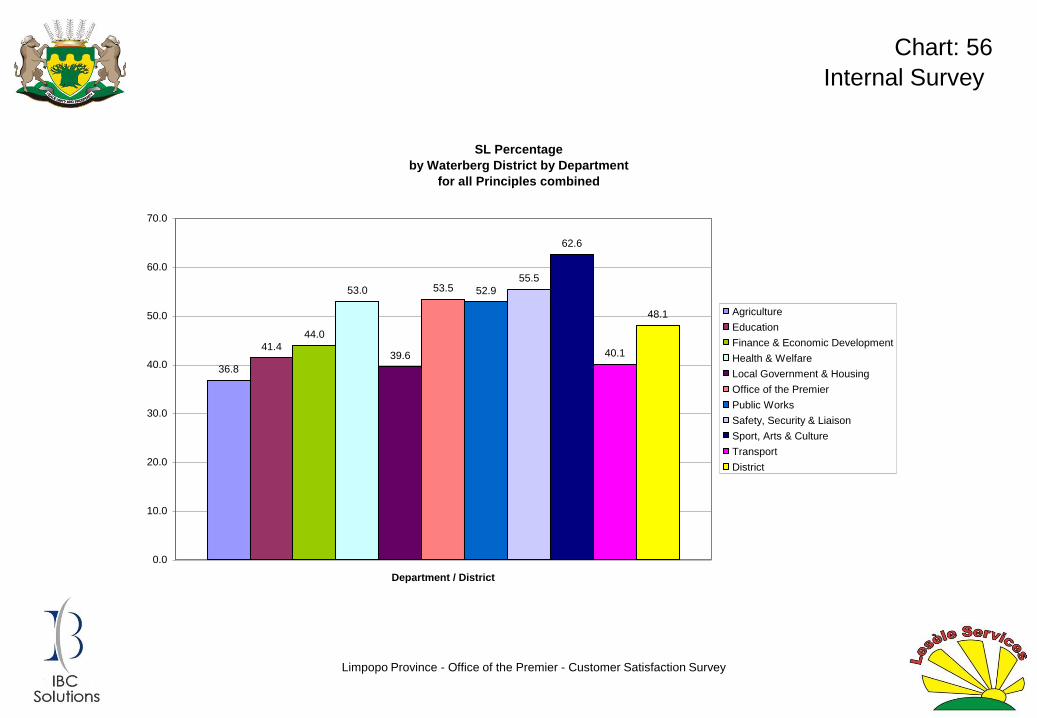
Limpopo Province - Office of the Premier - Customer Satisfaction Survey
Internal Survey
Chart: 56
SL Percentage
by Waterberg District by Department
for all Principles combined
36.8
41.4
44.0
53.0
39.6
53.5 52.9
55.5
62.6
40.1
48.1
0.0
10.0
20.0
30.0
40.0
50.0
60.0
70.0
Department / District
Agriculture
Education
Finance & Economic Development
Health & Welfare
Local Government & Housing
Office of the Premier
Public Works
Safety, Security & Liaison
Sport, Arts & Culture
Transport
District

Limpopo Province - Office of the Premier - Customer Satisfaction Survey
Internal Survey
Chart: 57
SL Percentage
by Waterberg District by Department
for "Access" Principle
39.4
44.6
50.0
56.0
42.5
51.652.9
56.4
51.0
42.7
49.6
0.0
10.0
20.0
30.0
40.0
50.0
60.0
Department / District
Agriculture
Education
Finance & Economic Development
Health & Welfare
Local Government & Housing
Office of the Premier
Public Works
Safety, Security & Liaison
Sport, Arts & Culture
Transport
District
Limpopo Province - Office of the Premier - Customer Satisfaction Survey
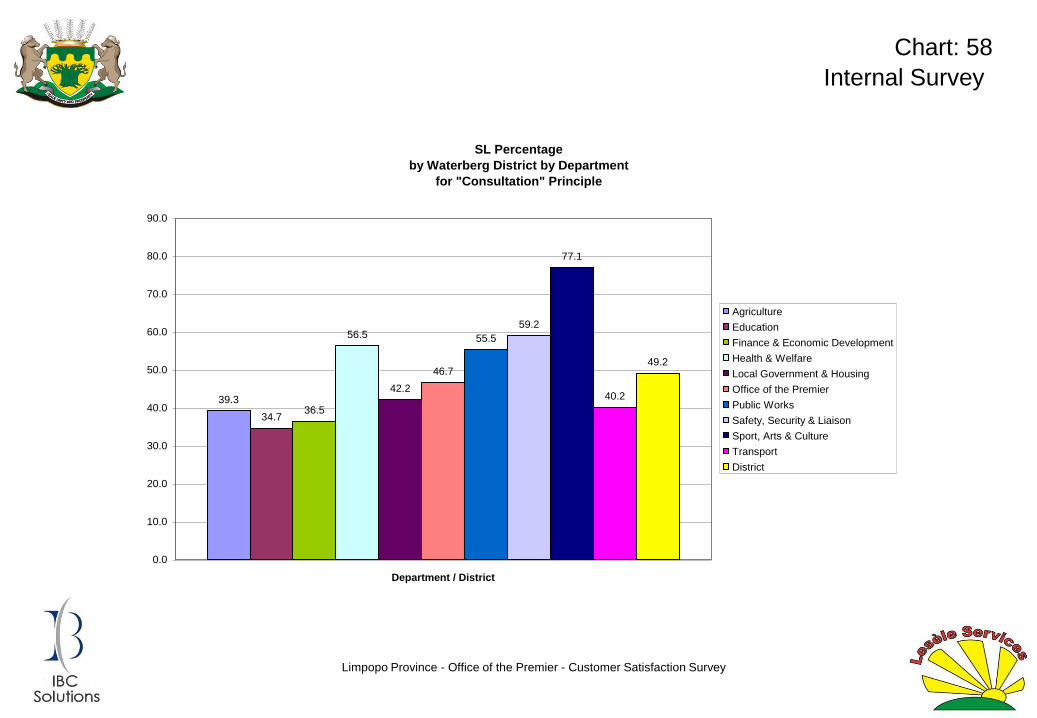
Internal Survey
Chart: 58
SL Percentage
by Waterberg District by Department
for "Consultation" Principle
39.3
34.736.5
56.5
42.2
46.7
55.5
59.2
77.1
40.2
49.2
0.0
10.0
20.0
30.0
40.0
50.0
60.0
70.0
80.0
90.0
Department / District
Agriculture
Education
Finance & Economic Development
Health & Welfare
Local Government & Housing
Office of the Premier
Public Works
Safety, Security & Liaison
Sport, Arts & Culture
Transport
District

Limpopo Province - Office of the Premier - Customer Satisfaction Survey
Internal Survey
Chart: 59
SL Percentage
by Waterberg District by Department
for "Courtesy" Principle
35.1
39.9
35.8
56.5
36.7
54.3
46.1
55.3
59.0
44.746.3
0.0
10.0
20.0
30.0
40.0
50.0
60.0
70.0
Department / District
Agriculture
Education
Finance & Economic Development
Health & Welfare
Local Government & Housing
Office of the Premier
Public Works
Safety, Security & Liaison
Sport, Arts & Culture
Transport
District

Limpopo Province - Office of the Premier - Customer Satisfaction Survey
Internal Survey
Chart: 60
SL Percentage
by Waterberg District by Department
for "Information" Principle
35.3
40.5
46.2
55.6
35.2
57.4
53.5
57.2
80.6
45.0
50.3
0.0
10.0
20.0
30.0
40.0
50.0
60.0
70.0
80.0
90.0
Department / District
Agriculture
Education
Finance & Economic Development
Health & Welfare
Local Government & Housing
Office of the Premier
Public Works
Safety, Security & Liaison
Sport, Arts & Culture
Transport
District

Limpopo Province - Office of the Premier - Customer Satisfaction Survey
Internal Survey
Chart: 61
SL Percentage
by Waterberg District by Department
for "Openness & Transparency" Principle
37.5
50.0
45.7
49.5
45.8
56.3 56.2 55.2
68.1
44.6
50.2
0.0
10.0
20.0
30.0
40.0
50.0
60.0
70.0
80.0
Department / District
Agriculture
Education
Finance & Economic Development
Health & Welfare
Local Government & Housing
Office of the Premier
Public Works
Safety, Security & Liaison
Sport, Arts & Culture
Transport
District
Limpopo Province - Office of the Premier - Customer Satisfaction Survey
Internal Survey
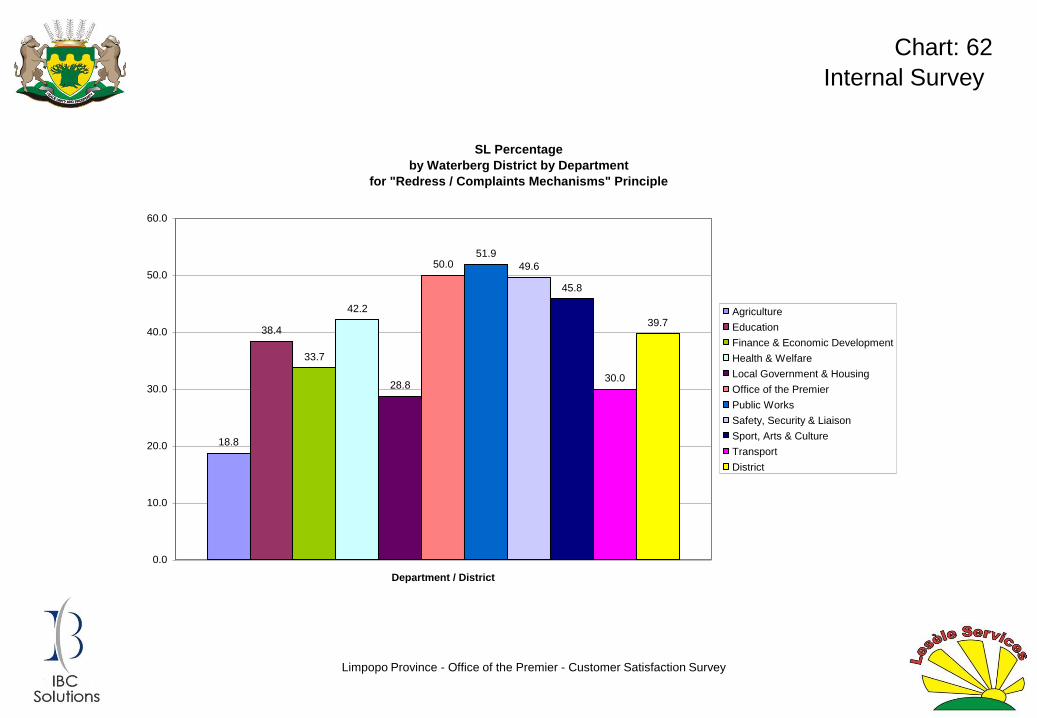
Chart: 62
SL Percentage
by Waterberg District by Department
for "Redress / Complaints Mechanisms" Principle
18.8
38.4
33.7
42.2
28.8
50.051.9
49.6
45.8
30.0
39.7
0.0
10.0
20.0
30.0
40.0
50.0
60.0
Department / District
Agriculture
Education
Finance & Economic Development
Health & Welfare
Local Government & Housing
Office of the Premier
Public Works
Safety, Security & Liaison
Sport, Arts & Culture
Transport
District
Limpopo Province - Office of the Premier - Customer Satisfaction Survey
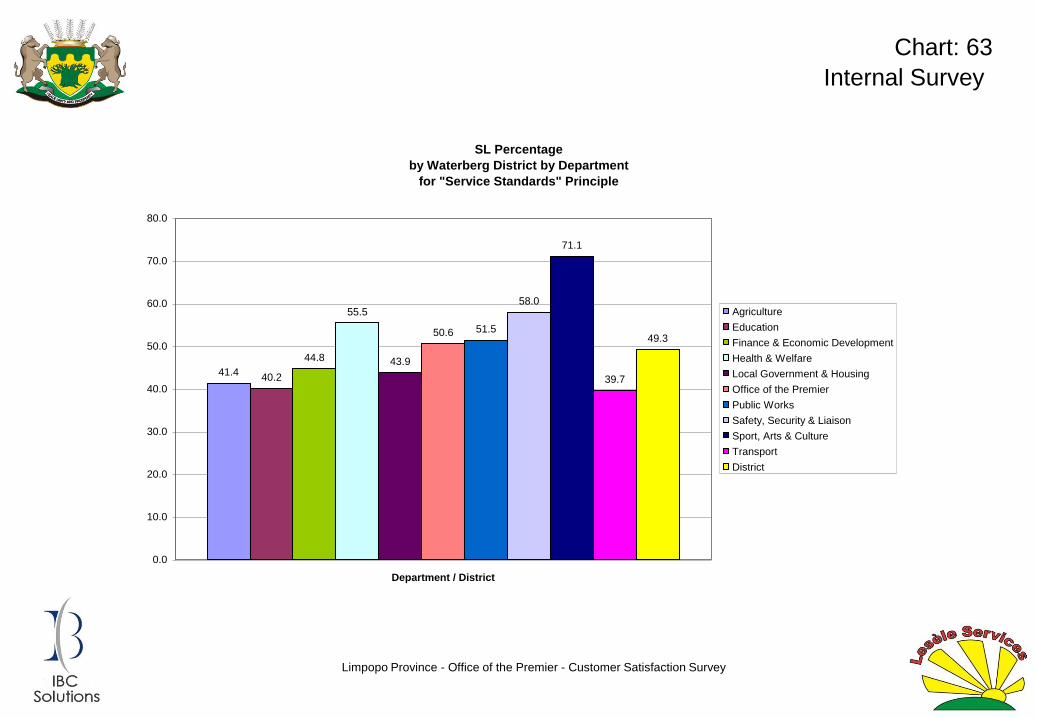
Internal Survey
Chart: 63
SL Percentage
by Waterberg District by Department
for "Service Standards" Principle
41.440.2
44.8
55.5
43.9
50.6 51.5
58.0
71.1
39.7
49.3
0.0
10.0
20.0
30.0
40.0
50.0
60.0
70.0
80.0
Department / District
Agriculture
Education
Finance & Economic Development
Health & Welfare
Local Government & Housing
Office of the Premier
Public Works
Safety, Security & Liaison
Sport, Arts & Culture
Transport
District
Limpopo Province - Office of the Premier - Customer Satisfaction Survey
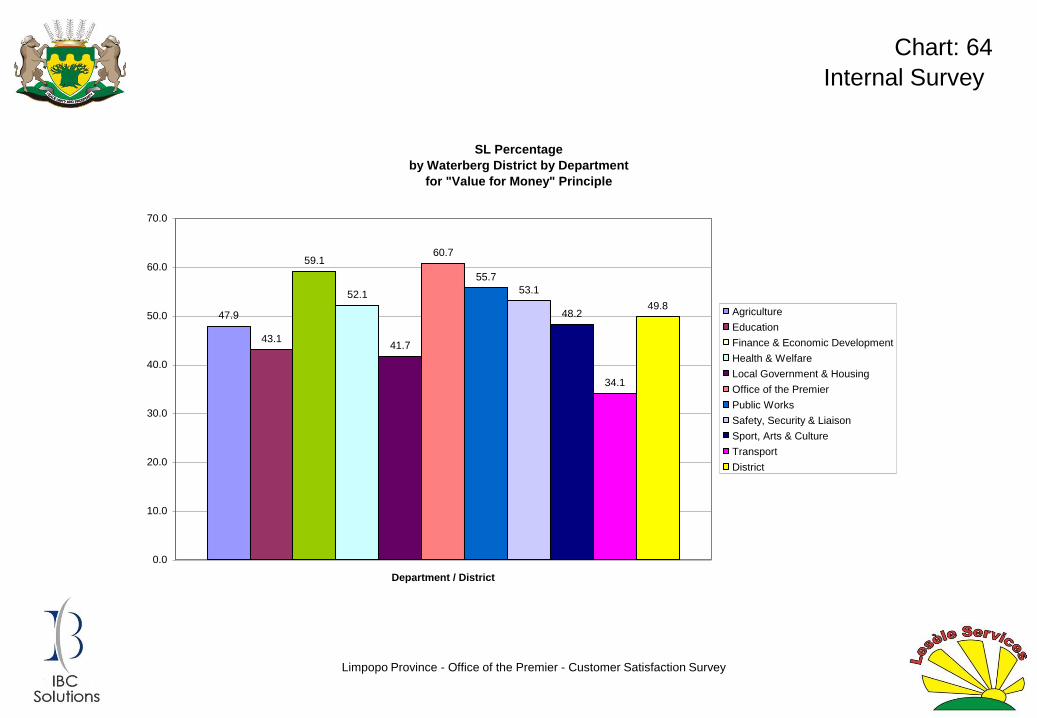
Internal Survey
Chart: 64
SL Percentage
by Waterberg District by Department
for "Value for Money" Principle
47.9
43.1
59.1
52.1
41.7
60.7
55.7
53.1
48.2
34.1
49.8
0.0
10.0
20.0
30.0
40.0
50.0
60.0
70.0
Department / District
Agriculture
Education
Finance & Economic Development
Health & Welfare
Local Government & Housing
Office of the Premier
Public Works
Safety, Security & Liaison
Sport, Arts & Culture
Transport
District
Related Documents