J. Basic. Appl. Sci. Res., 4(5)77-89, 2014 © 2014, TextRoad Publication ISSN 2090-4304 Journal of Basic and Applied Scientific Research www.textroad.com * Corresponding Author: Muhammad Khalilur Rahman, Graduate School of Business, Faculty of Business and Accountancy, University of Malaya, Kuala Lumpur, E-mail: [email protected], Customer Satisfaction as an Antecedent of Customer Loyalty in Malaysian Retail Marketing Muhammad Khalilur Rahman* 1 Md. Abdul Jalil 2 , S D Robel 2 and Abdullah-Al-Mamun 2 1 Graduate School of Business, Faculty of Business and Accountancy, University of Malaya, Kuala Lumpur 2 Faculty of Economics and Management Sciences, Department of Business Administration, International Islamic University Malaysia, Kuala Lumpur Received: March 3 2014 Accepted: April 4 2014 ABSTRACT The study focuses on measuring customers’ loyalty through satisfaction towards retail marketing strategy in Malaysian hypermarkets perspective. In this study, Vroom's ‘Expectancy Theory’ is exploited for theoretical model and discussing the findings. Data was collected by distributing self-administered questionnaire from Malaysian hypermarket’s customers through convenience sampling method. A total of 260 valid cases are selected for data analysis by using PLS based structural equation modeling technique. The results determine that pricing, quality service and quality product have significant relationship with customer satisfaction, and customer satisfaction has direct positive impact on customer loyalty. Nonetheless, the findings also revealed that pricing has direct significant relationship with customer loyalty while quality product does not found direct significant relationship with customer loyalty. Importantly, location has moderating effect between customer satisfaction and loyalty. However, it is hoped that this study could facilitate improving customer loyalty through customer satisfaction in Malaysian hypermarkets. KEYWORDS: Retail marketing, Strategy, Hypermarkets, Customer satisfaction, Customer loyalty, Malaysia 1. INTRODUCTION Malaysia is a country where the hypermarket industry is growing rapidly. Marko was the first to operate this genre of hypermarket which is doing business since 1993 (Sade & Rahman, 2013). In hypermarket business, customer loyalty is something that obtains over time by providing superior customer service for getting long term profit. Hypermarkets trade in a highly competitive market place where competitors know each other about their position (Codrington, 2002). Malaysian hypermarkets are growing drastically in the past decades (Heng, Yeong, Siong, Shi, & Kuan, 2011). The prominent foreign based retailers are attracting Malaysian consumers in different types of retail outlets of different sizes (Abu & Roslin, 2008). Loyal customers are shopping frequently in their chosen hypermarkets. In fact, loyal customers repeat and increase their purchase that helps to increase sales revenue of business organizations (Li & Green, 2010). Therefore, customers’ satisfaction and loyalty is the feedback of a successful retail marketing strategy in a competitive market that creates value for money for customers. Now, modern hypermarkets and traditional outlets have successfully coexisted in Malaysia without any discrimination from the customers (Abu & Roslin, 2008). Household income influences customers to be attracted in different types of outlets (Zain & Rejab, 1989). In Malaysia, traditional retail stores are always attracting the low and middle level income consumers. Modern retail formats are attracting the upper and middle income shoppers but at present it is fast changing as improved consumer lifestyles, changing consumer’s preferences and changing educational level of population (Abu & Roslin, 2008). In 1992, grocery retail sectors were operated by many foreign business firms (Abu & Roslin, 2008). Now, Malaysia is attracting other foreign names such as United Kingdom’s Tesco, France’s Carrefour, and Hong Kong based DFI which operates the Giant hypermarkets. There are so many hypermarkets and supermarkets in Malaysia. The following major hypermarkets and supermarkets are as shown in Table 1. Table 1: Major hypermarkets or superstores in Malaysia Store Name Property Retail formats No. of Stores Giant Dairy Farm International (DFI) Hong Kong 40 (Hypermarkets/Super Stores/) Total Giant stores 100 Tesco Tesco plc (70%) and Sime Darby Bhd (70%) Hypermarkets 35 Carrefour CNBV Holdings (70%) Negeri Sembilan royalty (30%) Hypermarkets 23 Econsave Econsave Supermarkets/Hypermarkets 38 Mydin The Mydin family 4 Hypermarkets Total Mydin stores 55 Jaya Jusco Aeon Group Co. Ltd (51%) Aberdin Asset Management, plc (7.4%) Superstore chain and shopping center operation 18 Source: Ganesan, 2010 77

Welcome message from author
This document is posted to help you gain knowledge. Please leave a comment to let me know what you think about it! Share it to your friends and learn new things together.
Transcript
J. Basic. Appl. Sci. Res., 4(5)77-89, 2014
© 2014, TextRoad Publication
ISSN 2090-4304 Journal of Basic and Applied
Scientific Research www.textroad.com
*Corresponding Author: Muhammad Khalilur Rahman, Graduate School of Business, Faculty of Business and Accountancy, University of Malaya, Kuala Lumpur, E-mail: [email protected],
Customer Satisfaction as an Antecedent of Customer Loyalty in Malaysian Retail Marketing
Muhammad Khalilur Rahman*1 Md. Abdul Jalil2, S D Robel2 and Abdullah-Al-Mamun2
1Graduate School of Business, Faculty of Business and Accountancy, University of Malaya, Kuala Lumpur
2Faculty of Economics and Management Sciences, Department of Business Administration, International Islamic University Malaysia, Kuala Lumpur
Received: March 3 2014 Accepted: April 4 2014
ABSTRACT
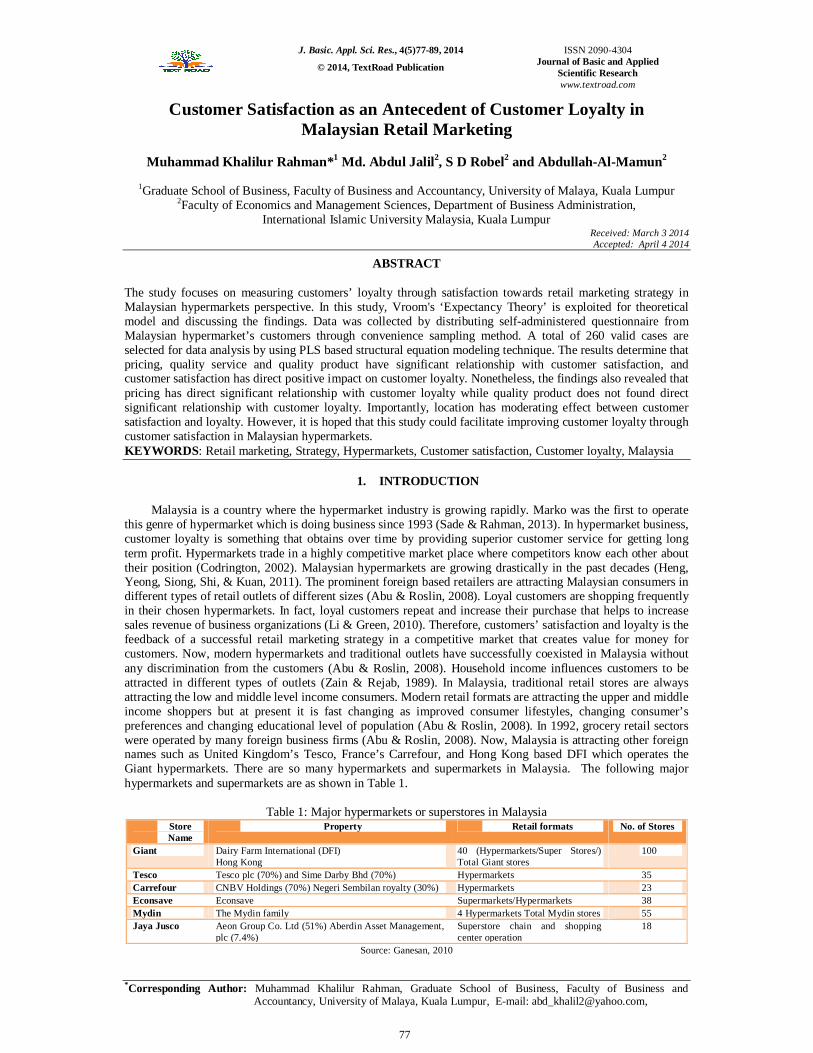
The study focuses on measuring customers’ loyalty through satisfaction towards retail marketing strategy in Malaysian hypermarkets perspective. In this study, Vroom's ‘Expectancy Theory’ is exploited for theoretical model and discussing the findings. Data was collected by distributing self-administered questionnaire from Malaysian hypermarket’s customers through convenience sampling method. A total of 260 valid cases are selected for data analysis by using PLS based structural equation modeling technique. The results determine that pricing, quality service and quality product have significant relationship with customer satisfaction, and customer satisfaction has direct positive impact on customer loyalty. Nonetheless, the findings also revealed that pricing has direct significant relationship with customer loyalty while quality product does not found direct significant relationship with customer loyalty. Importantly, location has moderating effect between customer satisfaction and loyalty. However, it is hoped that this study could facilitate improving customer loyalty through customer satisfaction in Malaysian hypermarkets. KEYWORDS: Retail marketing, Strategy, Hypermarkets, Customer satisfaction, Customer loyalty, Malaysia
1. INTRODUCTION Malaysia is a country where the hypermarket industry is growing rapidly. Marko was the first to operate
this genre of hypermarket which is doing business since 1993 (Sade & Rahman, 2013). In hypermarket business, customer loyalty is something that obtains over time by providing superior customer service for getting long term profit. Hypermarkets trade in a highly competitive market place where competitors know each other about their position (Codrington, 2002). Malaysian hypermarkets are growing drastically in the past decades (Heng, Yeong, Siong, Shi, & Kuan, 2011). The prominent foreign based retailers are attracting Malaysian consumers in different types of retail outlets of different sizes (Abu & Roslin, 2008). Loyal customers are shopping frequently in their chosen hypermarkets. In fact, loyal customers repeat and increase their purchase that helps to increase sales revenue of business organizations (Li & Green, 2010). Therefore, customers’ satisfaction and loyalty is the feedback of a successful retail marketing strategy in a competitive market that creates value for money for customers. Now, modern hypermarkets and traditional outlets have successfully coexisted in Malaysia without any discrimination from the customers (Abu & Roslin, 2008). Household income influences customers to be attracted in different types of outlets (Zain & Rejab, 1989). In Malaysia, traditional retail stores are always attracting the low and middle level income consumers. Modern retail formats are attracting the upper and middle income shoppers but at present it is fast changing as improved consumer lifestyles, changing consumer’s preferences and changing educational level of population (Abu & Roslin, 2008). In 1992, grocery retail sectors were operated by many foreign business firms (Abu & Roslin, 2008). Now, Malaysia is attracting other foreign names such as United Kingdom’s Tesco, France’s Carrefour, and Hong Kong based DFI which operates the Giant hypermarkets. There are so many hypermarkets and supermarkets in Malaysia. The following major hypermarkets and supermarkets are as shown in Table 1.
Table 1: Major hypermarkets or superstores in Malaysia
Store Name
Property Retail formats No. of Stores
Giant Dairy Farm International (DFI) Hong Kong
40 (Hypermarkets/Super Stores/) Total Giant stores
100
Tesco Tesco plc (70%) and Sime Darby Bhd (70%) Hypermarkets 35 Carrefour CNBV Holdings (70%) Negeri Sembilan royalty (30%) Hypermarkets 23 Econsave Econsave Supermarkets/Hypermarkets 38 Mydin The Mydin family 4 Hypermarkets Total Mydin stores 55 Jaya Jusco
Aeon Group Co. Ltd (51%) Aberdin Asset Management, plc (7.4%)
Superstore chain and shopping center operation
18
Source: Ganesan, 2010
77
Rahman et al., 2014
Next, this study reviews the Malaysian hypermarkets customer satisfaction and customer loyalty literature, and Vroom's expectancy motivational theory guided to develop theoretical model and discussing the findings. The methodology section, which follows the literature review, design the study, explains the sampling method and subsequent self-administered questionnaires to respondents. The survey questionnaires by using PLS-SEM with data analysis results and discussion precede the concluding remarks.
2. LITERATURE REVIEW 2.1 Pricing as a Retail Customer Satisfaction and Loyalty
According to Zeithaml (1988) price is something that consumers sacrifice for obtaining a product or service. Retail pricing is one of the most critical decisions in the retail business sector (Grewal & Levy, 2007). Many researches have been conducted on the advantages of developing and maintaining a loyal customer database (Bolton, Warlop, & Alba, 2003; Reichheld, & Sasser, 1990; Rust, & Zahorik, 1993). The level of satisfaction is always more when customers pay less but receive more in return. Monroe, (1990) argue that a customer’s perceptions towards its price depend on the trade-off between quality of the benefits they receive and they pay for a product while they buy it. Price transparency is another important factor of satisfying customers which is represented by the overview of company’s quoted prices (Matzler, Wurtele, & Renzl, 2006). Price has heavy influence where there is a consistency between price and performance. On the other hand, price transparency effects on the reverse way in case of inconsistency in price and performance of the product or service. It means price-quality ratio can enhance customers’ satisfaction (Lam, Shankar, Erramilli, and Murthy, 2004) and thus brings loyalty for the company (Bolton, and Drew, 1991; Sirdeshmukh et al., 2002). Customers also look for the relative competitive price when market is highly dense. Undoubtedly, the price is an important indicator in aspect of its quality, relative price, price confidence and price transparency which has strong impact on satisfaction and ultimately on loyalty (Matzler, Wurtele, & Renzl, 2006). Negative consumer responses occur when customers feel that a company is practicing unfair price for them. If there is a change in price, the customers should be well informed in order to build trust and keeping long term relationships which results customers’ loyalty. Studies found that customers’ perception is negative towards demand based price, such as dynamic pricing, which is harmful for building trust (Garbarino, and Lee, 2003). Based on this the following hypothesis are proposed:
H1: Pricing is positively related with customer satisfaction in measuring customer’s satisfaction and customer’s loyalty in retail marketing strategy in Malaysian hypermarkets setting. H1a: Pricing strategy has direct effect on customer loyalty. 2.2 Quality Service as a Retail Customer Satisfaction and Loyalty
The main function of the retail marketing strategy is delivery of better and satisfactory services. The retailers should perform delivery of quality service to their potential customers besides their regular customers. Service quality is an important dimension of customers’ loyalty through customers’ satisfaction in the retail industry. It is a subjective, complex and abstract concept that means different people have different views of product perspectives and concepts. According to Parasuraman et al. (1985) and Grönroos (1984), service quality is the assessment made by the consumers’ perceptions and expectations of received services as these factors comprise corporate image and functional quality. Service quality is the consumers’ perception of particular dimensions of products or services, such as, reliability, assurance, tangibility, courteousness, personalization, communication and responsiveness all of which have to be incorporated into the company’s strategic policy which in itself rationally affects the consumers’ satisfaction by providing excellent services including personal factors, situational factors and product quality. Parasuraman et al. (1985) and many researchers have developed the SERVQUAL scale which is very important for measuring the customers’ service quality. There were ten dimensions of service quality, but later these were reduced to five dimensions which included tangibility, reliability, assurance, responsiveness and empathy. Service quality has a tangible link to customers’ satisfaction, as in fact, the consumers’ satisfaction is represented by the service quality in one way or another. Hence, service quality is an antecedent to customers’ satisfaction and loyalty (Su, 2004; Jamali, 2007). Service quality is a cognitive assessment which may invariably influence the customers’ satisfaction (Oh, 1999). In this literature, the customers’ loyalty through satisfaction is the outcome of the proper enforcement of the service quality in the retail marking strategy. Thus, the study examines the following hypothesis:
H2: Quality service has a positive impact on customer satisfaction in Malaysian hypermarkets context. 2.3 Quality Product as a Retail Customer Satisfaction and Loyalty
In this study, five most important elements have been considered to measure the dimensions of a product quality for the customers’ satisfaction and loyalty such as product durability, product variety, product freshness, product attractiveness and brand equity. All these attributes are important to be used for measuring the
78
J. Basic. Appl. Sci. Res., 4(5)77-89, 2014
customers’ satisfaction and loyalty (Yuen & Chan, 2010), but most other relevant elements are also useful for improving the customers’ satisfaction and loyalty (Garvin, 1987). Product variety is important for the retailers to serve the customers’ buying behavior, because different customers have different preferences of product quality (Dhar et al., 2001). Mosa & Omar (2011) demonstrated that the business firms had begun to develop the customers’ satisfaction and loyalty by offering good quality products and services. According to Bolten, Kennerknecht, & Spiller (2006) posited that the main determinants of customer satisfaction and loyalty are the service and product quality. The study by Minguela (2011) and Minguela et al. (2006) point out that product quality is a key component through which retailers or busienss firms can differentiate themselves from their competitors and they can gain competitive business advantages. Baes on this the following hypotheisi are tested: H3: Quality product has positive impact on customer satisfaction towards retail marketing strategy. H3a: Quality product has direct impact to customer loyalty. 2.4 Customer Satisfaction as an Antecedent Tool of Retail Customers Loyalty
Retailers and manufacturers argue that Customers’ satisfaction is a necessary predecessor to customers’ loyalty. According to Sivadas & Baker-Prewitt (2000) who cited in Abdullah et al. (2012), academicians and practitioners are agreed that customers’ satisfaction is an important precursor to customers’ loyalty. Bennett & Rundle-Thiele (2004) assumed that customers are likely to increase their loyalty but it should not be only business goal oriented by the business organizations, as it also should also fulfill the customers’ actual perceived values on the products and services offered. The study by Srinivasana et al. (2002) formulated that customers’ satisfaction is deeply associated with the brand loyalty and service quality. Therefore, customers’ satisfaction is defined as matters that concern the post purchase of a particular product or service. Hoq & Amin (2010) posited that Customer satisfaction was the emotional behavior or cognitive attitudes towards the buying of products and services. In retail strategy, the customer is the key element, because the customer’s satisfaction is the nature of the relationship between the consumers and the service providers of the manufacturing goods and services. Product and service quality are both prerequisite dimensions for customers’ satisfaction of particular products (Hoq & Amin, 2010). Sivadas & Baker-Prewitt (2000) indicated that the customer’s satisfaction is the customer’s response to determine the repeat buying of goods or services. Satisfied customers are the loyal customers (Rowley, 2005) as this has been examined by many researchers that there is a significant relationship between the customers’ satisfaction and customers’ loyalty (Kandampully & Suhartanto, 2000; Szymanski & Henard, 2001; Abdullah et al., 2012). Customers are satisfied by achieving expected perceived values of goods and services. As Singh (2006) explained that customers’ satisfaction could occur when a company could be able to provide better product and service than the customer’s expectation. Each business firm has a positive and a negative impact on a relation with the customers. Thus, the following hypothesis is developed: H4: Customer satisfaction has direct relationship on customer loyalty towards retail marketing strategy in Malaysian hypermarkets perspectives. 2.5 Location has moderating effect between Customer Satisfaction and loyalty
Location is one of the key factors for getting retail customers loyalty through satisfaction in hypermarket. If any hypermarket wants to get customer satisfaction, first, they should ensure accessible and convenient location, meaning hypermarket location must be near to residential area, entrance of the city and heart of the city. Second, availability of transportation facility is very important for a store location otherwise consumers cannot visit the store easily; therefore, the sale margin will collapse. Additionally, consumers also prefer to have a routine shopping experience that is simple and efficient in a convenient place (Hassan & Rahman 2012). Third, hypermarket location must be in urban and semi urban areas, because it is obvious that in rural areas the density of population is less than city. Besides, the affordability of city people is much higher as they earn more. Apart from these three (mentioned above) preferences regarding the location of a hypermarket, there are other factors as well, which will inevitably affect this business and customer’s loyalty. The first thing to consider is the availability of maximum number of products of various kinds. In the city area, people are too busy that is why they prefer to shop in a place where everything is available. As Hassan & Rahman (2012) stated that due to urban lifestyle pressure, shoppers will always look for convenience where everything can be done at one particular place with minimum hassle (2012). Service is an instrument that can be used to establish customer loyalty in the long term and customers always expects a good location of shopping place whereas they can easily park their car (Swoboda & Schramm-Klein, 2007). Car parking facility has a weighty impact to develop loyal customer, as a result we see that all hypermarkets provide free parking for consumers as a basic service (Hassan, Sade & Rahman 2013). Every hypermarket is providing car parking facility but in some location people are facing hassle to park their car because of insufficient parking area. Nowadays, people are not likely to carry cash so that they seek which hypermarket has the more convenient ATM or Bank services. Malaysian people enjoy to shop in a location where they do their shopping and are able to entertain themselves. For those
79
Rahman et al., 2014
shoppers who have children, a playground or indoor play-land may become an attraction to spend time together with family members. A covered parking area is highly suitable for Malaysian weather to reduce heat from the sun or provide shelter against rain, which makes it convenient for the shopper to push the shopping trolley. A food and beverage area, such as a food court, restaurant or kiosk, is a suitable place for shoppers who would like to have a short break while shopping (Hassan & Rahman 2012). H5: Location has moderating impact between customer satisfaction and customer loyalty in retail marketing strategy in Malaysian hypermarkets context. 2.6 Retail Customer Loyalty
Customers’ loyalty means the customers are committed to buying goods or services at a particular retailer’s locations (Berman & Evans, 2006: 144). Retailers think that the customers’ loyalty is secured by developing brand strategy and creating emotional attitudes towards the purchase behavior of goods and services through loyalty programs. Customers have individual loyalty concept (Saili et al., 2012) to specific product, stores and companies (Kotler et al., 2009: 136). Customers’ loyalty is defined as customers are committed, either emotionally or sensibly, to repurchase (Szwarc, 2005) the preferred goods and services in the particular retailer’s market (Levy & Weitz, 2004) which is also considered as a firm’s long term survival goal and objectives (Mandhachitara & Poolthong, 2011). It is not only the basis for developing business plan, but it also becomes sustainable in a competitive marketing strategy (Dick & Basu, 1994; Mandhachitara & Poolthong, 2011). Jacoby & Chestnut (1978) stated that customers’ loyalty was held by the consumers who frequently did shopping of goods or services at particular outlets. Consumers’ attributes on repeat purchase of goods are generated by the degree of enhancement of the service quality and store attributes in the retail business strategy. Customers’ frequent buying intentions towards goods or services from particular outlets are the key dimensions that produce customers’ loyalty in the retail strategy. Saili (2012) has referred to Reynolds & Arnold’s (2000) statement, and posited that customers’ loyalty was drived from shopping behavoirs and loyalty attitudes which were recognized based on the service quality and product quality (Gonring, 2008; Abdullah, 2012).
2.7 Theoretical Foundation This research is explicitly grounded in a theoretical foundation encompassing Vroom's (1964) expectancy
theory. It provides an explanation of why hypermarkets consumers choose one behavioral option over others. “The fundamental concept of this theory is to focus customers will be motivated because they believe that their decision will lead to their desired outcome” (Redmond, 2010). Expectancy theory proposes that consumers’ motivation is depend upon the perceived value of predicted outcomes (Ilgen, Nebeker, & Pritchard, 1981). This has positive benefit improving consumers’ motivation towards satisfaction as well as loyalty since it may help hypermarkets industry and managers developing customers’ attributes towards loyalty through satisfaction in hypermarkets. This theory builds upon the idea that motivation drives from a consumer believing they will get what they expectation in the form of perceived value and satisfaction (Eerde & Thierry, 1996). This theory is not all inclusive of different influencing factors but it provides industry managers or policy makers or organizational leaders with a foundation on which to improve a better decision making and understanding of ways to motivate consumers through their expectation. Basically, expectancy theory is a process theory of motivation since it emphasizes different perceptions of the environment and subsequent interactions arising as a consequence of consumers’ expectation. Lawler, Porter, & Vroom (2009) found that effort (expectancy) or and performance (instrumentality) are positively correlated and favorable performance will result in a desirable reward (valence) or value of expected outcome to the individual (Miller, 2013).
Expectancy theory is more concerned with the reasoning antecedents that go into inspiration and way they relate to each other (Ilgen et al., 1981; Miller, 2013). In fact, expectancy theory is a cognitive process theory of motivation that is based on the concept that people believe there are relationships between the effort (expectancy) they put forth at work, performance or instrumentality achieved from the effort and rewards or outcome received from effort and performance (Lunenburg, 2011). Hypermarkets’ consumers will be motivated if they believe that perceived values (expectancy) lead to customer satisfaction (instrumentality) and customers’ satisfaction will lead to customer loyalty (valence). Ilgen et al. (1981) and Miller (2013) stated that people will be motivated if they believe that strong effort will lead to good performance and good performance will lead to desired rewards. Victor Vroom (1964) was the first to develop an expectancy theory with direct application to work setting, which was later expanded and sophisticated by Porter & Lawler (1968) and others (Pinder, 1984). Vroom’s expectancy theory addresses motivation and management (Lunenburg, 2011; Ellingson & McFarland, 2011) whereas it suggests that consumer’s perceived view of an outcome will define the level of motivation. It also assumes that the choice being made are to increase satisfaction and decrease dissatisfaction. Individual factors including service quality, product quality, price strategy and store attributes have an impact on customer loyalty through customer satisfaction. Vroom (1964) illustrated that the source of consumer’s motivation in expectancy theory is a multiplicative function of valence, instrumentality and expectancy (Stecher & Rosse, 2007). Vroom (1964) stated that consumer conciously selected a particular course of action based upon
80
J. Basic. Appl. Sci. Res., 4(5)77-89, 2014
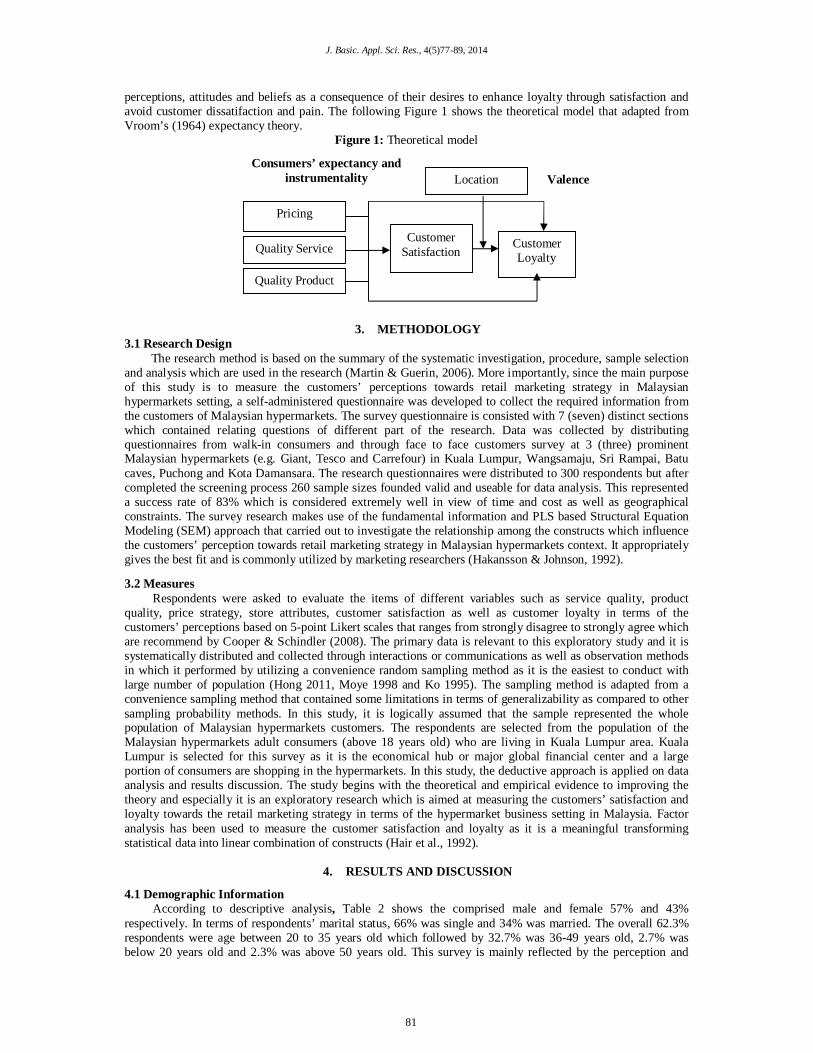
perceptions, attitudes and beliefs as a consequence of their desires to enhance loyalty through satisfaction and avoid customer dissatifaction and pain. The following Figure 1 shows the theoretical model that adapted from Vroom’s (1964) expectancy theory.
Figure 1: Theoretical model
3. METHODOLOGY 3.1 Research Design
The research method is based on the summary of the systematic investigation, procedure, sample selection and analysis which are used in the research (Martin & Guerin, 2006). More importantly, since the main purpose of this study is to measure the customers’ perceptions towards retail marketing strategy in Malaysian hypermarkets setting, a self-administered questionnaire was developed to collect the required information from the customers of Malaysian hypermarkets. The survey questionnaire is consisted with 7 (seven) distinct sections which contained relating questions of different part of the research. Data was collected by distributing questionnaires from walk-in consumers and through face to face customers survey at 3 (three) prominent Malaysian hypermarkets (e.g. Giant, Tesco and Carrefour) in Kuala Lumpur, Wangsamaju, Sri Rampai, Batu caves, Puchong and Kota Damansara. The research questionnaires were distributed to 300 respondents but after completed the screening process 260 sample sizes founded valid and useable for data analysis. This represented a success rate of 83% which is considered extremely well in view of time and cost as well as geographical constraints. The survey research makes use of the fundamental information and PLS based Structural Equation Modeling (SEM) approach that carried out to investigate the relationship among the constructs which influence the customers’ perception towards retail marketing strategy in Malaysian hypermarkets context. It appropriately gives the best fit and is commonly utilized by marketing researchers (Hakansson & Johnson, 1992). 3.2 Measures
Respondents were asked to evaluate the items of different variables such as service quality, product quality, price strategy, store attributes, customer satisfaction as well as customer loyalty in terms of the customers’ perceptions based on 5-point Likert scales that ranges from strongly disagree to strongly agree which are recommend by Cooper & Schindler (2008). The primary data is relevant to this exploratory study and it is systematically distributed and collected through interactions or communications as well as observation methods in which it performed by utilizing a convenience random sampling method as it is the easiest to conduct with large number of population (Hong 2011, Moye 1998 and Ko 1995). The sampling method is adapted from a convenience sampling method that contained some limitations in terms of generalizability as compared to other sampling probability methods. In this study, it is logically assumed that the sample represented the whole population of Malaysian hypermarkets customers. The respondents are selected from the population of the Malaysian hypermarkets adult consumers (above 18 years old) who are living in Kuala Lumpur area. Kuala Lumpur is selected for this survey as it is the economical hub or major global financial center and a large portion of consumers are shopping in the hypermarkets. In this study, the deductive approach is applied on data analysis and results discussion. The study begins with the theoretical and empirical evidence to improving the theory and especially it is an exploratory research which is aimed at measuring the customers’ satisfaction and loyalty towards the retail marketing strategy in terms of the hypermarket business setting in Malaysia. Factor analysis has been used to measure the customer satisfaction and loyalty as it is a meaningful transforming statistical data into linear combination of constructs (Hair et al., 1992).
4. RESULTS AND DISCUSSION
4.1 Demographic Information According to descriptive analysis, Table 2 shows the comprised male and female 57% and 43%
respectively. In terms of respondents’ marital status, 66% was single and 34% was married. The overall 62.3% respondents were age between 20 to 35 years old which followed by 32.7% was 36-49 years old, 2.7% was below 20 years old and 2.3% was above 50 years old. This survey is mainly reflected by the perception and
Pricing
Quality Product
Customer Satisfaction
Customer Loyalty
Quality Service
Location
Consumers’ expectancy and instrumentality
Valence
81
Rahman et al., 2014
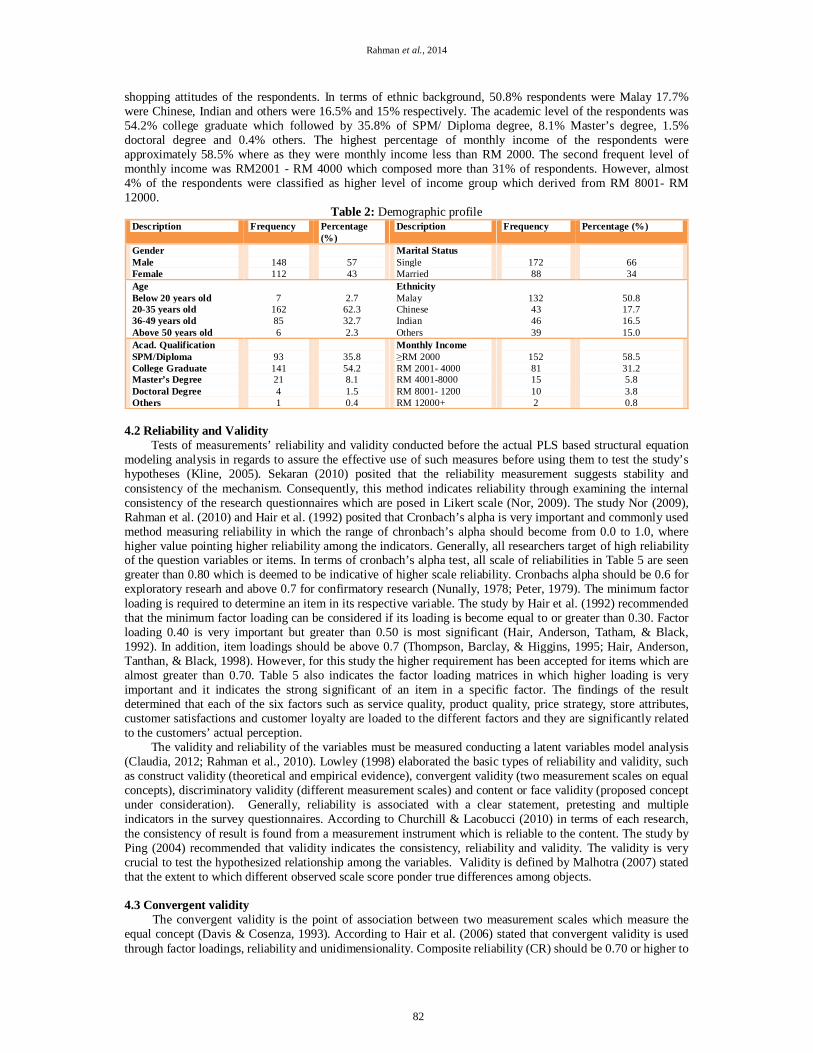
shopping attitudes of the respondents. In terms of ethnic background, 50.8% respondents were Malay 17.7% were Chinese, Indian and others were 16.5% and 15% respectively. The academic level of the respondents was 54.2% college graduate which followed by 35.8% of SPM/ Diploma degree, 8.1% Master’s degree, 1.5% doctoral degree and 0.4% others. The highest percentage of monthly income of the respondents were approximately 58.5% where as they were monthly income less than RM 2000. The second frequent level of monthly income was RM2001 - RM 4000 which composed more than 31% of respondents. However, almost 4% of the respondents were classified as higher level of income group which derived from RM 8001- RM 12000.
Table 2: Demographic profile Description Frequency Percentage
(%) Description Frequency Percentage (%)
Gender Male Female
148 112
57 43
Marital Status Single Married
172 88
66 34
Age Below 20 years old 20-35 years old 36-49 years old Above 50 years old
7
162 85 6
2.7
62.3 32.7 2.3
Ethnicity Malay Chinese Indian Others
132 43 46 39
50.8 17.7 16.5 15.0
Acad. Qualification SPM/Diploma College Graduate Master’s Degree Doctoral Degree Others
93 141 21 4 1
35.8 54.2 8.1 1.5 0.4
Monthly Income ≥RM 2000 RM 2001- 4000 RM 4001-8000 RM 8001- 1200 RM 12000+
152 81 15 10 2
58.5 31.2 5.8 3.8 0.8
4.2 Reliability and Validity
Tests of measurements’ reliability and validity conducted before the actual PLS based structural equation modeling analysis in regards to assure the effective use of such measures before using them to test the study’s hypotheses (Kline, 2005). Sekaran (2010) posited that the reliability measurement suggests stability and consistency of the mechanism. Consequently, this method indicates reliability through examining the internal consistency of the research questionnaires which are posed in Likert scale (Nor, 2009). The study Nor (2009), Rahman et al. (2010) and Hair et al. (1992) posited that Cronbach’s alpha is very important and commonly used method measuring reliability in which the range of chronbach’s alpha should become from 0.0 to 1.0, where higher value pointing higher reliability among the indicators. Generally, all researchers target of high reliability of the question variables or items. In terms of cronbach’s alpha test, all scale of reliabilities in Table 5 are seen greater than 0.80 which is deemed to be indicative of higher scale reliability. Cronbachs alpha should be 0.6 for exploratory researh and above 0.7 for confirmatory research (Nunally, 1978; Peter, 1979). The minimum factor loading is required to determine an item in its respective variable. The study by Hair et al. (1992) recommended that the minimum factor loading can be considered if its loading is become equal to or greater than 0.30. Factor loading 0.40 is very important but greater than 0.50 is most significant (Hair, Anderson, Tatham, & Black, 1992). In addition, item loadings should be above 0.7 (Thompson, Barclay, & Higgins, 1995; Hair, Anderson, Tanthan, & Black, 1998). However, for this study the higher requirement has been accepted for items which are almost greater than 0.70. Table 5 also indicates the factor loading matrices in which higher loading is very important and it indicates the strong significant of an item in a specific factor. The findings of the result determined that each of the six factors such as service quality, product quality, price strategy, store attributes, customer satisfactions and customer loyalty are loaded to the different factors and they are significantly related to the customers’ actual perception.
The validity and reliability of the variables must be measured conducting a latent variables model analysis (Claudia, 2012; Rahman et al., 2010). Lowley (1998) elaborated the basic types of reliability and validity, such as construct validity (theoretical and empirical evidence), convergent validity (two measurement scales on equal concepts), discriminatory validity (different measurement scales) and content or face validity (proposed concept under consideration). Generally, reliability is associated with a clear statement, pretesting and multiple indicators in the survey questionnaires. According to Churchill & Lacobucci (2010) in terms of each research, the consistency of result is found from a measurement instrument which is reliable to the content. The study by Ping (2004) recommended that validity indicates the consistency, reliability and validity. The validity is very crucial to test the hypothesized relationship among the variables. Validity is defined by Malhotra (2007) stated that the extent to which different observed scale score ponder true differences among objects.
4.3 Convergent validity
The convergent validity is the point of association between two measurement scales which measure the equal concept (Davis & Cosenza, 1993). According to Hair et al. (2006) stated that convergent validity is used through factor loadings, reliability and unidimensionality. Composite reliability (CR) should be 0.70 or higher to
82
J. Basic. Appl. Sci. Res., 4(5)77-89, 2014
identify adequate convergence or internal consistency (Gefen et a., 2000). The internal consistency coefficient should be above 0.7 (Hair, Anderson, Tanthan, & Black, 1998; Thompson, Barclay, & Higgins, 1995). In a validity perspective, briefly it can be defined that the content validity is achieved through careful research design but convergent validity is achieved when multiple indicators functions consistently. Multiple elements are used to measure all the constructs that can lead to accurate convergent validity. Construct validity occurs when data are statistically analyzed, examined, and described. The important factors of the customers’ satisfaction and loyalty were in detail and its validity and reliability scale was verified in the analysis. The factors can be considered as significant when they are determined by a factor loading greater than 0.5. The Cronbach’s alpha coefficient is also very important to test the reliability of the scale. According to Fornell & Larcker (1981) posited that discriminatory validity is achieved when the ratio of variance removed in each construct exceeds the square of the coefficient which represents the correlation with other constructs. In terms of reliability, the evaluation of an instrument can be made by using the construct validity and internal validity. The Cronbache’s alpha coefficient is used to examine the reliability of the scale that is accepted on the lower limit from 0.60 to 0.70 (Hair, Anderson, Tanthan, & Black, 1998). 4.4 Content validity
Content validity is a systematic evaluation (Malhotra, 2007). It is related to the accuracy of the measurement or valid scale measure what it is designed for and what it is supposed to measure (Bollen, 1989; Davis & Cosenza, 1993). The content validity is associated with the degree in which the content of the indicator ponders the proposed concept (Parasuraman, Berry, & Zeithaml, 1988; Burns & Bush, 2000). On the other hand, the construct validity is the stage where it achieves theoritical and emperical evidence (Steemkamp & Trijp, 1991). The study by Hair et al (2006) posited that construct validity provides the confidence that represents the accurate score. In this study, a strong content validity in variables was measured based on literature review.
Figure 2: Structural Model
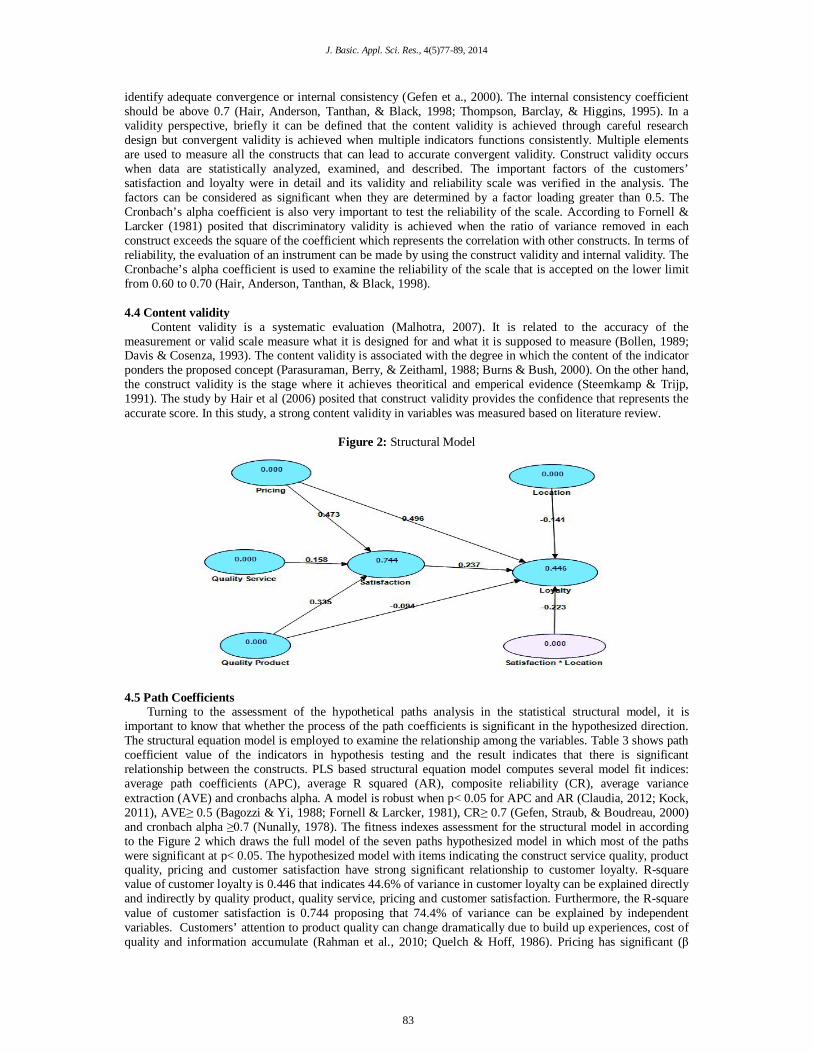
4.5 Path Coefficients Turning to the assessment of the hypothetical paths analysis in the statistical structural model, it is important to know that whether the process of the path coefficients is significant in the hypothesized direction. The structural equation model is employed to examine the relationship among the variables. Table 3 shows path coefficient value of the indicators in hypothesis testing and the result indicates that there is significant relationship between the constructs. PLS based structural equation model computes several model fit indices: average path coefficients (APC), average R squared (AR), composite reliability (CR), average variance extraction (AVE) and cronbachs alpha. A model is robust when p< 0.05 for APC and AR (Claudia, 2012; Kock, 2011), AVE≥ 0.5 (Bagozzi & Yi, 1988; Fornell & Larcker, 1981), CR≥ 0.7 (Gefen, Straub, & Boudreau, 2000) and cronbach alpha ≥0.7 (Nunally, 1978). The fitness indexes assessment for the structural model in according to the Figure 2 which draws the full model of the seven paths hypothesized model in which most of the paths were significant at p< 0.05. The hypothesized model with items indicating the construct service quality, product quality, pricing and customer satisfaction have strong significant relationship to customer loyalty. R-square value of customer loyalty is 0.446 that indicates 44.6% of variance in customer loyalty can be explained directly and indirectly by quality product, quality service, pricing and customer satisfaction. Furthermore, the R-square value of customer satisfaction is 0.744 proposing that 74.4% of variance can be explained by independent variables. Customers’ attention to product quality can change dramatically due to build up experiences, cost of quality and information accumulate (Rahman et al., 2010; Quelch & Hoff, 1986). Pricing has significant (β
83
Rahman et al., 2014
0.473, p< 0.00) impact on customer satisfaction, and direct significant effect on customer loyalty (β 0.496, p< 0.00), as a result H1 and H1a is accepted. Hellstrand (2010) posited that customers’ expectation and loyalty are closely related with the fair price strategy. Quality service has positive relationship (β= 0.158, p< 0.05) to customer satisfaction. Therefore, H2 is supported. Quality product has significant (β=0.335, p < 0.00) impact on customer satisfaction, whereas H3 is accepted. On the other hand, quality product (β= -0.094, p ≥ 0.05) has not direct effect on customer loyalty. Therefore, H3a is not supported. Product quality has a significant impact on customers’ satisfaction (Tu et al., 2011) as product quality based on the perception and expectation of customers (Rahman et al., 2010; Wal, Van, & Bond, 2002). For hypothesis (H4), customer satisfaction (β 0.237, p<0.05) has direct impact on customer loyalty. Finally, location (β= -0.141) has moderating effect between customer satisfaction and customer loyalty.
Table 3: Hypotheses Testing Hypothesis Relationship Beta Std. Error T Statistics Decision H1 Price -> Satisfaction 0.4734 0.1092 4.3346** Supported H1a Price -> Loyalty 0.4961 0.1906 2.6028* Supported H2 Quality Service -> Satisfaction 0.1577 0.0906 1.7410* Supported H3 Quality Product -> Satisfaction 0.3345 0.0804 4.1612** Supported H3a Quality Product -> Loyalty -0.0941 0.1638 0.5746 Not supported H4 Satisfaction -> Loyalty 0.2375 0.0998 2.3797* Supported H5 Satisfaction * Location -> Loyalty -0.2228 0.1076 2.3288* Supported
Note: * p < 0.05; **p < 0.00 4.5.1 Moderating Effect
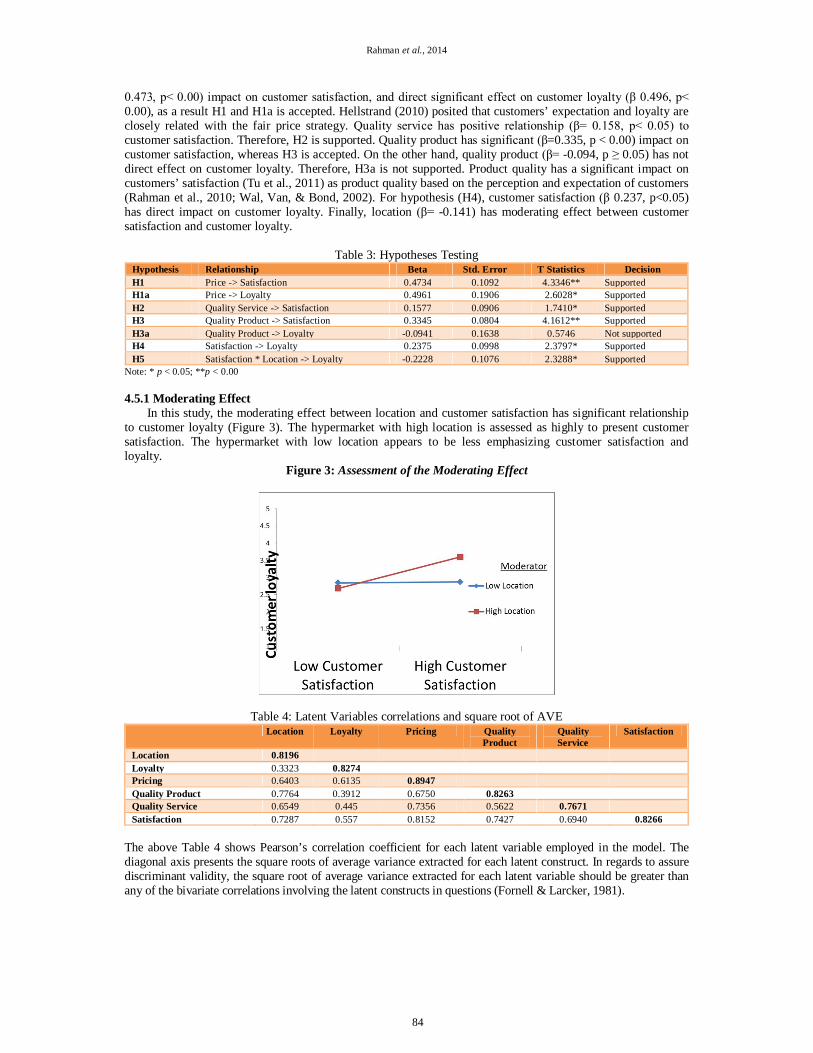
In this study, the moderating effect between location and customer satisfaction has significant relationship to customer loyalty (Figure 3). The hypermarket with high location is assessed as highly to present customer satisfaction. The hypermarket with low location appears to be less emphasizing customer satisfaction and loyalty.
Figure 3: Assessment of the Moderating Effect
Table 4: Latent Variables correlations and square root of AVE Location Loyalty Pricing Quality
Product Quality Service
Satisfaction
Location 0.8196 Loyalty 0.3323 0.8274 Pricing 0.6403 0.6135 0.8947 Quality Product 0.7764 0.3912 0.6750 0.8263 Quality Service 0.6549 0.445 0.7356 0.5622 0.7671 Satisfaction 0.7287 0.557 0.8152 0.7427 0.6940 0.8266
The above Table 4 shows Pearson’s correlation coefficient for each latent variable employed in the model. The diagonal axis presents the square roots of average variance extracted for each latent construct. In regards to assure discriminant validity, the square root of average variance extracted for each latent variable should be greater than any of the bivariate correlations involving the latent constructs in questions (Fornell & Larcker, 1981).
84
J. Basic. Appl. Sci. Res., 4(5)77-89, 2014
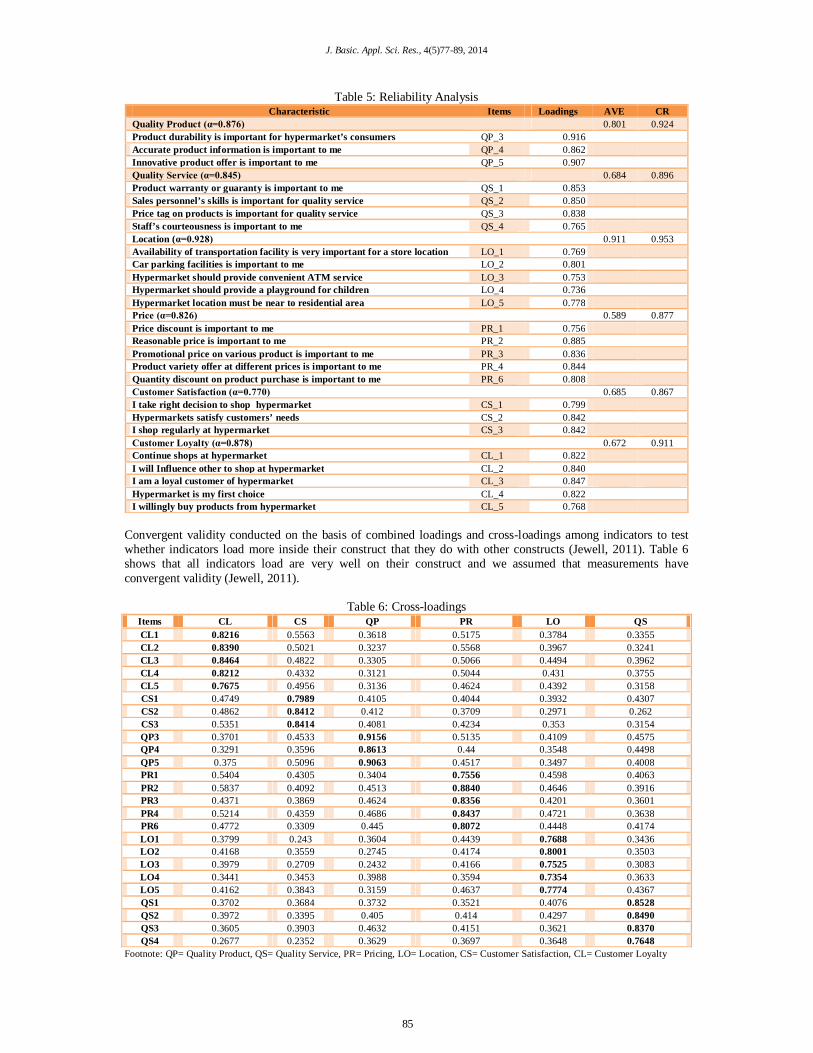
Table 5: Reliability Analysis Characteristic Items Loadings AVE CR
Quality Product (α=0.876) 0.801 0.924 Product durability is important for hypermarket’s consumers QP_3 0.916 Accurate product information is important to me QP_4 0.862 Innovative product offer is important to me QP_5 0.907 Quality Service (α=0.845) 0.684 0.896 Product warranty or guaranty is important to me QS_1 0.853 Sales personnel’s skills is important for quality service QS_2 0.850 Price tag on products is important for quality service QS_3 0.838 Staff’s courteousness is important to me QS_4 0.765 Location (α=0.928) 0.911 0.953 Availability of transportation facility is very important for a store location LO_1 0.769 Car parking facilities is important to me LO_2 0.801 Hypermarket should provide convenient ATM service LO_3 0.753 Hypermarket should provide a playground for children LO_4 0.736 Hypermarket location must be near to residential area LO_5 0.778 Price (α=0.826) 0.589 0.877 Price discount is important to me PR_1 0.756 Reasonable price is important to me PR_2 0.885 Promotional price on various product is important to me PR_3 0.836 Product variety offer at different prices is important to me PR_4 0.844 Quantity discount on product purchase is important to me PR_6 0.808 Customer Satisfaction (α=0.770) 0.685 0.867 I take right decision to shop hypermarket CS_1 0.799 Hypermarkets satisfy customers’ needs CS_2 0.842 I shop regularly at hypermarket CS_3 0.842 Customer Loyalty (α=0.878) 0.672 0.911 Continue shops at hypermarket CL_1 0.822 I will Influence other to shop at hypermarket CL_2 0.840 I am a loyal customer of hypermarket CL_3 0.847 Hypermarket is my first choice CL_4 0.822 I willingly buy products from hypermarket CL_5 0.768
Convergent validity conducted on the basis of combined loadings and cross-loadings among indicators to test whether indicators load more inside their construct that they do with other constructs (Jewell, 2011). Table 6 shows that all indicators load are very well on their construct and we assumed that measurements have convergent validity (Jewell, 2011).
Table 6: Cross-loadings Items CL CS QP PR LO QS CL1 0.8216 0.5563 0.3618 0.5175 0.3784 0.3355 CL2 0.8390 0.5021 0.3237 0.5568 0.3967 0.3241 CL3 0.8464 0.4822 0.3305 0.5066 0.4494 0.3962 CL4 0.8212 0.4332 0.3121 0.5044 0.431 0.3755 CL5 0.7675 0.4956 0.3136 0.4624 0.4392 0.3158 CS1 0.4749 0.7989 0.4105 0.4044 0.3932 0.4307 CS2 0.4862 0.8412 0.412 0.3709 0.2971 0.262 CS3 0.5351 0.8414 0.4081 0.4234 0.353 0.3154 QP3 0.3701 0.4533 0.9156 0.5135 0.4109 0.4575 QP4 0.3291 0.3596 0.8613 0.44 0.3548 0.4498 QP5 0.375 0.5096 0.9063 0.4517 0.3497 0.4008 PR1 0.5404 0.4305 0.3404 0.7556 0.4598 0.4063 PR2 0.5837 0.4092 0.4513 0.8840 0.4646 0.3916 PR3 0.4371 0.3869 0.4624 0.8356 0.4201 0.3601 PR4 0.5214 0.4359 0.4686 0.8437 0.4721 0.3638 PR6 0.4772 0.3309 0.445 0.8072 0.4448 0.4174 LO1 0.3799 0.243 0.3604 0.4439 0.7688 0.3436 LO2 0.4168 0.3559 0.2745 0.4174 0.8001 0.3503 LO3 0.3979 0.2709 0.2432 0.4166 0.7525 0.3083 LO4 0.3441 0.3453 0.3988 0.3594 0.7354 0.3633 LO5 0.4162 0.3843 0.3159 0.4637 0.7774 0.4367 QS1 0.3702 0.3684 0.3732 0.3521 0.4076 0.8528 QS2 0.3972 0.3395 0.405 0.414 0.4297 0.8490 QS3 0.3605 0.3903 0.4632 0.4151 0.3621 0.8370 QS4 0.2677 0.2352 0.3629 0.3697 0.3648 0.7648
Footnote: QP= Quality Product, QS= Quality Service, PR= Pricing, LO= Location, CS= Customer Satisfaction, CL= Customer Loyalty
85
Rahman et al., 2014
5. CONCLUSION AND IMPLEMENTATION
The study focused on the customers’ satisfaction through loyalty of Malaysian hypermarkets from customers’ behavioral perception. Generally, customers’ perception is widely varied, which mostly associated with service quality, pricing (Rahman et al., 2010), and quality product of retail industry. This research is also identified the overall customer satisfaction has strong significant relationship with customer loyalty. Customer is the king of a business organization. Customer satisfaction and loyalty is deeply interrelated with customers’ purchase behavior. Indeed, customer satisfaction is very important, since the finding of the research is examined that service quality, product quality and price strategy have significant impact on customer satisfaction and overall customer satisfaction has direct impact on customer loyalty. Therefore, customer satisfaction is an antecedent to the customers’ loyalty in hypermarkets context and it is recommended by Dahesh et al. (2012) stated that customer satisfaction is the key and real determinant to the customers’ loyalty to a particular industry. The author also point out that managerial strategy is an important indicator to the customers’ loyalty in every business firm. To investigate the customer satisfaction in Malaysian hypermarkets, the research provides exploratory study by distributing research questionnaires among Malaysian hypermarkets (Giant, Tesco and Carrefour) consumers involving professionals, students, practitioners and other consumers of hypermarket industry. Customer loyalty can be sustained through developing customer satisfaction. In this study, the result found that customer satisfaction is the mediator construct that has direct relationship to customer loyalty. Abdullah (2012) recommended that the higher customers’ satisfaction level will result in a higher customers’ loyalty. Location is an important component in hypermarket setting. In this study, location has moderating impact between customer satisfaction and customer loyalty.
According to literature review, there was illustrated a vast of customer satisfaction and customer loyalty dimensions under the different constructs. In this study, four constructs (service quality, product quality and price strategy) are verified to important for developing customer satisfaction. Under the construct of service quality, four dimensions are most important for customer satisfaction such as staff’s courteousness, product warranty or guaranty, sales personnel’s skills, and price tag on products are the important dimensions. In terms of product quality, three dimensions are most important for customer satisfaction including product durability, accurate product information and innovative product offer. Consequently, price discount, reasonable price, promotional price on various product, product variety offer at different prices, quantity discount on product purchase are the important dimensions for developing customer satisfaction and customer loyalty. Finally, location is also important construct that is verified to significant relationship between customer satisfaction and customer loyalty. The result found the five dimensions that are transportation, car parking facilities, convenient ATM service, residential area and playground for children are the most important for developing customer satisfaction and building customer loyalty in the retail business industry in Malaysian hypermarket context.
6. LIMITATION AND DIRECTION FOR FUTURE RESEARCH
The limitation of the study is encountered on the total process of this research. The sample size of this survey may not demonstrate total population owing to limited financial resources and time consuming. In addition, two hundred and ninety two (260) samples from Kuala Lumpur area may not enough to illustrate properly total Malaysian hypermarkets’ consumers who are aged below 20 years. This limitation does not affect the overall result of this study because Kuala Lumpur areas such as Batu cave, Wangsamaju, Sri Rampai, Kota Damasara and Puchong are the highest number of outlets in Malaysia. However, the findings of the study are constructive, for further verification and implementation by the practitioners of hypermarkets organization. In terms of future research, this is beneficial and practical as well as discussion relating to the limitation of the research. The researchers are encouraged to conduct for future study especially throughout the whole Malaysia. The research should be conducted nationally that covered entirely all area of Malaysia to clarify the customer satisfaction and customer loyalty. The results of this study from different customers’ background can aid to generalize the overall population as well as developing intensive research. For further research, researchers should look into other construct like managerial strategy, value of products, needs of customers and others. Particularly, Malaysian hypermarket industry should emphasis and implements properly the customer service sector, product quality, price strategy and store attributes, as these are verified to significance relationship with customer’s satisfaction and loyalty in Malaysian hypermarkets. In addition, diversity research is very important and it will provide more accurate information as well as solution of the problem to Malaysian hypermarkets for implementing the effective marketing strategy to develop customer satisfaction and customer loyalty. Furthermore, different types of languages (Tamil and Malay) are necessary for constructing the questionnaires for future researcher.
Acknowledgment:
The authors declare that they have no conflicts of interest in this research.
86
J. Basic. Appl. Sci. Res., 4(5)77-89, 2014
REFERENCES 1. Abu, N. K., & Roslin, R. M. (2008). Indentifying Service Quality Dimensions by Understanding Consume
Preferences in the Malaysian Grocery Retail Sector. Unitar E-Journal, 4(2), 57-67. 2. Abdullah, R. B., Ismail, N. B., Rahman, A. F., Suhaimin, M. B., & Safie, K. B. (2012). The Relationship
Beteween Store Brand and Customer Loyalty in Retailing in Malaysia. Asian Social Science, 8(2), 117-185. 3. Bagozzi, R., & Yi, Y. (1988). On the Evaluation of Structural Equation Models. Journal of the Academy of
Marketing Science, 16(1), 74-94. 4. Berman, B., & Evans, J. R. (2006). Retail Management: A Strategic Approach (10 th Edition ed.). Upper Saddle
River, NJ: Prentice Hall. 5. Bennett, D. R., & Rundle-Thiele, S. (2002). A Comparison of Attitudinal Loyalty Measurement Approaches.
Journal of Brand Management, 9 (3), 193-209. 6. Bollen, K. A. (1989). A new incremental fit index for general structural equation models. Scociological Methods
and Research, 17, 303-316. 7. Bolten, J., Kennerknecht, R., & Spiller, A. (2006). Perspectives of Small Retailers in the Organic Market:
Customer Satisfaction and Customer Enthusiasm. Paper at: 98. Seminar of the European Association of Agricultural Economists EAAE: Marketing Dynamics within the Global Trading System: New Perspectives.
8. Burns, A., & Bush, R. (2000). Marketing Research. New Jersey, USA: Prentice Hall. 9. Claudia, I. (2012). The Effect of Control Variables with Using Technology Acceptance Model to Predict
Consumer's Intentions to Buy Online. Academic Research International, 3(1), 137-145. 10. Codrington, G. (2002). Welcome to the Future World. Future Business: Marketing, Media and Business in S.A.,
38-40. 11. Cooper, R.D., & SchindleR, P. (2006). Business Research Methods. (9th, Ed.) New York: McGraw hill/Irwin. 12. Dahesh, S.N., Nasab, A. A., & Ling, K. C. (2012). The Study of Customer Satisfaction, Customer Trust and
Switching Barriers on Customer Retention in Malaysia Hypermarkets. International Journal of Business and Management, 7 (7), 141-150.
13. Davis, D., & Cosenza, R. (1993). Busienss Research for Decision Making. Belmont: Wadsworth Publishing. 14. Dick, A., & Basu, K. (1994). Customer Loyalty: Toward an Integrated Conceptual Framework. Journal of the
Academy of Marketing science, 22(2), 99-113. 15. Eerde, W. V., & Thierry, H. (1996). Vroom's Expectancy Models and Work-Related Criteria: A Meta-Analysis.
Journal of Applied Psychology, 81(5), 575-586. 16. Ellingson, J. E., & McFarland, L. A. (2011). Understanding Faking Behavior Through the Lens of Motivation: An
Application of VIE Theory. Human Performance, 24(4), 1-16. 17. Fornell, C., & Larcker, D. (1981). Evaluating Structural Equation Models with Unobserable Variables and
Measurement Error. Journal of Marketing Research, 18(1), 39-50. 18. Gefen, D., Straub, D. W., & Boudreau, M. C. (2000). Structural Equation Modeling and Regression: Guidelines
for Research Practice. Communications of the Association for Information Systems, 4(7), 1-79. 19. Grönroos, C. (1984). A Service Quality Model and its Marketing Implications. European Journal of Marketing ,
18 (4), 36-44. 20. Gonring, M. (2008). Customer Loyalty and Employee Engagement: An Alignment for Value. Journal of Business
Strategy, 29 (4), 29-40. 21. Hair, J. F., Anderson, R. E., Tatham, R. L., & Black, W. C. (1992). Multivariate Data Analoysis (3rd ed.).
Macmillan, New York. 22. Hakansson, H., & Johnson, J. (992). A model of Industrial Networks in Industrial Networks: A New View of
Reality. Routledge, London: Edited by Axelsson. 23. Hair, J., Bush, R. P., & Ortinan, D. J. (2006). Marketing Research Within a Changing Information Environment
(3rd ed.). New York: McGraw-Hill/Irwin. 24. Hair, J., Anderson, R., Tanthan, R., & Black, W. (1998). Multivariate Data Analysis (5th ed.). New Jersey:
Prentice Hall. 25. Hellstrand, P. (2010, January 06). Price Impact on Guest Satisfaction. Retrieved September 01st, 2012, from
http://www.hospitalitynet.org/news/4044870.html. 26. Heng, K. C., Yeong, K. S., Siong, L. C., Shi, T. Y., & Kuan, Y. M. (2011, December). Customers' Perceptions
of the Marketing Mix and the Effect on Malaysian Hypermarkets' Brand Loyalty. Research Project Submitted in Partial Fulfillment of the Requirement for the Degree of Bachelor of Commerce. Malaysia, University Tunku Abdul Rahman.
87
Rahman et al., 2014
27. Hong, W., Thong, J.Y., & Tam, K.Y. (2005). The Effects of Information format and Shopping task on Consumers' Online Shopping Behavior: A cognitive Fit Pespective. Journal of Management Information Systems, 149-184.
28. Hoq, M. Z., & Amin, M. (2010). The Role of Customer Satisfaction to Enhance Customer Loyalty. African Journal of Business Management, 4(12), 2385-2392.
29. Ilgen, D. R., Nebeker, D. M., & Pritchard, R. D. (1981). Expectancy theory measures: An empirical comparison in an experimental simulation. Organizational Behavior and Human Performance, 28(2), 189–223.
30. Jamali, D. (2007). A Study of Customer Satisfaction in the Context of a Public Private Partnership. International Journal of Quality & Reliability Management, 24(4), 370 - 385.
31. Jacoby, J., & Chestnut, R. (1978). Brand Loyalty Management and Measurement. New York, NY: John Wiley & Sons.
32. Jewell, D. (2011). Guide to evidence-based physical therapist practice (2nd ed.). Ontario: Jones & Bartlett Learning.
33. Kandampully, J., & Suhartanto, D. (2000). Customer Loyalty in the Hotel Industry: The Role of Customer Satisfaction and Image. International Journal of Contemporary Hospitality Management, 12 (16), 346-351.
34. Kline, R. (2005). Principles and Practice of Structural Equation Modeling. New York: Guilford Press. 35. Kotler, P., Keller, K. L., Ang, S. H., Leong, S. M., & Tan, C. T. (2009). Marketing Management (fifth edition ed.).
23/25 First Lok Yang Road, Jurong, Singapore: Pearson Education South Asia Pte Ltd. 36. Lawler, E., Porter, L., & Vroom, V. (2009). Motivation and Management Vroom's Expectancy Theory.
Retrieved0523,2013,fromhttp://www.valuebasedmanagement.net/methods_vroom_expectancy_theory.htmlhttp://www.valuebasedmanagement.net/methods_vroom_expectancy_theory.html.
37. Levy, M., & Weitz, B. A. (2004). Retailing Management. New York: McGraw-Hill Education 38. Lindquist, J. (1975). Meaning of Image. Journal of Retailing, 50 (4), 29-38. 39. Li, M., & Green, R. D. (2010). A Mediating Influence on Customer Loyalty: The Role of Perceived Value.
Journal of Management and Marketing Research, 1-12. 40. Master Thesis in Business Administration 15 ECTS, Master of International Management, Gotland University . 41. Lunenburg, F. C. (2011). Expectancy Theory of Motivation: Motivating by Altering Expectations. International
Journal of Management, Business and Administration 15(1), 1-6. 42. Martin, C. S., & Guerin, D. A. (2006). Using Research to Inform Design Solutions. Journal of Facilities
Management , 4 (3), 167-180. 43. Malhotra, N. K. (2007). Marketing Research: An Applied Orientation (5th ed.). New Jersey: Pearson Prentice-
Hall. 44. Mandhachitara, R., & Poolthong, Y. (2011). A Model of Customer Loyalty and Corporate Social Responsibility.
Journal of Services Marketing, 25 (2), 122-133. 45. Matzler, K., Renzl, B., & Rothenberger, S. (2006). Measuring the Relative Importance of Service Dimensions
in the Formation of Price Satisfaction and Service Satisfaction: A Case Study in the Hotel Industry. Scandinavian Journal of Hospitality and Tourism, 6(3), 179-196.
46. Miller, S. W. (2013, September 21). Expectancy Theory Overview. Retrieved December 6, 2013, from https://wikispaces.psu.edu/display/PSYCH484/4.+Expectancy+Theory.
47. Moye, L. N. (1998). Relationship Between Age, Store Attributes, Shopping Orientations, and Approach-Avoidance Behavior of Elderly Apparel Consumers. Master Thesis,TheVirginia Polytechnic Institute and State University.
48. Nunally, J. (1978). Psychometric Theory (2nd ed.). New York: McGraw Hill. 49. Oh, H. (1999). Service Quality, Customer Satisfaction and Customer Value: A HolisticPerspective. International
Journal of Hospitality Management, 18, 67-82. 50. Nor, A. (2009). Statistical Methods in Research. Petaling Jaya: Pearson Malaysia Sdn. Bhd. 51. Parasuraman, A., A.Zeithaml, V., & Berry, L. L. (1985). A Conceptual Model of Service Quality and its
Implications for Future Research. Journal of Retailing, 49, 41-50. 52. Parasuraman, A., Zeithaml, V., & Berry, L. (1988). SERVQUAL- A Multiple-Item Scale for Measuring Consumer
Perceptions of Service Quality. Journal of Retailing, 64 (1), 12-40. 53. Ping, R. A. (2004). On Assuring Valid Measures for Theoretical Models Using Survey Data. Journal of Business
Research, 57, 125-141. 54. Pinder, C. (1984). Work Motivation: Theory, Issues, and Applications. Glenview, U.S.A: Scott, Foresman. 55. Porter, L., & Lawler, E. (1968). Managerial attitudes and performance. Homewood, IL: Dorsey Press and Richard
D. Irwin. 56. Quelch, J. A., & Hoff, E. J. (1986). Customizing global marketing. Harvard Business Review, 64, 59-68.
88
J. Basic. Appl. Sci. Res., 4(5)77-89, 2014
57. Rahman, S., Haque, A., & Ahmad, M. I. (2010). Exploring Influencing Factors for the Selection of Mobile Phone Service Providers: A Structural Equational Modeling (SEM) Approach on Malaysian Consumers. African Journal of Business Management, 4(13), 2885-2898.
58. Reynolds, K., & Arnold, M. (2000). Customer Loyalty to the Salesperson and the Store: Examining Relationship Customers in an Upscale Retail Context. Journal of Personal Selling and Sales Management , 20 (2), 89-98.
59. Redmond, B. (2010). Lesson 4: Expectancy Theory: Is there a link between my effort and what I want? The Pennsylvania State University Website, Retrieved from https://cms.psu.edu" class="external-link" rel="nofollow"linktype="raw" .
60. Saili, T., Mingli, Z., & Zhichao, C. (2012). The Effects of Loyalty Programs on Customer Loyalty: The Mediating Role of Customer Value and the Moderating Role of Relationship Benefits. African Journal of Business Management, 6 (11), 4295-4309.
61. Sekaran, U. (2010). Research Methods for Business: A Skill Building Approach (4th ed.). New York: John Wiley and Sons, Inc.
62. Sirdeshmukh, D., Singh, J., & Sabol, B. (2002). Consumer Trust, Value and Loyalty in Relational Exchanges. Journal of Marketing, 66 (1), 15-37.
63. Sivadas, E., & Baker-Prewitt, J. L. (2000). An examination of the relationship between service quality, customer satisfaction, and store loyalty. International Journal of Retail & Distribution Management, 28 (2), 73-82.
64. Steemkamp, E., & Trijp, C.V. (1991). The Use of LISREL in Validating Marketing Constructs. International Journal of Research in Marketing, 8, 283-299.
65. Srinivasana, S. S., Andersona, R., & Ponnavolub, K. (2002). Customer Loyalty in E-commerce: An Exploration of its Antecedents and Consequences. Journal of Retailing, 78, 41-50.
66. Stecher, M., & Rosse, J. (2007). Understanding reactions to workplace injustice trhough process theories of motivation: A teaching module and simulation. Journal of Management Education, 31(6), 781.
67. Su, A. Y. (2004). Customer Satisfaction Measurement Practice in Taiwan Hotels. Hospitality Management, 23, 397-408.
68. Szymanski, D., & Henard, D. (2001). Customer Satisfaction: A Beta-Analysis of the Empirical Evidence. Journal of the Academy of Marketing Science, 29 (1), 16-35.
69. Thompson, R., Barclay, & Higgins, C. (1995). The Partial Least Square Approach to Causal Modeling: Personal Computer Adoption and Use as an Illustration. Technology Studies: Special Issue on Research Methodology, 2(2), 284-324.
70. Vroom, V. H. (1964). Work and motivation. New York: Wiley. 71. Wal, R., Van, P. A., & Bond, C. (2002). Serviuce Quality in a Cellular Telecommunications Company: A South
African Experience. Managing Service Quality, 12(5), 323-335. 72. Yuen, F., & Chan, S. (2010). The Effect of Retail Service Quality and Product Euality on Customer Loyalty.
Journal of Sata Base Marketing and Customer Strategy Management , 17, 222-240. 73. Zain, O., & Rejab, I. (1989). The Choice of Retail Outlets among Urban Malaysian Shoppers.International
Journal of Retailing, 4(2), 35-45. 74. Zeithaml, V. (1988). Consumer Perception of Price, Quality and Value: A Means-End Model and Synthesis of
Evidence. Journal of Marketing, 52, 2-22.
89
Related Documents