CUSTOMER PROFITABILITY ANALYSIS AND LOAN PRICING Chapter 18 Bank Management Bank Management, 5th edition. 5th edition. Timothy W. Koch and S. Scott Timothy W. Koch and S. Scott MacDonald MacDonald Copyright © 2003 by South-Western, a division of Thomson Learning

CUSTOMER PROFITABILITY ANALYSIS AND LOAN PRICING Chapter 18 Bank Management 5th edition. Timothy W. Koch and S. Scott MacDonald Bank Management, 5th edition.
Dec 19, 2015
Welcome message from author
This document is posted to help you gain knowledge. Please leave a comment to let me know what you think about it! Share it to your friends and learn new things together.
Transcript
CUSTOMER PROFITABILITY ANALYSIS AND LOAN PRICING
Chapter 18
Bank ManagementBank Management, 5th edition.5th edition.Timothy W. Koch and S. Scott MacDonaldTimothy W. Koch and S. Scott MacDonaldCopyright © 2003 by South-Western, a division of Thomson Learning
Customer profitability analysis is a decision tool used to evaluate the profitability of a customer relationship.
The analysis procedure compels banks to be
aware of the full range of services purchased
by each customer and to generate meaningful
cost estimates for providing each service. The applicability of customer profitability
analysis has been questioned in recent years
with the move toward unbundling services.
Profit Target + Expenses Account Revenue Account
Account analysis framework
Customer profitability analysis is used to evaluate whether net revenue from an account meets a bank’s profit objectives.
Identify the full list of services used by a customer
Transactions account activity Extension of credit Security safekeeping, and Related items such as:
Wire transfers Safety deposit boxes Letters of credit Trust accounts
Expense components
Noncredit services Credit Services
Cost of funds Loan administration Default risk expense
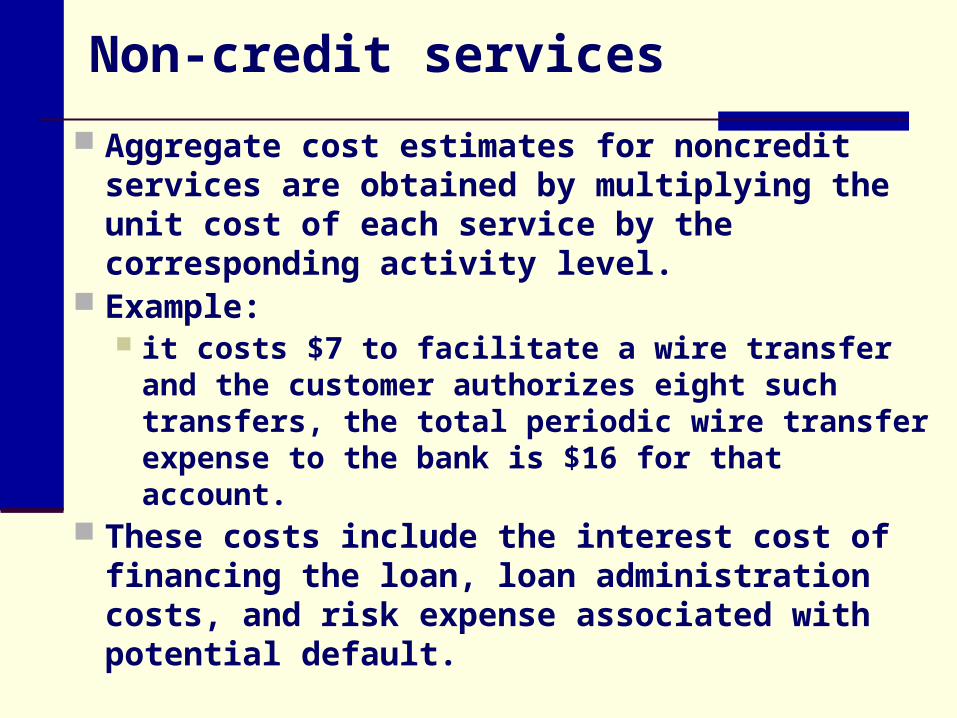
Non-credit services
Aggregate cost estimates for noncredit services are obtained by multiplying the unit cost of each service by the corresponding activity level.
Example: it costs $7 to facilitate a wire transfer and the
customer authorizes eight such transfers, the total periodic wire transfer expense to the bank is $16 for that account.
These costs include the interest cost of financing the loan, loan administration costs, and risk expense associated with potential default.
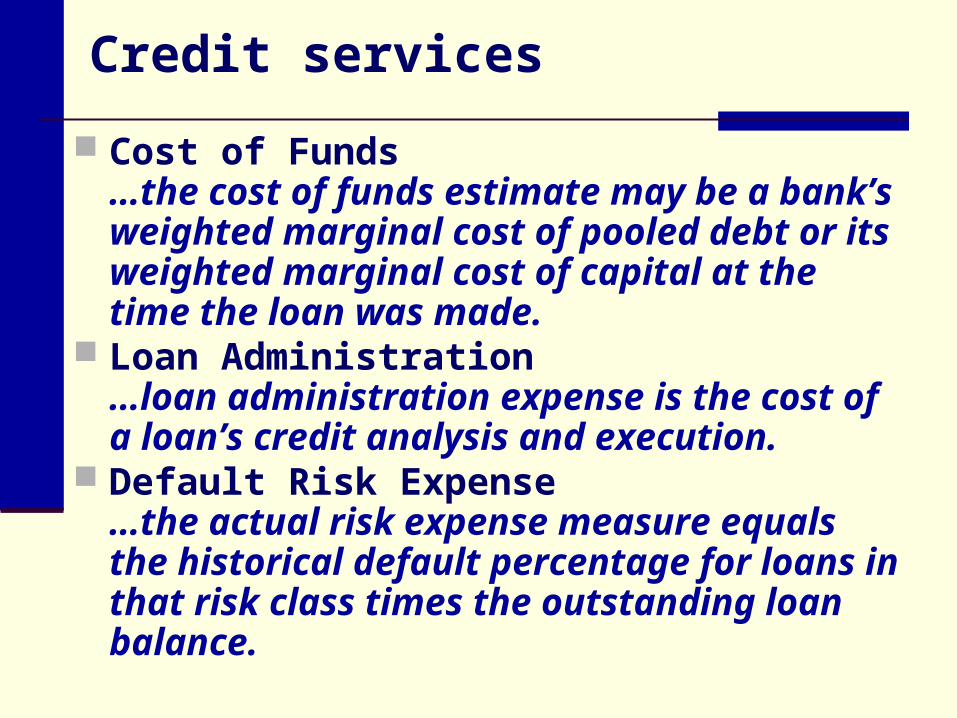
Credit services
Cost of Funds…the cost of funds estimate may be a bank’s weighted marginal cost of pooled debt or its weighted marginal cost of capital at the time the loan was made.
Loan Administration…loan administration expense is the cost of a loan’s credit analysis and execution.
Default Risk Expense…the actual risk expense measure equals the historical default percentage for loans in that risk class times the outstanding loan balance.
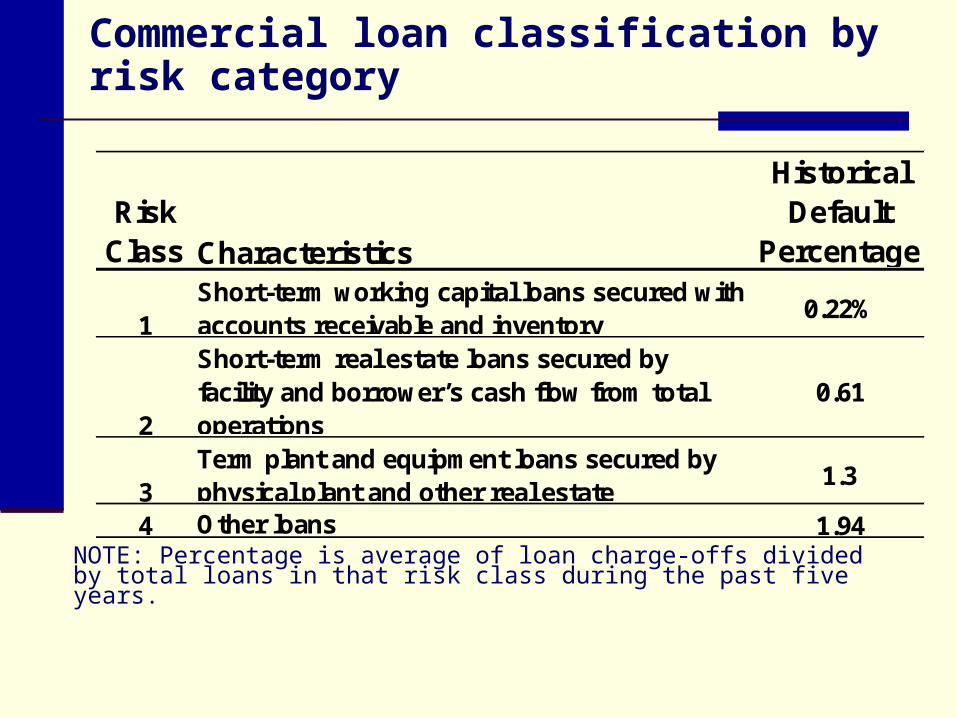
Commercial loan classification by risk category
Risk Class Characteristics
Historical Default
Percentage
1Short-term working capital loans secured with accounts receivable and inventory
0.22%
2
Short-term real estate loans secured by facility and borrower’s cash flow from total operations
0.61
3Term plant and equipment loans secured by physical plant and other real estate
1.3
4 Other loans 1.94NOTE: Percentage is average of loan charge-offs divided by total loans in that risk class during the past five years.
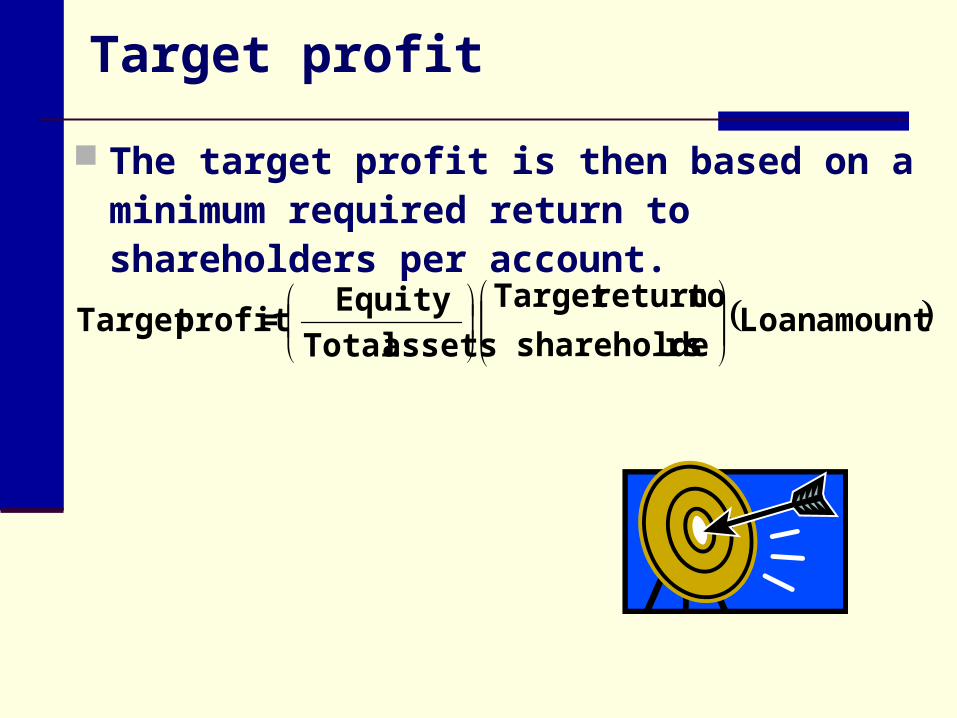
amount Loanrsshareholde
to return Target
assets Total
Equity = profit Target
Target profit
The target profit is then based on a minimum required return to shareholders per account.
Revenue components
Banks generate three types of revenue from customer accounts:
1. investment income from the customer’s deposit balance held at the bank
2. fee income from services
3. interest income on loans
Estimating investment income from deposit balances
1. A bank determines the average ledger (book) balances in the account during the reporting period.
2. The average transactions float is subtracted from the ledger amount.
3. The bank deducts required reserves to arrive at investable balances.
4. Management applies an earnings credit rate against investable balances to determine the average interest revenue earned on the customer’s account.
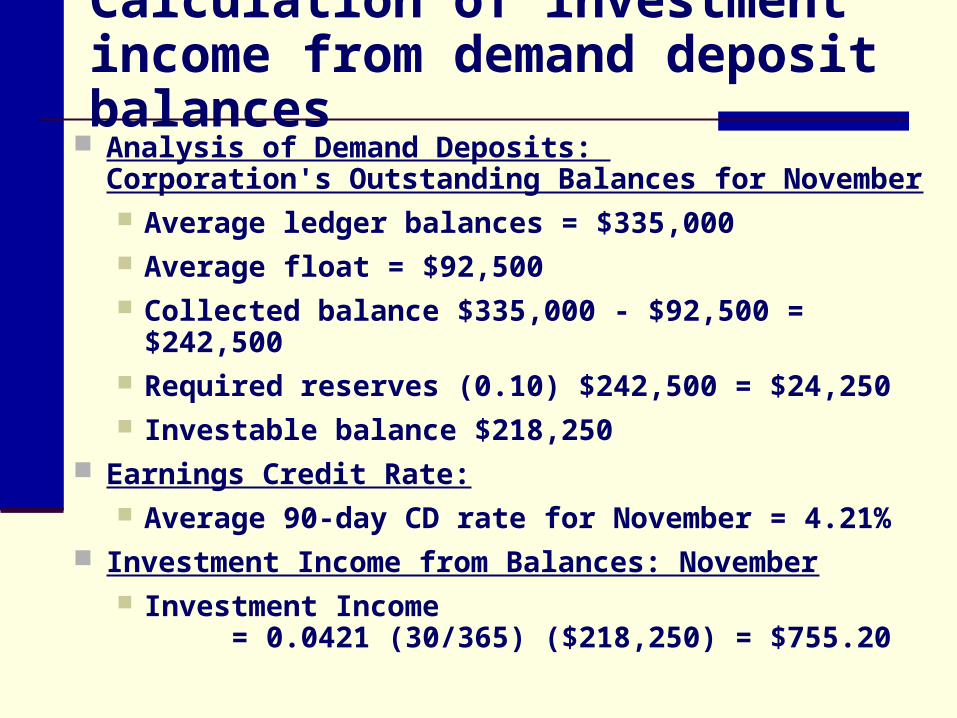
Calculation of investment income from demand deposit balances
Analysis of Demand Deposits: Corporation's Outstanding Balances for November Average ledger balances = $335,000 Average float = $92,500 Collected balance $335,000 - $92,500 = $242,500 Required reserves (0.10) $242,500 = $24,250 Investable balance $218,250
Earnings Credit Rate: Average 90-day CD rate for November = 4.21%
Investment Income from Balances: November Investment Income
= 0.0421 (30/365) ($218,250) = $755.20
Compensating balances
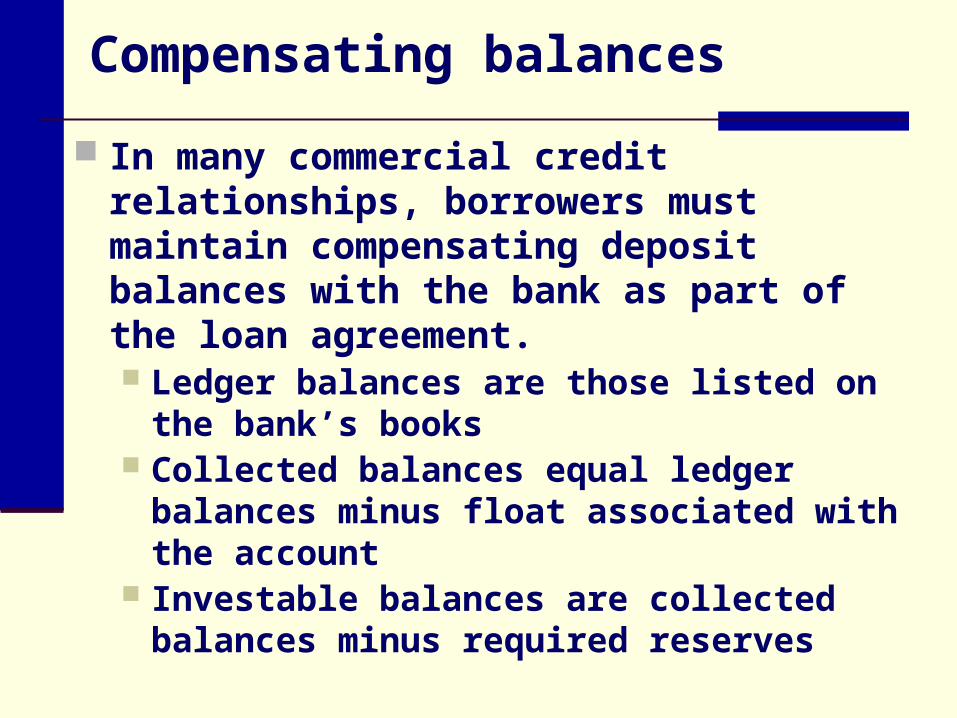
In many commercial credit relationships, borrowers must maintain compensating deposit balances with the bank as part of the loan agreement. Ledger balances are those listed on the bank’s
books Collected balances equal ledger balances
minus float associated with the account Investable balances are collected balances
minus required reserves
Fee income
When a bank analyzes a customer’s account relationship, fee income from all services rendered is included in total revenue.
Fees are frequently charged on a per-item basis, as with Federal Reserve wire transfers, or as a fixed periodic charge for a bundle of services, regardless of rate of use.
Fee income (continued)
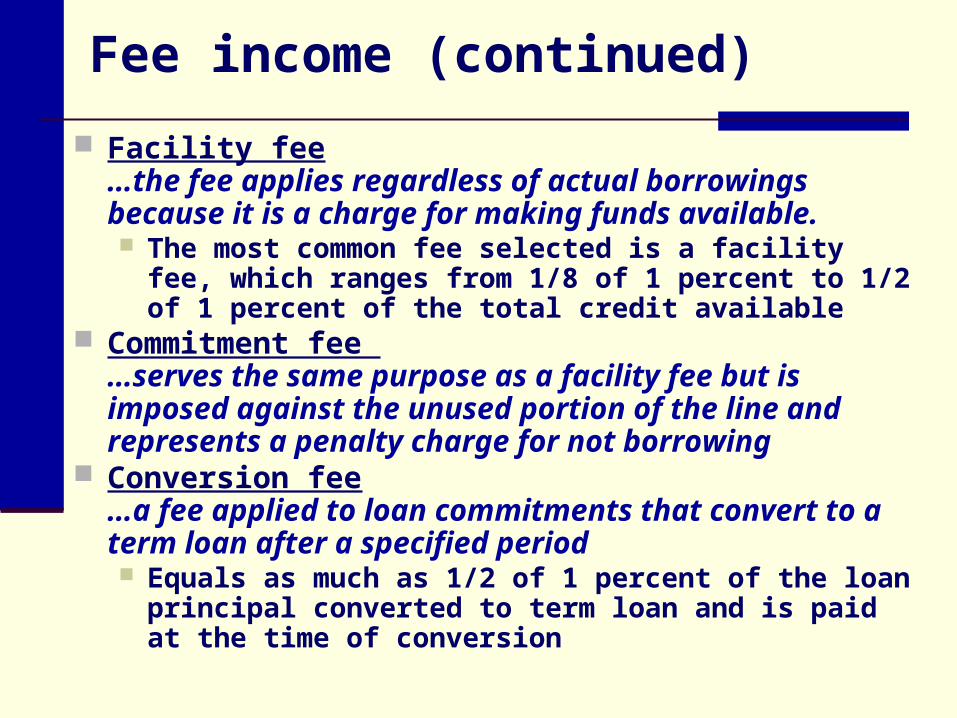
Facility fee…the fee applies regardless of actual borrowings because it is a charge for making funds available. The most common fee selected is a facility fee, which
ranges from 1/8 of 1 percent to 1/2 of 1 percent of the total credit available
Commitment fee …serves the same purpose as a facility fee but is imposed against the unused portion of the line and represents a penalty charge for not borrowing
Conversion fee…a fee applied to loan commitments that convert to a term loan after a specified period Equals as much as 1/2 of 1 percent of the loan principal
converted to term loan and is paid at the time of conversion

Loan interest and base lending rates…Loans are the dominant asset in bank portfolios, and loan interest is the primary revenue source
The actual interest earned depends on the contractual loan rate and the outstanding principal.
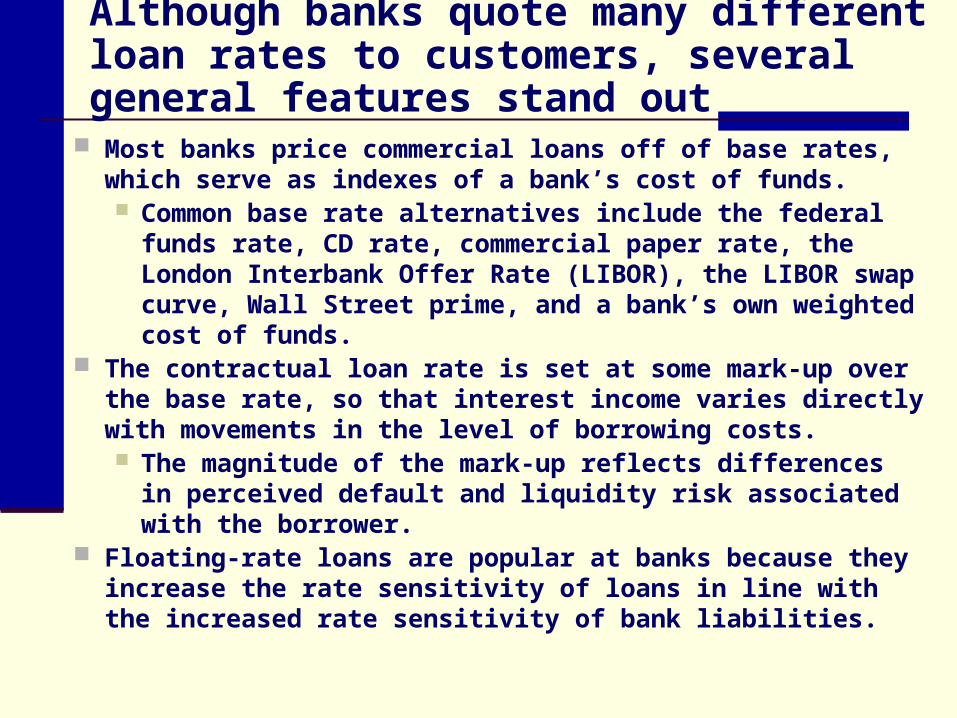
Although banks quote many different loan rates to customers, several general features stand out
Most banks price commercial loans off of base rates, which serve as indexes of a bank’s cost of funds. Common base rate alternatives include the federal
funds rate, CD rate, commercial paper rate, the London Interbank Offer Rate (LIBOR), the LIBOR swap curve, Wall Street prime, and a bank’s own weighted cost of funds.
The contractual loan rate is set at some mark-up over the base rate, so that interest income varies directly with movements in the level of borrowing costs. The magnitude of the mark-up reflects differences in
perceived default and liquidity risk associated with the borrower.
Floating-rate loans are popular at banks because they increase the rate sensitivity of loans in line with the increased rate sensitivity of bank liabilities.
A substantial portion of commercial loans and most consumer loans carry fixed rates
In each case, the contractual rates should
reflect the estimated cost of bank funds,
perceived default risk, and a term liquidity
and interest rate risk premium over the life of
the agreement.
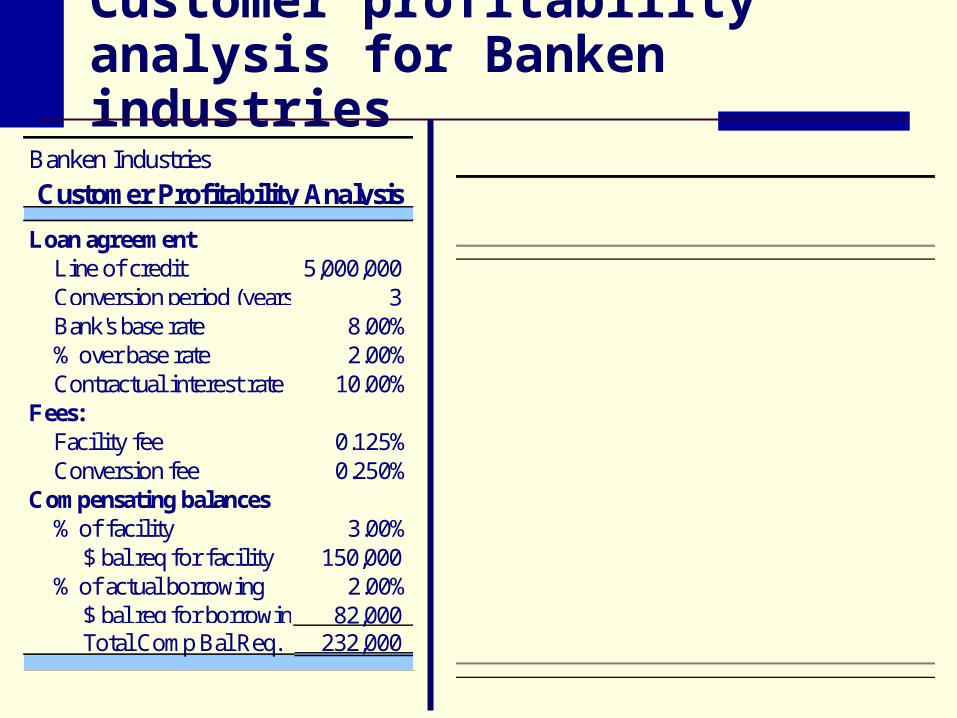
Banken Industries
Loan agreementLine of credit 5,000,000Conversion period (years) 3Bank's base rate 8.00%% over base rate 2.00%Contractual interest rate 10.00%
Fees:Facility fee 0.125%Conversion fee 0.250%
Compensating balances% of facility 3.00%
$ bal req for facility 150,000% of actual borrowing 2.00%
$ bal req for borrowing 82,000Total Comp Bal Req. 232,000
Customer Profitability Analysis
Customer profitability analysis for Banken industries
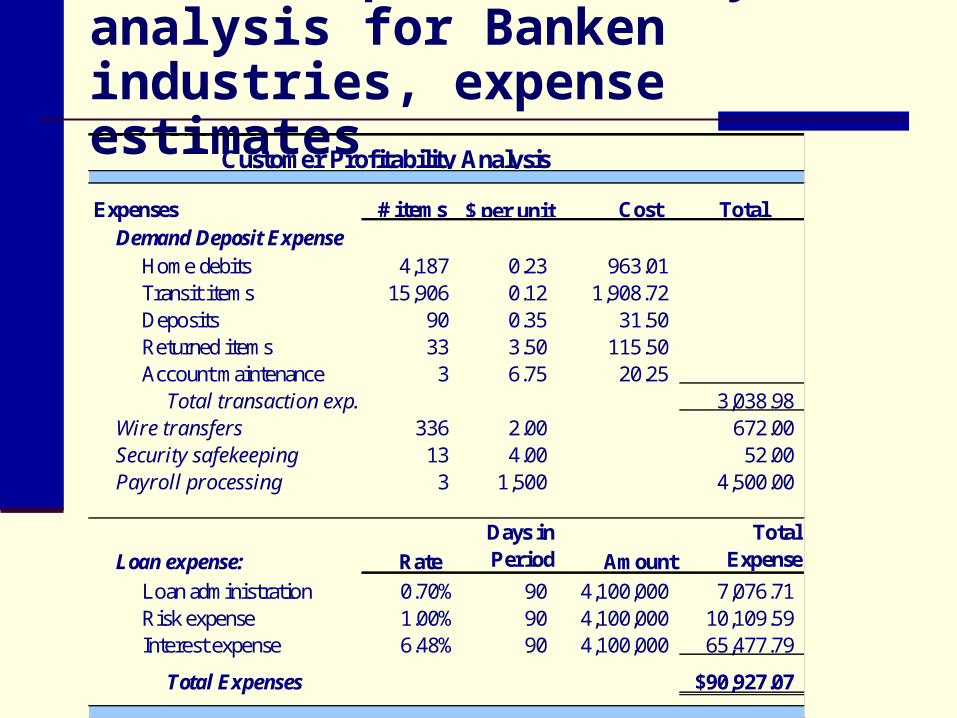
Customer profitability analysis for Banken industries, expense estimatesBanken Industries
Expenses # items Cost TotalDemand Deposit Expense
Home debits 4,187 0.23 963.01Transit items 15,906 0.12 1,908.72Deposits 90 0.35 31.50Returned items 33 3.50 115.50Account maintenance 3 6.75 20.25
Total transaction exp. 3,038.98Wire transfers 336 2.00 672.00Security safekeeping 13 4.00 52.00Payroll processing 3 1,500 4,500.00
Loan expense: Rate
Days in Period Amount
Total Expense
Loan administration 0.70% 90 4,100,000 7,076.71Risk expense 1.00% 90 4,100,000 10,109.59Interest expense 6.48% 90 4,100,000 65,477.79
Total Expenses $90,927.07
Customer Profitability Analysis
$ per unit
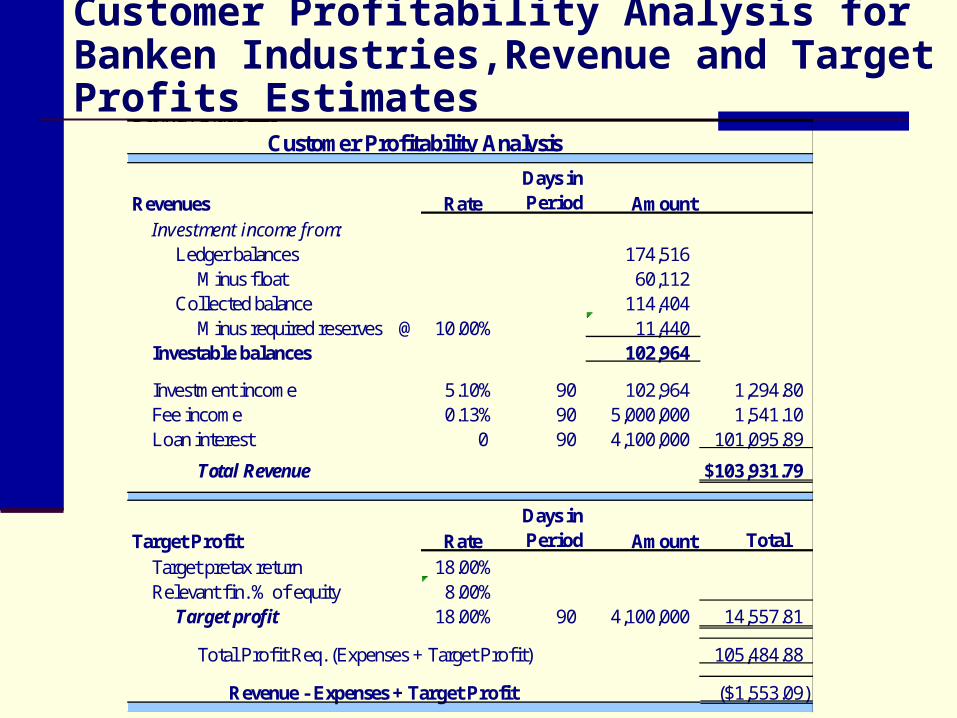
Customer Profitability Analysis for Banken Industries,Revenue and Target Profits Estimates
Banken Industries
Revenues Rate Days in Period Amount
Investment income from:Ledger balances 174,516
Minus float 60,112Collected balance 114,404
Minus required reserves @ 10.00% 11,440Investable balances 102,964
Investment income 5.10% 90 102,964 1,294.80Fee income 0.13% 90 5,000,000 1,541.10Loan interest 0 90 4,100,000 101,095.89
Total Revenue $103,931.79
Target Profit Rate Days in Period Amount Total
Target pretax return 18.00%Relevant fin. % of equity 8.00%
Target profit 18.00% 90 4,100,000 14,557.81
Total Profit Req. (Expenses + Target Profit) 105,484.88
Revenue - Expenses + Target Profit ($1,553.09)
Customer Profitability Analysis
Pricing new commercial loans
The approach is the same, equating revenues with expenses plus target profit, but now the loan officer must forecast borrower behavior.
For loan commitments this involves projecting the magnitude and timing of actual borrowings, compensating balances held, and the volume of services consumed.
The analysis assumes that the contractual loan rate is set at a markup over the bank’s weighted marginal cost of funds and thus varies coincidentally.
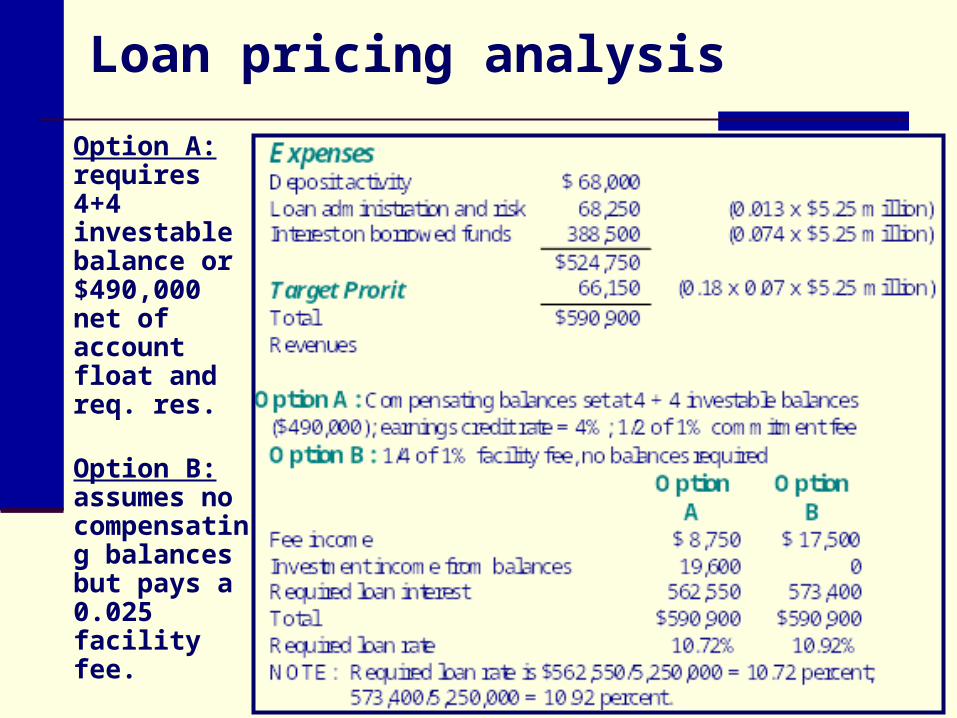
Loan pricing analysis
Option A: requires 4+4 investable balance or $490,000 net of account float and req. res.
Option B: assumes no compensating balances but pays a 0.025 facility fee.
Risk-adjusted returns on loans
When deciding what rate to charge, loan
officers attempt to forecast default losses
over the life of the loan. Credit risk, in turn, can be divided into
expected losses and unexpected losses. Expected losses might be reasonably based
on mean historical loss rates. In contrast, unexpected losses should be
measured by computing the deviation of
realized losses from the historical mean.
Commercial loans are frequently under-priced at banks today
Strong competition for loans tends to increase the banks under-pricing of loans.
Lenders appear to have systematically understated risk.
The appropriate procedure is to identify expected and unexpected losses and incorporate both in determining the appropriate risk charge.
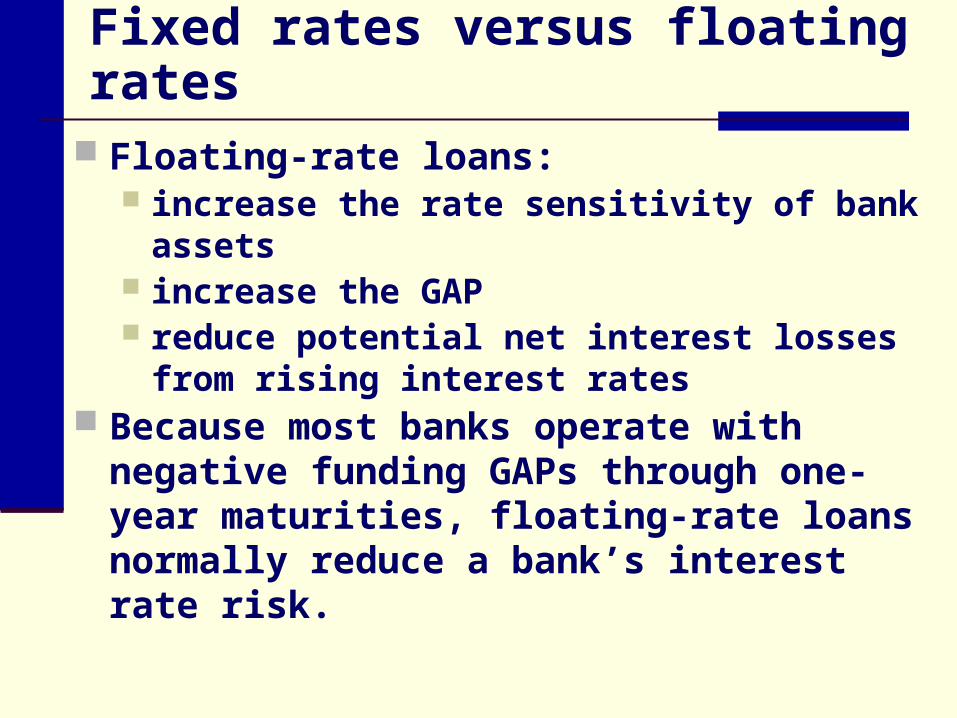
Fixed rates versus floating rates
Floating-rate loans: increase the rate sensitivity of bank assets increase the GAP reduce potential net interest losses from rising
interest rates Because most banks operate with negative
funding GAPs through one-year maturities, floating-rate loans normally reduce a bank’s interest rate risk.
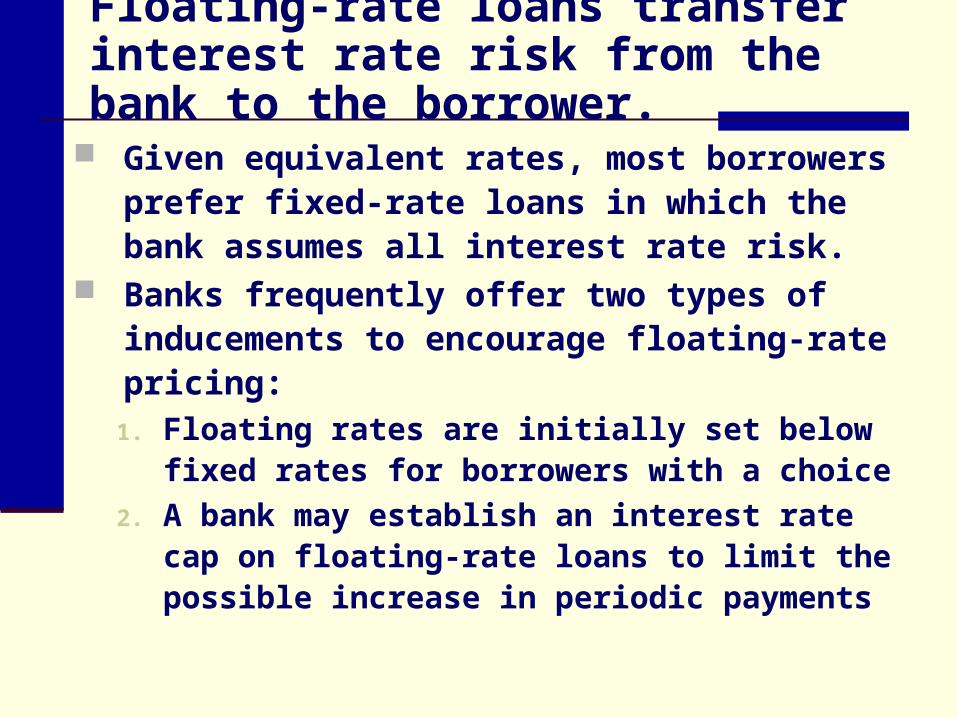
Floating-rate loans transfer interest rate risk from the bank to the borrower.
Given equivalent rates, most borrowers prefer fixed-rate loans in which the bank assumes all interest rate risk.
Banks frequently offer two types of inducements to encourage floating-rate pricing:
1. Floating rates are initially set below fixed rates for borrowers with a choice
2. A bank may establish an interest rate cap on floating-rate loans to limit the possible increase in periodic payments
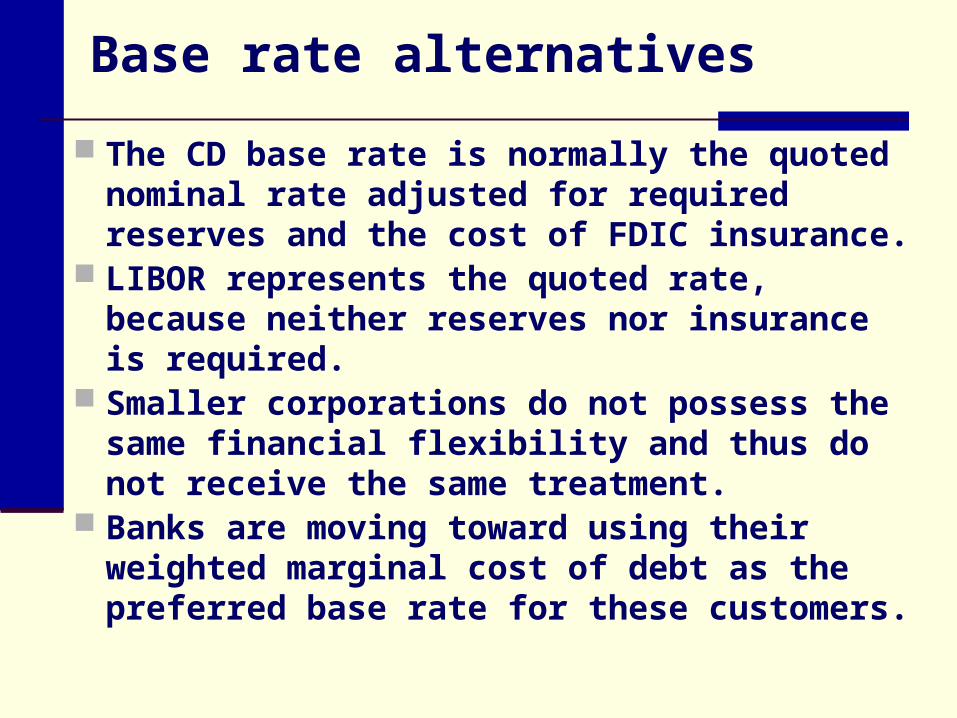
Base rate alternatives
The CD base rate is normally the quoted nominal rate adjusted for required reserves and the cost of FDIC insurance.
LIBOR represents the quoted rate, because neither reserves nor insurance is required.
Smaller corporations do not possess the same financial flexibility and thus do not receive the same treatment.
Banks are moving toward using their weighted marginal cost of debt as the preferred base rate for these customers.
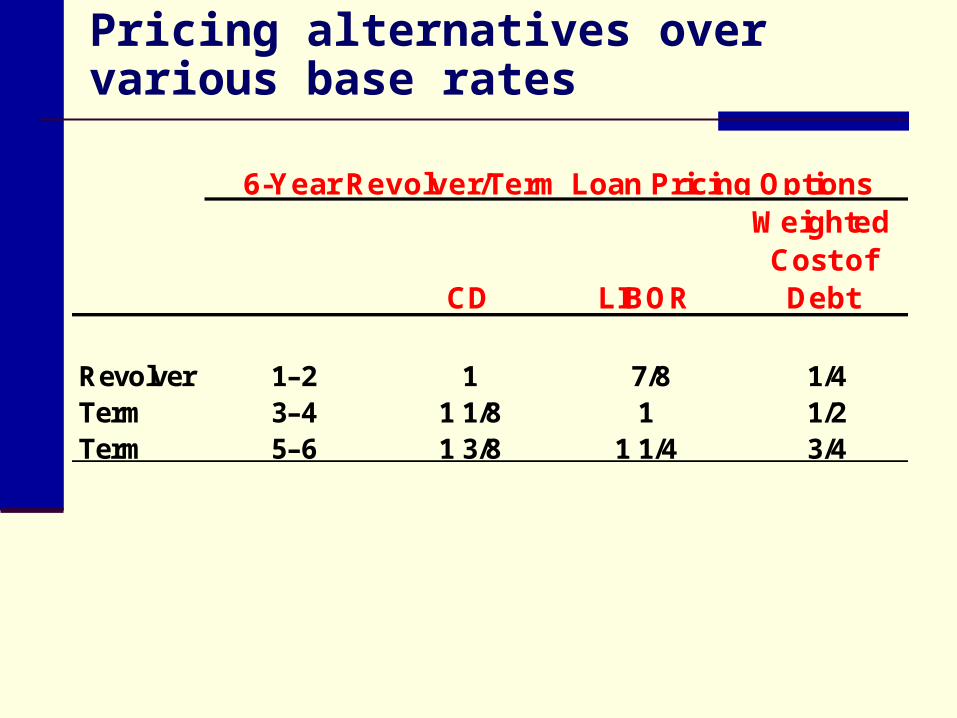
Pricing alternatives over various base rates
CD LIBOR
Weighted Cost of
Debt
Revolver 1–2 1 7/8 1/4Term 3–4 1 1/8 1 1/2Term 5–6 1 3/8 1 1/4 3/4
6-Year Revolver/Term Loan Pricing Options
Weighted cost of funds and base rate
Base rate calculation assumes:1. core deposits are not available to fund loans.
2. deposits paying below market rates will continue to decrease as a funding source
The cost of debt calculation excludes core deposits
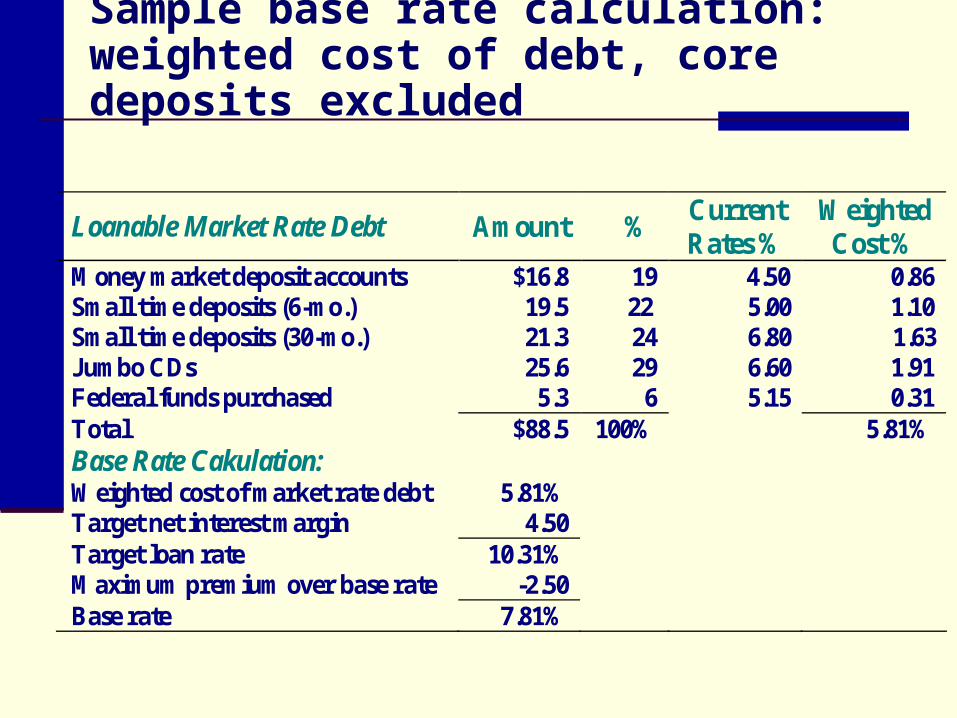
Sample base rate calculation: weighted cost of debt, core deposits excluded
Loanable Market Rate Debt Amount % Current Rates %
Weighted Cost %
Money market deposit accounts $16.8 19 4.50 0.86 Small time deposits (6-mo.) 19.5 22 5.00 1.10 Small time deposits (30-mo.) 21.3 24 6.80 1.63 Jumbo CDs 25.6 29 6.60 1.91 Federal funds purchased 5.3 6 5.15 0.31 Total $88.5 100% 5.81% Base Rate Cakulation: Weighted cost of market rate debt 5.81% Target net interest margin 4.50 Target loan rate 10.31% Maximum premium over base rate -2.50 Base rate 7.81%
Customer profitability analysis:consumer installment loans
Two significant differences alter the analysis when evaluating the profitability of individual accounts:
1. Consumer loans are much smaller than commercial loans, on average
2. processing costs per dollar of loan are much higher than for commercial loans
Loans will not generate enough interest to cover costs if they are too small or the maturity is too short, even with high interest rates.
Thus, banks set minimum targets for loan size, maturity, and interest rates.
Break-even analysis of consumer loans
The break-even relationship is based on the objective that loan interest revenues net of funding costs and losses equal loan costs:
Net Interest income = Interest expense + Loan losses + Acquisition costs + Collection costs
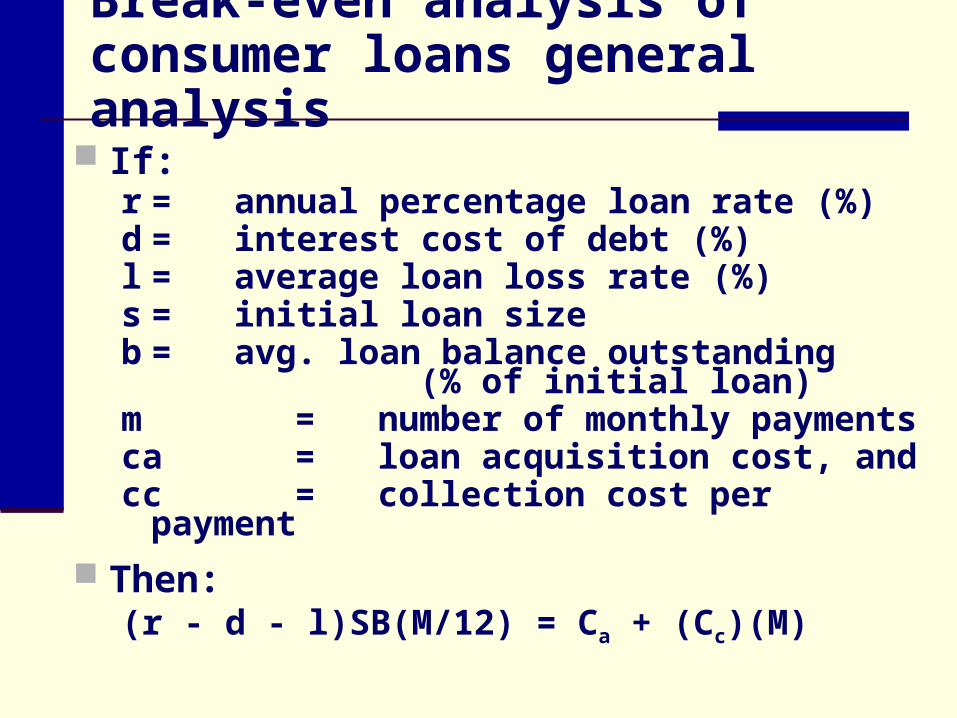
Break-even analysis of consumer loans general analysis
If:r = annual percentage loan rate (%)d = interest cost of debt (%)l = average loan loss rate (%)s = initial loan sizeb = avg. loan balance outstanding
(% of initial loan)m = number of monthly paymentsca = loan acquisition cost, andcc = collection cost per payment
Then:(r - d - l)SB(M/12) = Ca + (Cc)(M)
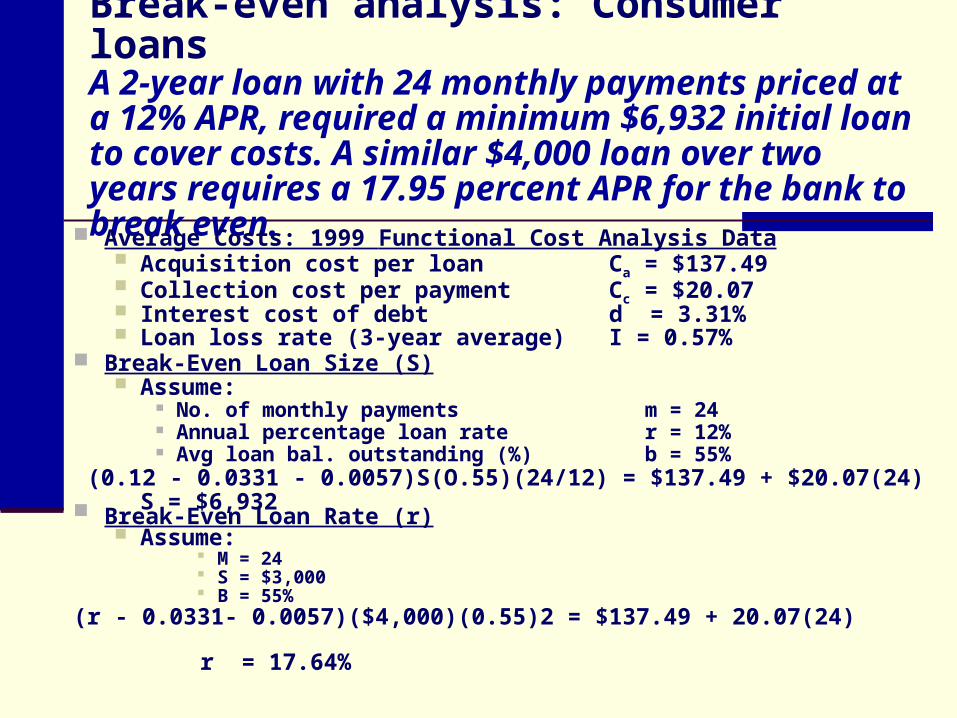
Break-even analysis: Consumer loansA 2-year loan with 24 monthly payments priced at a 12% APR, required a minimum $6,932 initial loan to cover costs. A similar $4,000 loan over two years requires a 17.95 percent APR for the bank to break even.
Average Costs: 1999 Functional Cost Analysis Data Acquisition cost per loan Ca = $137.49 Collection cost per payment Cc = $20.07 Interest cost of debt d = 3.31% Loan loss rate (3-year average) I = 0.57%
Break-Even Loan Size (S) Assume:
No. of monthly payments m = 24 Annual percentage loan rate r = 12% Avg loan bal. outstanding (%) b = 55%
(0.12 - 0.0331 - 0.0057)S(O.55)(24/12) = $137.49 + $20.07(24)S = $6,932 Break-Even Loan Rate (r)
Assume: M = 24 S = $3,000 B = 55%
(r - 0.0331- 0.0057)($4,000)(0.55)2 = $137.49 + 20.07(24) r = 17.64%

CUSTOMER PROFITABILITY ANALYSIS AND LOAN PRICING
Chapter 18
Bank ManagementBank Management, 5th edition.5th edition.Timothy W. Koch and S. Scott MacDonaldTimothy W. Koch and S. Scott MacDonaldCopyright © 2003 by South-Western, a division of Thomson Learning
Related Documents