02 9 770263 953115 Issue 419 February 2018 £4.50 www.whatinvestment.co.uk INCLUDING: The best investment trust opportunities in five key regions STARS VS. TEAMS How to select the right type of management for your future financial health STOCKS TO WATCH Simon McGarry highlights the shares he believes could be poised for outperformance Custodian Capital’s Richard Shepherd-Cross analyses the investment disparity between unit trusts and real estate investment trusts T he REIT stuff

Welcome message from author
This document is posted to help you gain knowledge. Please leave a comment to let me know what you think about it! Share it to your friends and learn new things together.
Transcript

02
9770263953115
Issue 419 February 2018 £4.50
www.whatinvestment.co.uk
INCLUDING: The best investment trust opportunities in five key regions
STARS VS. TEAMSHow to select the right type of management for your future financial health
STOCKS TO WATCHSimon McGarry highlights the shares he believes could be poised for outperformance
Custodian Capital’s Richard Shepherd-Cross analyses the investment disparity between unit trusts and real estate investment trusts
The REIT stuff

Issued by Financial Administration Services Limited, authorised and regulated by the Financial Conduct Authority. Fidelity, Fidelity International, their logos and F symbol are trademarks of FIL Limited.UKM1217/21252/CSO8611/020318
If you have pensions with a number of different providers,take closer control of your retirement savings by bringing themtogether in a Fidelity Self-Invested Personal Pension (SIPP).
■ Transfer your pensions (and ISAs and other investments)to us and manage them all in one secure online account.
■ Earn £100 to £1,000 cashback if you apply to transferyour pensions, ISAs or other investments by 2 March2018 (exclusions and T&Cs apply).
■ We offer a low ongoing service fee and will not chargeyou to transfer to us.
■ If your current providers charge exit fees, we willreimburse you up to £500 (T&Cs apply).
The value of investments can go down as well as up, soyou may not get back the amount you originally invest.You cannot normally access money in a SIPP until age55. Pension transfers can be complex and some types ofpension, in particular those with guaranteed benefits, suchas defined benefit schemes and pensions with safeguardedbenefits, are not eligible for this offer. Advised transfers arenot eligible for this offer. Please read our pension transferfactsheet, the cashback T&Cs and exit fees T&Cs, which areavailable at fidelity.co.uk/cashback
How do your investments add up?Invest more than £250,000 directly with us and you willautomatically qualify for a range of complementary WealthService benefits:
■ Your own dedicated Relationship Manager.
■ A Quarterly Portfolio Report analysing your holdingsand fund performance.
■ A lower service fee of 0.2%, compared with ourstandard service fee of 0.35%. (Ongoing fund chargesstill apply but service fees are payable only on the first£1,000,000 that you have invested with us.)
■ Invitations to exclusive events providing insights fromleading investments experts.
Build for thefuture by bringingyour pensionstogether now.
LET’S TALK HOW.
Earn £100to £1,000cashbackExclusions andT&Cs apply
Apply online at fidelity.co.uk/cashback
Or call us on 0800 358 7489(Lines open 8am – 6pm Monday to Friday, 9am – 6pm on Saturday)
Job No: 55745-23 Publication:What Investment Size: 297x210 Ins Date: 01.02.18 Proof no: 1 Tel: 020 7291 4700
Shoring up the battlements
If there was ever a time to revisit the need for and notion of investor protection, this is it.
With the wreckage of Carillion taking its place amongst the Diabolical and Tragic in the ‘Museum of Financial Failure’, immediate concern has centred on any potential risk to that mammoth’s pension fund. However, the Pension Protection Fund (PPF) has warned against any careless comments about the health of Carillion’s defined benefit final salary pension scheme, stating, ‘This is clearly a worrying time for employees and pension scheme members, and it would be irresponsible for anyone to add unnecessary worries by undermining their confidence in the security of their pension being safeguarded by the PPF.’
The PPF has, in an initially reassuring way at least, also made clear that it is ‘financially strong’, holding assets that represent a funding level of 121 per cent – so, no doubt it’s a case of wait and see. (See our full Carillion story online at www.whatinvestment.co.uk).
In another vein relating to investor protection, the beginning of the year has seen the activation of just the front-end of a raft of new regulation – beginning with the investment trusts’ KID (Key Information Document) disclosure, introduced on 1 January and discussed in detail by our regular columnist, Nick Britton, in this issue of What Investment (see page 41).
We’ve also seen the introduction of MiFID II and PRIIPs (packaged retail investment and insurance-based products) legislation; PDS2 – or open banking rules – designed to make the transfer of bank accounts (amongst other things) much easier; and on 25 May we will see the introduction of the General Data Protection Regulation (GDPR), which will have wide-ranging and potentially disruptive (in the old sense) implications for all forms of companies, institutions and those yet to be clearly defined operations of a variety of organisations.
In this issue...This month’s cover story, which begins on page 20, is designed to shed some light on the variations between property investment trusts and property units trusts, offering you enough information to reach an informed view on which structure seems the most efficient and potentially provides the best investment opportunities.
We also introduce new voices, such as Simon McGarry, senior equity analyst at Canaccord Genuity Wealth Management, who provides his pick of the stocks to watch in 2018 (see page 10), and continue to drill down to reveal the bones of financial instruments, such as the collateralised loan obligation (CLO), in order to make the details of their application far more accessible (see page 14).
Meanwhile, my advice will always be to approach anything that is overly convoluted or jargonistic with caution, but coupled with inquisitiveness and followed closely by an eye for opportunity.
Good luck with your research, and here’s wishing you investment success! u
Ingrid SmithGroup Editor
What Investment is published by Vitesse Media Plc, Vitesse Media, 5th Floor, 14 Bonhill Street, London EC2A 4BX, Tel: 020 7250 7010. An annual subscription to What Investment costs £38.80 for 12 issues (UK), £48.80 (Europe) and £68.80 (rest of the world). Claims for non-delivery must be made within 14 days.
Member of ABC Average monthly circulation – January to December 2016: 7,240
ADVICE TO READERS:Information carried in What Investment is checked for accuracy, but we recommend that you make enquiries and, if necessary, take legal advice before entering into any transactions.
ISSN 0263 953X. © Vitesse Media Plc.
All rights reserved in respect of all articles, drawings, photographs, etc published in What Investment anywhere in the world. Reproduction or imitations of these are expressly forbidden without permission of the publishers. Editorial contributions requiring an answer should be accompanied by a stamped self-addressed envelope. Conditions of sale and supply: this periodical is sold subject to the following conditions, namely that it shall not, without the prior written consent of the publishers, be lent, resold, hired out or otherwise disposed of in a mutilated condition or in any unauthorised cover by way of trade. All advertising is subject to the terms of our current rate card.
Printed in England by Stephens & George Ltd.
News agency distribution by Select Publisher Services Ltd,PO Box 6337, Bournemouth BH1 9EH, Tel: 01202 586848
Follow @whatinvestment on Twitter
Like What Investment on Facebook
Join What Investment on LinkedIn
Follow What Investment on Google+
Comment – the bigger picture
www.WhatInvestment.co.uk 3
‘The beginning of the year
has seen the activation of
a raft of new regulation’
EDITORIALGroup Editor Ingrid Smith 020 7250 7026Assistant Editor Alan DobieSenior Designer Alex SmithJunior Designer Andy Shore
SUBSCRIPTIONS Jade Anderson-Busby 020 7250 7055
ADVERTISING Sales Manager Matthew Ridley 020 7250 7033
VITESSE EVENTSEvents Manager Jenna Read 020 7250 7050
VITESSE MEDIA PLCChief Executive Officer Simon Stilwell 020 7250 7010Executive Director Nicola Dowdall 020 7250 7010Editorial Director Ben Rossi 020 7250 7961Finance Director Edward Riddell 020 7250 7063
Email format: [email protected]
12
9770263953115
Issue 417 December 2017 £4.50
www.whatinvestment.co.uk
WINNING BIGFind out who has won this year’s What Investment Readers’ Awards
ALL CHANGEWe look at VCT and EIS investments ahead of the regulatory shake-up
BEYOND ROBO How to benefit from the next wave of digital wealth managers
INCLUDING: The latest developments in the investment trust space
Subscribe and SAVE
45%on the shop
price
Subscribe today and receive 12 issues for £29.99*
To take advantage of this offer, visit www.whatinvestment.co.uk/subscribe or call 020 7250 7055. Please use coupon code: wi-first-year-offer
* £29.99 for the first year, rising to the standard subscription rate (currently £38.80 per year) thereafter
We search widely.Murray International Trust ISA and Share Plan Plotting a path between defending your capital and generating a good income needs an expert sense of direction.
At Murray International Trust, we know how to explore the world searching for those companies that may deliver the right combination of capital preservation and income generation. And because we insist on meeting every company in whose shares we look to invest, you can be confident we are guiding you to potentially the best investments we can find.
Please remember, the value of shares and the income from them can go down as well as up and you may get back less than the amount invested. No recommendation is made, positive or otherwise, regarding the ISA and Share Plan.
The value of tax benefits depends on individual circumstances and the favourable tax treatment for ISAs may not be maintained. We recommend you seek financial advice prior to making an investment decision.
Request a brochure: 0808 500 4000 murray-intl.co.uk
Aberdeen Standard Investments is a brand of the investment businesses of Aberdeen Asset Management and Standard Life Investments. Issued by Aberdeen Asset Managers Limited, 10 Queen’s Terrace, Aberdeen AB10 1YG, which is authorised and regulated by the Financial Conduct Authority in the UK. Telephone calls may be recorded. aberdeen-asset.co.uk
Please quote MINT WI 25
121031218_IT_ADVERT_MINT_WI_25.indd 1 09/01/2018 17:02

www.WhatInvestment.co.uk 5
Regulars
Special section: What Investment TrustIn this month’s special section, we look at how including Canadian equity holdings can complement your global portfolio and hear from Fidelity International on where they see the best investment trust opportunities in five key regions
41
20 Cover StoryThe REIT stuff Custodian Capital’s Richard Shepherd-Cross analyses the investment disparity between unit trusts and real estate investment trusts
Explaining the CLO marketWhat Investment demystifies the collateralised loan obligation and offers insight into its relevance and popularity
We need more rich people!Katie Potts, the founder and lead fund manager at Herald Investment Trust, explains why she values the rich enough to want to tax them more in the current economic environment
Spotting the multi-bagger tech start-upsAlexander Selegenev and Igor Shoifot provide guidance on the art of choosing those elusive stocks that will make returns of several times their cost
14
30
34
*
*
*
* News and views 3 Editor ’s comment 6 News round-up
* Markets and asset allocation
10 Stock watch11 The property portal12 Small-cap outlook13 Growth stocks – Parity Group28 Country profile – North & South Korea 33 Taxing matters
* Savings and tax rates
50 Borrowing rates51 Best ways to save53 Tax rates and data
* Performance data
54 Unit trusts71 Investment trusts76 Exchange-traded funds
* Pensions and retirement planning49 Annuity rates
* Investor insight80 The Neeps Investment Club82 Terry Bond
* Funds in focus
26 New offers30 The big interview – Katie Potts79 Platform perspectives
CⁿⁿFebruary 2018
6 www.WhatInvestment.co.uk
Most popular stories on WhatInvestment.co.ukDoes Carillion’s collapse threaten its pension fund?Reasons to be cheerful: Bull markets and other thingsWhat are the top share investment tips for 2018?Major cryptocurrency trends for 2018What is ‘Divorce Day’ all about?
Month to 17 January 2018
1
2
3
4
5
NewsFeed
Follow @whatinvestment on Twitter
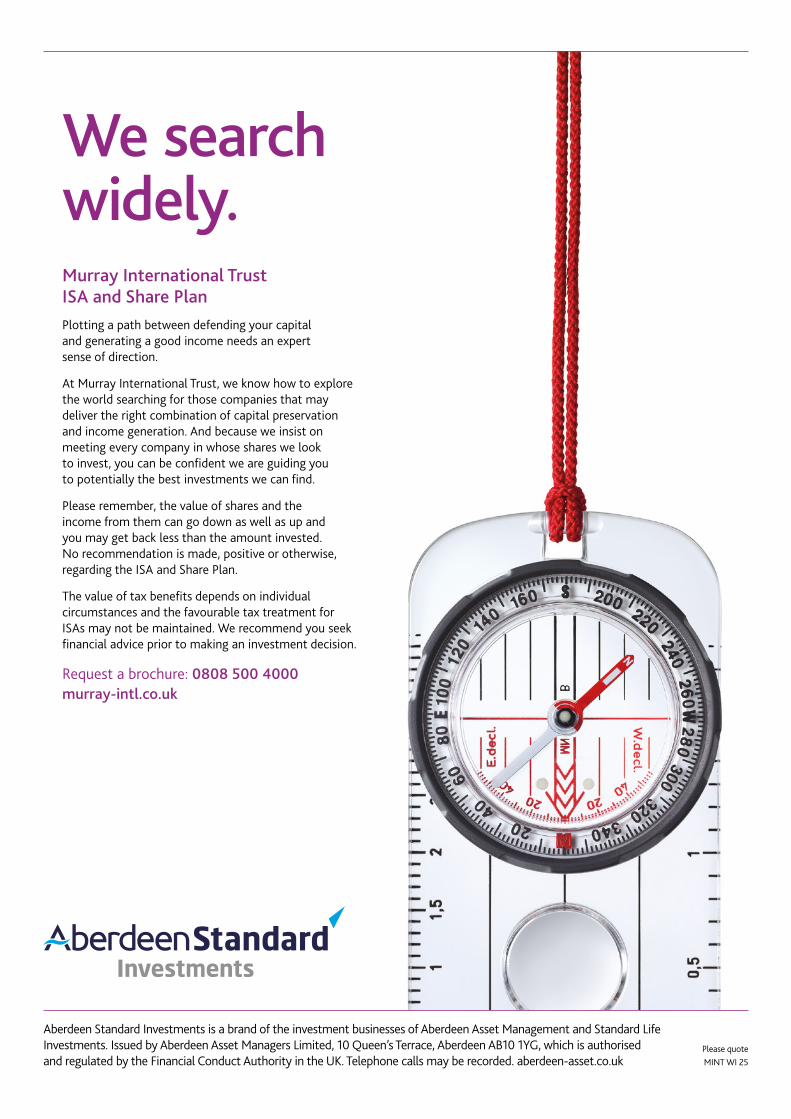
Millennials destined to spend a large proportion of post-tax income on rentRents across the UK began to shrink for the first time in over half a decade towards the end of 2017, falling by 0.01 per cent in November, as a two-speed market emerged between London and much of the rest of the UK, according to the second edition of the National Rent Review from buy-to-let lender Landbay, powered by MIAC.
The average rent paid for a UK property grew by 0.53 per cent in 2017 (year-to-date), with falling rents in London (-0.83 per cent) weighing down otherwise resilient rental growth elsewhere (1.27 per cent), Landbay said.
The review also revealed how much millennials can expect to spend on rent in their lifetime.
The national pictureThe average UK rent has now plateaued at a record £1,196 per month, up from £1,190 at the beginning of 2017. Removing London from the equation puts average rents at £759 per month, up from £750 at the start of 2017, equating to an extra £108 per year.
The recent slowdown in rental growth has not been consistent across the country, and the following areas are expected to climb further in 2018:• The East Midlands is expected to grow
2.13 per cent• The South West is expected to grow 1.63
per cent, and• The East of England is expected to grow
1.57 per cent.The North East has also seen rents grow at a faster rate in 2017 than at any other time in the past five years, at 0.65 per cent.
London has seen the greatest reversal of rental growth, with November marking 18 months since rents in the capital first entered negative territory. And the capital continues
to be the main source of the UK’s slowdown, with rents falling in 26 of the 33 London boroughs. Rents have fallen by 0.83 per cent year-to-date in 2017, compared with 1.27 per cent growth elsewhere in the UK.
Despite the narrowing gap, London monthly rents remain, on average, 2.5 times greater than those across the rest of the UK (£1,871 vs. £759).
John Goodall, CEO and co-founder of Landbay, said, ‘Landlords have faced up to challenge after challenge over the past two years, from stricter regulation and reductions to tax relief to a significant stamp duty tax hike when purchasing a buy-to-let property.
‘One would expect this pressure to push up rents, but two key factors have allowed them to shoulder these rapidly rising costs: the Bank of England’s enduring Term Funding Scheme (TFS), which has injected a significant sum of cheap capital into banks, and record-low interest rates, which have also kept borrowing costs low.
‘With interest rates now rising, and the TFS coming to an end in February, we expect upward rental pressure to be just around the corner. Without a radical housebuilding plan
for purchase – as well as purpose-built rental properties – rental prices are in danger of soaring over the coming decades.’
How much millennials spend on rentMillennials renting an average-sized property outside London, who begin their tenancy at age 21, will spend an average of £110,830 in household rental payments before buying their first property at the average first-time buyer age of 32. For those living in the capital, where property prices and rents are significantly higher, the average household will have spent £273,210 on rent by the time they take their first step onto the property ladder.
However, as it stands today, 41 per cent of millennials don’t expect to ever own a home of their own, according to the data, relying instead on the private rental sector to support them into old age.
For this emerging generation of lifetime renters, the total amount they will spend on rent in their lifetime will be an average of £1.1 million if living outside London. Again, those choosing to live in the capital will spend nearly 2.5 times this figure – a total of £2.6 million.
For the fortunate millennials that are able to buy their first house at the age of 32, they will have spent 34 per cent of their household post-tax income (£330,235) on rent (£110,830) throughout their twenties and early thirties. Meanwhile, those renting for life, and retiring at the future state pension age of 68, will have to save for 15 years of rental payments in retirement, and will therefore spend a greater proportion, some 44 per cent, of their household disposable income (£2.4 million) on rent (£1.1 million) by the time they reach the average life expectancy of 82.

*Ongoing charges as at 31.03.17. **Source: Morningstar, share price, total return as at 30.09.17. Your call may be recorded for training or monitoring purposes. Scottish Mortgage Investment Trust PLC is available through the Baillie Gifford Investment Trust Share Plan and the Investment Trust ISA, which are managed by Baillie Gifford Savings Management Limited (BGSM). BGSM is an affi liate of Baillie Gifford & Co Limited, which is the manager and secretary of Scottish Mortgage Investment Trust PLC.
SOME OPPORTUNITIES ARE MORE EXCLUSIVE THAN OTHERS.A company’s ability to exhibit exponential growth lies at the heart of the Scottish Mortgage Investment Trust, managed by Baillie Gifford.
Our portfolio consists of around 80 of what we believe are the most exciting companies in the world today. Our vision is long term and we invest with no limits on geographical or sector exposure.
Baillie Gifford’s track record as long-term, supportive shareholders makes us attractive to a new breed of capital-light businesses. And our committed approach means we can enjoy a better quality of dialogue with management teams at transformational organisations such as Alibaba, Dropbox and Airbnb. So it is a case of who you know as well as what you know. Over the last fi ve years the Scottish Mortgage Investment Trust has delivered a total return of 222.8% compared to 117.6% for the sector**.
Standardised past performance to 30 September**:
2013 2014 2015 2016 2017
Scottish Mortgage 35.9% 27.6% 4.2% 37.0% 30.4%
AIC Global Sector Average 23.6% 12.1% 5.1% 21.8% 21.6%
Past performance is not a guide to future returns.
Please remember that changing stock market conditions and currency exchange rates will affect the value of the investment in the fund and any income from it. Investors may not get back the amount invested.
The Trust’s risk could be increased by its investment in unlisted investments. These assets maybe more diffi cult to buy or sell, so changes in their prices may be greater.
For some very exclusive opportunities, call us on 0800 027 0132 or visit us at www.bailliegifford.com
A Key Information Document is available by contacting us.
COSTS MAKE A REAL DIFFERENCE TO PERFORMANCE – OUR ONGOING CHARGES ARE JUST 0.44%*.
SCOTTISH MORTGAGE INVESTMENT TRUST
Long-term investment partners
8 www.WhatInvestment.co.uk
Some people relish finding a bargain, and there’s generally no better time to do this than the January sales.
However, when it comes to investing, at a time when stock markets around the world are posting record highs and even bonds are looking expensive, are there any bargains to be found?
Juliet Schooling Latter, FundCalibre’s research director, looks at four fund managers who spend all year looking for the cut-price stock gems others have failed to notice:
Alastair Mundy – Investec UK Special SituationsAlastair is one of the best-known value managers within the UK investment industry and boasts a deep-value, bottom-up approach to stock selection, which focuses on unloved large-caps with strong balance sheets.
In order for stocks to be included within this fund, they must have fallen by at least 50 per cent over the last five years relative to the market. Alastair describes his approach to stock selection as ‘looking in other people’s dustbins’ for value opportunities, and will typically hold these companies for four to five years to maximise their recovery potential.
Examples of his largest individual holdings include the banks HSBC, RBS and Barclays, as well as Royal Dutch Shell, BP and Tesco*.
Ben Whitmore – Jupiter UK Special SituationsManaged with a distinct contrarian and value-based approach, this fund offers investors access to a reasonably diversified portfolio of large- and mid-cap UK stocks. The manager, Ben Whitmore, is hugely experienced and has had considerable success running this type of mandate. He follows a methodical and well-defined investment philosophy, looking to buy stocks that are out-of-fashion with the market.
Amongst his top ten stocks are BP, Anglo American, Standard Chartered, Pearson and Tesco**.
Hugh Sergeant – R&M UK Equity Long Term RecoveryFinding undervalued companies that are yet to deliver on their potential is the aim of this fund. The manager uses his three decades of investing experience to identify companies where he believes management have the capability to turn things around. He will also add to his holdings at almost fire-sale prices in volatile times, which further increases the possibility of long-term capital appreciation.
He currently has Anglo American, Lloyds Banking Group and Standard Chartered among his largest overweights***.
Nick Kirrage and Kevin Murphy – Schroder IncomeThis is a deep value-driven fund that invests in companies valued at less than their ‘true’ worth and waiting for a correction. It has little correlation with other income funds, tending to avoid the big income producers in favour of more niche names, where both capital and income can grow significantly.
Amongst the fund’s top ten holdings currently are HSBC, BP and Pearson****.
*Source: Investec UK Special Situations factsheet, end of Nov 2017. **Source: Jupiter UK Special Situations factsheet, end of Nov 2017. ***Source: R&M UK Equity Long Term Recovery factsheet, end of Oct 2017. ****Schroder Income factsheet, end of Oct 2017.
NewsFeed
Follow @whatinvestment on Twitter
January stock-picker sales EISA brings advisers up to speedThe Enterprise Investment Scheme Association (EISA) has published a new guide to help advisers understand and explain changes in the tax-efficient investing scheme, following the Autumn 2017 Budget.
The free guide – EIS: new landscape, new opportunities – explains the background to the changes and why capital preservation schemes will no longer be able to take advantage of the generous benefits associated with EIS.
It also highlights the enhanced terms, including the doubling of the amount that can be invested by individuals through EIS, from £1 million to £2 million. There has also been an increase in the total amount that can be invested in ‘knowledge-intensive’ companies – from £5 million to £10 million.
Mark Brownridge, the director general of EISA, which is the trade body for the industry, said, ‘A detailed survey we conducted with advisers in the wake of the Budget announcement showed that half expect to see more investor interest now.’
www.WhatInvestment.co.uk 9
ADVERTISING FEATURE
What dog food can teach us about growth investing
You can find great, innovative businesses in the most surprising places. And there’s a great way to invest even if they’re unquoted
Sometimes, the best investment opportunities are found in less obvious markets, where a new
entrant is using a new, technology- driven business model to take on established players.
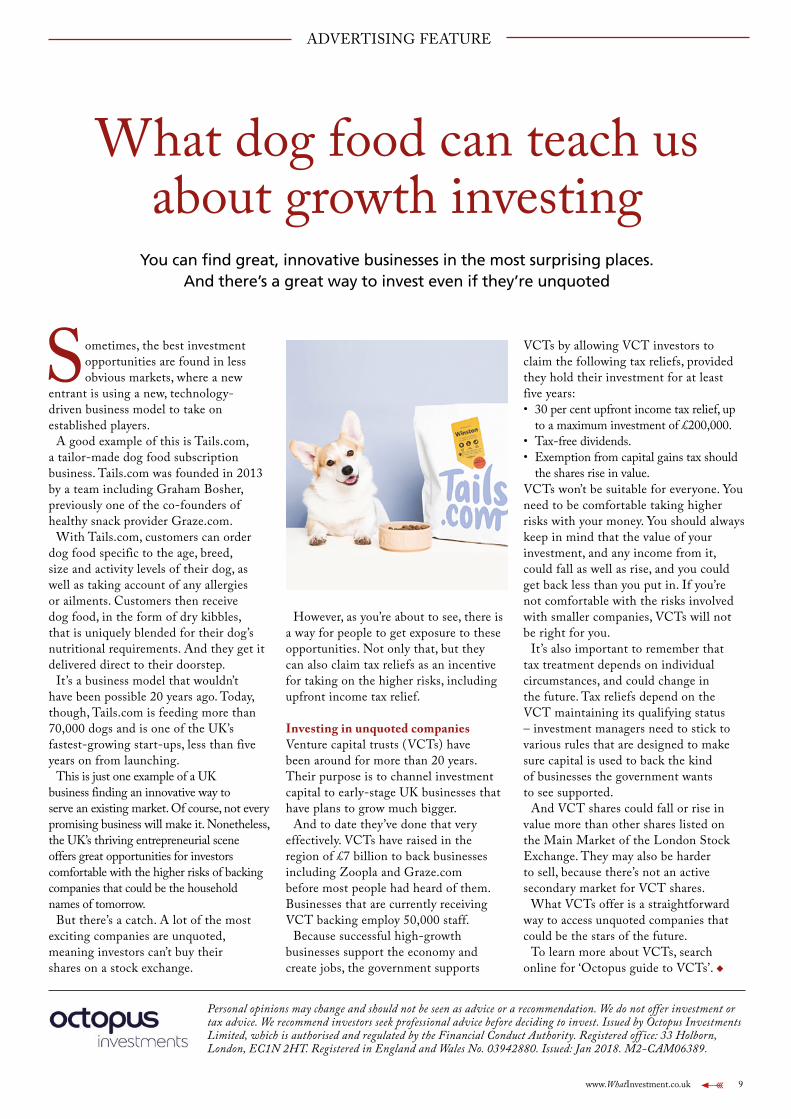
A good example of this is Tails.com, a tailor-made dog food subscription business. Tails.com was founded in 2013 by a team including Graham Bosher, previously one of the co-founders of healthy snack provider Graze.com.
With Tails.com, customers can order dog food specific to the age, breed, size and activity levels of their dog, as well as taking account of any allergies or ailments. Customers then receive dog food, in the form of dry kibbles, that is uniquely blended for their dog’s nutritional requirements. And they get it delivered direct to their doorstep.
It’s a business model that wouldn’t have been possible 20 years ago. Today, though, Tails.com is feeding more than 70,000 dogs and is one of the UK’s fastest-growing start-ups, less than five years on from launching.
This is just one example of a UK business finding an innovative way to serve an existing market. Of course, not every promising business will make it. Nonetheless, the UK’s thriving entrepreneurial scene offers great opportunities for investors comfortable with the higher risks of backing companies that could be the household names of tomorrow.
But there’s a catch. A lot of the most exciting companies are unquoted, meaning investors can’t buy their shares on a stock exchange.
Personal opinions may change and should not be seen as advice or a recommendation. We do not offer investment or tax advice. We recommend investors seek professional advice before deciding to invest. Issued by Octopus Investments Limited, which is authorised and regulated by the Financial Conduct Authority. Registered off ice: 33 Holborn, London, EC1N 2HT. Registered in England and Wales No. 03942880. Issued: Jan 2018. M2-CAM06389.
However, as you’re about to see, there is a way for people to get exposure to these opportunities. Not only that, but they can also claim tax reliefs as an incentive for taking on the higher risks, including upfront income tax relief.
Investing in unquoted companiesVenture capital trusts (VCTs) have been around for more than 20 years. Their purpose is to channel investment capital to early-stage UK businesses that have plans to grow much bigger.
And to date they’ve done that very effectively. VCTs have raised in the region of £7 billion to back businesses including Zoopla and Graze.com before most people had heard of them. Businesses that are currently receiving VCT backing employ 50,000 staff.
Because successful high-growth businesses support the economy and create jobs, the government supports
VCTs by allowing VCT investors to claim the following tax reliefs, provided they hold their investment for at least five years:• 30 per cent upfront income tax relief, up
to a maximum investment of £200,000.• Tax-free dividends.• Exemption from capital gains tax should
the shares rise in value.VCTs won’t be suitable for everyone. You need to be comfortable taking higher risks with your money. You should always keep in mind that the value of your investment, and any income from it, could fall as well as rise, and you could get back less than you put in. If you’re not comfortable with the risks involved with smaller companies, VCTs will not be right for you.
It’s also important to remember that tax treatment depends on individual circumstances, and could change in the future. Tax reliefs depend on the VCT maintaining its qualifying status – investment managers need to stick to various rules that are designed to make sure capital is used to back the kind of businesses the government wants to see supported.
And VCT shares could fall or rise in value more than other shares listed on the Main Market of the London Stock Exchange. They may also be harder to sell, because there’s not an active secondary market for VCT shares.
What VCTs offer is a straightforward way to access unquoted companies that could be the stars of the future.
To learn more about VCTs, search online for ‘Octopus guide to VCTs’. u
10 www.WhatInvestment.co.uk
Stock watch
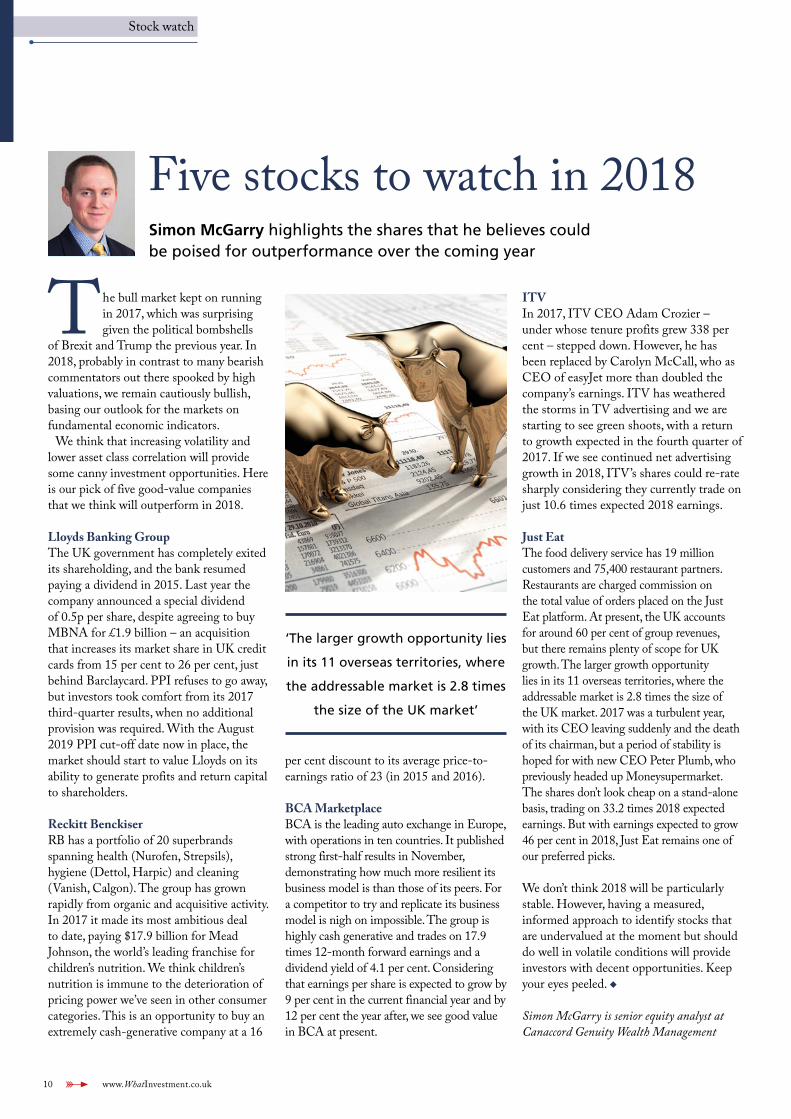
T he bull market kept on running in 2017, which was surprising given the political bombshells
of Brexit and Trump the previous year. In 2018, probably in contrast to many bearish commentators out there spooked by high valuations, we remain cautiously bullish, basing our outlook for the markets on fundamental economic indicators.
We think that increasing volatility and lower asset class correlation will provide some canny investment opportunities. Here is our pick of five good-value companies that we think will outperform in 2018.
Lloyds Banking GroupThe UK government has completely exited its shareholding, and the bank resumed paying a dividend in 2015. Last year the company announced a special dividend of 0.5p per share, despite agreeing to buy MBNA for £1.9 billion – an acquisition that increases its market share in UK credit cards from 15 per cent to 26 per cent, just behind Barclaycard. PPI refuses to go away, but investors took comfort from its 2017 third-quarter results, when no additional provision was required. With the August 2019 PPI cut-off date now in place, the market should start to value Lloyds on its ability to generate profits and return capital to shareholders.
Reckitt BenckiserRB has a portfolio of 20 superbrands spanning health (Nurofen, Strepsils), hygiene (Dettol, Harpic) and cleaning (Vanish, Calgon). The group has grown rapidly from organic and acquisitive activity. In 2017 it made its most ambitious deal to date, paying $17.9 billion for Mead Johnson, the world’s leading franchise for children’s nutrition. We think children’s nutrition is immune to the deterioration of pricing power we’ve seen in other consumer categories. This is an opportunity to buy an extremely cash-generative company at a 16
‘The larger growth opportunity lies
in its 11 overseas territories, where
the addressable market is 2.8 times
the size of the UK market’
per cent discount to its average price-to-earnings ratio of 23 (in 2015 and 2016).
BCA MarketplaceBCA is the leading auto exchange in Europe, with operations in ten countries. It published strong first-half results in November, demonstrating how much more resilient its business model is than those of its peers. For a competitor to try and replicate its business model is nigh on impossible. The group is highly cash generative and trades on 17.9 times 12-month forward earnings and a dividend yield of 4.1 per cent. Considering that earnings per share is expected to grow by 9 per cent in the current financial year and by 12 per cent the year after, we see good value in BCA at present.
Five stocks to watch in 2018Simon McGarry highlights the shares that he believes could be poised for outperformance over the coming year
ITVIn 2017, ITV CEO Adam Crozier – under whose tenure profits grew 338 per cent – stepped down. However, he has been replaced by Carolyn McCall, who as CEO of easyJet more than doubled the company’s earnings. ITV has weathered the storms in TV advertising and we are starting to see green shoots, with a return to growth expected in the fourth quarter of 2017. If we see continued net advertising growth in 2018, ITV’s shares could re-rate sharply considering they currently trade on just 10.6 times expected 2018 earnings.
Just EatThe food delivery service has 19 million customers and 75,400 restaurant partners. Restaurants are charged commission on the total value of orders placed on the Just Eat platform. At present, the UK accounts for around 60 per cent of group revenues, but there remains plenty of scope for UK growth. The larger growth opportunity lies in its 11 overseas territories, where the addressable market is 2.8 times the size of the UK market. 2017 was a turbulent year, with its CEO leaving suddenly and the death of its chairman, but a period of stability is hoped for with new CEO Peter Plumb, who previously headed up Moneysupermarket. The shares don’t look cheap on a stand-alone basis, trading on 33.2 times 2018 expected earnings. But with earnings expected to grow 46 per cent in 2018, Just Eat remains one of our preferred picks.
We don’t think 2018 will be particularly stable. However, having a measured, informed approach to identify stocks that are undervalued at the moment but should do well in volatile conditions will provide investors with decent opportunities. Keep your eyes peeled. u
Simon McGarry is senior equity analyst at Canaccord Genuity Wealth Management
www.WhatInvestment.co.uk 11
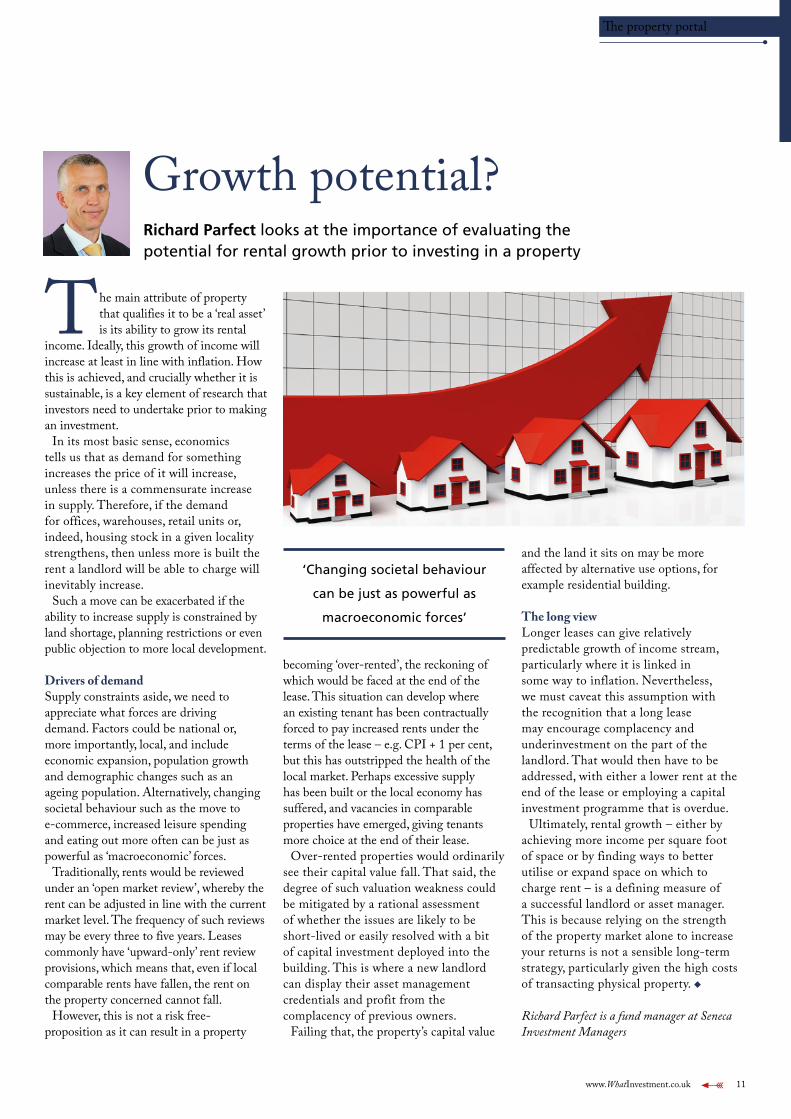
The main attribute of property that qualifies it to be a ‘real asset’ is its ability to grow its rental
income. Ideally, this growth of income will increase at least in line with inflation. How this is achieved, and crucially whether it is sustainable, is a key element of research that investors need to undertake prior to making an investment.
In its most basic sense, economics tells us that as demand for something increases the price of it will increase, unless there is a commensurate increase in supply. Therefore, if the demand for offices, warehouses, retail units or, indeed, housing stock in a given locality strengthens, then unless more is built the rent a landlord will be able to charge will inevitably increase.
Such a move can be exacerbated if the ability to increase supply is constrained by land shortage, planning restrictions or even public objection to more local development.
Drivers of demandSupply constraints aside, we need to appreciate what forces are driving demand. Factors could be national or, more importantly, local, and include economic expansion, population growth and demographic changes such as an ageing population. Alternatively, changing societal behaviour such as the move to e-commerce, increased leisure spending and eating out more often can be just as powerful as ‘macroeconomic’ forces.
Traditionally, rents would be reviewed under an ‘open market review’, whereby the rent can be adjusted in line with the current market level. The frequency of such reviews may be every three to five years. Leases commonly have ‘upward-only’ rent review provisions, which means that, even if local comparable rents have fallen, the rent on the property concerned cannot fall.
However, this is not a risk free-proposition as it can result in a property
becoming ‘over-rented’, the reckoning of which would be faced at the end of the lease. This situation can develop where an existing tenant has been contractually forced to pay increased rents under the terms of the lease – e.g. CPI + 1 per cent, but this has outstripped the health of the local market. Perhaps excessive supply has been built or the local economy has suffered, and vacancies in comparable properties have emerged, giving tenants more choice at the end of their lease.
Over-rented properties would ordinarily see their capital value fall. That said, the degree of such valuation weakness could be mitigated by a rational assessment of whether the issues are likely to be short-lived or easily resolved with a bit of capital investment deployed into the building. This is where a new landlord can display their asset management credentials and profit from the complacency of previous owners.
Failing that, the property’s capital value
and the land it sits on may be more affected by alternative use options, for example residential building.
The long viewLonger leases can give relatively predictable growth of income stream, particularly where it is linked in some way to inflation. Nevertheless, we must caveat this assumption with the recognition that a long lease may encourage complacency and underinvestment on the part of the landlord. That would then have to be addressed, with either a lower rent at the end of the lease or employing a capital investment programme that is overdue.
Ultimately, rental growth – either by achieving more income per square foot of space or by finding ways to better utilise or expand space on which to charge rent – is a defining measure of a successful landlord or asset manager. This is because relying on the strength of the property market alone to increase your returns is not a sensible long-term strategy, particularly given the high costs of transacting physical property. u
Richard Parfect is a fund manager at Seneca Investment Managers
Growth potential?Richard Parfect looks at the importance of evaluating the potential for rental growth prior to investing in a property
‘Changing societal behaviour
can be just as powerful as
macroeconomic forces’
The property portal
12 www.WhatInvestment.co.uk
Markets and asset allocation
Share View: PCF Group & Motorpoint
PCF Group has released its first full-year results as a newly constituted bank. The company has performed well during a period when management’s focus was on gaining the banking licence. As well as the necessary investment in infrastructure and systems for this, the company has also raised £10 million of new equity. This impacted near-term returns, but as CEO Scott Maybury says, management now have a clear run at delivering their target of £350 million in assets by 2020 and a 12.5 per cent return on equity.
The bank took £53 million of deposits between getting its licence in late July and the end of September. This lower cost of funds will enable it to enter the prime SME asset finance and consumer auto loan segments, which increases its market by an order of magnitude. On a p/e of 9 for September 2019 and high-teens growth, the shares remain a buy.
Near-new car dealer Motorpoint is firmly back on track after a wobble last year. UK new registrations may be down 5 per cent for the year and used sales flat, but Motorpoint is a niche retailer with a market share under 5 per cent, which enabled it to grow revenues 18 per cent in the half-year to September. Gross margins, of 7.9 per cent, have also been restored to normal levels.
The retail network now extends to 12 sites, and the company’s reach is also extended by a third of sales originating online. With limited capex needs and strong cash generation, a £10 million buy-back has been announced as well as a nice dividend uplift. The stock may have bounced nicely, but a prospective p/e of 11 and yield of 3 per cent still looks good value.
AIM’s high-flyers such as drinks manufacturer Fever-tree command very high price-to-earnings ratios
AIM has risen by 50 per cent over the past 18 months, which means that small-cap investors
have had a strong following wind. But to have gained maximum benefit, we’d have had to focus on the top-quality growth stocks within this universe. This isn’t always an easy thing to do.
On one hand, it’s very easy to like good-quality companies. They typically have strong balance sheets, consistent earnings, a high return on capital employed and plenty of other desirable characteristics. However, they often come at a high price, especially if their quality is allied to strong growth. High valuations are off-putting and present a hurdle that investors are having to overcome in this bull market.
Let’s put some numbers on this. Here are the prospective p/e ratios for a few of AIM’s leading stocks: ASOS 57, Fever-tree 54, First Derivatives 54, boohoo 52, Keywords Studios 40. The median stock valuation on AIM is 15 times earnings, so we are being asked to pay three to four
times the market multiple to travel in the first-class compartment. So far it’s been right to grit our teeth and pay this high entry price, but it’s also right to question how much further the trend can continue.
Two things need to be sustained. These beloved stocks have to keep generating upgrades to consensus expectations. They also need the low interest rates and bond yields that support high p/e’s. Low yields mean that future earnings are discounted at a low rate and are therefore more valuable – which is expressed in a high p/e ratio.
If bond yields begin to rise then the wind’s direction will change, and those future earnings would become less highly valued. We will need to keep this ‘big picture’ issue in mind when buying into those good-quality stocks. u
For more share analysis, why not subscribe to Growth Company Investor? Visit www.growthcompany.co.uk or call 020 7250 7055 to f ind out more.
Small-cap outlookSmaller companies editor David Thornton rounds up the recent action taking place in the UK’s small-cap markets
www.WhatInvestment.co.uk 13
Parity goes back to basics Parity Group’s strategy of going back to the basics of IT recruitment and consultancy after an
unsuccessful ‘digital adventure’ has seen a return to profitability, writes David Thornton
Parity has had a chequered history as a listed company. However, changes made over the past couple of years
seem to be bearing fruit, and the shares could make significant progress from here.
The business was founded in 1993 as an IT recruitment consultancy. The first few years were good, and the shares got as high as 140p during the dotcom bubble in 2000. However, this century has seen a long decline, with more red ink than black. This was punctuated by a false dawn when founder Philip Swinstead returned to the company in 2010 with a plan to take Parity into the sexy new areas of digital media and virtual reality. Stock was issued and a couple of deals were done, but several others slipped through the net. It left the company unprofitable and burning cash on fees related to the failing acquisition programme. Something had to change, and the decision was taken in late 2015 to embark on the present course.
In a nutshell, Parity is simplifying itself and going back to basics. The digital adventure has been unwound, with the remaining subsidiary currently up for sale. The core divisions of IT Consultancy and IT Recruitment that remain fit well together, and there are signs that management’s renewed
focus on these activities is delivering profitable growth. Investment is going into sales and marketing, and senior hires have been made that should see a pay-off over coming periods.
The Recruitment arm accounts for two-thirds of the business. Around 60 per cent of revenues come from the public sector, where the company has some long-standing relationships. Parity is also making progress in the private sector, which has accounted for a majority of new business wins of late.
Consultancy is a third of net revenues, but the target is to raise this to 50 per cent. Here, margins can be around 20 per cent, compared with a net fee margin of 8 per cent in Recruitment, so growing this more profitable arm at a fast pace is a key part of the strategy. Revenues in the first half were up 48 per cent, and it feels like there’s plenty of momentum.
An example of the new focus on the core activities is the consolidation of the London operation into a single office. This saves on costs, emphasises the fact that Parity is a single company, and also means that Recruitment and Consultancy talk to each other all the time, which generates synergies.
The new simplified approach has seen a return to profitability, which in turn has delivered good cash flow and an improved balance sheet. Net debt has fallen from £7.4 million at the end of 2015 to £2.3 million in June’s balance sheet. Next year should see the company move into a net cash position, which would put dividends onto the agenda for the board to consider. Acquisitions are possible if an attractive bolt-on deal crops up, but this is essentially an organic story. u
This recommendation is from Growth Company Investor. Call 020 7250 7055 to subscribe.
PARITY GROUP www.parity.net
Recommendation – BUY
Ticker: AIM:PTY Sector: Support ServicesMid-price: 8.625p
Spread: 8.25p-9p 12-month high/low: 13p/7.75pMarket cap: £9m
RESULTS Turnover (£m) Pre-tax profit (£m) EPS (p) DPS (p) p/e Yield (%)Dec 2016 (A) 91.6 1.4 1.1 - 7.8 -Dec 2017 (E) 83.9 1.7 1.4 - 6.2 -Dec 2018 (E) 86.8 1.9 1.5 - 5.8 -Dec 2019 (E) 90.6 2.2 1.7 - 5.1 -
SECTOR PEERS Ticker Market cap (£m) Pre-tax profit (£m) p/eHarvey Nash HVN 65 8.5 6.9Gattaca GATC 96 11.5 13.1
Growth stocks

14 www.WhatInvestment.co.uk
www.WhatInvestment.co.uk 15
Explaining the CLO marketThere are opportunities to make the world of investment as relatively
simple or complex as one might choose. Here, What Investment demystifies the collateralised loan obligation and offers insight into its relevance and popularity
A collateralised loan obligation (CLO) is a structured product designed to invest in a portfolio
of loans. CLOs are poorly understood, and often associated with other structured products that contributed to the financial crisis, though that association is unfair.
The understanding of a CLO ought to begin with an appreciation of institutional senior secured loans (also known as syndicated loans). Senior secured loans and high-yield bonds are both often used by corporations that have gone through a leveraged buyout, which need to recapitalise their balance sheet or simply require additional capital to fund acquisitions or the general growth of the business. Nonetheless, a number of key differences exist between the two asset classes, which are in turn reflected in their risk/reward characteristics. • Seniority and security (credit risk):
Senior secured loans typically represent a first priority, senior secured claim on the company’s assets, which reduces their credit risk exposure versus high-yield
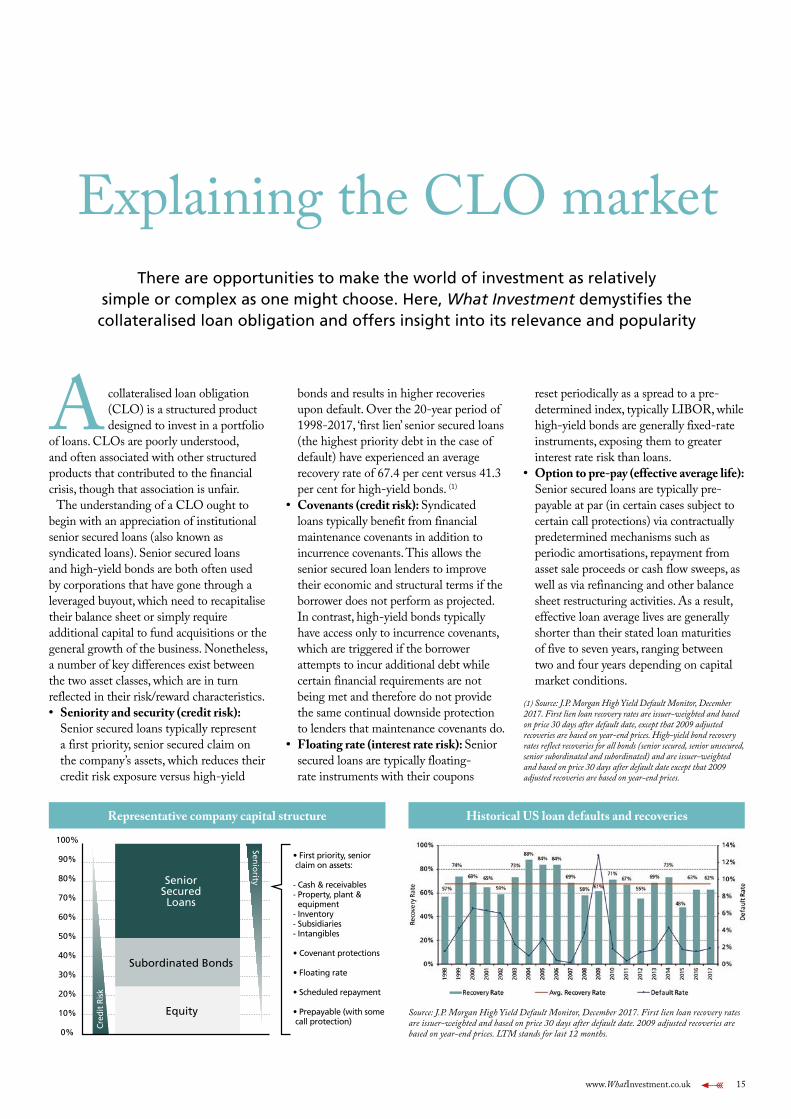
bonds and results in higher recoveries upon default. Over the 20-year period of 1998-2017, ‘first lien’ senior secured loans (the highest priority debt in the case of default) have experienced an average recovery rate of 67.4 per cent versus 41.3 per cent for high-yield bonds. (1)
• Covenants (credit risk): Syndicated loans typically benefit from financial maintenance covenants in addition to incurrence covenants. This allows the senior secured loan lenders to improve their economic and structural terms if the borrower does not perform as projected. In contrast, high-yield bonds typically have access only to incurrence covenants, which are triggered if the borrower attempts to incur additional debt while certain financial requirements are not being met and therefore do not provide the same continual downside protection to lenders that maintenance covenants do.
• Floating rate (interest rate risk): Senior secured loans are typically floating-rate instruments with their coupons
reset periodically as a spread to a pre-determined index, typically LIBOR, while high-yield bonds are generally fixed-rate instruments, exposing them to greater interest rate risk than loans.
• Option to pre-pay (effective average life): Senior secured loans are typically pre-payable at par (in certain cases subject to certain call protections) via contractually predetermined mechanisms such as periodic amortisations, repayment from asset sale proceeds or cash flow sweeps, as well as via refinancing and other balance sheet restructuring activities. As a result, effective loan average lives are generally shorter than their stated loan maturities of five to seven years, ranging between two and four years depending on capital market conditions.
(1) Source: J.P. Morgan High Yield Default Monitor, December 2017. First lien loan recovery rates are issuer-weighted and based on price 30 days after default date, except that 2009 adjusted recoveries are based on year-end prices. High-yield bond recovery rates reflect recoveries for all bonds (senior secured, senior unsecured, senior subordinated and subordinated) and are issuer-weighted and based on price 30 days after default date except that 2009 adjusted recoveries are based on year-end prices.
Source: J.P. Morgan High Yield Default Monitor, December 2017. First lien loan recovery rates are issuer-weighted and based on price 30 days after default date. 2009 adjusted recoveries are based on year-end prices. LTM stands for last 12 months.
Historical US loan defaults and recoveries Representative company capital structure
100%
90%
80%
70%
60%
50%
40%
30%
20%
10%
0%
• First priority, senior claim on assets:
- Cash & receivables- Property, plant &
equipment- Inventory- Subsidiaries- Intangibles
• Covenant protections
• Floating rate
• Scheduled repayment
• Prepayable (with some call protection)
SeniorSecuredLoans
Subordinated Bonds
Equity
Cre
dit
Ris
k
Senio
rity
16 www.WhatInvestment.co.uk
While US senior secured loans were historically a closely held asset on bank balance sheets, banks and other depository financial institutions began to reduce their exposure to leveraged loans in the 1990s as a result of a number of factors including bank consolidation, strategy shift and regulatory capital requirement changes (e.g. Basel II).
This migration of loan ownership from bank balance sheets occurred in the context of broadening institutional investor appetite for the asset class, and was accompanied by improving transparency, data standardisation and secondary liquidity. This has created a substantial shift in the ownership profile of senior secured loans towards mutual funds, separate managed accounts (SMAs), commingled funds and, most notably, CLOs.
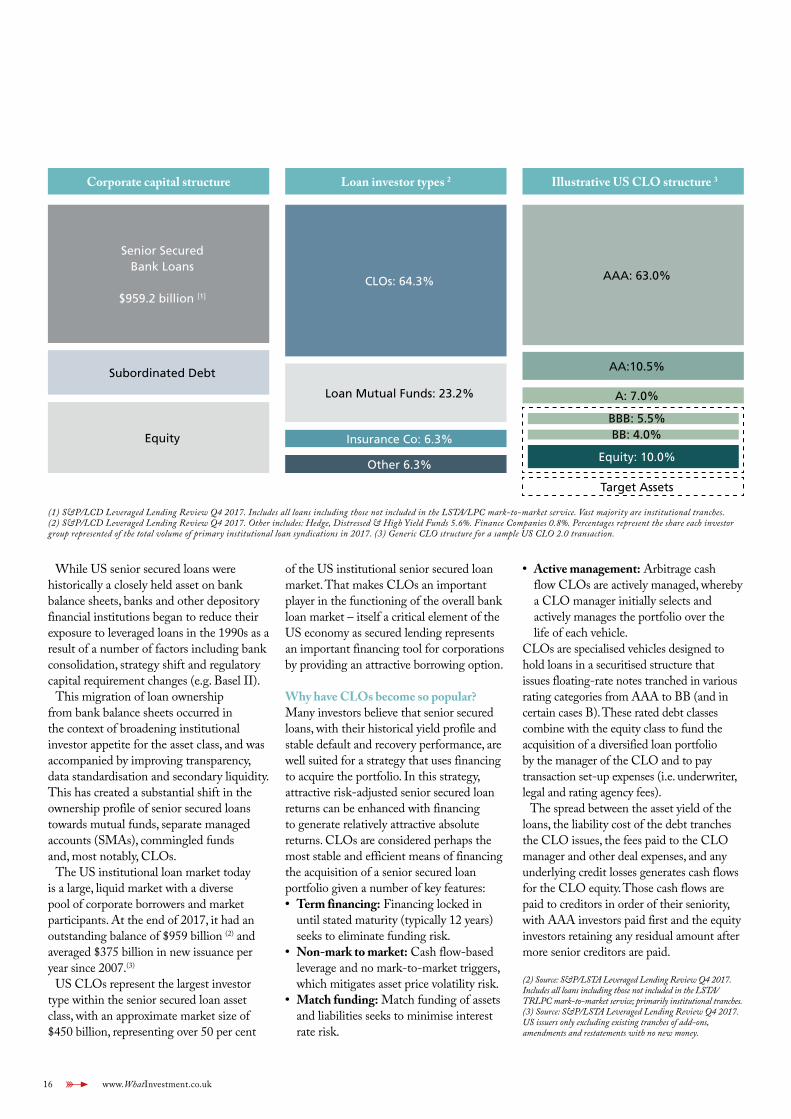
The US institutional loan market today is a large, liquid market with a diverse pool of corporate borrowers and market participants. At the end of 2017, it had an outstanding balance of $959 billion (2) and averaged $375 billion in new issuance per year since 2007.(3)
US CLOs represent the largest investor type within the senior secured loan asset class, with an approximate market size of $450 billion, representing over 50 per cent
of the US institutional senior secured loan market. That makes CLOs an important player in the functioning of the overall bank loan market – itself a critical element of the US economy as secured lending represents an important financing tool for corporations by providing an attractive borrowing option.
Why have CLOs become so popular? Many investors believe that senior secured loans, with their historical yield profile and stable default and recovery performance, are well suited for a strategy that uses financing to acquire the portfolio. In this strategy, attractive risk-adjusted senior secured loan returns can be enhanced with financing to generate relatively attractive absolute returns. CLOs are considered perhaps the most stable and efficient means of financing the acquisition of a senior secured loan portfolio given a number of key features:• Term financing: Financing locked in
until stated maturity (typically 12 years) seeks to eliminate funding risk.
• Non-mark to market: Cash flow-based leverage and no mark-to-market triggers, which mitigates asset price volatility risk.
• Match funding: Match funding of assets and liabilities seeks to minimise interest rate risk.
• Active management: Arbitrage cash flow CLOs are actively managed, whereby a CLO manager initially selects and actively manages the portfolio over the life of each vehicle.
CLOs are specialised vehicles designed to hold loans in a securitised structure that issues floating-rate notes tranched in various rating categories from AAA to BB (and in certain cases B). These rated debt classes combine with the equity class to fund the acquisition of a diversified loan portfolio by the manager of the CLO and to pay transaction set-up expenses (i.e. underwriter, legal and rating agency fees).
The spread between the asset yield of the loans, the liability cost of the debt tranches the CLO issues, the fees paid to the CLO manager and other deal expenses, and any underlying credit losses generates cash flows for the CLO equity. Those cash flows are paid to creditors in order of their seniority, with AAA investors paid first and the equity investors retaining any residual amount after more senior creditors are paid.
(2) Source: S&P/LSTA Leveraged Lending Review Q4 2017. Includes all loans including those not included in the LSTA/TRLPC mark-to-market service; primarily institutional tranches. (3) Source: S&P/LSTA Leveraged Lending Review Q4 2017. US issuers only excluding existing tranches of add-ons, amendments and restatements with no new money.
Corporate capital structure Loan investor types 2 Illustrative US CLO structure 3
Senior SecuredBank Loans
$959.2 billion [1]
CLOs: 64.3% AAA: 63.0%
Subordinated Debt
Equity
Loan Mutual Funds: 23.2%
Insurance Co: 6.3%
Other 6.3%
AA:10.5%
A: 7.0%
BBB: 5.5%BB: 4.0%
Equity: 10.0%
Target Assets
(1) S&P/LCD Leveraged Lending Review Q4 2017. Includes all loans including those not included in the LSTA/LPC mark-to-market service. Vast majority are institutional tranches. (2) S&P/LCD Leveraged Lending Review Q4 2017. Other includes: Hedge, Distressed & High Yield Funds 5.6%. Finance Companies 0.8%. Percentages represent the share each investor group represented of the total volume of primary institutional loan syndications in 2017. (3) Generic CLO structure for a sample US CLO 2.0 transaction.
www.WhatInvestment.co.uk 17
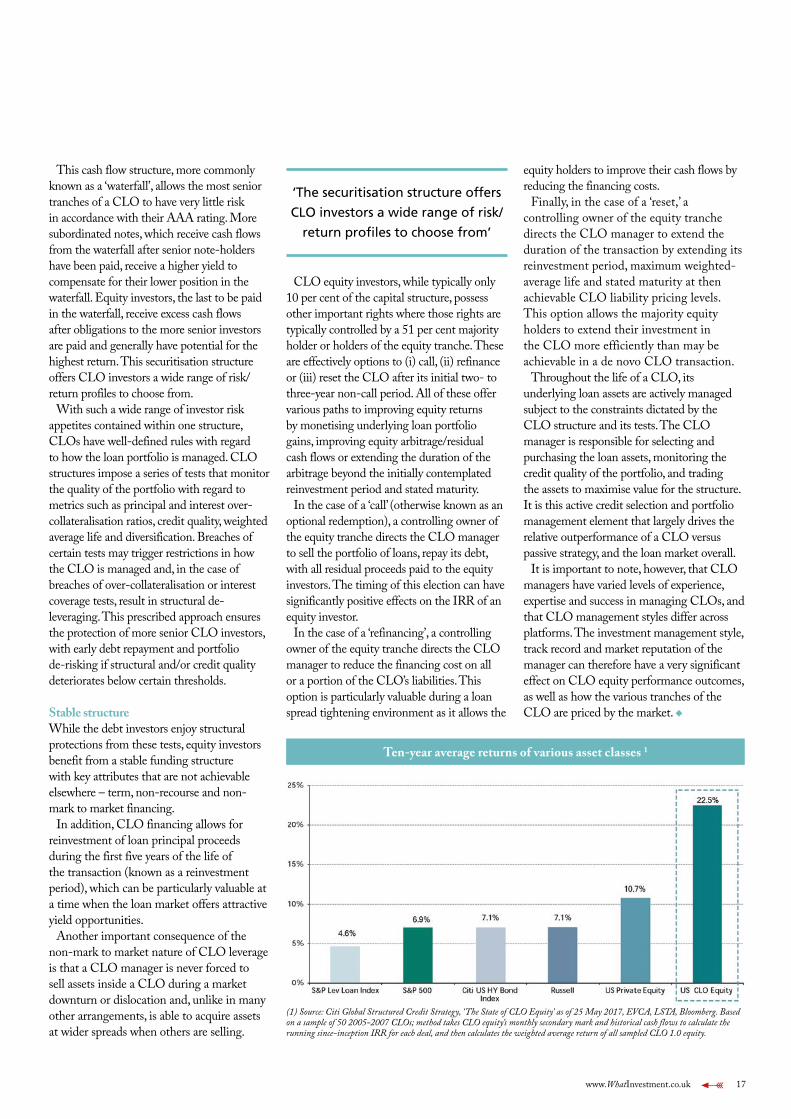
This cash flow structure, more commonly known as a ‘waterfall’, allows the most senior tranches of a CLO to have very little risk in accordance with their AAA rating. More subordinated notes, which receive cash flows from the waterfall after senior note-holders have been paid, receive a higher yield to compensate for their lower position in the waterfall. Equity investors, the last to be paid in the waterfall, receive excess cash flows after obligations to the more senior investors are paid and generally have potential for the highest return. This securitisation structure offers CLO investors a wide range of risk/return profiles to choose from.
With such a wide range of investor risk appetites contained within one structure, CLOs have well-defined rules with regard to how the loan portfolio is managed. CLO structures impose a series of tests that monitor the quality of the portfolio with regard to metrics such as principal and interest over-collateralisation ratios, credit quality, weighted average life and diversification. Breaches of certain tests may trigger restrictions in how the CLO is managed and, in the case of breaches of over-collateralisation or interest coverage tests, result in structural de-leveraging. This prescribed approach ensures the protection of more senior CLO investors, with early debt repayment and portfolio de-risking if structural and/or credit quality deteriorates below certain thresholds.
Stable structureWhile the debt investors enjoy structural protections from these tests, equity investors benefit from a stable funding structure with key attributes that are not achievable elsewhere – term, non-recourse and non-mark to market financing.
In addition, CLO financing allows for reinvestment of loan principal proceeds during the first five years of the life of the transaction (known as a reinvestment period), which can be particularly valuable at a time when the loan market offers attractive yield opportunities.
Another important consequence of the non-mark to market nature of CLO leverage is that a CLO manager is never forced to sell assets inside a CLO during a market downturn or dislocation and, unlike in many other arrangements, is able to acquire assets at wider spreads when others are selling.
CLO equity investors, while typically only 10 per cent of the capital structure, possess other important rights where those rights are typically controlled by a 51 per cent majority holder or holders of the equity tranche. These are effectively options to (i) call, (ii) refinance or (iii) reset the CLO after its initial two- to three-year non-call period. All of these offer various paths to improving equity returns by monetising underlying loan portfolio gains, improving equity arbitrage/residual cash flows or extending the duration of the arbitrage beyond the initially contemplated reinvestment period and stated maturity.
In the case of a ‘call’ (otherwise known as an optional redemption), a controlling owner of the equity tranche directs the CLO manager to sell the portfolio of loans, repay its debt, with all residual proceeds paid to the equity investors. The timing of this election can have significantly positive effects on the IRR of an equity investor.
In the case of a ‘refinancing’, a controlling owner of the equity tranche directs the CLO manager to reduce the financing cost on all or a portion of the CLO’s liabilities. This option is particularly valuable during a loan spread tightening environment as it allows the
equity holders to improve their cash flows by reducing the financing costs.
Finally, in the case of a ‘reset,’ a controlling owner of the equity tranche directs the CLO manager to extend the duration of the transaction by extending its reinvestment period, maximum weighted-average life and stated maturity at then achievable CLO liability pricing levels. This option allows the majority equity holders to extend their investment in the CLO more efficiently than may be achievable in a de novo CLO transaction.
Throughout the life of a CLO, its underlying loan assets are actively managed subject to the constraints dictated by the CLO structure and its tests. The CLO manager is responsible for selecting and purchasing the loan assets, monitoring the credit quality of the portfolio, and trading the assets to maximise value for the structure. It is this active credit selection and portfolio management element that largely drives the relative outperformance of a CLO versus passive strategy, and the loan market overall.
It is important to note, however, that CLO managers have varied levels of experience, expertise and success in managing CLOs, and that CLO management styles differ across platforms. The investment management style, track record and market reputation of the manager can therefore have a very significant effect on CLO equity performance outcomes, as well as how the various tranches of the CLO are priced by the market. u
‘The securitisation structure offers
CLO investors a wide range of risk/
return profiles to choose from’
(1) Source: Citi Global Structured Credit Strategy, ‘The State of CLO Equity’ as of 25 May 2017, EVCA, LSTA, Bloomberg. Based on a sample of 50 2005-2007 CLOs; method takes CLO equity’s monthly secondary mark and historical cash flows to calculate the running since-inception IRR for each deal, and then calculates the weighted average return of all sampled CLO 1.0 equity.
Ten-year average returns of various asset classes 1
Job No: 55745-20 Publication:What Investment Size: 297x210 Ins Date: 01.02.18 Proof no: 1 Tel: 020 7291 4700
PAST PERFORMANCE
Dec 12 –Dec 13
Dec 13 –Dec 14
Dec 14 –Dec 15
Dec 15 –Dec 16
Dec 16 –Dec 17
Fidelity ChinaSpecial SituationsNet Asset Value
35.8% 32.6% 12.5% 17.6% 40.2%
Fidelity ChinaSpecial SituationsShare Price
27.2% 27.4% 8.2% 20.3% 39.8%
MSCI China 1.7% 14.7% -2.5% 20.4% 40.7%
Source of performance: Fidelity and Morningstar as at 31 December 2017 on a bid-to-bid basiswith income reinvested in GBP terms. Copyright ©2017 Morningstar Inc. All Rights Reserved.The comparative index of the investment trust is MSCI China.
The latest annual reports and factsheets can be obtained from our website at www.fidelity.co.uk/its or by calling 0800 41 41 10. The full prospectus may also be obtained from Fidelity. Issued by Financial AdministrationServices Limited, authorised and regulated by the Financial Conduct Authority. Fidelity, Fidelity International, the Fidelity International logo and F symbol are trademarks of FIL Limited. UKM0118/21380/SSO/0418
FIDELITY CHINASPECIAL SITUATIONS PLCChina is changing, presenting significant investmentopportunities for those who know where to look.
Why? Well, the spending power of a growing and affluentmiddle class is increasingly driving the economy. Andgovernment reforms support this shift to a focus on thenew consumer.
In such a vast and complex market, you need on-the-ground expertise to take full advantage of these changesand the resulting undervaluations, particularly of small andmedium-sized companies, which can occur.
That’s why Dale Nicholls, manager of FidelityChina Special Situations, and his team ofresearchers are based in Hong Kong andShanghai. Their local knowledge andconnections make them well-placed toidentify and benefit from valuation anomaliesas they arise.
So, if you’re looking for localknowledge-based investment ina market that’s too big to ignore, take a closer look at theUK’s largest China investment trust.
Please note that past performance is not a guide tothe future. The value of investments can go down as wellas up and you may not get back the amount invested.Overseas investments are subject to currency fluctuations.Investments in small and emerging markets can be morevolatile than other overseas markets.
To find out more, go to fidelity.co.uk/chinaor speak to your adviser.
TO KNOW LOCALCOMPANIES,KEEP LOCALCOMPANY.
LET’S TALK HOW.

www.WhatInvestment.co.uk 19
ADVERTISING FEATURE
Fidelity trusts in China opportunitiesWhat Investment has a Q&A with Dale Nicholls, portfolio
manager of Fidelity China Special Situations Plc
China is increasingly recognised as being a major driver of growth and investment returns, not
just in Asia, but the wider world. Fidelity China Special Situations Plc aims to provide investors with direct exposure to this long-term growth story. And, despite the proliferation of passive strategies across financial markets, it maintains an active management stance, utilising Fidelity’s locally based analyst team to find companies that are most likely to benefit from China’s growth and its evolving economy.
The Trust’s manager, Dale Nicholls, took over from Anthony Bolton in 2013, and emphasises his belief in the ‘notable’ investment opportunities in Chinese stocks.
Positive signsHe says he is positive about the Chinese government’s focus on bringing about a structural shift away from a reliance on investment and towards consumption. And unsurprisingly, also about the opportunities that are emerging as a result of increasing wealth levels in China, where compared to the West there remains relatively low penetration across a range of consumer goods and services – along with increasing premiumisation as incomes rise and preferences evolve.
Nicholls notes that this dynamic is creating opportunities in several other areas. He says, ‘While the Chinese consumer is a significant purchaser of consumer goods, we also see greater demand for services like education and healthcare. However, the healthcare sector is still quite small in China and the listed opportunities are not as broad as other sectors.’
Looking at companies listed outside
the region, but with significant interests in China and Hong Kong, he comments, ‘Hutchison China MediTech is a long-standing position. It is a Chinese pharmaceutical company listed in the UK with a strong traditional Chinese medicine business generating strong cash flows for the company to support its R&D efforts. The company continues to develop its exciting pipeline, including a number of advanced oncology drugs, where it is teaming up with global multinationals like AstraZeneca.’
The Trust also holds around a quarter of its assets in US-listed China names. ‘There are some great opportunities in technology (e.g. Alibaba, Ctrip) and education (e.g. New Oriental Education & Technology, Tarena) and these companies are listed in the US for various reasons. We are agnostic to the place of listing, so long as the company has a strong focus on China,’ Nicholls remarks.
Much like the so-called US FAANG stocks (Facebook, Amazon, Apple, Netflix, Google), Chinese technology companies have also attracted significant investor attention of late. And despite recent strong performance, Nicholls notes that the IT sector remains a core focus for him.
He adds, ‘The structural technology shifts we see globally are happening faster in China,
and many companies play an important role as a consumption enabler. Also, data is now a key commodity for businesses that will continue to grow in importance over the mid-term. But clearly some companies are better placed to benefit than others, so it is important to be selective.’
Tech leadersIn particular, Nicholls remains positive on the long-term potential of the likes of Alibaba and Tencent. ‘Alibaba holds a dominant e-commerce position that will go from strength to strength. It also has other very promising businesses in relatively early stages of development, such as cloud and financial services. Tencent’s WeChat platform has 960 million users and is clearly the foremost online platform, but is still under-monetised relative to levels seen in the West, especially compared with the likes of Facebook.’
However, with these two very large companies representing close to a third of the MSCI China benchmark index, he says that getting close to market weight would impede diversification and also limit the amount of capital that the Trust could allocate to other opportunities – particularly in smaller companies and even unlisted stocks.
Indeed, the pace of China’s development is leading to a great deal of activity and innovation in companies that have not reached the listing stage. Nicholls notes that the Trust has the ability to invest in private companies that are yet to come to market – having been early investors in Alibaba. He cites Xiaoju Kuaizhi – the leading ride-sharing player in China that cemented its dominance after it acquired Uber China last year – as a prime example of a current holding in the unlisted space. u
Past performance is not a reliable indicator of future results. This information is not a personal recommendation for any particular investment. If you are unsure about the suitability of an investment you should speak to an authorised financial adviser. The value of investments can go down as well as up so investors may get back less than they invest. Investors should note that the views expressed may no longer be current and may have already been acted upon. Reference to specific securities should not be construed as a recommendation to buy or sell these securities and is included for the purposes of illustration only.
Overseas investments are subject to currency fluctuations. Investments in small and emerging markets can be more volatile than other overseas markets. Fidelity China Special Situations Plc can gear through the use of bank loans or overdrafts and this can be achieved through the use of derivatives. Where this is the case, it may lead to higher volatility in the net asset value and share price. It also invests more heavily than other trusts in smaller companies, which can carry a higher risk because their share prices may be more volatile than those of larger companies. The latest annual reports and factsheets can be obtained from our website at www.fidelity.co.uk/its or by calling 0800 41 41 10. The full prospectus may also be obtained from Fidelity. Issued by Financial Administration Services Limited, authorised and regulated in the UK by the Financial Conduct Authority. Fidelity, Fidelity International, the Fidelity International logo and F symbol are trademarks of FIL Limited.
‘The structural technology shifts we
see globally are happening faster in
China. But some companies are
better placed than others, so it is
important to be selective’

20 www.WhatInvestment.co.uk
www.WhatInvestment.co.uk 21
Commercial property has long been a popular investment among private investors, from
owner-occupiers through to the super-rich. A relatively high level of income and long-term capital growth potential makes property appealing for those looking to match long-term liabilities and is a good fit with both pensions and wealth protection strategies.
The investment credentials of commercial property can be summarised as follows:• Property is a long-term asset. While
short-term profits can be taken, property performs best as an asset class when investors hold for the long term and enjoy the income. Across a broad portfolio, statistics will show that income accounts for nearly 80 per cent of total return, eclipsing capital growth as the principal driver of investment returns.
• Property is a stable asset class with low volatility relative to equities.
• Property is weakly correlated with equities, giving a useful diversification benefit to investment portfolio returns.
• Property can be illiquid, but it is possible to access property-like returns from listed property investment companies and unit trusts to enhance liquidity. However, property investment decisions that are centred on liquidity rather than income can sacrifice too much income (the principal driver of total return) to secure liquidity that may not be needed.
• Property can be expensive, requiring deep pockets for investors to buy directly. Again, this is where property investment companies and unit trusts provide investors with access to property in a liquid, low-cost, fractional way.
The REIT stuffIs there a significant investment disparity between unit trusts and real estate
investment trusts (REITs) for retail investors? Richard Shepherd-Cross, the managing director of Custodian Capital, expands the debate
Why invest now?The property market has had a long and strong run since the dark days of the financial crisis, with a sustained recovery since 2009. This has been most obvious in investment markets, whether by reference to stock prices or retail flows into property unit trusts.
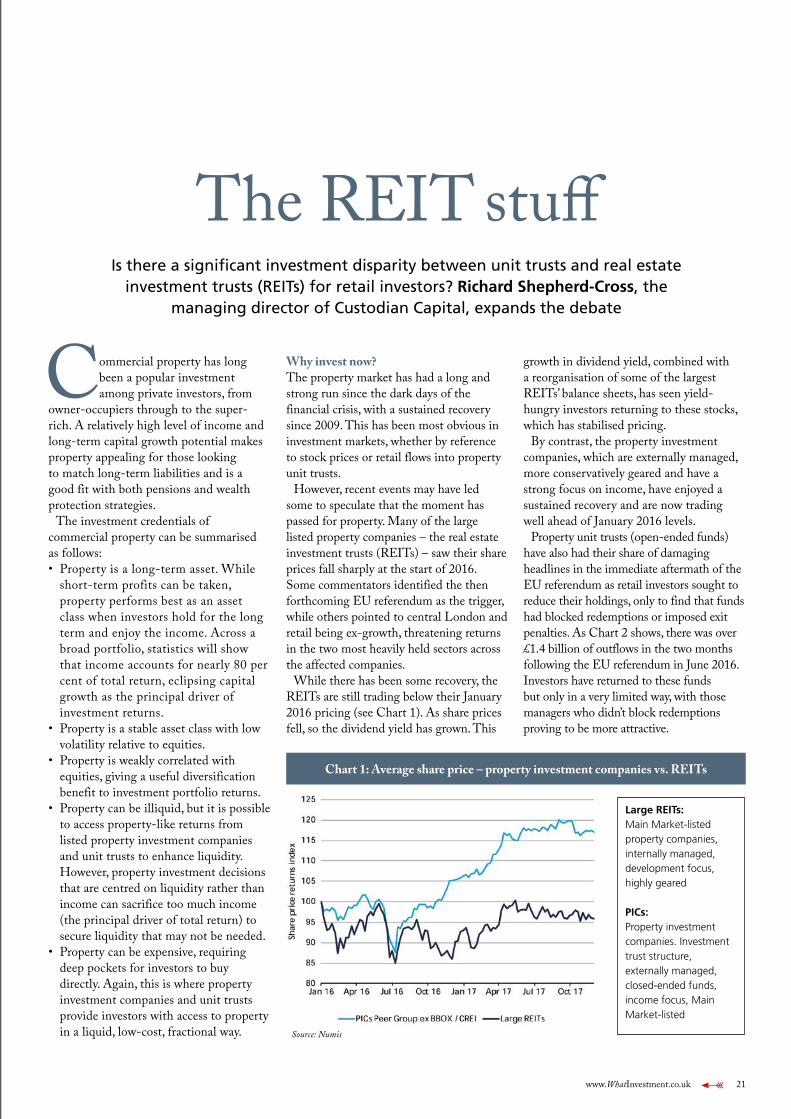
However, recent events may have led some to speculate that the moment has passed for property. Many of the large listed property companies – the real estate investment trusts (REITs) – saw their share prices fall sharply at the start of 2016. Some commentators identified the then forthcoming EU referendum as the trigger, while others pointed to central London and retail being ex-growth, threatening returns in the two most heavily held sectors across the affected companies.
While there has been some recovery, the REITs are still trading below their January 2016 pricing (see Chart 1). As share prices fell, so the dividend yield has grown. This
growth in dividend yield, combined with a reorganisation of some of the largest REITs’ balance sheets, has seen yield-hungry investors returning to these stocks, which has stabilised pricing.
By contrast, the property investment companies, which are externally managed, more conservatively geared and have a strong focus on income, have enjoyed a sustained recovery and are now trading well ahead of January 2016 levels.
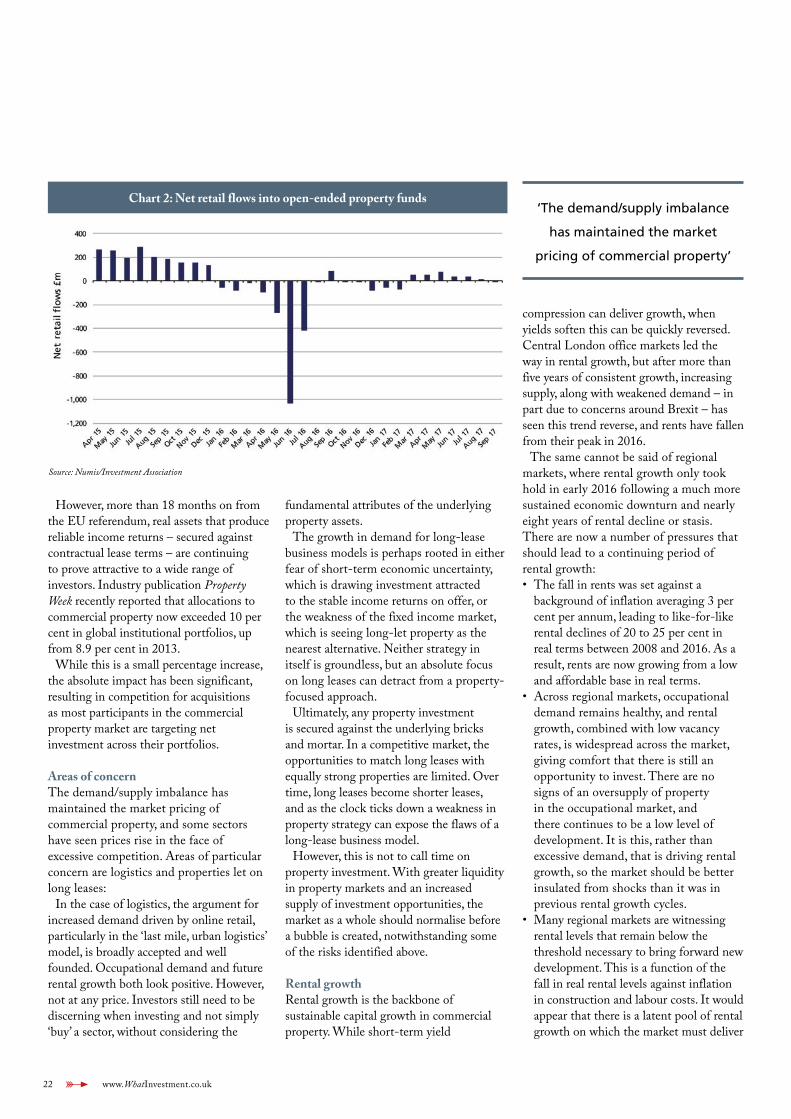
Property unit trusts (open-ended funds) have also had their share of damaging headlines in the immediate aftermath of the EU referendum as retail investors sought to reduce their holdings, only to find that funds had blocked redemptions or imposed exit penalties. As Chart 2 shows, there was over £1.4 billion of outflows in the two months following the EU referendum in June 2016. Investors have returned to these funds but only in a very limited way, with those managers who didn’t block redemptions proving to be more attractive.
Chart 1: Average share price – property investment companies vs. REITs
Large REITs: Main Market-listed property companies, internally managed, development focus, highly geared
PICs:Property investment companies. Investment trust structure, externally managed, closed-ended funds, income focus, Main Market-listed
Source: Numis
22 www.WhatInvestment.co.uk
However, more than 18 months on from the EU referendum, real assets that produce reliable income returns – secured against contractual lease terms – are continuing to prove attractive to a wide range of investors. Industry publication Property Week recently reported that allocations to commercial property now exceeded 10 per cent in global institutional portfolios, up from 8.9 per cent in 2013.
While this is a small percentage increase, the absolute impact has been significant, resulting in competition for acquisitions as most participants in the commercial property market are targeting net investment across their portfolios.
Areas of concernThe demand/supply imbalance has maintained the market pricing of commercial property, and some sectors have seen prices rise in the face of excessive competition. Areas of particular concern are logistics and properties let on long leases:
In the case of logistics, the argument for increased demand driven by online retail, particularly in the ‘last mile, urban logistics’ model, is broadly accepted and well founded. Occupational demand and future rental growth both look positive. However, not at any price. Investors still need to be discerning when investing and not simply ‘buy’ a sector, without considering the
fundamental attributes of the underlying property assets.
The growth in demand for long-lease business models is perhaps rooted in either fear of short-term economic uncertainty, which is drawing investment attracted to the stable income returns on offer, or the weakness of the fixed income market, which is seeing long-let property as the nearest alternative. Neither strategy in itself is groundless, but an absolute focus on long leases can detract from a property-focused approach.
Ultimately, any property investment is secured against the underlying bricks and mortar. In a competitive market, the opportunities to match long leases with equally strong properties are limited. Over time, long leases become shorter leases, and as the clock ticks down a weakness in property strategy can expose the flaws of a long-lease business model.
However, this is not to call time on property investment. With greater liquidity in property markets and an increased supply of investment opportunities, the market as a whole should normalise before a bubble is created, notwithstanding some of the risks identified above.
Rental growthRental growth is the backbone of sustainable capital growth in commercial property. While short-term yield
compression can deliver growth, when yields soften this can be quickly reversed. Central London office markets led the way in rental growth, but after more than five years of consistent growth, increasing supply, along with weakened demand – in part due to concerns around Brexit – has seen this trend reverse, and rents have fallen from their peak in 2016.
The same cannot be said of regional markets, where rental growth only took hold in early 2016 following a much more sustained economic downturn and nearly eight years of rental decline or stasis. There are now a number of pressures that should lead to a continuing period of rental growth: • The fall in rents was set against a
background of inflation averaging 3 per cent per annum, leading to like-for-like rental declines of 20 to 25 per cent in real terms between 2008 and 2016. As a result, rents are now growing from a low and affordable base in real terms.
• Across regional markets, occupational demand remains healthy, and rental growth, combined with low vacancy rates, is widespread across the market, giving comfort that there is still an opportunity to invest. There are no signs of an oversupply of property in the occupational market, and there continues to be a low level of development. It is this, rather than excessive demand, that is driving rental growth, so the market should be better insulated from shocks than it was in previous rental growth cycles.
• Many regional markets are witnessing rental levels that remain below the threshold necessary to bring forward new development. This is a function of the fall in real rental levels against inflation in construction and labour costs. It would appear that there is a latent pool of rental growth on which the market must deliver
Chart 2: Net retail flows into open-ended property funds
Source: Numis/Investment Association
‘The demand/supply imbalance
has maintained the market
pricing of commercial property’
www.WhatInvestment.co.uk 23
before we see supply reach equilibrium with demand, thus maintaining pressure on rents to grow.
• Many tenant negotiations remain finely balanced, with tenants keenly aware of their value to landlords. However, tenants are accepting of rental growth, which they have probably avoided for as much as ten years in many instances. This, along with limited supply of alternative premises, should continue to deliver rental growth.
Therefore, although investment markets have been running hot for a couple of years – which could lead investors to conclude that the best market timing is behind them – occupational dynamics, particularly in regional markets, are robust. There is a real supply/demand imbalance, which should lead to high occupancy rates and rental growth, which are two key indicators that timing for investment into UK real estate is still OK.
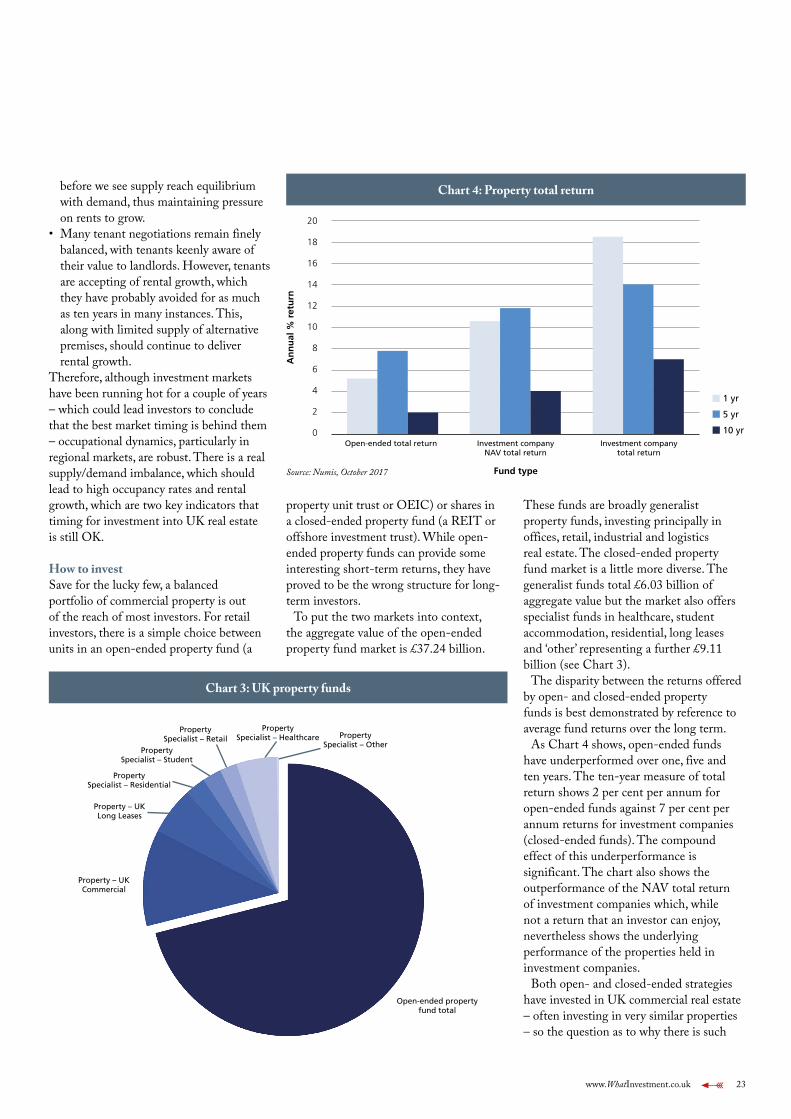
How to investSave for the lucky few, a balanced portfolio of commercial property is out of the reach of most investors. For retail investors, there is a simple choice between units in an open-ended property fund (a
property unit trust or OEIC) or shares in a closed-ended property fund (a REIT or offshore investment trust). While open-ended property funds can provide some interesting short-term returns, they have proved to be the wrong structure for long-term investors.
To put the two markets into context, the aggregate value of the open-ended property fund market is £37.24 billion.
These funds are broadly generalist property funds, investing principally in offices, retail, industrial and logistics real estate. The closed-ended property fund market is a little more diverse. The generalist funds total £6.03 billion of aggregate value but the market also offers specialist funds in healthcare, student accommodation, residential, long leases and ‘other’ representing a further £9.11 billion (see Chart 3).
The disparity between the returns offered by open- and closed-ended property funds is best demonstrated by reference to average fund returns over the long term.
As Chart 4 shows, open-ended funds have underperformed over one, five and ten years. The ten-year measure of total return shows 2 per cent per annum for open-ended funds against 7 per cent per annum returns for investment companies (closed-ended funds). The compound effect of this underperformance is significant. The chart also shows the outperformance of the NAV total return of investment companies which, while not a return that an investor can enjoy, nevertheless shows the underlying performance of the properties held in investment companies.
Both open- and closed-ended strategies have invested in UK commercial real estate – often investing in very similar properties – so the question as to why there is such
Chart 4: Property total return
Source: Numis, October 2017
20
18
16
14
12
10
8
6
4
2
0
An
nu
al %
ret
urn
Fund type
1 yr
5 yr
10 yrOpen-ended total return Investment company
NAV total returnInvestment company
total return
Open-ended property fund total
Property – UK Commercial
Property – UK Long Leases
Property Specialist – Residential
Property Specialist – Student
Property Specialist – Retail
Property Specialist – Healthcare Property
Specialist – Other
Chart 3: UK property funds
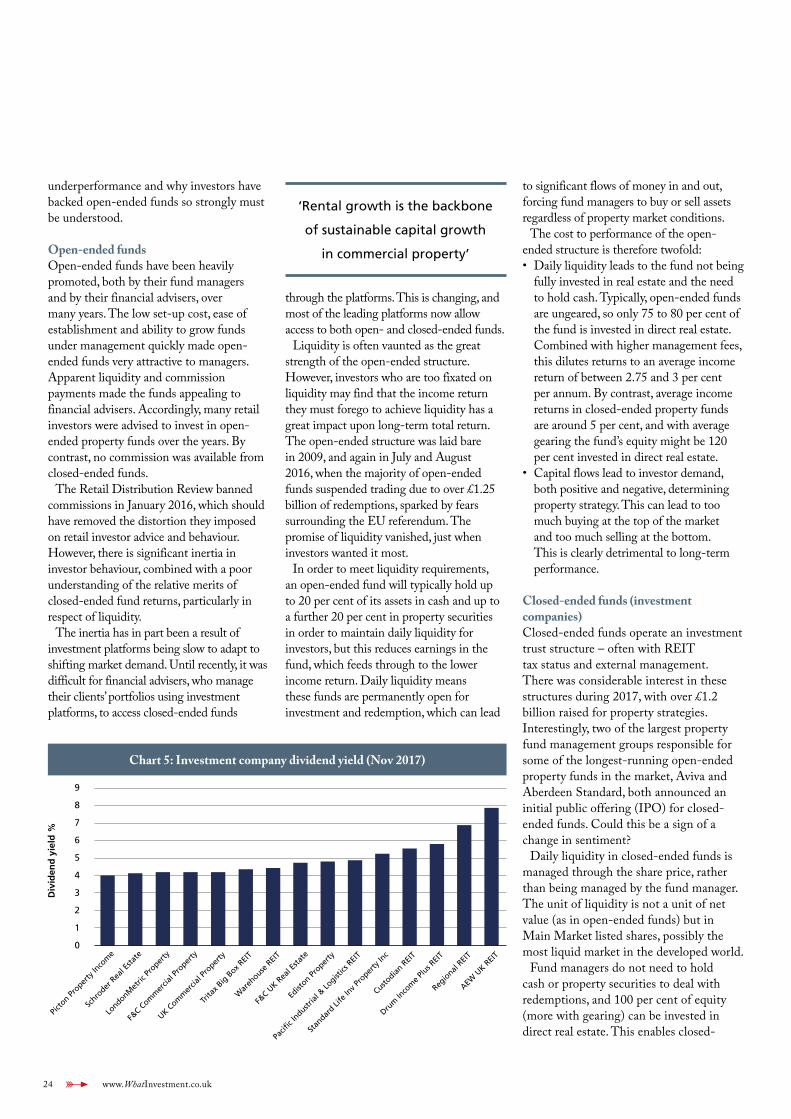
24 www.WhatInvestment.co.uk
underperformance and why investors have backed open-ended funds so strongly must be understood.
Open-ended fundsOpen-ended funds have been heavily promoted, both by their fund managers and by their financial advisers, over many years. The low set-up cost, ease of establishment and ability to grow funds under management quickly made open-ended funds very attractive to managers. Apparent liquidity and commission payments made the funds appealing to financial advisers. Accordingly, many retail investors were advised to invest in open-ended property funds over the years. By contrast, no commission was available from closed-ended funds.
The Retail Distribution Review banned commissions in January 2016, which should have removed the distortion they imposed on retail investor advice and behaviour. However, there is significant inertia in investor behaviour, combined with a poor understanding of the relative merits of closed-ended fund returns, particularly in respect of liquidity.
The inertia has in part been a result of investment platforms being slow to adapt to shifting market demand. Until recently, it was difficult for financial advisers, who manage their clients’ portfolios using investment platforms, to access closed-ended funds
through the platforms. This is changing, and most of the leading platforms now allow access to both open- and closed-ended funds.
Liquidity is often vaunted as the great strength of the open-ended structure. However, investors who are too fixated on liquidity may find that the income return they must forego to achieve liquidity has a great impact upon long-term total return. The open-ended structure was laid bare in 2009, and again in July and August 2016, when the majority of open-ended funds suspended trading due to over £1.25 billion of redemptions, sparked by fears surrounding the EU referendum. The promise of liquidity vanished, just when investors wanted it most.
In order to meet liquidity requirements, an open-ended fund will typically hold up to 20 per cent of its assets in cash and up to a further 20 per cent in property securities in order to maintain daily liquidity for investors, but this reduces earnings in the fund, which feeds through to the lower income return. Daily liquidity means these funds are permanently open for investment and redemption, which can lead
to significant flows of money in and out, forcing fund managers to buy or sell assets regardless of property market conditions.
The cost to performance of the open-ended structure is therefore twofold: • Daily liquidity leads to the fund not being
fully invested in real estate and the need to hold cash. Typically, open-ended funds are ungeared, so only 75 to 80 per cent of the fund is invested in direct real estate. Combined with higher management fees, this dilutes returns to an average income return of between 2.75 and 3 per cent per annum. By contrast, average income returns in closed-ended property funds are around 5 per cent, and with average gearing the fund’s equity might be 120 per cent invested in direct real estate.
• Capital flows lead to investor demand, both positive and negative, determining property strategy. This can lead to too much buying at the top of the market and too much selling at the bottom. This is clearly detrimental to long-term performance.
Closed-ended funds (investment companies)Closed-ended funds operate an investment trust structure – often with REIT tax status and external management. There was considerable interest in these structures during 2017, with over £1.2 billion raised for property strategies. Interestingly, two of the largest property fund management groups responsible for some of the longest-running open-ended property funds in the market, Aviva and Aberdeen Standard, both announced an initial public offering (IPO) for closed-ended funds. Could this be a sign of a change in sentiment?
Daily liquidity in closed-ended funds is managed through the share price, rather than being managed by the fund manager. The unit of liquidity is not a unit of net value (as in open-ended funds) but in Main Market listed shares, possibly the most liquid market in the developed world.
Fund managers do not need to hold cash or property securities to deal with redemptions, and 100 per cent of equity (more with gearing) can be invested in direct real estate. This enables closed-
Chart 5: Investment company dividend yield (Nov 2017)
‘Rental growth is the backbone
of sustainable capital growth
in commercial property’
Div
iden
d y
ield
%
9
8
7
6
5
4
3
2
1
0
Pict
on Pro
perty
Inco
me
Schro
der R
eal E
state
LondonM
etric
Pro
perty
F&C C
omm
ercia
l Pro
perty
UK Com
mer
cial P
roper
ty
Trita
x Big
Box R
EIT
War
ehouse
REI
T
F&C U
K Rea
l Esta
te
Edist
on Pro
perty
Pacif
ic In
dustria
l & Lo
gistics
REI
T
Stan
dard Li
fe In
v Pro
perty
Inc
Custodia
n REI
T
Drum
Inco
me
Plus R
EIT
Regio
nal R
EIT
AEW U
K REI
T

www.WhatInvestment.co.uk 25
ended funds to pay dividends on average of 5 per cent, based on recent market pricing.
Investment companies differ also from the old listed property companies, now trading as REITs, which are internally managed, are often engaged in development and typically have significantly lower target dividends, with greater emphasis on capital growth. These property companies – such as British Land, Land Securities and Great Portland Estates – tend to demonstrate a high correlation with equity markets and can prove to be much more volatile than the underlying property markets in which they are invested.
In my opinion, if you are looking for an investment in real estate with a high income return, long-term performance and daily liquidity, there is only one choice.
Property investment companies may demonstrate some short-term volatility in share prices, but over the long term they have proved to have a close correlation with property market performance. While the property investment companies reacted to market volatility following the
EU referendum, none of the property investment companies in the UK closed to trading in the weeks that followed and, in aggregate, they were trading at share prices ahead of their pre-referendum levels by Q4, 2016 while still maintaining relatively high levels of dividend. However, as with any investment, timing is a crucial component of the investment decision.
Property investment company dividend yields range from 4 to 8 per cent in the main (see Chart 5) and, in a low-return environment, this feels sufficient risk premium. The risk premium should reflect the fact that property valuations can go up or down, that property may require capital expenditure to maintain value and that it carries a cost of management, unlike equities and fixed income. Dividends are in most cases fully covered from rental profits, suggesting a sustainability of income, with rents due from a wide range of tenants secured by long leases against large portfolios of properties, offering a diversified income base with low volatility.
UK property investment companies have average gearing levels of 25 to 30 per cent in the current market and, with the long-term low cost of debt, this is providing an enhanced return to investors. In a historical context, this level of gearing would be considered very conservative but a cautious gearing policy is strongly aligned with investor sentiment.
Which property strategy?Accepting that property should be a long-term investment and that the closed-ended property fund structure delivers the strongest returns, the next question is which fund?
Most property investment companies have a regional property strategy, which plays strongly to current market dynamics. Most are generalists that advocate a core/core plus (i.e. low- to lower-risk property asset) diversified property strategy. Funds such as Custodian REIT, F&C Property Trust, Picton Property Income and Standard Life Property Investment Trust combine a well-diversified portfolio with a high level of income return and modest gearing.
There are also generalists that favour a value-add strategy, combining higher-risk property assets with higher gearing to drive out high target dividends, including Regional REIT and AEW UK REIT.
Then there are the specialists that target a particular sector of the market, such as Tritax Big Box REIT, which is asking investors to back a narrow, but thus far successful, property strategy.
Diversification along with low gearing and a high income, secured against a low-risk property strategy, is nirvana. The closer an investment can be to this model, the more likely it is to deliver the sort of returns demanded by retail investors over the long term. When combined with transparency, a regulatory framework and the good governance offered by closed-ended funds, property can – and should – be an important component of a retail investor’s balanced portfolio for pensions, ISAs and general wealth management. u
Richard Shepherd-Cross is managing director of Custodian Capital, fund manager to the UK property investment company Custodian REIT Plc. During the past three and a half years he has acquired over £400 million of commercial property across UK regional markets to build Custodian REIT to a market cap of around £425 million. Custodian Capital is the property fund management arm of Mattioli Woods Plc, a wealth management and employee benefits specialist with assets under management, administration and advice nearing £8 billion.
‘Investors still need to be
discerning when investing and
not simply “buy” a sector’

26 www.WhatInvestment.co.uk
New Offers
Funds in focus
Our independent panel examines the latest funds and what they have to offer investors. Each product has been given a star rating representing its overall value for money based on cost, terms and conditions and investment potential
Product of the Month – February 2018
Maven VCTs top-up offer
Maven Income & Growth VCT 3 and its sister trust Maven Income & Growth VCT 4 are seeking £30 million of top-up funding between them.
Jason Hollands says:2017/18 is on track to be a record year for new venture capital trust (VCT) fundraising as investors – whose opportunities to pour more cash into their pensions have been limited by successive cuts to the lifetime allowance
and the tapered annual pension allowance – look for alternative, HMRC-approved tax-efficient investment schemes.
VCTs are stock exchange-listed investment companies that invest in fledgling, unquoted or AIM-traded UK growth companies, and investment in VCT new share issues offer investors a heady cocktail of a 30 per cent income tax credit and tax-free dividends and gains subject to a maximum investment of £200,000 in a tax year.
Traditionally, many investors wait until the final weeks of the tax year before choosing which VCTs to invest in, but this
year such an approach could leave them with a very limited choice as several offers closed ahead of the November 2017 Budget and the most popular of those remaining are filling up fast.
In an environment where VCTs have raised an abundance of cash but are required to invest it in companies that meet a very precise set of criteria around their size, age and how the financing will be used, the ability to secure the best deals is going to be more competitive than ever. With that in mind, the new joint top-up offer from Maven Income & Growth VCT 3 and Maven Income & Growth VCT 4, seeking £30 million between them, looks particularly well positioned.
Both VCTs are well established, with very similar existing portfolios of unquoted companies that are skewed to more mature, profitable companies that were backed in the past when the VCT investment rules were more flexible than they are today. New investments, however, are being made into younger, growth companies that are typically technologically innovative and providing market-disruptive products or services.
The manager of the VCTs, Maven Capital Partners, is a leading independent venture capital group, which was created from a management buyout of Aberdeen Asset Management’s private equity business.
Maven has an extensive regional presence across the UK, with 11 offices, which is a major advantage when it comes to hunting out new deals compared with competitors.
Additionally, Maven manages assets for a number of UK regional development funds, which should lead to opportunities for the VCTs as a result of the extended network of advisers and entrepreneurs this brings.
While VCTs are high-risk investments,
and are not suitable for everyone, within this context Maven takes a conservative approach, spending many months on due diligence on a business and its management team before investing, and then usually placing directors on its board once an investment is made, to monitor its progress and help steer it to an eventual exit.
Schroder Dynamic Planner Portfolios
This new fund from Schroders could be of benefit to those investors seeking to control the risk in their portfolio.
Patrick Connolly says:Schroders is one of a number of companies to launch risk-targeted funds. These are managed with the intention of staying within specific volatility parameters depending on the risk profile of the portfolio.
These types of funds are used by an increasing number of financial advisers to manage their clients’ investments. This works well for adviser firms that don’t have specific investment expertise or capabilities, and so allow advisers to focus their efforts on financial planning, which should be the area where they add most value. However, the funds can also be used for investors who are simply looking for a
Fund manager: Maven Capital PartnersAnnual management fee: 2.5 per cent Contact: www.mavencp.com
n Jason Hollands is MD, business development & communications at online investment service Bestinvest
n Patrick Connolly is head of communications at financial adviser Chase de Vere
Fund manager: Multi-manager teamAnnual management fee: 0.99 per cent Contact: www.schroders.com
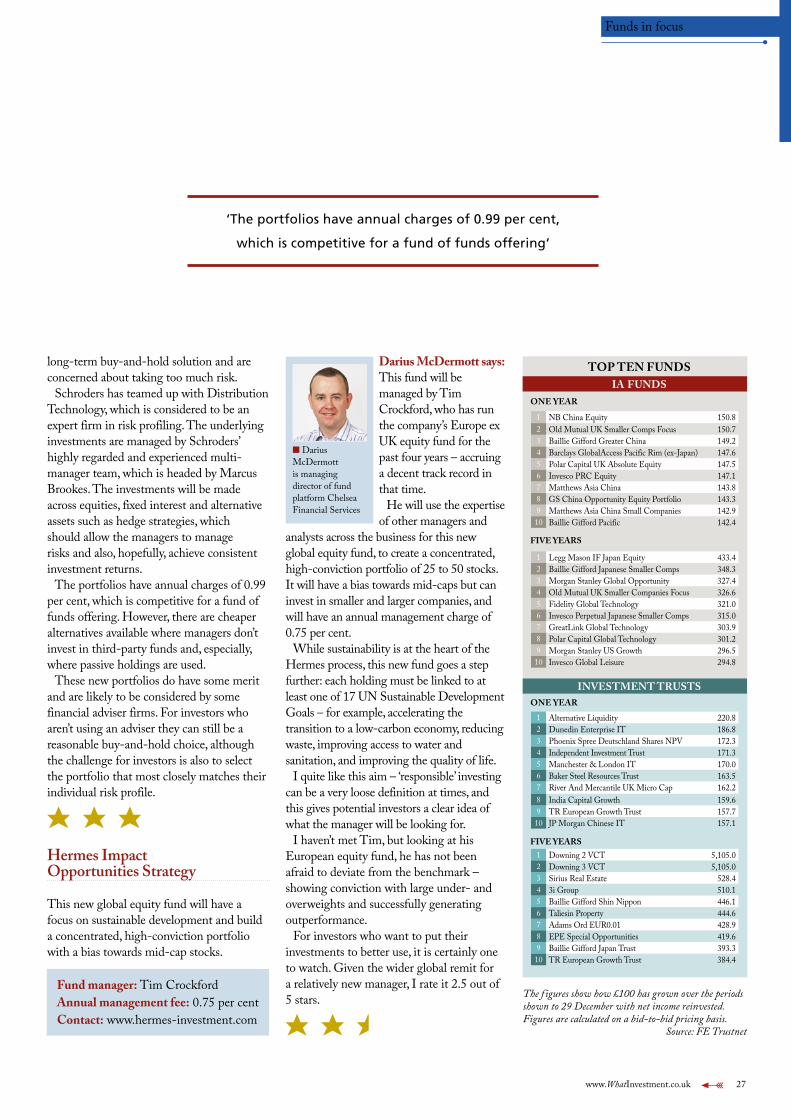
www.WhatInvestment.co.uk 27
Funds in focus
1 NB China Equity 150.82 Old Mutual UK Smaller Comps Focus 150.73 Baillie Gifford Greater China 149.24 Barclays GlobalAccess Pacific Rim (ex-Japan) 147.65 Polar Capital UK Absolute Equity 147.56 Invesco PRC Equity 147.17 Matthews Asia China 143.88 GS China Opportunity Equity Portfolio 143.39 Matthews Asia China Small Companies 142.910 Baillie Gifford Pacific 142.4
1 Alternative Liquidity 220.82 Dunedin Enterprise IT 186.83 Phoenix Spree Deutschland Shares NPV 172.34 Independent Investment Trust 171.35 Manchester & London IT 170.06 Baker Steel Resources Trust 163.57 River And Mercantile UK Micro Cap 162.28 India Capital Growth 159.69 TR European Growth Trust 157.710 JP Morgan Chinese IT 157.1
1 Downing 2 VCT 5,105.02 Downing 3 VCT 5,105.03 Sirius Real Estate 528.44 3i Group 510.15 Baillie Gifford Shin Nippon 446.16 Taliesin Property 444.67 Adams Ord EUR0.01 428.98 EPE Special Opportunities 419.69 Baillie Gifford Japan Trust 393.310 TR European Growth Trust 384.4
1 Legg Mason IF Japan Equity 433.42 Baillie Gifford Japanese Smaller Comps 348.33 Morgan Stanley Global Opportunity 327.44 Old Mutual UK Smaller Companies Focus 326.65 Fidelity Global Technology 321.06 Invesco Perpetual Japanese Smaller Comps 315.07 GreatLink Global Technology 303.98 Polar Capital Global Technology 301.29 Morgan Stanley US Growth 296.510 Invesco Global Leisure 294.8
FIVE YEARS
FIVE YEARS
ONE YEAR
ONE YEAR
IA FUNDS
INVESTMENT TRUSTS
TOP TEN FUNDS
The f igures show how £100 has grown over the periods shown to 29 December with net income reinvested. Figures are calculated on a bid-to-bid pricing basis.
Source: FE Trustnet
long-term buy-and-hold solution and are concerned about taking too much risk.
Schroders has teamed up with Distribution Technology, which is considered to be an expert firm in risk profiling. The underlying investments are managed by Schroders’ highly regarded and experienced multi-manager team, which is headed by Marcus Brookes. The investments will be made across equities, fixed interest and alternative assets such as hedge strategies, which should allow the managers to manage risks and also, hopefully, achieve consistent investment returns.
The portfolios have annual charges of 0.99 per cent, which is competitive for a fund of funds offering. However, there are cheaper alternatives available where managers don’t invest in third-party funds and, especially, where passive holdings are used.
These new portfolios do have some merit and are likely to be considered by some financial adviser firms. For investors who aren’t using an adviser they can still be a reasonable buy-and-hold choice, although the challenge for investors is also to select the portfolio that most closely matches their individual risk profile.
Hermes Impact Opportunities Strategy
This new global equity fund will have a focus on sustainable development and build a concentrated, high-conviction portfolio with a bias towards mid-cap stocks.
Darius McDermott says:This fund will be managed by Tim Crockford, who has run the company’s Europe ex UK equity fund for the past four years – accruing a decent track record in that time.
He will use the expertise of other managers and
analysts across the business for this new global equity fund, to create a concentrated, high-conviction portfolio of 25 to 50 stocks. It will have a bias towards mid-caps but can invest in smaller and larger companies, and will have an annual management charge of 0.75 per cent.
While sustainability is at the heart of the Hermes process, this new fund goes a step further: each holding must be linked to at least one of 17 UN Sustainable Development Goals – for example, accelerating the transition to a low-carbon economy, reducing waste, improving access to water and sanitation, and improving the quality of life.
I quite like this aim – ‘responsible’ investing can be a very loose definition at times, and this gives potential investors a clear idea of what the manager will be looking for.
I haven’t met Tim, but looking at his European equity fund, he has not been afraid to deviate from the benchmark –showing conviction with large under- and overweights and successfully generating outperformance.
For investors who want to put their investments to better use, it is certainly one to watch. Given the wider global remit for a relatively new manager, I rate it 2.5 out of 5 stars.
n Darius McDermott is managing director of fund platform Chelsea Financial Services
Fund manager: Tim CrockfordAnnual management fee: 0.75 per cent Contact: www.hermes-investment.com
‘The portfolios have annual charges of 0.99 per cent,
which is competitive for a fund of funds offering‘

28 www.WhatInvestment.co.uk
Country profile
South Korea… and its wayward cousin
As macro events continue to significantly impact the world of investment, Ingrid Smith examines the economic prospects for two of the main players
In the midst of North Korea’s posturing and South Korea’s painstaking steps to both avoid nuclear disaster and achieve
some sort of stability between estranged cousins, a sense of mutual mistrust pervades the ever-present, tragic human story of decades of separation for individuals, on either side of a border constructed on a foundation of confusion, western duplicity and megalomaniacal idiocy.
But, it would seem, something as disparate as the possibility of a joint sporting activity – the Pyeongchang Winter Olympics, to be held in February 2018 – may be the stage where a détente can at least begin. So, it behoves What Investment to turn its eye to the economic prospects for both states – just to round the perpetual circle.
Moving on upSignificantly, South Korea’s economy seems to be experiencing an upward trend, having seen the greatest acceleration in its growth for seven years during the third quarter of 2017. According to analysts, the impetus for this is global demand for its electronics, which has succeeded in mitigating the effects of regional concerns.
Gross domestic product reportedly rose 1.4 per cent in the third quarter from the previous quarter, with preliminary numbers from the Bank of Korea showing the country’s economy outperforming the 0.8 per cent forecast quoted by Reuters.
The increase signifies the biggest hike since a 1.7 per cent spike in Q2, 2010; year-on-year growth grew to 3.6 per cent in the third quarter from 2.7 per cent in Q2, also beating forecasts.
South Korea is Asia’s fourth-largest
economy, and the current global increase in demand for memory chips has proven to soften the negative impact on tourism and retail trade. Although it remains undeniable that wider concerns regarding North Korea’s military provocations continue to hurt business sentiment.
The figures have led to revised analyst forecasts regarding a central bank rate hike – some are predicting that a 25 basis point hike will be confirmed during the bank’s next policy meeting, scheduled for 30 November 2018.
Growth is now on track to hit the central

www.WhatInvestment.co.uk 29
Country profile
bank’s official forecast of a 3 per cent expansion, according to analysts.
However, the central bank has introduced a slither of caution, stating that the dispute with China over Seoul’s deployment of a US anti-missile system could potentially knock 0.4 percentage points off the nation’s economic growth for 2017. An unofficial Chinese boycott of South Korean consumer products and falling tourism has already hurt some segments of Korea’s economy, despite shipments of other products such as memory chips remaining very strong.
Exports grew 6.1 per cent in the third quarter, after declining 2.9 per cent a quarter earlier, while private consumption growth slowed to 0.7 per cent in the July-September period, from 1 per cent.
Indeed, exports, which account for about 40 per cent of GDP, notched up a ninth consecutive month of double-digit growth in September, in value terms – the longest stretch of such expansion since 2001.
Analysts surmise that it has been semiconductors which have mainly boosted production from the manufacturing sector, but that the third quarter also saw some extra boost from overseas sales of cars and petrochemical products. However, exports of services, which include tourism, contracted 7.4 per cent year-on-year, after
shrinking 13.6 per cent three months earlier. This drop reflects a halving in the number of Chinese tourists in the year to September, which has noticeably hurt retailers and hotels in South Korea.
Meanwhile, the finance ministry has said it sees economic recovery momentum being sustained in the first half of the year, partly thanks to the aforementioned Winter Olympics, as well as anticipating an easing of global trade tensions, before slowing in the second half as investment in semiconductor-related facilities falls off.
Analysts concede there is a limit to achieving sustainable growth, given it was concentrated in certain areas throughout 2017, and quality of life remains low due to a lack of wealth distribution and continued poor levels of employment.
The ministry has also stated that consumer prices are likely to rise only 1.7 per cent in 2018, down from 2017’s 1.9 per cent increase. This would be below the 2 per cent target set by the Bank of Korea, which in November voted to raise its benchmark interest rate for the first time since 2011, from 1.25 per cent to 1.5 per cent.
Crossing the thresholdSouth Koreans’ annual per capita income will reach $32,000 by the end of 2018 – if its currency continues to trade at around the level of 1,083 won against the US dollar, the ministry said. This would put the country above the $30,000 threshold, taking it into the realms of a developed economy.
The current-account surplus is expected to narrow to $79 billion in 2018 from $81 billion in 2017, as commodity prices such as oil increase, along with domestic consumption.
Turning to North Korea, international sanctions are reported, inevitably, to be biting. However, to what degree is any professional analyst’s guess.
Textiles, coal and seafood form the bulk of North Korea’s export catalogue, therefore contributing the greatest to GDP. But, at this time, it’s impossible to gauge how exports have been impacted, with no assessed growth rate estimates having been produced so far for 2017.
Some market watchers speculate that export rates may have decreased by as much as 30 per cent during 2016; in particular, exports to China – North Korea’s biggest trading partner – are viewed by some to be down by as much as 35 per cent.
Despite the success of a series of missile tests, it emerges that North Korean supreme leader Kim Jong-un is coming to realise that the divide-and-rule strategy, imposed on both his subjects and his cousins in the south, inevitably has to come to an end.
Even within political earshot of disapproving murmurs from the current US administration, one cannot help but hope there can be a thawing of hostilities between the northern and southern regions of this once unified country – even if that ironically begins to happen amidst the snow-covered landscapes of an Olympic Games. u
Fast facts: South Korea
Population: 51.4 million Capital: SeoulGDP: $1.5 trillion GDP per capita: $29,730 Median age: 41
Sources: Wikipedia / www.worldometers.info
Fast facts: North Korea
Population: 25.4 million Capital: PyongyangGDP: $25 billion GDP per capita: $1,000 Median age: 34
Sources: Wikipedia / www.worldometers.info
‘South Korean growth is now on track to hit the central
bank’s official forecast of a 3 per cent expansion‘
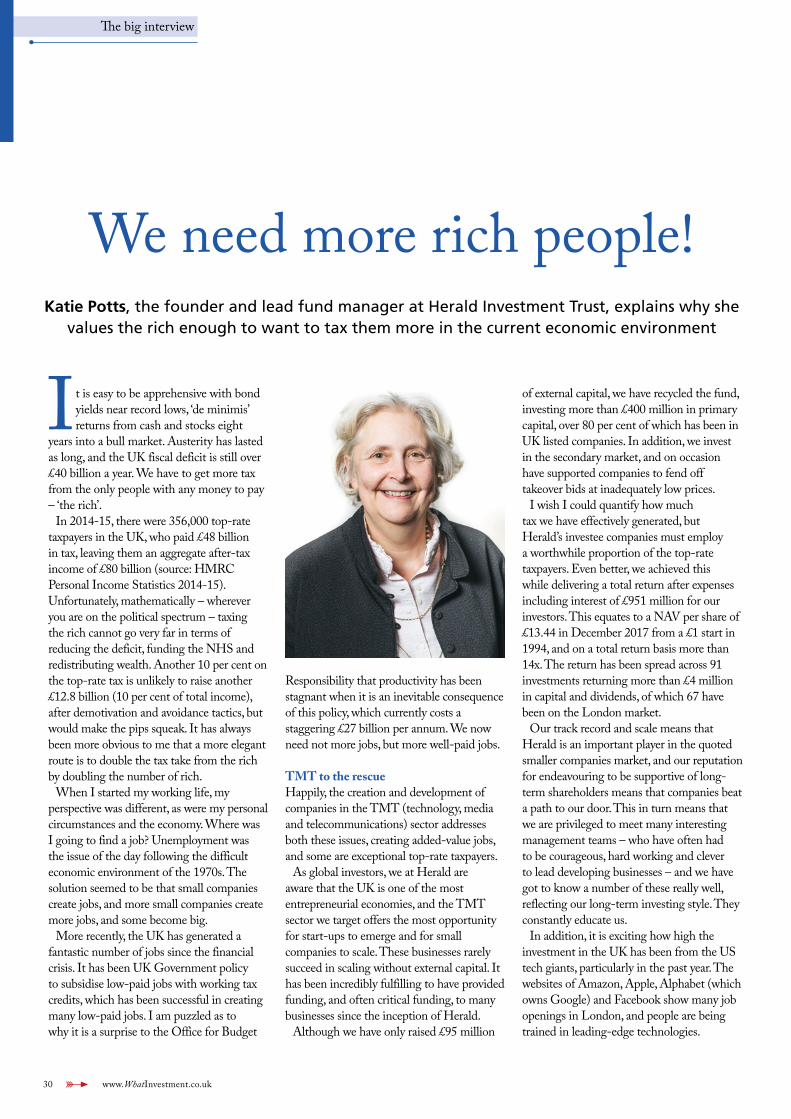
30 www.WhatInvestment.co.uk
The big interview
We need more rich people!Katie Potts, the founder and lead fund manager at Herald Investment Trust, explains why she
values the rich enough to want to tax them more in the current economic environment
It is easy to be apprehensive with bond yields near record lows, ‘de minimis’ returns from cash and stocks eight
years into a bull market. Austerity has lasted as long, and the UK fiscal deficit is still over £40 billion a year. We have to get more tax from the only people with any money to pay – ‘the rich’.
In 2014-15, there were 356,000 top-rate taxpayers in the UK, who paid £48 billion in tax, leaving them an aggregate after-tax income of £80 billion (source: HMRC Personal Income Statistics 2014-15). Unfortunately, mathematically – wherever you are on the political spectrum – taxing the rich cannot go very far in terms of reducing the deficit, funding the NHS and redistributing wealth. Another 10 per cent on the top-rate tax is unlikely to raise another £12.8 billion (10 per cent of total income), after demotivation and avoidance tactics, but would make the pips squeak. It has always been more obvious to me that a more elegant route is to double the tax take from the rich by doubling the number of rich.
When I started my working life, my perspective was different, as were my personal circumstances and the economy. Where was I going to find a job? Unemployment was the issue of the day following the difficult economic environment of the 1970s. The solution seemed to be that small companies create jobs, and more small companies create more jobs, and some become big.
More recently, the UK has generated a fantastic number of jobs since the financial crisis. It has been UK Government policy to subsidise low-paid jobs with working tax credits, which has been successful in creating many low-paid jobs. I am puzzled as to why it is a surprise to the Office for Budget
Responsibility that productivity has been stagnant when it is an inevitable consequence of this policy, which currently costs a staggering £27 billion per annum. We now need not more jobs, but more well-paid jobs.
TMT to the rescueHappily, the creation and development of companies in the TMT (technology, media and telecommunications) sector addresses both these issues, creating added-value jobs, and some are exceptional top-rate taxpayers.
As global investors, we at Herald are aware that the UK is one of the most entrepreneurial economies, and the TMT sector we target offers the most opportunity for start-ups to emerge and for small companies to scale. These businesses rarely succeed in scaling without external capital. It has been incredibly fulfilling to have provided funding, and often critical funding, to many businesses since the inception of Herald.
Although we have only raised £95 million
of external capital, we have recycled the fund, investing more than £400 million in primary capital, over 80 per cent of which has been in UK listed companies. In addition, we invest in the secondary market, and on occasion have supported companies to fend off takeover bids at inadequately low prices.
I wish I could quantify how much tax we have effectively generated, but Herald’s investee companies must employ a worthwhile proportion of the top-rate taxpayers. Even better, we achieved this while delivering a total return after expenses including interest of £951 million for our investors. This equates to a NAV per share of £13.44 in December 2017 from a £1 start in 1994, and on a total return basis more than 14x. The return has been spread across 91 investments returning more than £4 million in capital and dividends, of which 67 have been on the London market.
Our track record and scale means that Herald is an important player in the quoted smaller companies market, and our reputation for endeavouring to be supportive of long-term shareholders means that companies beat a path to our door. This in turn means that we are privileged to meet many interesting management teams – who have often had to be courageous, hard working and clever to lead developing businesses – and we have got to know a number of these really well, reflecting our long-term investing style. They constantly educate us.
In addition, it is exciting how high the investment in the UK has been from the US tech giants, particularly in the past year. The websites of Amazon, Apple, Alphabet (which owns Google) and Facebook show many job openings in London, and people are being trained in leading-edge technologies.

www.WhatInvestment.co.uk 31
The big interview
‘A more elegant route is to double the tax take
from the rich by doubling the number of rich‘
In the beginning…Prior to establishing Herald, I worked at Barings on the fund management side, and then Warburgs on the sell side as a UK technology analyst. Larger companies such as Plessey, Ferranti, STC and Racal had disappeared, but a new breed of companies had emerged such as IT services businesses. Only GEC and the telcos were left as large companies.
It was evident that better returns would be made in smaller companies, but I was aware that my investing clients found it difficult to invest in small illiquid investments with a high stock-specific risk. I thought that if I raised a collective vehicle then I could offer these institutional investors a way of investing in this class – reducing the risk through diversity and improving the liquidity through having a larger share register in the collective fund.
An investment trust was the ideal vehicle to be able to invest in companies with poor liquidity, and Herald Investment Trust Plc was launched in 1994. The issue was oversubscribed, and we scaled people back from £95 million to £65 million in order to invest in small quoted TMT stocks in the UK and Europe.
I quickly realised that you could not aspire to be expert in the sector with a UK/Europe focus, and in 1996 raised a further £30 million and globalised the fund. No further money has been raised since (£95 million has been spent repurchasing shares), and the collection of UK-listed companies remains the most important element of the portfolio, with a weighting of nearly 60 per cent.
I further realised that you had to follow the larger TMT companies, because so many smaller companies formed part of the
supply chain, or had opportunities spawned by developments in the large companies, so we started a Dublin-based OEIC, Herald Worldwide Technology Fund, in 1998 to invest in the sector globally across the market cap spectrum. This inevitably has a US dominance with around 70 per cent in North America and 10 per cent in Asia/EMEA/UK.
This fund has outperformed the investment trust noticeably in the past two years, reflecting both the weakness of Sterling with greater overseas exposure and the spectacular run of Apple, Amazon, Alphabet, Microsoft and a number of smaller holdings. Nevertheless, over the long run the UK performance of Herald Investment Trust has exceeded all the US technology indices, with a time-weighted return of 1,807 per cent versus Nasdaq’s total return of 1,076 per cent over the same period, and the FTSE 100 – the loser’s index – providing a total
return of just 416 per cent and a desultory 123 per cent in capital terms.
Where are we now?Herald Investment Trust continues to provide a lower-risk diversified exposure to a number of small TMT companies globally, which have limited liquidity and a high stock-specific risk but well-above-average growth potential. The median market capitalisation is around £190 million.
The AIM market in the UK continues to be vibrant, and opportunities abound. What has changed is that there is a minimal investment in smaller companies from pension funds and insurance companies. I remember at the beginning of my career in the early 1980s a trustee of a local authority pension fund saying, ‘Small companies create jobs. It is in the interest of our pensioners to have a strong economy, so we must allocate some of the pension fund to small companies.’
In 1996, a further £30 million was raised in order to globalise the Herald Investment Trust
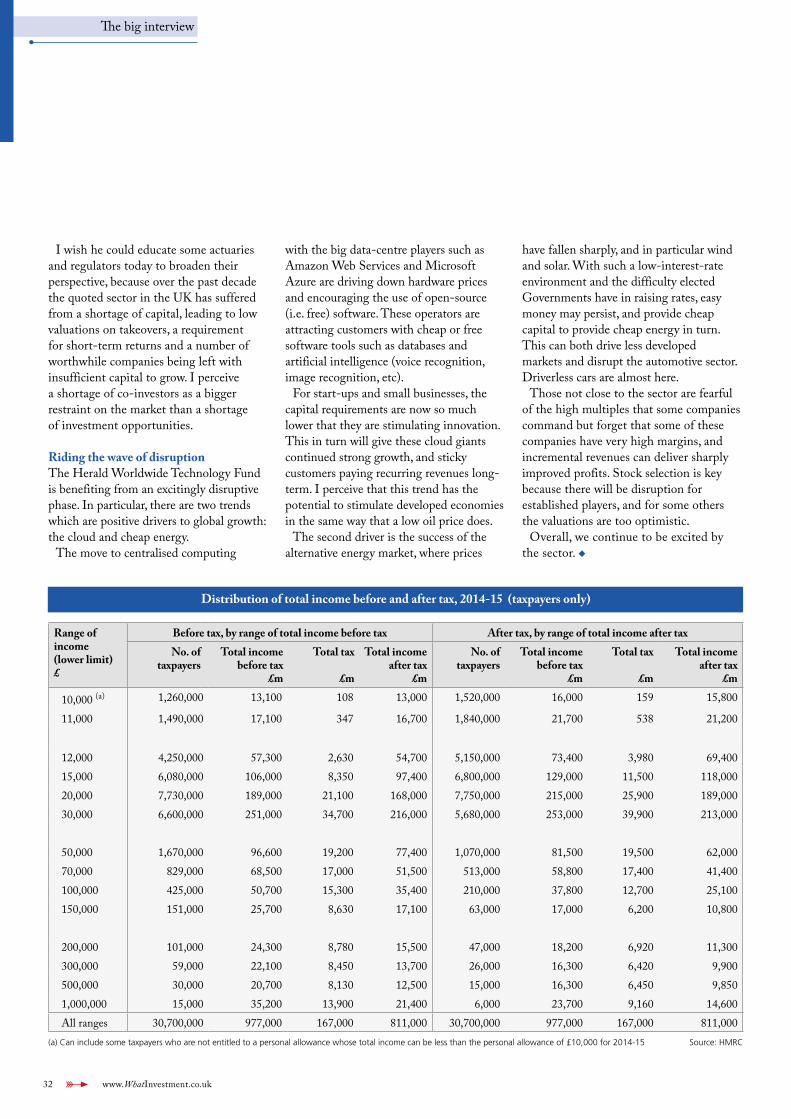
32 www.WhatInvestment.co.uk
The big interview
I wish he could educate some actuaries and regulators today to broaden their perspective, because over the past decade the quoted sector in the UK has suffered from a shortage of capital, leading to low valuations on takeovers, a requirement for short-term returns and a number of worthwhile companies being left with insufficient capital to grow. I perceive a shortage of co-investors as a bigger restraint on the market than a shortage of investment opportunities.
Riding the wave of disruptionThe Herald Worldwide Technology Fund is benefiting from an excitingly disruptive phase. In particular, there are two trends which are positive drivers to global growth: the cloud and cheap energy.
The move to centralised computing
with the big data-centre players such as Amazon Web Services and Microsoft Azure are driving down hardware prices and encouraging the use of open-source (i.e. free) software. These operators are attracting customers with cheap or free software tools such as databases and artificial intelligence (voice recognition, image recognition, etc).
For start-ups and small businesses, the capital requirements are now so much lower that they are stimulating innovation. This in turn will give these cloud giants continued strong growth, and sticky customers paying recurring revenues long-term. I perceive that this trend has the potential to stimulate developed economies in the same way that a low oil price does.
The second driver is the success of the alternative energy market, where prices
have fallen sharply, and in particular wind and solar. With such a low-interest-rate environment and the difficulty elected Governments have in raising rates, easy money may persist, and provide cheap capital to provide cheap energy in turn. This can both drive less developed markets and disrupt the automotive sector. Driverless cars are almost here.
Those not close to the sector are fearful of the high multiples that some companies command but forget that some of these companies have very high margins, and incremental revenues can deliver sharply improved profits. Stock selection is key because there will be disruption for established players, and for some others the valuations are too optimistic.
Overall, we continue to be excited by the sector. u
Distribution of total income before and after tax, 2014-15 (taxpayers only)
Range of income (lower limit) £
Before tax, by range of total income before tax After tax, by range of total income after taxNo. of
taxpayersTotal income
before tax£m
Total tax
£m
Total income after tax
£m
No. of taxpayers
Total income before tax
£m
Total tax
£m
Total income after tax
£m
10,000 (a) 1,260,000 13,100 108 13,000 1,520,000 16,000 159 15,800
11,000 1,490,000 17,100 347 16,700 1,840,000 21,700 538 21,200
12,000 4,250,000 57,300 2,630 54,700 5,150,000 73,400 3,980 69,40015,000 6,080,000 106,000 8,350 97,400 6,800,000 129,000 11,500 118,00020,000 7,730,000 189,000 21,100 168,000 7,750,000 215,000 25,900 189,00030,000 6,600,000 251,000 34,700 216,000 5,680,000 253,000 39,900 213,000
50,000 1,670,000 96,600 19,200 77,400 1,070,000 81,500 19,500 62,00070,000 829,000 68,500 17,000 51,500 513,000 58,800 17,400 41,400100,000 425,000 50,700 15,300 35,400 210,000 37,800 12,700 25,100150,000 151,000 25,700 8,630 17,100 63,000 17,000 6,200 10,800
200,000 101,000 24,300 8,780 15,500 47,000 18,200 6,920 11,300300,000 59,000 22,100 8,450 13,700 26,000 16,300 6,420 9,900500,000 30,000 20,700 8,130 12,500 15,000 16,300 6,450 9,8501,000,000 15,000 35,200 13,900 21,400 6,000 23,700 9,160 14,600All ranges 30,700,000 977,000 167,000 811,000 30,700,000 977,000 167,000 811,000
(a) Can include some taxpayers who are not entitled to a personal allowance whose total income can be less than the personal allowance of £10,000 for 2014-15 Source: HMRC
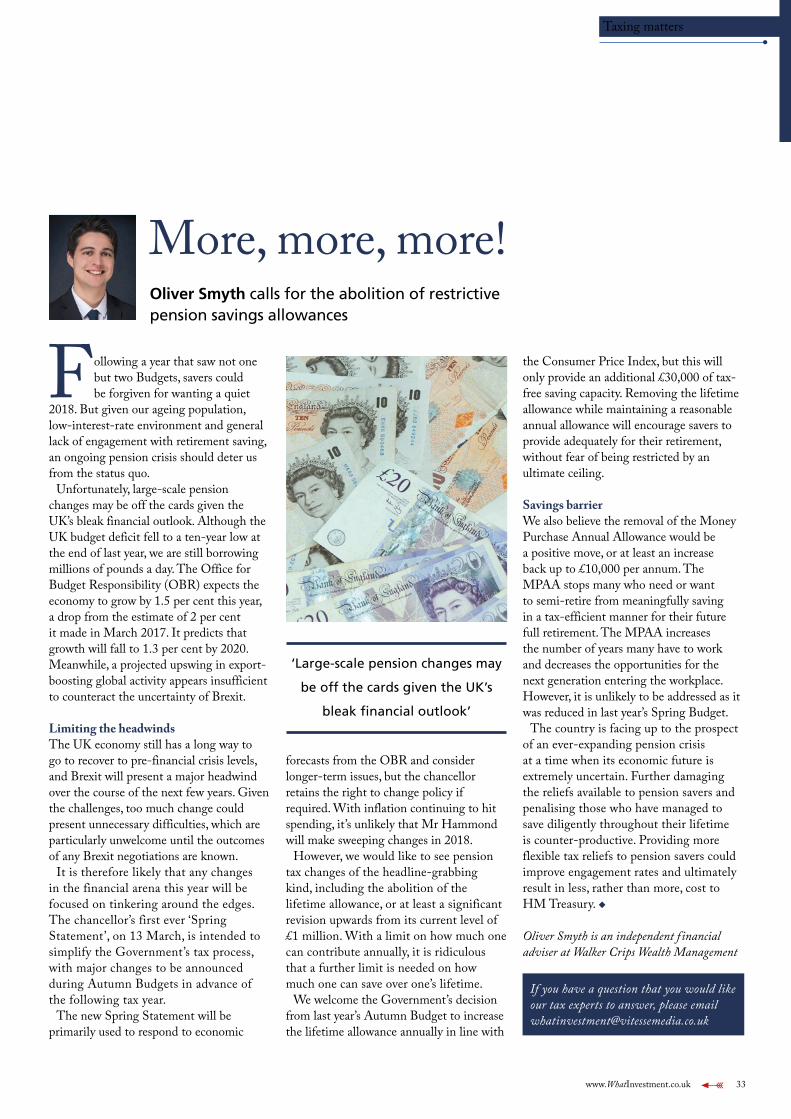
www.WhatInvestment.co.uk 33
Taxing matters
Following a year that saw not one but two Budgets, savers could be forgiven for wanting a quiet
2018. But given our ageing population, low-interest-rate environment and general lack of engagement with retirement saving, an ongoing pension crisis should deter us from the status quo.
Unfortunately, large-scale pension changes may be off the cards given the UK’s bleak financial outlook. Although the UK budget deficit fell to a ten-year low at the end of last year, we are still borrowing millions of pounds a day. The Office for Budget Responsibility (OBR) expects the economy to grow by 1.5 per cent this year, a drop from the estimate of 2 per cent it made in March 2017. It predicts that growth will fall to 1.3 per cent by 2020. Meanwhile, a projected upswing in export-boosting global activity appears insufficient to counteract the uncertainty of Brexit.
Limiting the headwindsThe UK economy still has a long way to go to recover to pre-financial crisis levels, and Brexit will present a major headwind over the course of the next few years. Given the challenges, too much change could present unnecessary difficulties, which are particularly unwelcome until the outcomes of any Brexit negotiations are known.
It is therefore likely that any changes in the financial arena this year will be focused on tinkering around the edges. The chancellor’s first ever ‘Spring Statement’, on 13 March, is intended to simplify the Government’s tax process, with major changes to be announced during Autumn Budgets in advance of the following tax year.
The new Spring Statement will be primarily used to respond to economic
forecasts from the OBR and consider longer-term issues, but the chancellor retains the right to change policy if required. With inflation continuing to hit spending, it’s unlikely that Mr Hammond will make sweeping changes in 2018.
However, we would like to see pension tax changes of the headline-grabbing kind, including the abolition of the lifetime allowance, or at least a significant revision upwards from its current level of £1 million. With a limit on how much one can contribute annually, it is ridiculous that a further limit is needed on how much one can save over one’s lifetime.
We welcome the Government’s decision from last year’s Autumn Budget to increase the lifetime allowance annually in line with
the Consumer Price Index, but this will only provide an additional £30,000 of tax-free saving capacity. Removing the lifetime allowance while maintaining a reasonable annual allowance will encourage savers to provide adequately for their retirement, without fear of being restricted by an ultimate ceiling.
Savings barrierWe also believe the removal of the Money Purchase Annual Allowance would be a positive move, or at least an increase back up to £10,000 per annum. The MPAA stops many who need or want to semi-retire from meaningfully saving in a tax-efficient manner for their future full retirement. The MPAA increases the number of years many have to work and decreases the opportunities for the next generation entering the workplace. However, it is unlikely to be addressed as it was reduced in last year’s Spring Budget.
The country is facing up to the prospect of an ever-expanding pension crisis at a time when its economic future is extremely uncertain. Further damaging the reliefs available to pension savers and penalising those who have managed to save diligently throughout their lifetime is counter-productive. Providing more flexible tax reliefs to pension savers could improve engagement rates and ultimately result in less, rather than more, cost to HM Treasury. u
Oliver Smyth is an independent f inancial adviser at Walker Crips Wealth Management
If you have a question that you would like our tax experts to answer, please email [email protected]
More, more, more!Oliver Smyth calls for the abolition of restrictive pension savings allowances
‘Large-scale pension changes may
be off the cards given the UK’s
bleak financial outlook’

34 www.WhatInvestment.co.uk
www.WhatInvestment.co.uk 35
Spotting the multi-bagger tech start-ups
Alexander Selegenev and Igor Shoifot from TMT Investments provide guidance for What Investment readers on the art of choosing those elusive stocks
that will make returns of several times their cost
Many private investors we talk to regret missing the chance to invest in Facebook or
Apple before they became behemoths. Just a couple of thousand pounds invested at the time and they would be millionaires by now, they muse.
The hard truth, however, is that the vast majority of private investors are highly unlikely to be in the right place at the right time to catch these once-in-a-lifetime opportunities. This can be for many reasons, but often it is for practical reasons (they didn’t know about them or were not within the circle of the company’s founders) or skill sets (they lacked the specialist insight to be able to spot a winner well in advance of the herd).
The reality is that picking multi-bagger start-ups is nearly always accomplished by people ‘in the know’. These are typically the company’s closest circle of contacts and their investor networks. With direct insight into the company’s performance and its founders’ skill sets, they have a natural advantage over the average person in the street.
With hundreds of new start-ups launched globally every day, researching and selecting winners is a considerable challenge for a well-resourced venture capital fund, let alone for the average private investor.
‘Unlisted tech companies offer the potential of outsized
returns, and it is only natural that private investors
should want to access them’
Lack of informationInvestors in public companies benefit from easy access to audited financial reports and have a company’s operational track record over a number of years at their fingertips. They can quickly run investment filters based on revenues, profit, debt levels and many other criteria.
In contrast, tech start-ups are unable to provide this type of information. Investors will find little of operational or financial value that is publicly available online on a start-up. Start-ups are well aware that their KPIs (key performance indicators) are what they live or die by, and guard these closely, especially in their early stages. They disclose them only to selected investors they trust and respect.
In order to make an investment decision, investors will therefore need to rely predominantly on ‘old school’ methods: meeting with the company face-to-face, asking their key questions directly and doing their own research.
The lack of easily comparable financial and operational performance information among start-ups is precisely what creates the optimal conditions for multi-bagger investments. Of course, spotting fantastic companies in the making before they mature and their valuations rocket is
very hard work. Many start-ups will never become established, highly cash-generative companies. But among the many start-ups there will be a few diamonds, available for investment at a tiny fraction of their ultimate value. An experienced investor who has met hundreds of companies and invested in a selection will be able to spot such winners much more easily than a novice investor.
There are three key criteria that investors should consider when investing in tech start-ups. These are what distinguish an intelligent investment decision from a speculative decision.
Five things to bear in mind when investing in unlisted companies
• Will you have the time to effectively assess and monitor your investment?
• Do you have first-hand experience of working in the sector in which the company invests?
• Will you be able to invest in successive rounds of funding in order to reduce the dilution of your investment?
• What investor relations or reporting mechanisms does the company have in place for small individual investors?
• Are you ready to wait for at least four to seven years before your investment may become exitable?

36 www.WhatInvestment.co.uk
• Know your sector inside out – As start-ups are often ‘disruptive’ businesses, an investor should have in-depth knowledge of the sector in which a company operates. Disruptive business models are largely digitally based and still largely untested on a mass scale, making it very hard for inexperienced investors to evaluate. The key question is: will the disruptive approach work in that particular sector?
• Identify the most relevant KPIs for the company – The most relevant KPIs for a company will vary depending on its stage of development, and also its business sector. For a B2C social media network, a strong KPI at an early stage will be user numbers and traffic, whereas at a later stage it will be engagement. For a SaaS (software-as-a-service) B2B company, relevant KPIs will include monthly churn and recurring revenue. For a subscription-based e-commerce business, the key indicators of progress will be CAC (customer acquisition cost) and LTV (life-time value). These should then be compared against other companies within the sector.
• Know the entrepreneurial and management skills that matter most in earlier-stage start-ups and put faith in the right founders – Even more
important than the quantitative (data-driven) parameters is the qualitative assessment. In a world where most products or services already exist at one stage of development or another, execution will be the marker of success. Managing a start-up is an emotional roller coaster, and it is absolutely critical to be able to assess a management team’s emotional intelligence and psychological preparedness, in parallel with their technical and commercial acumen.
Throw in due diligence costs and you are looking at many, many hours of work for just one investment. These are unlikely to be available to someone holding down a full-time day job, especially if they need to build a sufficiently diversified portfolio of approximately ten investments.
Solid track recordFor these and many other reasons, sector experience and a solid track record of investing in start-ups are of key importance.
A well-staffed venture capital fund will typically focus on a number of investment sectors. At TMT Investments, all of the investment team have worked with and invested in dozens of starts-up before founding TMT.
Some of our favoured sectors are SaaS, whereby customers pay a regular, usually monthly, fee to use software. This sector has provided some of our best investments: the valuation of our first investment in sales management software Pipedrive has increased over 40 times in five years. Online subscription services are another favourite sector: our first investment in New York-based retailer Scentbird has generated a return of over 18 times in just two and a half years.
Unlisted tech companies offer the potential of outsized returns, and it is only natural that private investors should want to access them. But they should consider how to go about it, and whether they are ready to do it themselves or instead benefit from the insight of experienced fund managers who do this as a full-time job.
Private investors are discouraged from investing all their savings into a small number of stocks and encouraged instead to build a diversified portfolio and/or to invest in professionally managed and diversified equity funds. Likewise, private investors should diversify their investments in start-ups and be well aware of the pitfalls and the technical challenges involved.
Thankfully, private investors wishing to invest in unlisted tech companies have a range of options to choose from. Some of these are available on their doorstep as listed investment companies or investment trusts that manage diversified portfolios of unlisted companies on the London Stock Exchange. These allow investors to buy or sell a portfolio of unlisted investments on a daily basis.
The potential returns of successful tech investing are mouth-watering, but not all that glitters is gold. Choose your investments wisely, and if you do invest directly, monitor your returns against those of start-up investment specialists. And as they say, if you can’t beat them, join them! u
Alexander Selegenev is executive director and Igor Shoifot is investment partner at AIM-traded TMT Investments Plc
www.WhatInvestment.co.uk 37
Star fund manager vs. investment team
Dan Brocklebank, head of Orbis Investments in the UK, provides an expert view on how to steer investors through selecting the
right type of management for their future financial health
On average, investors earn lower returns than the funds in which they invest. This, often
very large, gap occurs because investors unfortunately tend to buy high and sell low. They do this either by entering and exiting the stock market at the wrong points or because they switch between funds at the wrong times.
Finding talented managers that can deliver over long periods of time is a
recipe for success. So, just as you look at a manager’s track record for signs of skill, you should also incorporate an assessment of sustainability into your selection process. Finally, to benefit from that sustainability, you must avoid the temptation to sell at the wrong times.
How to assess manager sustainabilityHistory is one, imperfect, guide. A reasonable starting point is to ask whether
the manager, or their firm, has demonstrated success over multiple market cycles. Stock markets have been in a growth-driven bull market for eight years now. Anyone with a shorter track record than this has not been tested during a bear market.
Another indicator of sustainability is to consider how the portfolio is actually built. Is it driven by one mission-critical person or by a team of people? The importance of this is often overlooked.

38 www.WhatInvestment.co.uk
to investing, it’s not as simple as putting a few stars together around a table. The key benefit of investing globally is that it provides more opportunities to find cheap stocks. But capitalising on that breadth of opportunity can be difficult because identifying great investments requires specialisation.
After all, it takes time to understand and evaluate a business, and the best investors do so with a detailed insight into the key challenges facing the company and the industry in which it operates. Honing that deep knowledge allows them to evaluate how attractive a stock is compared with other opportunities available. For these reasons, we believe there is a limit to the number of effective investment decisions that one person can make without diluting the quality of those decisions.
‘A good succession plan can
work in theory, but nurturing
an heir is no easy task’
How portfolios are constructedThe most common approach is to run a ‘star system’. According to Morningstar data, 56 per cent of UK-domiciled funds have a single manager at the helm, and just 10 per cent have more than two portfolio managers. The star system has its benefits, but sustainability isn’t necessarily one of them.
Given that most investment firms are heavily incentivised to grow assets under management, star managers work extremely well from this perspective. Investors want to know their savings are in safe hands, and it’s easier to build trust when the manager is an individual with a glittering résumé and track record, particularly if they are photogenic!
Like sports stars, however, some star managers endure while others flame out suddenly. As in sports, it can be hard to predict when a winning streak will run dry – or sharply reverse course.
Star managers’ success also often acts against them. If a manager builds a strong track record, that success is likely to attract inflows from new clients, and the larger asset base will make the manager more profitable. This is a pleasant experience for the manager, but it provides an incentive for them to grow beyond the level that can be deployed effectively. This eventually limits the returns they can generate for clients.
Large inflows leave high-performing managers with two bad options. The first is to recommend more stocks, either by stretching their research efforts or lowering the bar for investment. The second is to keep the number of stocks steady but only invest in larger ones that can accommodate more capital. That handicaps the manager’s ability to move the portfolio to the areas of greatest opportunity, which can be costly. After all, market inefficiencies are rare and difficult to uncover, and the pockets of relative value can change dramatically over time.
Then there’s the issue of longevity. The average fund manager is approximately 45 years old. At that point they are halfway through their career, whereas an investor
in their twenties is only just starting to invest, with their retirement over 40 years out. That means that no star fund manager is going to be a ‘one-stop’ solution.
A good succession plan can work in theory, but nurturing an heir is no easy task. The star may appoint a successor, but that person can go untested because – by definition – a star system means there’s only one decision-maker directing client capital.
Using another sporting analogy, Luis Suarez’s 31 goals in 33 league games propelled Liverpool FC to within two points of clinching the Premier League title in 2014. He left for Barcelona the next season, but Liverpool appeared to be in good hands as its young English talent, Daniel Sturridge, had scored 21 goals in 29 games. Since Suarez’s departure, though, Sturridge has notched a mere 16 goals in 58 games. Liverpool finished sixth the next season and dropped to eighth the following. Reds fans learned the hard way how disruptive a star’s departure can be.
So, what’s the solution? When it comes

www.WhatInvestment.co.uk 39
The sustainability advantage from a well-structured teamGreat investing demands bold decisions, which are best made by individuals, not groups working by consensus. For a team approach to work well, it needs to allow individuals to think and act independently, but also for them ideally to enjoy an element of constructive challenge through a peer review process.
That argues strongly against building a large monolithic team. Firstly, smaller research teams with distinct areas of focus can provide an energising, innovative and dynamic environment. Veteran stockpickers are more accessible in smaller teams, so junior analysts can gain valuable exposure to them. To continue the sporting analogy, all players get match experience and are subject to constant evaluation to earn their spot. This keeps the starting team sharp, while the inherent organic development and renewal process builds sustainability. Secondly, by embedding the different teams in locations around the world, a broader range of perspectives can be gleaned which helps counter tendencies towards ‘groupthink’.
True multi-decade sustainability requires a means to refresh the starting line-up over time. It’s why at Orbis we spend a great deal of time and effort identifying and nurturing the stockpickers of tomorrow within all of the research teams so that they are ready to step up and run with the baton when the time comes. In short: we do this so that you don’t have to. We also have the advantage of being able to monitor the individuals much more closely from within the organisation than you could evaluate a manager from outside.
That just leaves the question of whether you, the investor, can stay the course.
Staying the courseThe good news is that remaining invested is entirely under your control. The bad news is that this is probably the hardest part to master! This is because the human brain is not wired to think in long time frames, and all funds go through periods of good and bad performance. Bad performance is painful to endure, and pain typically triggers our ‘flight’ response.
The problem for investors lies in the fact that, with investing, fleeing from short-term pain can be very expensive in the long run. Giving up on a manager at the bottom of a cycle means that investors typically miss out on the eventual performance rebound from that manager and usually suffer from buying something that is more comfortable but ultimately much more expensive to hold instead.
So, how can you combat this final challenge?Firstly, don’t make it harder than it needs to be. Investing is a long-term pursuit. If you check prices and performance too frequently, it is hard to assess a manager appropriately. For equity investments, a six-monthly check-up is probably appropriate, but make sure that you are measuring performance over long horizons, i.e. the past three to five years, and not on a quarterly basis.
Secondly, check that nothing has changed at the manager. When you buy a stock or invest in a fund, write down why you picked it. If those factors remain
the same then have confidence in your original decision.
A key factor to look for in your initial search, and to monitor later, is whether the manager’s interests are properly aligned with your own. If a manager has really aligned their interests with yours, you can rest assured that they are focused on what is best for long-term performance. You can check that the manager invests his or her own money in the fund. If the fund has underperformed and they have pulled their own money, why shouldn’t you?
You can also examine how they are paid. If fees are based on the size of the fund, you should be nervous. The manager may focus more on marketing than on investment performance. Your returns may be suffering because those promotional efforts were successful, and the growth in assets has affected the manager’s ability to outperform.
Lastly, sleep on any big decisions or take independent advice before you do anything drastic. The urge to ‘do something’ can be very powerful. The fewer decisions you take, the fewer you have to get right. u
Aberdeen’s Asian Investment Trusts ISA and Share PlanWhen you invest halfway around the world, it’s good to know someone is there aiming to locate what we believe to be the best investments for you.
We make a point of meeting every company in whose shares we might look to invest. From Thailand to Singapore, from China to Vietnam, we go wherever is required to get to know companies on-the-ground, face-to-face.
To steer your portfolio in the right direction, be with the fund manager who aims to discover more in Asia.
Please remember, the value of shares and the income from them can go down as well as up and you may get back less than the amount invested. Asian funds invest in emerging markets which may carry more risk than developed markets. No recommendation is made, positive or otherwise, regarding the ISA and Share Plan.
The value of tax benefits depends on individual circumstances and the favourable tax treatment for ISAs may not be maintained. We recommend you seek financial advice prior to making an investment decision.
Request a brochure: 0808 500 4000 invtrusts.co.uk/asia
We strive to discover more.
Aberdeen Standard Investments is a brand of the investment businesses of Aberdeen Asset Management and Standard Life Investments. Issued by Aberdeen Asset Managers Limited, 10 Queen’s Terrace, Aberdeen AB10 1YG, which is authorised and regulated by the Financial Conduct Authority in the UK. Telephone calls may be recorded. aberdeen-asset.co.uk
Please quote A WIS 04
121031219_IT_ADVERT_A_WIS_04.indd 1 09/01/2018 17:10
New KIDs on the blockNick Britton provides a few pointers to understanding the
new Key Information Documents for investment trusts
Allow me to introduce you to the
investment trust KID. That’s the Key Information Document, a short disclosure designed to allow
investors to compare different funds. It takes a standardised form, defined by European regulation, and must contain information about risks, performance and costs.
Now, by a quirk of fate, investment trusts have been required to produce KIDs from 1 January this year, but OEICs and unit trusts will not have to do so for another two years (they produce KIIDs – Key Investor Information Documents – which are very different). Given that the whole purpose of the KID is to allow comparisons between different funds on a common basis, you may feel that is a little perverse. I can’t help but agree.
Leaving that aside, the fact is that these KIDs now exist for investment trusts. You might stumble across them when you’re on Hargreaves Lansdown’s website, for example, or on the investment company’s own web pages. And you might well raise a quizzical eyebrow at some of the figures on them. Here are a few tips on interpreting the investment trust KID.
First, the risk indicator. This gives a
figure between 1 (lower risk) and 7 (higher risk). Having checked a random sample of investment trust KIDs, I have found that most come out as a 4. These risk ratings are based on a complicated mathematical process that uses historical returns. Like any such process, it has its limitations. For those used to other risk scales that tend to shuffle equity-based investments into the higher risk categories, an adjustment of mindset is required. A fund rated 4, or even 3, can carry the risk of significant loss.
Second, there are no figures for past performance on the KID, but an indication of
possible future performance in four different scenarios: favourable, moderate, unfavourable and stressed. Again, these figures must be calculated according to a set process, with no room for discretion. For many investment trusts, they seem unduly rosy: it’s not unknown for the ‘unfavourable’ scenario to be a positive number.
Ian Sayers, chief executive of the Association of Investment Companies (AIC),
commented, ‘I must be one of the few chief executives of a trade association who has been inundated with complaints from his members that a regulator is forcing them to overstate their performance and understate their risks!’ We suggest that investors pay particular attention to the ‘stressed’ scenario when reading a KID.
Third, there are the costs. We’re all used to looking at an ongoing charges figure (OCF), total expense ratio (TER) or the AIC ongoing charge for investment trusts, all of which are broadly comparable. Costs according to the KID are calculated differently: they include transaction costs, and so will be higher than the old OCFs and TERs. Bear this in mind when making cost comparisons between investment trusts and OEICs. The AIC’s website still carries the AIC ongoing charge, which can be used for making these like-for-like comparisons.
In the end, these documents may serve a useful purpose by offering standardised comparisons between different fund types (and other investments, such as structured products). Perhaps regulators will introduce further refinements in time, but for now we’ll just have to cope with KIDs as they are. u
Nick Britton is head of training at the Association of Investment Companies and a former editor of What Investment
Introduction
SPECIAL SECTION:
What Investment TrustFEBRUARY 2018
Supplement contentsNorthern exposureGlobal diversification offers many benefits to investors, and including Canadian equity income holdings can complement your global portfolio
Navigating difficult watersWhat Investment sounds out Fidelity International to discover where they see the best investment trust opportunities in five key regions
42 46
WHAT INVESTMENT TRUST – www.WhatInvestment.co.uk 41
‘Investors should pay particular
attention to the “stressed”
scenario when reading a KID’
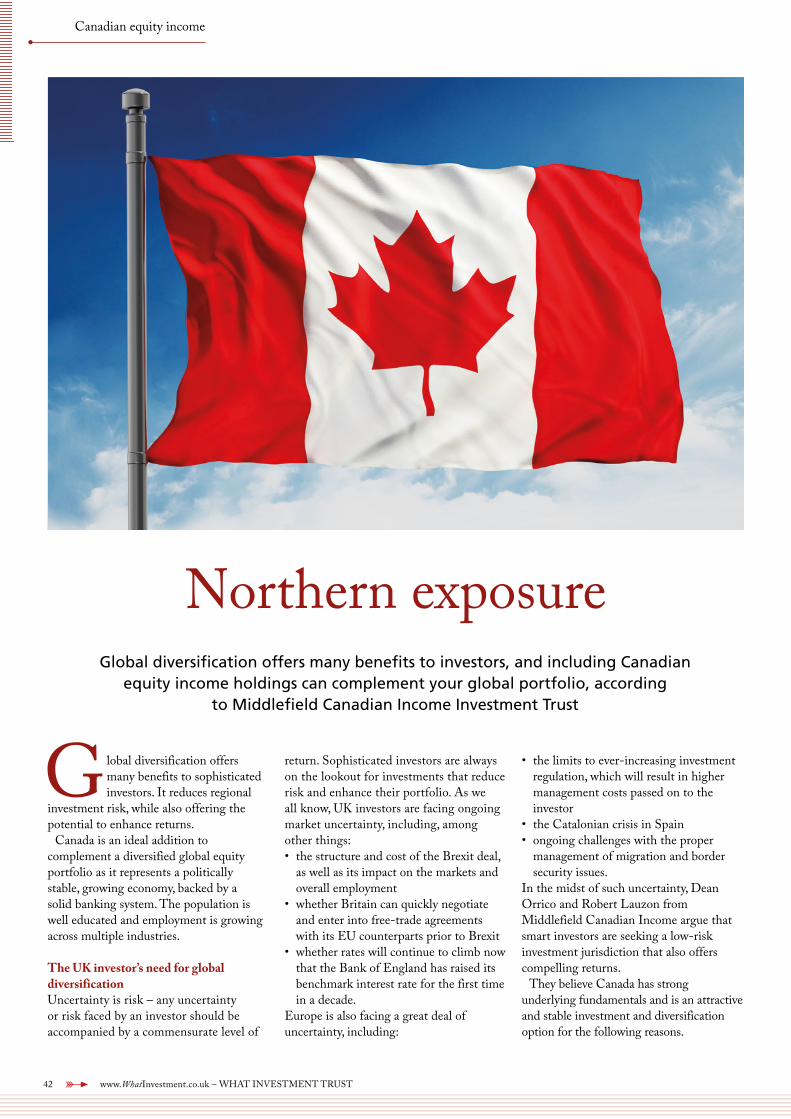
42 www.WhatInvestment.co.uk – WHAT INVESTMENT TRUST
Canadian equity income
Northern exposureGlobal diversification offers many benefits to investors, and including Canadian
equity income holdings can complement your global portfolio, according to Middlefield Canadian Income Investment Trust
Global diversification offers many benefits to sophisticated investors. It reduces regional
investment risk, while also offering the potential to enhance returns.
Canada is an ideal addition to complement a diversified global equity portfolio as it represents a politically stable, growing economy, backed by a solid banking system. The population is well educated and employment is growing across multiple industries.
The UK investor’s need for global diversificationUncertainty is risk – any uncertainty or risk faced by an investor should be accompanied by a commensurate level of
return. Sophisticated investors are always on the lookout for investments that reduce risk and enhance their portfolio. As we all know, UK investors are facing ongoing market uncertainty, including, among other things:• the structure and cost of the Brexit deal,
as well as its impact on the markets and overall employment
• whether Britain can quickly negotiate and enter into free-trade agreements with its EU counterparts prior to Brexit
• whether rates will continue to climb now that the Bank of England has raised its benchmark interest rate for the first time in a decade.
Europe is also facing a great deal of uncertainty, including:
• the limits to ever-increasing investment regulation, which will result in higher management costs passed on to the investor
• the Catalonian crisis in Spain• ongoing challenges with the proper
management of migration and border security issues.
In the midst of such uncertainty, Dean Orrico and Robert Lauzon from Middlefield Canadian Income argue that smart investors are seeking a low-risk investment jurisdiction that also offers compelling returns.
They believe Canada has strong underlying fundamentals and is an attractive and stable investment and diversification option for the following reasons.
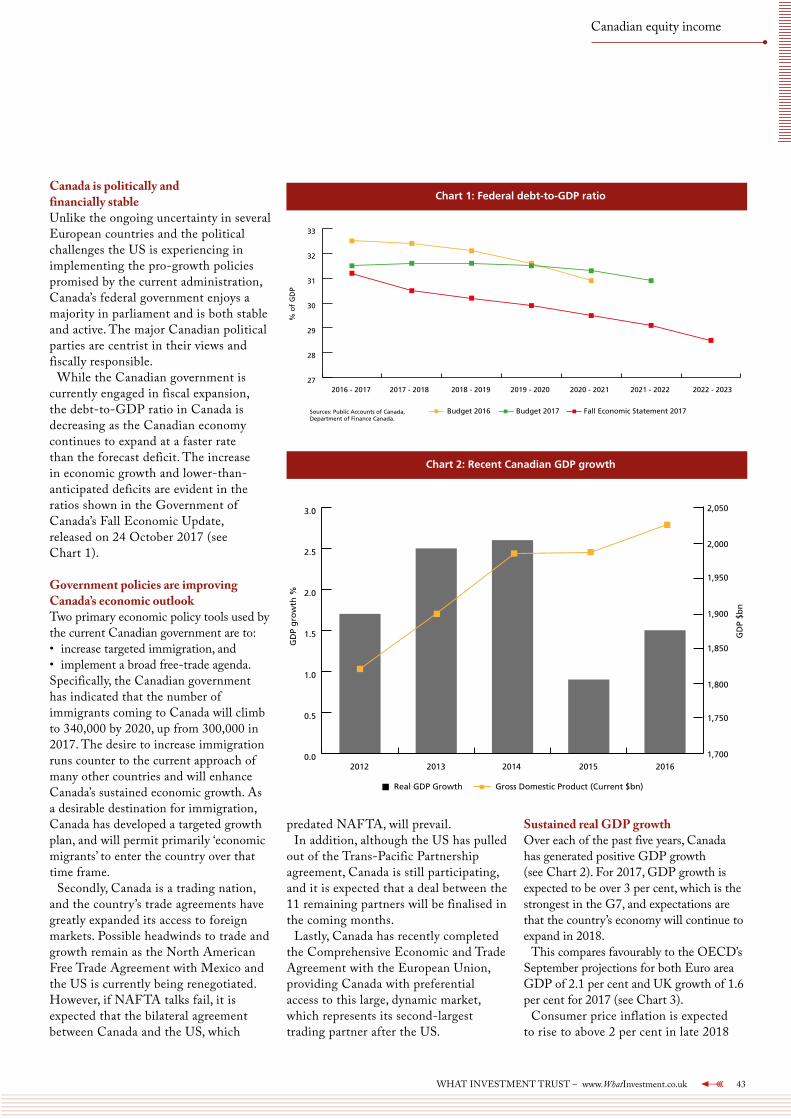
WHAT INVESTMENT TRUST – www.WhatInvestment.co.uk 43
Canadian equity income
Canada is politically and financially stableUnlike the ongoing uncertainty in several European countries and the political challenges the US is experiencing in implementing the pro-growth policies promised by the current administration, Canada’s federal government enjoys a majority in parliament and is both stable and active. The major Canadian political parties are centrist in their views and fiscally responsible.
While the Canadian government is currently engaged in fiscal expansion, the debt-to-GDP ratio in Canada is decreasing as the Canadian economy continues to expand at a faster rate than the forecast deficit. The increase in economic growth and lower-than-anticipated deficits are evident in the ratios shown in the Government of Canada’s Fall Economic Update, released on 24 October 2017 (see Chart 1).
Government policies are improving Canada’s economic outlookTwo primary economic policy tools used by the current Canadian government are to: • increase targeted immigration, and• implement a broad free-trade agenda. Specifically, the Canadian government has indicated that the number of immigrants coming to Canada will climb to 340,000 by 2020, up from 300,000 in 2017. The desire to increase immigration runs counter to the current approach of many other countries and will enhance Canada’s sustained economic growth. As a desirable destination for immigration, Canada has developed a targeted growth plan, and will permit primarily ‘economic migrants’ to enter the country over that time frame.
Secondly, Canada is a trading nation, and the country’s trade agreements have greatly expanded its access to foreign markets. Possible headwinds to trade and growth remain as the North American Free Trade Agreement with Mexico and the US is currently being renegotiated. However, if NAFTA talks fail, it is expected that the bilateral agreement between Canada and the US, which
predated NAFTA, will prevail. In addition, although the US has pulled
out of the Trans-Pacific Partnership agreement, Canada is still participating, and it is expected that a deal between the 11 remaining partners will be finalised in the coming months.
Lastly, Canada has recently completed the Comprehensive Economic and Trade Agreement with the European Union, providing Canada with preferential access to this large, dynamic market, which represents its second-largest trading partner after the US.
Sustained real GDP growthOver each of the past five years, Canada has generated positive GDP growth (see Chart 2). For 2017, GDP growth is expected to be over 3 per cent, which is the strongest in the G7, and expectations are that the country’s economy will continue to expand in 2018.
This compares favourably to the OECD’s September projections for both Euro area GDP of 2.1 per cent and UK growth of 1.6 per cent for 2017 (see Chart 3).
Consumer price inflation is expected to rise to above 2 per cent in late 2018
27
28
29
30
31
32
33
2016 - 2017 2017 - 2018 2018 - 2019 2019 - 2020 2022 - 20232021 - 20222020 - 2021
Sources: Public Accounts of Canada,Department of Finance Canada.
Budget 2016 Budget 2017 Fall Economic Statement 2017
Chart 1: Federal Debt-to-GDP Ratio
% o
f G
DP
0.0
0.5
1.0
1.5
2.0
2.5
3.0
2012
Chart 2: Recent Canadian GDP Growth
2013 201620152014
Real GDP Growth Gross Domestic Product (Current $bn)
1,700
1,750
1,800
1,850
1,900
1,950
2,000
2,050
GD
P g
row
th %
GD
P $b
n
Chart 2: Recent Canadian GDP growth
Chart 1: Federal debt-to-GDP ratio
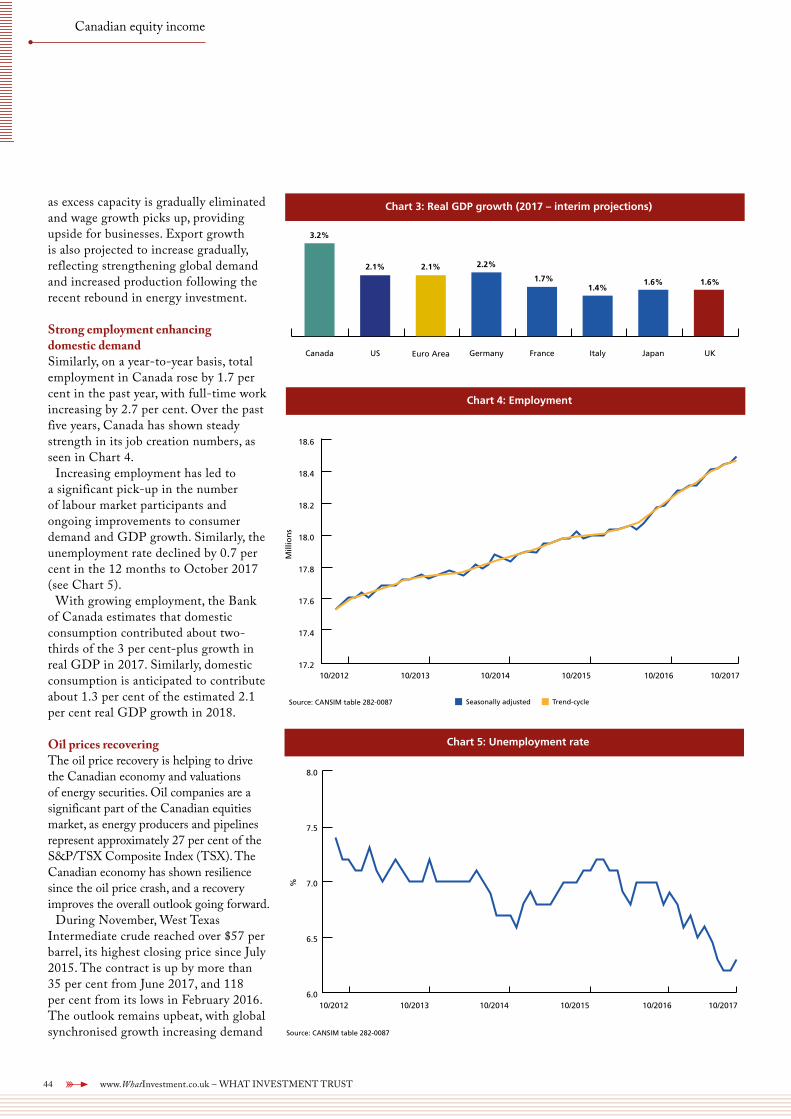
44 www.WhatInvestment.co.uk – WHAT INVESTMENT TRUST
Canadian equity income
as excess capacity is gradually eliminated and wage growth picks up, providing upside for businesses. Export growth is also projected to increase gradually, reflecting strengthening global demand and increased production following the recent rebound in energy investment.
Strong employment enhancing domestic demandSimilarly, on a year-to-year basis, total employment in Canada rose by 1.7 per cent in the past year, with full-time work increasing by 2.7 per cent. Over the past five years, Canada has shown steady strength in its job creation numbers, as seen in Chart 4.
Increasing employment has led to a significant pick-up in the number of labour market participants and ongoing improvements to consumer demand and GDP growth. Similarly, the unemployment rate declined by 0.7 per cent in the 12 months to October 2017 (see Chart 5).
With growing employment, the Bank of Canada estimates that domestic consumption contributed about two-thirds of the 3 per cent-plus growth in real GDP in 2017. Similarly, domestic consumption is anticipated to contribute about 1.3 per cent of the estimated 2.1 per cent real GDP growth in 2018.
Oil prices recoveringThe oil price recovery is helping to drive the Canadian economy and valuations of energy securities. Oil companies are a significant part of the Canadian equities market, as energy producers and pipelines represent approximately 27 per cent of the S&P/TSX Composite Index (TSX). The Canadian economy has shown resilience since the oil price crash, and a recovery improves the overall outlook going forward.
During November, West Texas Intermediate crude reached over $57 per barrel, its highest closing price since July 2015. The contract is up by more than 35 per cent from June 2017, and 118 per cent from its lows in February 2016. The outlook remains upbeat, with global synchronised growth increasing demand
Real GDP Growth (2017 - Interim Projections)
Canada US Euro Area Germany France Italy Japan UK
3.2%
2.1% 2.1% 2.2%
1.7%1.4%
1.6% 1.6%
10/2012 10/2013 10/2014 10/2015 10/2016 10/2017
Seasonally adjusted Trend-cycle
18.6
18.4
18.2
18.0
17.8
17.6
17.4
17.2
Employment
Mill
ion
s
Source: CANSIM table 282-0087
8.0
7.5
7.0
6.5
6.0
Unemployment rate
%
Source: CANSIM table 282-0087
10/2012 10/2013 10/2014 10/2015 10/2016 10/2017
Chart 3: Real GDP growth (2017 – interim projections)
Chart 4: Employment
Chart 5: Unemployment rate
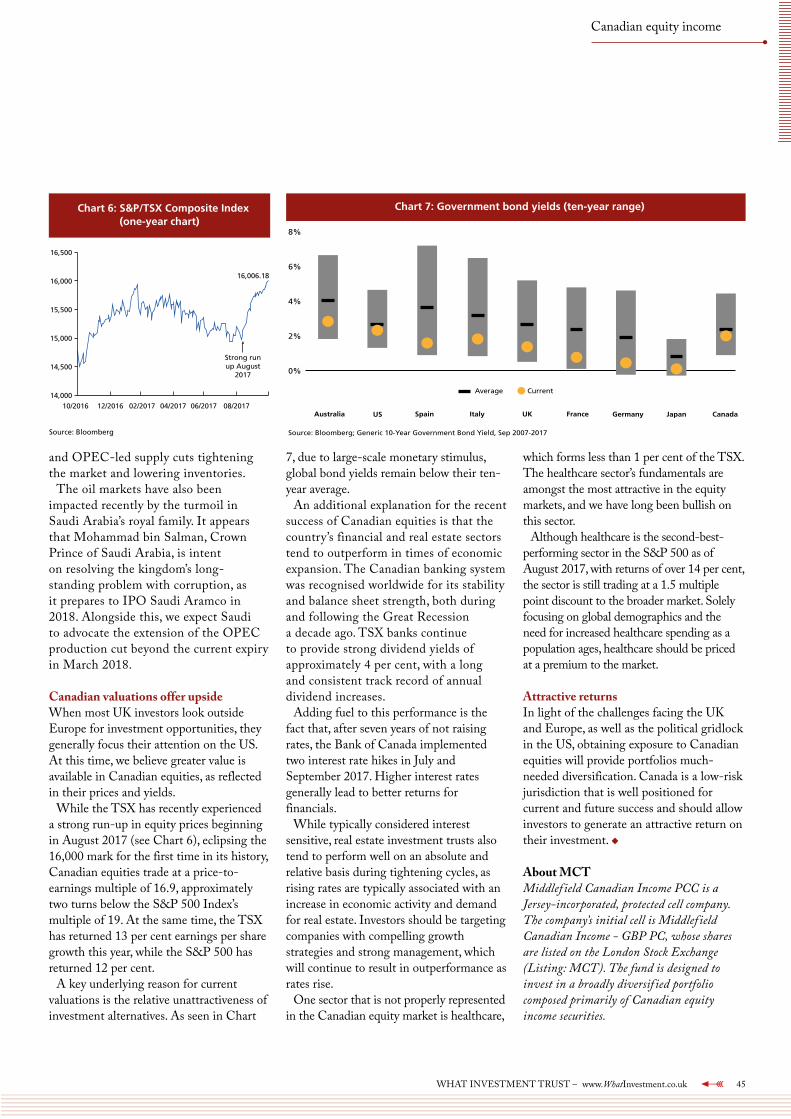
WHAT INVESTMENT TRUST – www.WhatInvestment.co.uk 45
Canadian equity income
and OPEC-led supply cuts tightening the market and lowering inventories.
The oil markets have also been impacted recently by the turmoil in Saudi Arabia’s royal family. It appears that Mohammad bin Salman, Crown Prince of Saudi Arabia, is intent on resolving the kingdom’s long-standing problem with corruption, as it prepares to IPO Saudi Aramco in 2018. Alongside this, we expect Saudi to advocate the extension of the OPEC production cut beyond the current expiry in March 2018.
Canadian valuations offer upsideWhen most UK investors look outside Europe for investment opportunities, they generally focus their attention on the US. At this time, we believe greater value is available in Canadian equities, as reflected in their prices and yields.
While the TSX has recently experienced a strong run-up in equity prices beginning in August 2017 (see Chart 6), eclipsing the 16,000 mark for the first time in its history, Canadian equities trade at a price-to-earnings multiple of 16.9, approximately two turns below the S&P 500 Index’s multiple of 19. At the same time, the TSX has returned 13 per cent earnings per share growth this year, while the S&P 500 has returned 12 per cent.
A key underlying reason for current valuations is the relative unattractiveness of investment alternatives. As seen in Chart
7, due to large-scale monetary stimulus, global bond yields remain below their ten- year average.
An additional explanation for the recent success of Canadian equities is that the country’s financial and real estate sectors tend to outperform in times of economic expansion. The Canadian banking system was recognised worldwide for its stability and balance sheet strength, both during and following the Great Recession a decade ago. TSX banks continue to provide strong dividend yields of approximately 4 per cent, with a long and consistent track record of annual dividend increases.
Adding fuel to this performance is the fact that, after seven years of not raising rates, the Bank of Canada implemented two interest rate hikes in July and September 2017. Higher interest rates generally lead to better returns for financials.
While typically considered interest sensitive, real estate investment trusts also tend to perform well on an absolute and relative basis during tightening cycles, as rising rates are typically associated with an increase in economic activity and demand for real estate. Investors should be targeting companies with compelling growth strategies and strong management, which will continue to result in outperformance as rates rise.
One sector that is not properly represented in the Canadian equity market is healthcare,
which forms less than 1 per cent of the TSX. The healthcare sector’s fundamentals are amongst the most attractive in the equity markets, and we have long been bullish on this sector.
Although healthcare is the second-best-performing sector in the S&P 500 as of August 2017, with returns of over 14 per cent, the sector is still trading at a 1.5 multiple point discount to the broader market. Solely focusing on global demographics and the need for increased healthcare spending as a population ages, healthcare should be priced at a premium to the market.
Attractive returnsIn light of the challenges facing the UK and Europe, as well as the political gridlock in the US, obtaining exposure to Canadian equities will provide portfolios much-needed diversification. Canada is a low-risk jurisdiction that is well positioned for current and future success and should allow investors to generate an attractive return on their investment. u
About MCTMiddlef ield Canadian Income PCC is a Jersey-incorporated, protected cell company. The company’s initial cell is Middlef ield Canadian Income - GBP PC, whose shares are listed on the London Stock Exchange (Listing: MCT). The fund is designed to invest in a broadly diversif ied portfolio composed primarily of Canadian equity income securities.
Government Bond Yields - 10 year range
8%
6%
4%
2%
0%
Australia US Spain Italy UK France Germany Japan Canada
Average Current
Source: Bloomberg; Generic 10-Year Government Bond Yield, Sep 2007-2017
16,500
16,000
15,500
15,000
14,500
14,000
10/2016 12/2016 02/2017 04/2017 06/2017 08/2017
Strong run up August
2017
S&P/TSX Composite Index (1 Year Chart)
16,006.18
Source: Bloomberg
Chart 7: Government bond yields (ten-year range)Chart 6: S&P/TSX Composite Index (one-year chart)
Source: Bloomberg

46 www.WhatInvestment.co.uk – WHAT INVESTMENT TRUST
Fidelity International’s investment trust team covers the latest news, views and market commentary.
Here, they offer What Investment readers their views on where they believe some of the most compelling investment opportunities are to be found across five key regions – the UK, Europe, China, Japan and Asia.
UK
Alex Wright, portfolio manager of Fidelity Special Values Plc, comments, ‘It’s always difficult to predict the future direction of markets, but with aggregate valuations not as attractive as they once were, and the current bull market one of the longest in history, I don’t think we should expect the FTSE All-Share to continue delivering the 10 per cent per annum or so that it has done since the financial crisis almost a decade ago.
‘Clearly, the spectre of Brexit looms large, and greater certainty over the direction of negotiations between the UK and the EU would be welcomed. Such clarity would provide a real-world boost to the domestic economy as it would enable firms to have more confidence when making operational decisions on investment and hiring.
‘This is probably wishful thinking, and I expect that markets are probably going to have to contend with a more uncertain and volatile backdrop, even compared with this year. From an investment perspective, however, this kind of environment is likely to create some interesting stock-picking opportunities. Periods of macro-driven volatility tend to throw up valuation opportunities that are more difficult to find if markets are steadily trending upwards as we’ve seen over the past few years.
‘Outside of the political sphere, another key thing for UK investors to monitor will
be the Bank of England. Further policy “normalisation” could have profound implications for the leadership of equity markets from here.
‘We’ve had ten years since the financial crisis where steady businesses with stable cash flows have been in favour, and this has driven strong growth in the share prices of areas like consumer staples. These types of companies have historically struggled in an environment of rising interest rates, and we could now be at a point of change where the market may start to reassess the prospects of hitherto unloved sectors.’
Europe
Sam Morse, portfolio manager of Fidelity European Values Plc, remarks, ‘Continental European investors have become much more confident and optimistic in recent
Navigating difficult waters What Investment sounds out Fidelity International to discover where they see the best investment trust opportunities in five key regions
Regional outlook

WHAT INVESTMENT TRUST – www.WhatInvestment.co.uk 47
Regional outlook
months, and many are now willing to take on more risk in equities, high-yield and other markets. This is understandable given the improving backdrop in terms of the European economy, and corporate earnings, which has been coupled, thankfully, with a quieter period in Continental politics.
In the equity markets, it feels like party time. So why will you find me in the kitchen? Because experience has taught me over the years that it pays not to get too carried away during stock market parties, and I expect that this one will prove no exception. What makes me nervous today? In short, valuation.
‘Continental European markets have more than doubled (in Sterling terms) over the past five years since [European Central Bank president] Mario Draghi’s famous commitment to do “whatever it takes” to keep the Eurozone together. The problem is that for most of that period earnings have not gone up much, requiring rising valuations to drive the price return.
‘I disagree with the consensus view that European shares are cheap, and especially cheap relative to US shares. Much of this illusion of cheapness is a function of the US’s sector mix and higher returns compared with Europe. Remember, there are many hundreds of global analysts seeking out valuation anomalies across global sectors, so it is unlikely that they would allow such a general discrepancy to persist. I think, at best, we could say that the Continental European markets are, perhaps, a bit less expensive than the US market, but no more than that.
‘The good news for Continental Europe, however, is that earnings are now, at last, rising: even hitting double-digit growth in the first quarter of 2017, so there is some hope that Europe’s stock markets can now grow into their lofty valuations. Earnings growth expectations are high, however, which leaves little margin for error as we approach more difficult comparison periods. The high level of valuation will also make the stock market particularly vulnerable to any disappointment in earnings delivery.’
China
Dale Nicholls, portfolio manager of Fidelity China Special Situations Plc, comments, ‘We are currently in the midst of a clear cyclical upturn in the Chinese economy. Supply-side reform in areas like steel and cement has helped lift pricing across a range of commodities.
‘On the policy front, there is increasing rhetoric focused on the risks associated with the build-up of credit we have seen in the economy. This focus could become stronger following recent leadership changes – all positive in addressing our major concern for the long-term health of the economy.
‘The environment remains positive for ongoing growth in consumption as part of the natural expansion of the middle class, which is a key investment theme for the portfolio. While market sentiment has clearly turned more positive to the risk-reward balance around the opportunities in the Chinese market, we still find good value relative to the long-term growth potential.’
Japan
Nicholas Price, portfolio manager of Fidelity Japanese Values Plc, remarks, ‘In terms of corporate fundamentals and valuations, the Japanese market is relatively cheap globally, and the earnings environment is positive so I expect reasonable upside to the market in 2018. However, there are signs of peak momentum in the US ISM index so I am looking at companies that can grow steadily and on reasonable valuations.
‘Bottom-up and individual company fundamentals will be increasingly important as global growth slows down. Key events are the reappointment of Haruhiko Kuroda, governor of the Bank of Japan (BoJ), in April 18 and whether the BoJ starts to taper more in 2018. The Japanese labour market is relatively tight so I am looking at companies that can benefit from that and growth markets such as medical technology.’
Asia
Nitin Bajaj, portfolio manager of Fidelity Asian Values Plc, comments, ‘So, will Asian equity markets continue to deliver attractive returns in 2018? My honest answer is that I don’t know. I pay little attention to market forecasts, and have never found them useful in making money for investors. I feel that our time at Fidelity is better spent understanding the businesses that we invest in.
‘That said, I can share with you my assessment of the current investment backdrop. The purpose of this is not to make a forecast, but to better understand the current risk preference and tolerance among market participants. As it stands:• Most economies are growing at a
healthy rate, with unemployment falling quickly and in a few large economies the unemployment rate close to all-time lows.
• Interest rates continue to be low, as does inflation.
• Profit margins for most businesses are very healthy and close to their all-time peaks.
• Liquidity is ample. China continues to lead the charge in liquidity creation through record amounts of incremental debt being injected into the economy.
• High liquidity levels have driven most equity markets to all-time highs (albeit not significantly ahead of their previous peaks).
• Buoyant equity markets have led to record amounts of margin trading activity.
• Cyclically adjusted price-to-earnings ratio (current prices divided by average profits of the last ten years) is currently at a level that was exceeded only twice in its history, during the market peaks of 1929 and 2000.
‘None of these factors is individually a cause of alarm – and some are actually quite encouraging. But together they paint a very clear picture that most market participants are leaning towards “greed” rather than “fear”. Either there is a general belief that the buoyant global scenario is likely to continue for quite a few years, or everyone believes that they can ride the wave better than others and get off at the right time. They may be right. Or they may not be. Do we want to dance until the music stops playing?’ u

WISDOM IS THE DAUGHTER OF EXPERIENCELEONARDO DA VINCI
12 years experience using a multi-manager approach
For over 12 years, the Witan Investment Trust has used a multi-manager approach. By carefully selecting fund managers to run different parts of the portfolio, we can play to their individual strengths and avoid undue reliance on a single manager. This method has served our shareholders well, and the multi-manager strategy has continued to evolve, with others adopting a similar approach too. If you seek capital growth and a growing real income from global equity investments, we can help realise your financial ambitions.
Witan Investment Trust plc is an equity investment. The value of an investment and the income from it can fall as well as rise as a result of currency and market fluctuations and you may not get back the amount originally invested.
WISDOM IN A CHANGING WORLD
Issued and approved by Witan Investment Services Limited, which is registered in England no.5272533 of 14 Queen Anne’s Gate, London SW1H 9AA. Witan Investment Services Limited provides investment
products and services and is authorised and regulated by the Financial Conduct Authority.
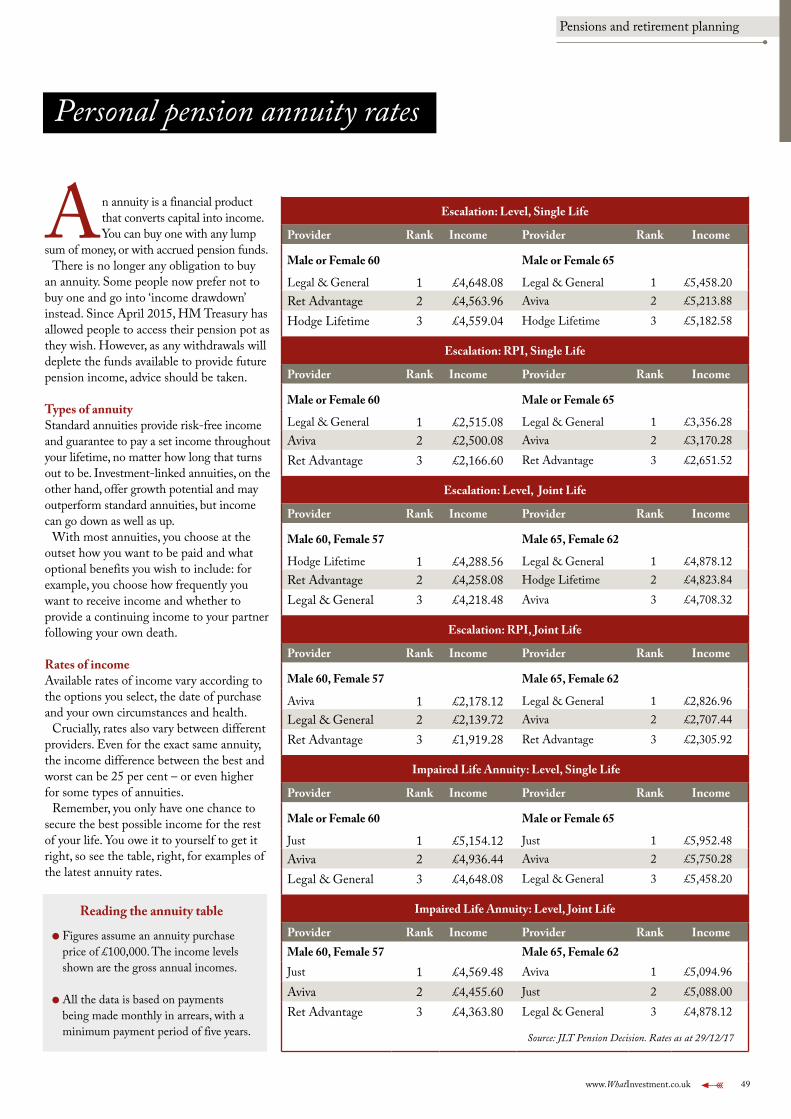
www.WhatInvestment.co.uk 49
An annuity is a financial product that converts capital into income. You can buy one with any lump
sum of money, or with accrued pension funds.There is no longer any obligation to buy
an annuity. Some people now prefer not to buy one and go into ‘income drawdown’ instead. Since April 2015, HM Treasury has allowed people to access their pension pot as they wish. However, as any withdrawals will deplete the funds available to provide future pension income, advice should be taken.
Types of annuityStandard annuities provide risk-free income and guarantee to pay a set income throughout your lifetime, no matter how long that turns out to be. Investment-linked annuities, on the other hand, offer growth potential and may outperform standard annuities, but income can go down as well as up.
With most annuities, you choose at the outset how you want to be paid and what optional benefits you wish to include: for example, you choose how frequently you want to receive income and whether to provide a continuing income to your partner following your own death.
Rates of incomeAvailable rates of income vary according to the options you select, the date of purchase and your own circumstances and health.
Crucially, rates also vary between different providers. Even for the exact same annuity, the income difference between the best and worst can be 25 per cent – or even higher for some types of annuities.
Remember, you only have one chance to secure the best possible income for the rest of your life. You owe it to yourself to get it right, so see the table, right, for examples of the latest annuity rates.
Personal pension annuity rates
Reading the annuity table
● Figures assume an annuity purchase price of £100,000. The income levels shown are the gross annual incomes.
● All the data is based on payments being made monthly in arrears, with a minimum payment period of five years.
Escalation: Level, Single Life
Provider Rank Income Provider Rank Income
Male or Female 60 Male or Female 65
Legal & General 1 £4,648.08 Legal & General 1 £5,458.20Ret Advantage 2 £4,563.96 Aviva 2 £5,213.88Hodge Lifetime 3 £4,559.04 Hodge Lifetime 3 £5,182.58
Escalation: RPI, Single Life
Provider Rank Income Provider Rank Income
Male or Female 60 Male or Female 65
Legal & General 1 £2,515.08 Legal & General 1 £3,356.28Aviva 2 £2,500.08 Aviva 2 £3,170.28Ret Advantage 3 £2,166.60 Ret Advantage 3 £2,651.52
Escalation: Level, Joint Life
Provider Rank Income Provider Rank Income
Male 60, Female 57 Male 65, Female 62
Hodge Lifetime 1 £4,288.56 Legal & General 1 £4,878.12Ret Advantage 2 £4,258.08 Hodge Lifetime 2 £4,823.84Legal & General 3 £4,218.48 Aviva 3 £4,708.32
Escalation: RPI, Joint Life
Provider Rank Income Provider Rank Income
Male 60, Female 57 Male 65, Female 62
Aviva 1 £2,178.12 Legal & General 1 £2,826.96Legal & General 2 £2,139.72 Aviva 2 £2,707.44Ret Advantage 3 £1,919.28 Ret Advantage 3 £2,305.92
Impaired Life Annuity: Level, Single Life
Provider Rank Income Provider Rank Income
Male or Female 60 Male or Female 65
Just 1 £5,154.12 Just 1 £5,952.48Aviva 2 £4,936.44 Aviva 2 £5,750.28Legal & General 3 £4,648.08 Legal & General 3 £5,458.20
Impaired Life Annuity: Level, Joint Life
Provider Rank Income Provider Rank IncomeMale 60, Female 57 Male 65, Female 62Just 1 £4,569.48 Aviva 1 £5,094.96Aviva 2 £4,455.60 Just 2 £5,088.00Ret Advantage 3 £4,363.80 Legal & General 3 £4,878.12
Source: JLT Pension Decision. Rates as at 29/12/17
Pensions and retirement planning
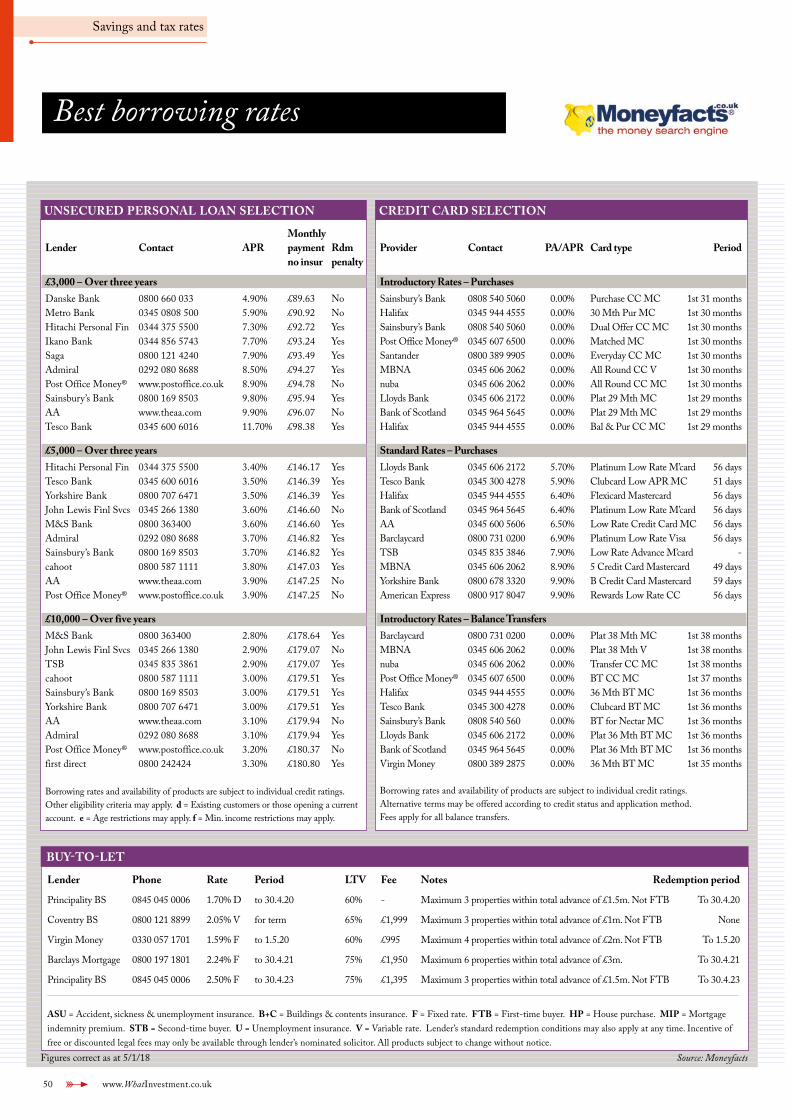
50 www.WhatInvestment.co.uk
Savings and tax rates
Best borrowing rates
Figures correct as at 5/1/18 Source: Moneyfacts
UNSECURED PERSONAL LOAN SELECTION CREDIT CARD SELECTION
MonthlyLender Contact APR payment Rdm no insur penalty
£3,000 – Over three years Danske Bank 0800 660 033 4.90% £89.63 NoMetro Bank 0345 0808 500 5.90% £90.92 NoHitachi Personal Fin 0344 375 5500 7.30% £92.72 YesIkano Bank 0344 856 5743 7.70% £93.24 YesSaga 0800 121 4240 7.90% £93.49 YesAdmiral 0292 080 8688 8.50% £94.27 YesPost Office Money® www.postoffice.co.uk 8.90% £94.78 NoSainsbury’s Bank 0800 169 8503 9.80% £95.94 YesAA www.theaa.com 9.90% £96.07 NoTesco Bank 0345 600 6016 11.70% £98.38 Yes
£5,000 – Over three years Hitachi Personal Fin 0344 375 5500 3.40% £146.17 YesTesco Bank 0345 600 6016 3.50% £146.39 YesYorkshire Bank 0800 707 6471 3.50% £146.39 YesJohn Lewis Finl Svcs 0345 266 1380 3.60% £146.60 NoM&S Bank 0800 363400 3.60% £146.60 YesAdmiral 0292 080 8688 3.70% £146.82 YesSainsbury’s Bank 0800 169 8503 3.70% £146.82 Yescahoot 0800 587 1111 3.80% £147.03 YesAA www.theaa.com 3.90% £147.25 NoPost Office Money® www.postoffice.co.uk 3.90% £147.25 No
£10,000 – Over five years M&S Bank 0800 363400 2.80% £178.64 YesJohn Lewis Finl Svcs 0345 266 1380 2.90% £179.07 NoTSB 0345 835 3861 2.90% £179.07 Yescahoot 0800 587 1111 3.00% £179.51 YesSainsbury’s Bank 0800 169 8503 3.00% £179.51 YesYorkshire Bank 0800 707 6471 3.00% £179.51 YesAA www.theaa.com 3.10% £179.94 NoAdmiral 0292 080 8688 3.10% £179.94 YesPost Office Money® www.postoffice.co.uk 3.20% £180.37 Nofirst direct 0800 242424 3.30% £180.80 Yes
Borrowing rates and availability of products are subject to individual credit ratings. Other eligibility criteria may apply. d = Existing customers or those opening a current account. e = Age restrictions may apply. f = Min. income restrictions may apply.
Provider Contact PA/APR Card type Period
Introductory Rates – Purchases Sainsbury’s Bank 0808 540 5060 0.00% Purchase CC MC 1st 31 monthsHalifax 0345 944 4555 0.00% 30 Mth Pur MC 1st 30 monthsSainsbury’s Bank 0808 540 5060 0.00% Dual Offer CC MC 1st 30 monthsPost Office Money® 0345 607 6500 0.00% Matched MC 1st 30 monthsSantander 0800 389 9905 0.00% Everyday CC MC 1st 30 monthsMBNA 0345 606 2062 0.00% All Round CC V 1st 30 monthsnuba 0345 606 2062 0.00% All Round CC MC 1st 30 monthsLloyds Bank 0345 606 2172 0.00% Plat 29 Mth MC 1st 29 monthsBank of Scotland 0345 964 5645 0.00% Plat 29 Mth MC 1st 29 monthsHalifax 0345 944 4555 0.00% Bal & Pur CC MC 1st 29 months
Standard Rates – PurchasesLloyds Bank 0345 606 2172 5.70% Platinum Low Rate M’card 56 daysTesco Bank 0345 300 4278 5.90% Clubcard Low APR MC 51 daysHalifax 0345 944 4555 6.40% Flexicard Mastercard 56 daysBank of Scotland 0345 964 5645 6.40% Platinum Low Rate M’card 56 daysAA 0345 600 5606 6.50% Low Rate Credit Card MC 56 daysBarclaycard 0800 731 0200 6.90% Platinum Low Rate Visa 56 daysTSB 0345 835 3846 7.90% Low Rate Advance M’card -MBNA 0345 606 2062 8.90% 5 Credit Card Mastercard 49 daysYorkshire Bank 0800 678 3320 9.90% B Credit Card Mastercard 59 daysAmerican Express 0800 917 8047 9.90% Rewards Low Rate CC 56 days
Introductory Rates – Balance Transfers Barclaycard 0800 731 0200 0.00% Plat 38 Mth MC 1st 38 monthsMBNA 0345 606 2062 0.00% Plat 38 Mth V 1st 38 monthsnuba 0345 606 2062 0.00% Transfer CC MC 1st 38 monthsPost Office Money® 0345 607 6500 0.00% BT CC MC 1st 37 monthsHalifax 0345 944 4555 0.00% 36 Mth BT MC 1st 36 monthsTesco Bank 0345 300 4278 0.00% Clubcard BT MC 1st 36 monthsSainsbury’s Bank 0808 540 560 0.00% BT for Nectar MC 1st 36 monthsLloyds Bank 0345 606 2172 0.00% Plat 36 Mth BT MC 1st 36 monthsBank of Scotland 0345 964 5645 0.00% Plat 36 Mth BT MC 1st 36 monthsVirgin Money 0800 389 2875 0.00% 36 Mth BT MC 1st 35 months
Borrowing rates and availability of products are subject to individual credit ratings.Alternative terms may be offered according to credit status and application method. Fees apply for all balance transfers.
Lender Phone Rate Period LTV Fee Notes Redemption period
Principality BS 0845 045 0006 1.70% D to 30.4.20 60% - Maximum 3 properties within total advance of £1.5m. Not FTB To 30.4.20
Coventry BS 0800 121 8899 2.05% V for term 65% £1,999 Maximum 3 properties within total advance of £1m. Not FTB None
Virgin Money 0330 057 1701 1.59% F to 1.5.20 60% £995 Maximum 4 properties within total advance of £2m. Not FTB To 1.5.20
Barclays Mortgage 0800 197 1801 2.24% F to 30.4.21 75% £1,950 Maximum 6 properties within total advance of £3m. To 30.4.21
Principality BS 0845 045 0006 2.50% F to 30.4.23 75% £1,395 Maximum 3 properties within total advance of £1.5m. Not FTB To 30.4.23
ASU = Accident, sickness & unemployment insurance. B+C = Buildings & contents insurance. F = Fixed rate. FTB = First-time buyer. HP = House purchase. MIP = Mortgage indemnity premium. STB = Second-time buyer. U = Unemployment insurance. V = Variable rate. Lender’s standard redemption conditions may also apply at any time. Incentive of free or discounted legal fees may only be available through lender’s nominated solicitor. All products subject to change without notice.
BUY-TO-LET
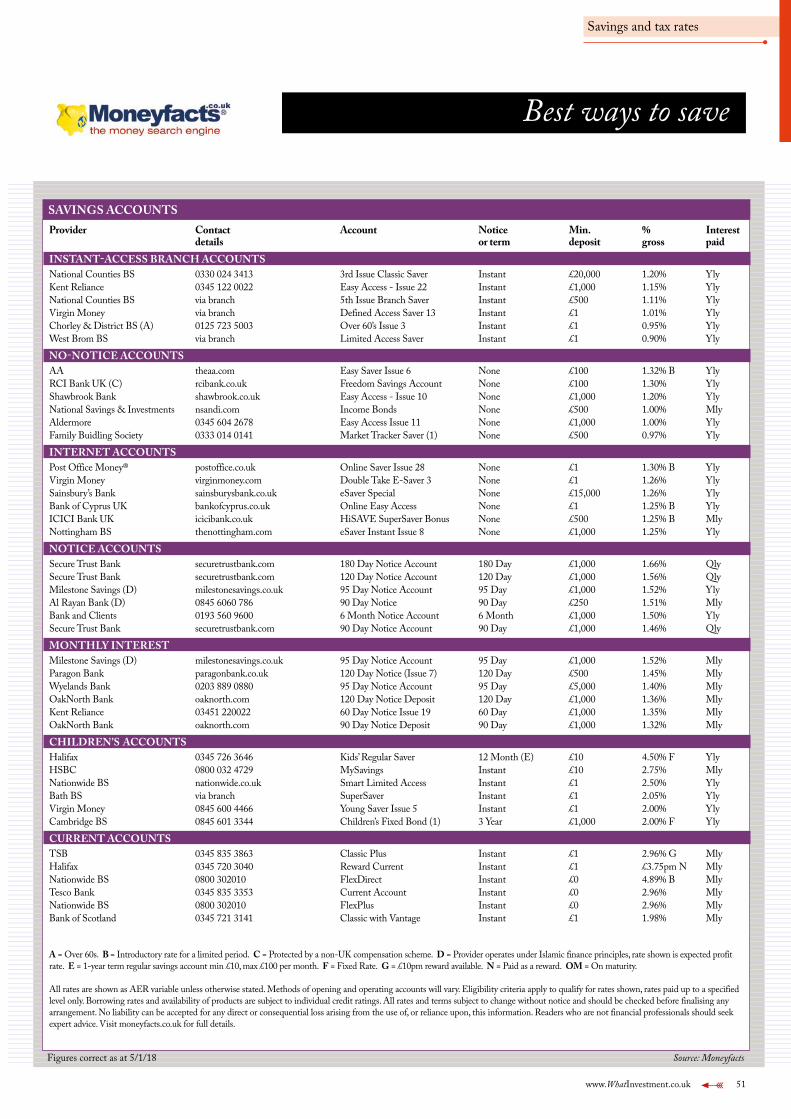
www.WhatInvestment.co.uk 51
Savings and tax rates
Best ways to save
Figures correct as at 5/1/18 Source: Moneyfacts
Provider Contact Account Notice Min. % Interest details or term deposit gross paidINSTANT-ACCESS BRANCH ACCOUNTSNational Counties BS 0330 024 3413 3rd Issue Classic Saver Instant £20,000 1.20% YlyKent Reliance 0345 122 0022 Easy Access - Issue 22 Instant £1,000 1.15% YlyNational Counties BS via branch 5th Issue Branch Saver Instant £500 1.11% YlyVirgin Money via branch Defined Access Saver 13 Instant £1 1.01% YlyChorley & District BS (A) 0125 723 5003 Over 60’s Issue 3 Instant £1 0.95% YlyWest Brom BS via branch Limited Access Saver Instant £1 0.90% Yly
NO-NOTICE ACCOUNTS AA theaa.com Easy Saver Issue 6 None £100 1.32% B YlyRCI Bank UK (C) rcibank.co.uk Freedom Savings Account None £100 1.30% YlyShawbrook Bank shawbrook.co.uk Easy Access - Issue 10 None £1,000 1.20% YlyNational Savings & Investments nsandi.com Income Bonds None £500 1.00% MlyAldermore 0345 604 2678 Easy Access Issue 11 None £1,000 1.00% YlyFamily Buidling Society 0333 014 0141 Market Tracker Saver (1) None £500 0.97% Yly
INTERNET ACCOUNTSPost Office Money® postoffice.co.uk Online Saver Issue 28 None £1 1.30% B YlyVirgin Money virginmoney.com Double Take E-Saver 3 None £1 1.26% YlySainsbury’s Bank sainsburysbank.co.uk eSaver Special None £15,000 1.26% YlyBank of Cyprus UK bankofcyprus.co.uk Online Easy Access None £1 1.25% B YlyICICI Bank UK icicibank.co.uk HiSAVE SuperSaver Bonus None £500 1.25% B MlyNottingham BS thenottingham.com eSaver Instant Issue 8 None £1,000 1.25% Yly
NOTICE ACCOUNTSSecure Trust Bank securetrustbank.com 180 Day Notice Account 180 Day £1,000 1.66% QlySecure Trust Bank securetrustbank.com 120 Day Notice Account 120 Day £1,000 1.56% QlyMilestone Savings (D) milestonesavings.co.uk 95 Day Notice Account 95 Day £1,000 1.52% YlyAl Rayan Bank (D) 0845 6060 786 90 Day Notice 90 Day £250 1.51% MlyBank and Clients 0193 560 9600 6 Month Notice Account 6 Month £1,000 1.50% YlySecure Trust Bank securetrustbank.com 90 Day Notice Account 90 Day £1,000 1.46% Qly
MONTHLY INTERESTMilestone Savings (D) milestonesavings.co.uk 95 Day Notice Account 95 Day £1,000 1.52% MlyParagon Bank paragonbank.co.uk 120 Day Notice (Issue 7) 120 Day £500 1.45% MlyWyelands Bank 0203 889 0880 95 Day Notice Account 95 Day £5,000 1.40% MlyOakNorth Bank oaknorth.com 120 Day Notice Deposit 120 Day £1,000 1.36% MlyKent Reliance 03451 220022 60 Day Notice Issue 19 60 Day £1,000 1.35% MlyOakNorth Bank oaknorth.com 90 Day Notice Deposit 90 Day £1,000 1.32% Mly
CHILDREN’S ACCOUNTSHalifax 0345 726 3646 Kids’ Regular Saver 12 Month (E) £10 4.50% F YlyHSBC 0800 032 4729 MySavings Instant £10 2.75% MlyNationwide BS nationwide.co.uk Smart Limited Access Instant £1 2.50% YlyBath BS via branch SuperSaver Instant £1 2.05% YlyVirgin Money 0845 600 4466 Young Saver Issue 5 Instant £1 2.00% YlyCambridge BS 0845 601 3344 Children’s Fixed Bond (1) 3 Year £1,000 2.00% F Yly
CURRENT ACCOUNTSTSB 0345 835 3863 Classic Plus Instant £1 2.96% G MlyHalifax 0345 720 3040 Reward Current Instant £1 £3.75pm N MlyNationwide BS 0800 302010 FlexDirect Instant £0 4.89% B MlyTesco Bank 0345 835 3353 Current Account Instant £0 2.96% MlyNationwide BS 0800 302010 FlexPlus Instant £0 2.96% MlyBank of Scotland 0345 721 3141 Classic with Vantage Instant £1 1.98% Mly
A = Over 60s. B = Introductory rate for a limited period. C = Protected by a non-UK compensation scheme. D = Provider operates under Islamic finance principles, rate shown is expected profit rate. E = 1-year term regular savings account min £10, max £100 per month. F = Fixed Rate. G = £10pm reward available. N = Paid as a reward. OM = On maturity. All rates are shown as AER variable unless otherwise stated. Methods of opening and operating accounts will vary. Eligibility criteria apply to qualify for rates shown, rates paid up to a specified level only. Borrowing rates and availability of products are subject to individual credit ratings. All rates and terms subject to change without notice and should be checked before finalising any arrangement. No liability can be accepted for any direct or consequential loss arising from the use of, or reliance upon, this information. Readers who are not financial professionals should seek expert advice. Visit moneyfacts.co.uk for full details.
SAVINGS ACCOUNTS
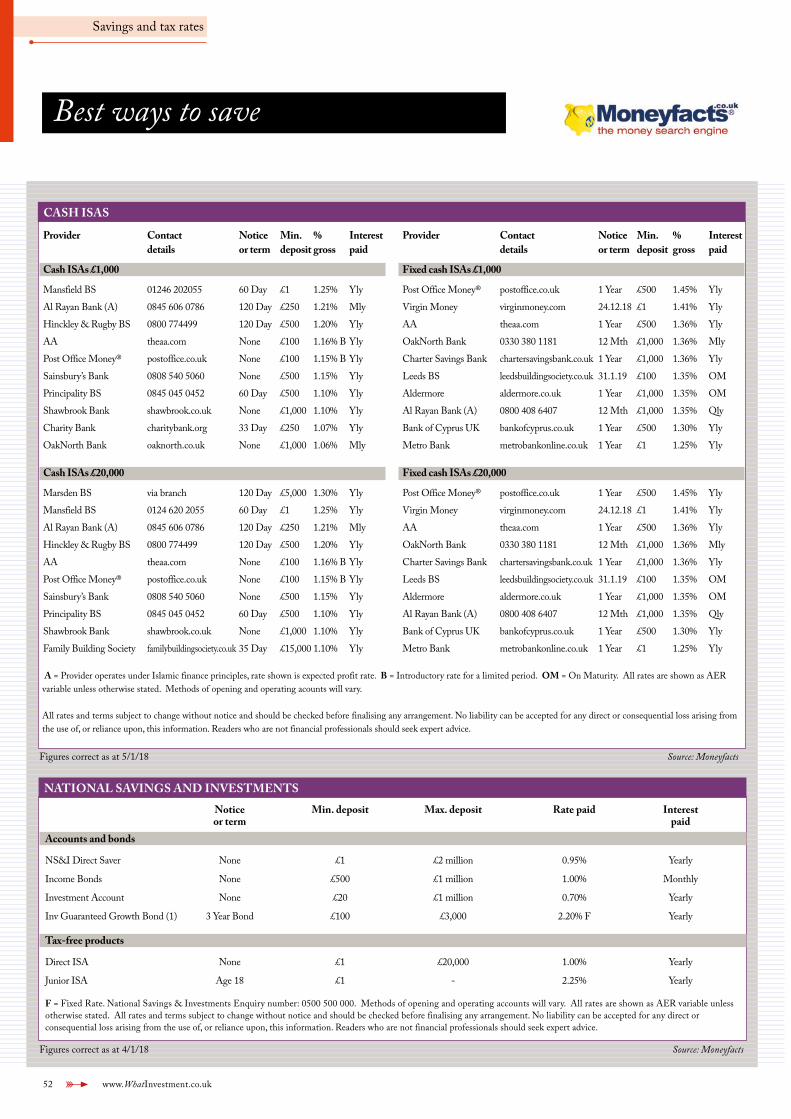
52 www.WhatInvestment.co.uk
Savings and tax rates
Best ways to save
Figures correct as at 5/1/18 Source: Moneyfacts
Figures correct as at 4/1/18 Source: Moneyfacts
CASH ISAS
Provider Contact Notice Min. % Interest details or term deposit gross paid
Cash ISAs £1,000
Mansfield BS 01246 202055 60 Day £1 1.25% Yly
Al Rayan Bank (A) 0845 606 0786 120 Day £250 1.21% Mly
Hinckley & Rugby BS 0800 774499 120 Day £500 1.20% Yly
AA theaa.com None £100 1.16% B Yly
Post Office Money® postoffice.co.uk None £100 1.15% B Yly
Sainsbury’s Bank 0808 540 5060 None £500 1.15% Yly
Principality BS 0845 045 0452 60 Day £500 1.10% Yly
Shawbrook Bank shawbrook.co.uk None £1,000 1.10% Yly
Charity Bank charitybank.org 33 Day £250 1.07% Yly
OakNorth Bank oaknorth.co.uk None £1,000 1.06% Mly
Cash ISAs £20,000
Marsden BS via branch 120 Day £5,000 1.30% Yly
Mansfield BS 0124 620 2055 60 Day £1 1.25% Yly
Al Rayan Bank (A) 0845 606 0786 120 Day £250 1.21% Mly
Hinckley & Rugby BS 0800 774499 120 Day £500 1.20% Yly
AA theaa.com None £100 1.16% B Yly
Post Office Money® postoffice.co.uk None £100 1.15% B Yly
Sainsbury’s Bank 0808 540 5060 None £500 1.15% Yly
Principality BS 0845 045 0452 60 Day £500 1.10% Yly
Shawbrook Bank shawbrook.co.uk None £1,000 1.10% Yly
Family Building Society familybuildingsociety.co.uk 35 Day £15,000 1.10% Yly
Provider Contact Notice Min. % Interest details or term deposit gross paid
Fixed cash ISAs £1,000
Post Office Money® postoffice.co.uk 1 Year £500 1.45% Yly
Virgin Money virginmoney.com 24.12.18 £1 1.41% Yly
AA theaa.com 1 Year £500 1.36% Yly
OakNorth Bank 0330 380 1181 12 Mth £1,000 1.36% Mly
Charter Savings Bank chartersavingsbank.co.uk 1 Year £1,000 1.36% Yly
Leeds BS leedsbuildingsociety.co.uk 31.1.19 £100 1.35% OM
Aldermore aldermore.co.uk 1 Year £1,000 1.35% OM
Al Rayan Bank (A) 0800 408 6407 12 Mth £1,000 1.35% Qly
Bank of Cyprus UK bankofcyprus.co.uk 1 Year £500 1.30% Yly
Metro Bank metrobankonline.co.uk 1 Year £1 1.25% Yly
Fixed cash ISAs £20,000
Post Office Money® postoffice.co.uk 1 Year £500 1.45% Yly
Virgin Money virginmoney.com 24.12.18 £1 1.41% Yly
AA theaa.com 1 Year £500 1.36% Yly
OakNorth Bank 0330 380 1181 12 Mth £1,000 1.36% Mly
Charter Savings Bank chartersavingsbank.co.uk 1 Year £1,000 1.36% Yly
Leeds BS leedsbuildingsociety.co.uk 31.1.19 £100 1.35% OM
Aldermore aldermore.co.uk 1 Year £1,000 1.35% OM
Al Rayan Bank (A) 0800 408 6407 12 Mth £1,000 1.35% Qly
Bank of Cyprus UK bankofcyprus.co.uk 1 Year £500 1.30% Yly
Metro Bank metrobankonline.co.uk 1 Year £1 1.25% Yly
Notice Min. deposit Max. deposit Rate paid Interest or term paidAccounts and bonds
NS&I Direct Saver None £1 £2 million 0.95% Yearly
Income Bonds None £500 £1 million 1.00% Monthly
Investment Account None £20 £1 million 0.70% Yearly
Inv Guaranteed Growth Bond (1) 3 Year Bond £100 £3,000 2.20% F Yearly
Tax-free products
Direct ISA None £1 £20,000 1.00% Yearly
Junior ISA Age 18 £1 - 2.25% Yearly
F = Fixed Rate. National Savings & Investments Enquiry number: 0500 500 000. Methods of opening and operating accounts will vary. All rates are shown as AER variable unless otherwise stated. All rates and terms subject to change without notice and should be checked before finalising any arrangement. No liability can be accepted for any direct or consequential loss arising from the use of, or reliance upon, this information. Readers who are not financial professionals should seek expert advice.
NATIONAL SAVINGS AND INVESTMENTS
A = Provider operates under Islamic finance principles, rate shown is expected profit rate. B = Introductory rate for a limited period. OM = On Maturity. All rates are shown as AER variable unless otherwise stated. Methods of opening and operating acounts will vary.
All rates and terms subject to change without notice and should be checked before finalising any arrangement. No liability can be accepted for any direct or consequential loss arising from the use of, or reliance upon, this information. Readers who are not financial professionals should seek expert advice.
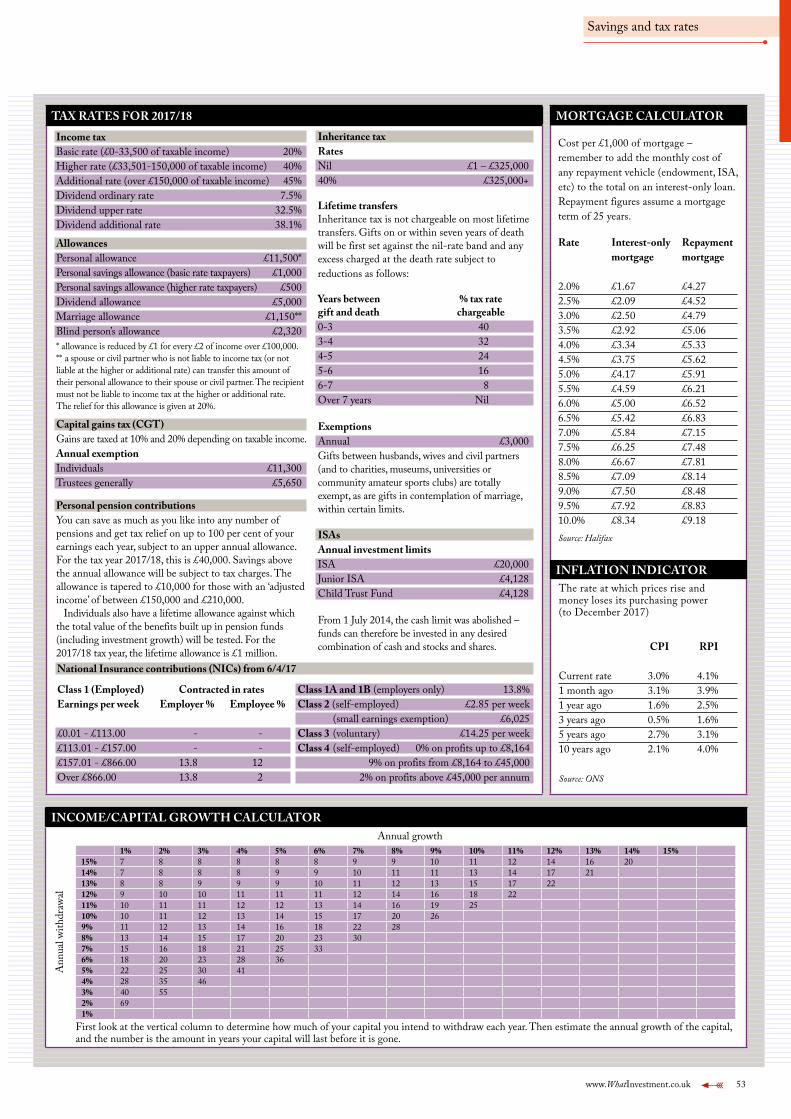
www.WhatInvestment.co.uk 53
Savings and tax rates
TAX RATES FOR 2017/18
INCOME/CAPITAL GROWTH CALCULATOR
1% 2% 3% 4% 5% 6% 7% 8% 9% 10% 11% 12% 13% 14% 15%15% 7 8 8 8 8 8 9 9 10 11 12 14 16 2014% 7 8 8 8 9 9 10 11 11 13 14 17 2113% 8 8 9 9 9 10 11 12 13 15 17 2212% 9 10 10 11 11 11 12 14 16 18 2211% 10 11 11 12 12 13 14 16 19 2510% 10 11 12 13 14 15 17 20 269% 11 12 13 14 16 18 22 288% 13 14 15 17 20 23 307% 15 16 18 21 25 336% 18 20 23 28 365% 22 25 30 414% 28 35 463% 40 552% 691%
First look at the vertical column to determine how much of your capital you intend to withdraw each year. Then estimate the annual growth of the capital, and the number is the amount in years your capital will last before it is gone.
Annual growth
Ann
ual w
ithdr
awal
MORTGAGE CALCULATOR
INFLATION INDICATORThe rate at which prices rise and money loses its purchasing power (to December 2017)
CPI RPI
Current rate 3.0% 4.1%1 month ago 3.1% 3.9%1 year ago 1.6% 2.5%3 years ago 0.5% 1.6%5 years ago 2.7% 3.1%10 years ago 2.1% 4.0%
Source: ONS
Cost per £1,000 of mortgage – remember to add the monthly cost of any repayment vehicle (endowment, ISA, etc) to the total on an interest-only loan. Repayment figures assume a mortgage term of 25 years.
Rate Interest-only Repayment mortgage mortgage
2.0% £1.67 £4.272.5% £2.09 £4.523.0% £2.50 £4.793.5% £2.92 £5.064.0% £3.34 £5.334.5% £3.75 £5.625.0% £4.17 £5.915.5% £4.59 £6.216.0% £5.00 £6.526.5% £5.42 £6.837.0% £5.84 £7.157.5% £6.25 £7.488.0% £6.67 £7.818.5% £7.09 £8.149.0% £7.50 £8.489.5% £7.92 £8.8310.0% £8.34 £9.18Source: Halifax
Income taxBasic rate (£0-33,500 of taxable income) 20%Higher rate (£33,501-150,000 of taxable income) 40%Additional rate (over £150,000 of taxable income) 45%Dividend ordinary rate 7.5%Dividend upper rate 32.5%Dividend additional rate 38.1%
AllowancesPersonal allowance £11,500*Personal savings allowance (basic rate taxpayers) £1,000Personal savings allowance (higher rate taxpayers) £500Dividend allowance £5,000Marriage allowance £1,150**Blind person’s allowance £2,320* allowance is reduced by £1 for every £2 of income over £100,000. ** a spouse or civil partner who is not liable to income tax (or not liable at the higher or additional rate) can transfer this amount of their personal allowance to their spouse or civil partner. The recipient must not be liable to income tax at the higher or additional rate. The relief for this allowance is given at 20%.
Capital gains tax (CGT)Gains are taxed at 10% and 20% depending on taxable income.Annual exemptionIndividuals £11,300Trustees generally £5,650
Personal pension contributionsYou can save as much as you like into any number of pensions and get tax relief on up to 100 per cent of your earnings each year, subject to an upper annual allowance. For the tax year 2017/18, this is £40,000. Savings above the annual allowance will be subject to tax charges. The allowance is tapered to £10,000 for those with an ‘adjusted income’ of between £150,000 and £210,000.
Individuals also have a lifetime allowance against which the total value of the benefits built up in pension funds (including investment growth) will be tested. For the 2017/18 tax year, the lifetime allowance is £1 million.
Inheritance taxRatesNil £1 – £325,00040% £325,000+
Lifetime transfersInheritance tax is not chargeable on most lifetime transfers. Gifts on or within seven years of death will be first set against the nil-rate band and any excess charged at the death rate subject to reductions as follows:
Years between % tax rate gift and death chargeable0-3 403-4 324-5 245-6 166-7 8Over 7 years Nil
ExemptionsAnnual £3,000Gifts between husbands, wives and civil partners (and to charities, museums, universities or community amateur sports clubs) are totally exempt, as are gifts in contemplation of marriage, within certain limits.
ISAsAnnual investment limitsISA £20,000Junior ISA £4,128Child Trust Fund £4,128
From 1 July 2014, the cash limit was abolished – funds can therefore be invested in any desired combination of cash and stocks and shares.
National Insurance contributions (NICs) from 6/4/17
Class 1 (Employed) Contracted in ratesEarnings per week Employer % Employee %
£0.01 - £113.00 - -£113.01 - £157.00 - -£157.01 - £866.00 13.8 12Over £866.00 13.8 2
Class 1A and 1B (employers only) 13.8%Class 2 (self-employed) £2.85 per week (small earnings exemption) £6,025Class 3 (voluntary) £14.25 per weekClass 4 (self-employed) 0% on profits up to £8,164 9% on profits from £8,164 to £45,000 2% on profits above £45,000 per annum
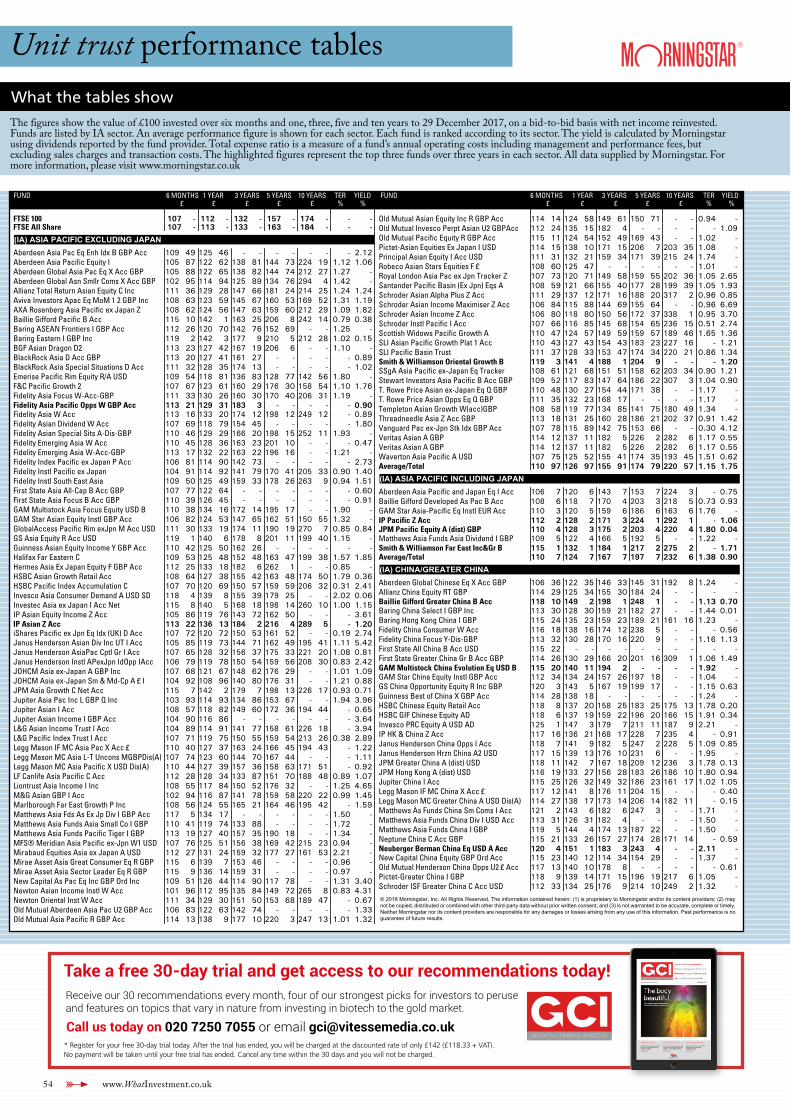
54 www.WhatInvestment.co.uk
Unit trust performance tablesWhat the tables show
The figures show the value of £100 invested over six months and one, three, five and ten years to 29 December 2017, on a bid-to-bid basis with net income reinvested. Funds are listed by IA sector. An average performance figure is shown for each sector. Each fund is ranked according to its sector. The yield is calculated by Morningstar using dividends reported by the fund provider. Total expense ratio is a measure of a fund’s annual operating costs including management and performance fees, but excluding sales charges and transaction costs. The highlighted figures represent the top three funds over three years in each sector. All data supplied by Morningstar. For more information, please visit www.morningstar.co.uk
FUND 6 MONTHS 1 YEAR 3 YEARS 5 YEARS 10 YEARS TER YIELD£ £ £ £ £ % %
FTSE 100 107 - 112 - 132 - 157 - 174 - - -FTSE All Share 107 - 113 - 133 - 163 - 184 - - -
(IA) ASIA PACIFIC EXCLUDING JAPANAberdeen Asia Pac Eq Enh Idx B GBP Acc 109 49 125 46 - - - - - - - 2.12Aberdeen Asia Pacific Equity I 105 87 122 62 138 81 144 73 224 19 1.12 1.06Aberdeen Global Asia Pac Eq X Acc GBP 105 88 122 65 138 82 144 74 212 27 1.27 -Aberdeen Global Asn Smllr Coms X Acc GBP 102 95 114 94 125 89 134 76 294 4 1.42 -Allianz Total Return Asian Equity C Inc 111 36 129 28 147 66 181 24 214 25 1.24 1.24Aviva Investors Apac Eq MoM 1 2 GBP Inc 108 63 123 59 145 67 160 53 169 52 1.31 1.19AXA Rosenberg Asia Pacific ex Japan Z 108 62 124 56 147 63 159 60 212 29 1.09 1.82Baillie Gifford Pacific B Acc 115 10 142 1 163 25 206 8 242 14 0.79 0.38Baring ASEAN Frontiers I GBP Acc 112 26 120 70 142 76 152 69 - - 1.25 -Baring Eastern I GBP Inc 119 2 142 3 177 9 210 5 212 28 1.02 0.15BGF Asian Dragon D2 113 23 127 42 167 19 206 6 - - 1.10 -BlackRock Asia D Acc GBP 113 20 127 41 161 27 - - - - - 0.89BlackRock Asia Special Situations D Acc 111 32 128 35 174 13 - - - - - 1.02Emerise Pacific Rim Equity R/A USD 109 54 118 81 136 83 128 77 142 56 1.80 -F&C Pacific Growth 2 107 67 123 61 160 29 176 30 158 54 1.10 1.76Fidelity Asia Focus W-Acc-GBP 111 33 130 26 160 30 170 40 206 31 1.19 -Fidelity Asia Pacific Opps W GBP Acc 113 21 129 31 183 3 - - - - - 0.90Fidelity Asia W Acc 113 16 133 20 174 12 198 12 249 12 - 0.89Fidelity Asian Dividend W Acc 107 69 118 79 154 45 - - - - - 1.80Fidelity Asian Special Sits A-Dis-GBP 110 46 129 29 166 20 198 15 252 11 1.93 -Fidelity Emerging Asia W Acc 110 45 128 36 163 23 201 10 - - - 0.47Fidelity Emerging Asia W-Acc-GBP 113 17 132 22 163 22 196 16 - - 1.21 -Fidelity Index Pacific ex Japan P Acc 106 81 114 90 142 73 - - - - - 2.73Fidelity Instl Pacific ex Japan 104 91 114 92 141 79 170 41 205 33 0.90 1.40Fidelity Instl South East Asia 109 50 125 49 159 33 178 26 263 9 0.94 1.51First State Asia All-Cap B Acc GBP 107 77 122 64 - - - - - - - 0.60First State Asia Focus B Acc GBP 110 39 126 45 - - - - - - - 0.91GAM Multistock Asia Focus Equity USD B 110 38 134 16 172 14 195 17 - - 1.90 -GAM Star Asian Equity Instl GBP Acc 106 82 124 53 147 65 162 51 150 55 1.32 -GlobalAccess Pacific Rim exJpn M Acc USD 111 30 133 19 174 11 190 19 270 7 0.85 0.84GS Asia Equity R Acc USD 119 1 140 6 178 8 201 11 199 40 1.15 -Guinness Asian Equity Income Y GBP Acc 110 42 125 50 162 26 - - - - - -Halifax Far Eastern C 109 53 125 48 152 48 163 47 199 38 1.57 1.85Hermes Asia Ex Japan Equity F GBP Acc 112 25 133 18 182 6 262 1 - - 0.85 -HSBC Asian Growth Retail Acc 108 64 127 38 155 42 163 48 174 50 1.79 0.36HSBC Pacific Index Accumulation C 107 70 120 69 150 57 159 59 206 32 0.31 2.41Invesco Asia Consumer Demand A USD SD 118 4 139 8 155 39 179 25 - - 2.02 0.06Investec Asia ex Japan I Acc Net 115 8 140 5 168 18 198 14 260 10 1.00 1.15IP Asian Equity Income Z Acc 105 86 119 76 143 72 162 50 - - - 3.61IP Asian Z Acc 113 22 136 13 184 2 216 4 289 5 - 1.20iShares Pacific ex Jpn Eq Idx (UK) D Acc 107 72 120 72 150 53 161 52 - - 0.19 2.74Janus Henderson Asian Div Inc UT I Acc 105 85 119 73 144 71 162 49 195 41 1.11 5.42Janus Henderson AsiaPac Cptl Gr I Acc 107 65 128 32 156 37 175 33 221 20 1.08 0.81Janus Henderson Instl APexJpn IdOpp IAcc 106 79 119 78 150 54 159 56 208 30 0.83 2.42JOHCM Asia ex-Japan A GBP Inc 107 68 121 67 148 62 176 29 - - 1.01 1.09JOHCM Asia ex-Japan Sm & Md-Cp A £ I 104 92 108 96 140 80 176 31 - - 1.21 0.88JPM Asia Growth C Net Acc 115 7 142 2 179 7 198 13 226 17 0.93 0.71Jupiter Asia Pac Inc L GBP Q Inc 103 93 114 93 134 86 153 67 - - 1.94 3.96Jupiter Asian I Acc 108 57 118 82 149 60 172 36 194 44 - 0.65Jupiter Asian Income I GBP Acc 104 90 116 86 - - - - - - - 3.64L&G Asian Income Trust I Acc 104 89 114 91 141 77 158 61 226 18 - 3.94L&G Pacific Index Trust I Acc 107 71 119 75 150 55 159 54 213 26 0.38 2.89Legg Mason IF MC Asia Pac X Acc £ 110 40 127 37 163 24 166 45 194 43 - 1.22Legg Mason MC Asia L-T Uncons MGBPDis(A) 107 74 123 60 144 70 167 44 - - - 1.11Legg Mason MC Asia Pacific X USD Dis(A) 110 44 127 39 157 36 158 63 171 51 - 0.92LF Canlife Asia Pacific C Acc 112 28 128 34 133 87 151 70 188 48 0.89 1.07Liontrust Asia Income I Inc 108 55 117 84 150 52 176 32 - - 1.25 4.65M&G Asian GBP I Acc 102 94 116 87 141 78 159 58 220 22 0.99 1.45Marlborough Far East Growth P Inc 108 56 124 55 165 21 164 46 195 42 - 1.59Matthews Asia Fds As Ex Jp Div I GBP Acc 117 5 134 17 - - - - - - 1.50 -Matthews Asia Funds Asia Small Co I GBP 110 41 119 74 133 88 - - - - 1.72 -Matthews Asia Funds Pacific Tiger I GBP 113 19 127 40 157 35 190 18 - - 1.34 -MFS® Meridian Asia Pacific ex-Jpn W1 USD 107 76 125 51 156 38 169 42 215 23 0.94 -Mirabaud Equities Asia ex Japan A USD 112 27 131 24 159 32 177 27 161 53 2.21 -Mirae Asset Asia Great Consumer Eq R GBP 115 6 139 7 153 46 - - - - 0.96 -Mirae Asset Asia Sector Leader Eq R GBP 115 9 136 14 159 31 - - - - 0.97 -New Capital As Pac Eq Inc GBP Ord Inc 109 51 126 44 114 90 117 78 - - 1.31 3.40Newton Asian Income Instl W Acc 101 96 112 95 135 84 149 72 265 8 0.83 4.31Newton Oriental Inst W Acc 111 34 129 30 151 50 153 68 189 47 - 0.67Old Mutual Aberdeen Asia Pac U2 GBP Acc 106 83 122 63 142 74 - - - - - 1.33Old Mutual Asia Pacific R GBP Acc 114 13 138 9 177 10 220 3 247 13 1.01 1.32
FUND 6 MONTHS 1 YEAR 3 YEARS 5 YEARS 10 YEARS TER YIELD£ £ £ £ £ % %
Old Mutual Asian Equity Inc R GBP Acc 114 14 124 58 149 61 150 71 - - 0.94 -Old Mutual Invesco Perpt Asian U2 GBPAcc 112 24 135 15 182 4 - - - - - 1.09Old Mutual Pacific Equity R GBP Acc 115 11 124 54 152 49 169 43 - - 1.02 -Pictet-Asian Equities Ex Japan I USD 114 15 138 10 171 15 206 7 203 35 1.08 -Principal Asian Equity I Acc USD 111 31 132 21 159 34 171 39 215 24 1.74 -Robeco Asian Stars Equities F £ 108 60 125 47 - - - - - - 1.01 -Royal London Asia Pac ex Jpn Tracker Z 107 73 120 71 149 58 159 55 202 36 1.05 2.65Santander Pacific Basin (Ex Jpn) Eqs A 108 59 121 66 155 40 177 28 199 39 1.05 1.93Schroder Asian Alpha Plus Z Acc 111 29 137 12 171 16 188 20 317 2 0.96 0.85Schroder Asian Income Maximiser Z Acc 106 84 115 88 144 69 155 64 - - 0.96 6.69Schroder Asian Income Z Acc 106 80 118 80 150 56 172 37 338 1 0.95 3.70Schroder Instl Pacific I Acc 107 66 116 85 145 68 154 65 236 15 0.51 2.74Scottish Widows Pacific Growth A 110 47 124 57 149 59 159 57 189 46 1.65 1.36SLI Asian Pacific Growth Plat 1 Acc 110 43 127 43 154 43 183 23 227 16 - 1.21SLI Pacific Basin Trust 111 37 128 33 153 47 174 34 220 21 0.86 1.34Smith & Williamson Oriental Growth B 119 3 141 4 188 1 204 9 - - - 1.20SSgA Asia Pacific ex-Japan Eq Tracker 108 61 121 68 151 51 158 62 203 34 0.90 1.21Stewart Investors Asia Pacific B Acc GBP 109 52 117 83 147 64 186 22 307 3 1.04 0.90T. Rowe Price Asian ex-Japan Eq Q GBP 110 48 130 27 154 44 171 38 - - 1.17 -T. Rowe Price Asian Opps Eq Q GBP 111 35 132 23 168 17 - - - - 1.17 -Templeton Asian Growth W(acc)GBP 108 58 119 77 134 85 141 75 180 49 1.34 -Threadneedle Asia Z Acc GBP 113 18 131 25 160 28 186 21 202 37 0.91 1.42Vanguard Pac ex-Jpn Stk Idx GBP Acc 107 78 115 89 142 75 153 66 - - 0.30 4.12Veritas Asian A GBP 114 12 137 11 182 5 226 2 282 6 1.17 0.55Veritas Asian A GBP 114 12 137 11 182 5 226 2 282 6 1.17 0.55Waverton Asia Pacific A USD 107 75 125 52 155 41 174 35 193 45 1.51 0.62Average/Total 110 97 126 97 155 91 174 79 220 57 1.15 1.75
(IA) ASIA PACIFIC INCLUDING JAPANAberdeen Asia Pacific and Japan Eq I Acc 106 7 120 6 143 7 153 7 224 3 - 0.75Baillie Gifford Developed As Pac B Acc 108 6 118 7 170 4 203 3 218 5 0.73 0.93GAM Star Asia-Pacific Eq Instl EUR Acc 110 3 120 5 159 6 186 6 163 6 1.76 -IP Pacific Z Acc 112 2 128 2 171 3 224 1 292 1 - 1.06JPM Pacific Equity A (dist) GBP 110 4 128 3 175 2 203 4 220 4 1.80 0.04Matthews Asia Funds Asia Dividend I GBP 109 5 122 4 166 5 192 5 - - 1.22 -Smith & Williamson Far East Inc&Gr B 115 1 132 1 184 1 217 2 275 2 - 1.71Average/Total 110 7 124 7 167 7 197 7 232 6 1.38 0.90
(IA) CHINA/GREATER CHINAAberdeen Global Chinese Eq X Acc GBP 106 36 122 35 146 33 145 31 192 8 1.24 -Allianz China Equity RT GBP 114 29 125 34 155 30 184 24 - - - -Baillie Gifford Greater China B Acc 118 10 149 2 198 1 248 1 - - 1.13 0.70Baring China Select I GBP Inc 113 30 128 30 159 21 182 27 - - 1.44 0.01Baring Hong Kong China I GBP 115 24 135 23 159 23 189 21 161 16 1.23 -Fidelity China Consumer W Acc 116 18 138 16 174 12 238 5 - - - 0.56Fidelity China Focus Y-Dis-GBP 113 32 130 28 170 16 220 9 - - 1.16 1.13First State All China B Acc USD 115 22 - - - - - - - - - -First State Greater China Gr B Acc GBP 114 26 130 29 166 20 201 16 309 1 1.06 1.49GAM Multistock China Evolution Eq USD B 115 20 140 11 194 2 - - - - 1.92 -GAM Star China Equity Instl GBP Acc 112 34 134 24 157 26 197 18 - - 1.04 -GS China Opportunity Equity R Inc GBP 120 3 143 5 167 19 199 17 - - 1.15 0.63Guinness Best of China X GBP Acc 114 28 138 18 - - - - - - 1.24 -HSBC Chinese Equity Retail Acc 118 8 137 20 158 25 183 25 175 13 1.78 0.20HSBC GIF Chinese Equity AD 118 6 137 19 159 22 196 20 166 15 1.91 0.34Invesco PRC Equity A USD AD 125 1 147 3 179 7 211 11 187 9 2.21 -IP HK & China Z Acc 117 16 136 21 168 17 228 7 235 4 - 0.91Janus Henderson China Opps I Acc 118 7 141 9 182 5 247 2 228 5 1.09 0.85Janus Henderson Hrzn China A2 USD 117 15 139 13 176 10 231 6 - - 1.95 -JPM Greater China A (dist) USD 118 11 142 7 167 18 209 12 236 3 1.78 0.13JPM Hong Kong A (dist) USD 116 19 133 27 156 28 183 26 186 10 1.80 0.94Jupiter China I Acc 115 25 126 32 149 32 186 23 161 17 1.02 1.05Legg Mason IF MC China X Acc £ 117 12 141 8 176 11 204 15 - - - 0.40Legg Mason MC Greater China A USD Dis(A) 114 27 138 17 173 14 206 14 182 11 - 0.15Matthews As Funds China Sm Coms I Acc 121 2 143 6 182 6 247 3 - - 1.71 -Matthews Asia Funds China Div I USD Acc 113 31 126 31 182 4 - - - - 1.50 -Matthews Asia Funds China I GBP 119 5 144 4 174 13 187 22 - - 1.50 -Neptune China C Acc GBP 115 21 133 26 157 27 174 28 171 14 - 0.59Neuberger Berman China Eq USD A Acc 120 4 151 1 183 3 243 4 - - 2.11 -New Capital China Equity GBP Ord Acc 115 23 140 12 114 34 154 29 - - 1.37 -Old Mutual Henderson China Opps U2 £ Acc 117 13 140 10 178 8 - - - - - 0.61Pictet-Greater China I GBP 118 9 139 14 171 15 196 19 217 6 1.05 -Schroder ISF Greater China C Acc USD 112 33 134 25 176 9 214 10 249 2 1.32 -© 2018 Morningstar, Inc. All Rights Reserved. The information contained herein: (1) is proprietary to Morningstar and/or its content providers; (2) maynot be copied, distributed or combined with other third-party data without prior written consent; and (3) is not warranted to be accurate, complete or timely.Neither Morningstar nor its content providers are responsible for any damages or losses arising from any use of this information. Past performance is noguarantee of future results.
FUND 6 MONTHS 1 YEAR 3 YEARS 5 YEARS 10 YEARS TER YIELD FUND 6 MONTHS 1 YEAR 3 YEARS 5 YEARS 10 YEARS TER YIELD £ £ £ £ £ % % £ £ £ £ £ % %
Subscribe today and receive 12 issues for £29.99*
Call us today on 020 7250 7055 or email [email protected]
Receive our 30 recommendations every month, four of our strongest picks for investors to peruse and features on topics that vary in nature from investing in biotech to the gold market.
Take a free 30-day trial and get access to our recommendations today!
* Register for your free 30-day trial today. After the trial has ended, you will be charged at the discounted rate of only £142 (£118.33 + VAT). No payment will be taken until your free trial has ended. Cancel any time within the 30 days and you will not be charged.
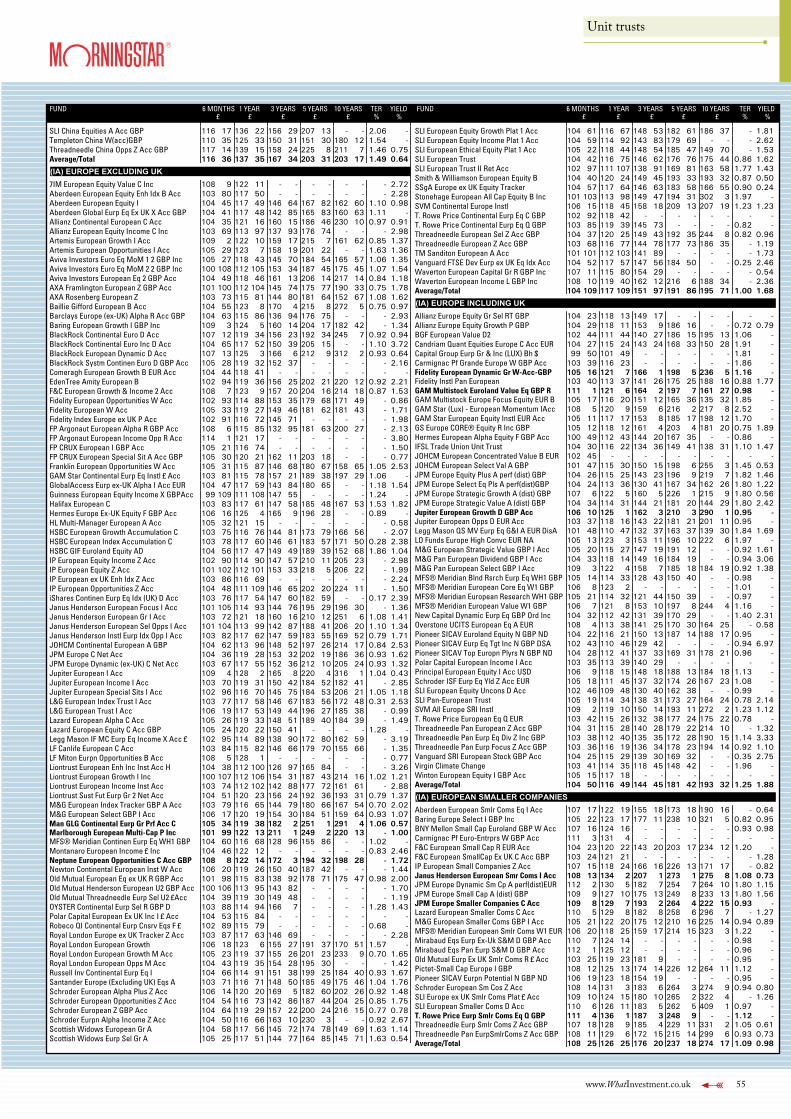
www.WhatInvestment.co.uk 55
Unit trusts
FUND 6 MONTHS 1 YEAR 3 YEARS 5 YEARS 10 YEARS TER YIELD£ £ £ £ £ % %
SLI China Equities A Acc GBP 116 17 136 22 156 29 207 13 - - 2.06 -Templeton China W(acc)GBP 110 35 125 33 150 31 151 30 180 12 1.54 -Threadneedle China Opps Z Acc GBP 117 14 139 15 158 24 225 8 211 7 1.46 0.75Average/Total 116 36 137 35 167 34 203 31 203 17 1.49 0.64
(IA) EUROPE EXCLUDING UK7IM European Equity Value C Inc 108 9 122 11 - - - - - - - 2.72Aberdeen European Equity Enh Idx B Acc 103 80 117 50 - - - - - - - 2.28Aberdeen European Equity I 104 45 117 49 146 64 167 82 162 60 1.10 0.98Aberdeen Global Eurp Eq Ex UK X Acc GBP 104 41 117 48 142 85 165 83 160 63 1.11 -Allianz Continental European C Acc 104 35 121 16 160 15 186 46 230 10 0.97 0.91Allianz European Equity Income C Inc 103 69 113 97 137 93 176 74 - - - 2.98Artemis European Growth I Acc 109 2 122 10 159 17 215 7 161 62 0.85 1.37Artemis European Opportunities I Acc 105 29 123 7 158 19 201 22 - - 1.63 1.36Aviva Investors Euro Eq MoM 1 2 GBP Inc 105 27 118 43 145 70 184 54 165 57 1.06 1.35Aviva Investors Euro Eq MoM 2 2 GBP Inc 100 108 112 105 153 34 187 45 175 45 1.07 1.54Aviva Investors European Eq 2 GBP Acc 104 49 118 46 161 13 206 14 217 14 0.84 1.18AXA Framlington European Z GBP Acc 101 100 112 104 145 74 175 77 190 33 0.75 1.78AXA Rosenberg European Z 103 73 115 81 144 80 181 64 152 67 1.08 1.62Baillie Gifford European B Acc 104 55 123 8 170 4 215 8 272 5 0.75 0.97Barclays Europe (ex-UK) Alpha R Acc GBP 104 63 115 86 136 94 176 75 - - - 2.93Baring European Growth I GBP Inc 109 3 124 5 160 14 204 17 182 42 - 1.34BlackRock Continental Euro D Acc 107 12 119 34 156 23 192 34 245 7 0.92 0.94BlackRock Continental Euro Inc D Acc 104 65 117 52 150 39 205 15 - - 1.10 3.72BlackRock European Dynamic D Acc 107 13 125 3 166 6 212 9 312 2 0.93 0.64BlackRock Systm Continen Euro D GBP Acc 105 28 119 32 152 37 - - - - - 2.16Comeragh European Growth B EUR Acc 104 44 118 41 - - - - - - - -EdenTree Amity European B 102 94 119 36 156 25 202 21 220 12 0.92 2.21F&C European Growth & Income 2 Acc 108 7 123 9 157 20 204 16 214 18 0.87 1.53Fidelity European Opportunities W Acc 102 93 114 88 153 35 179 68 171 49 - 0.86Fidelity European W Acc 105 33 119 27 149 46 181 62 181 43 - 1.71Fidelity Index Europe ex UK P Acc 102 91 116 72 145 71 - - - - - 1.98FP Argonaut European Alpha R GBP Acc 108 6 115 85 132 95 181 63 200 27 - 2.13FP Argonaut European Income Opp R Acc 114 1 121 17 - - - - - - - 3.80FP CRUX European I GBP Acc 105 21 116 74 - - - - - - - 1.50FP CRUX European Special Sit A Acc GBP 105 30 120 21 162 11 203 18 - - - 0.77Franklin European Opportunities W Acc 105 31 115 87 146 68 180 67 158 65 1.05 2.53GAM Star Continental Eurp Eq Instl £ Acc 103 81 115 78 157 21 189 38 197 29 1.06 -GlobalAccess Eurp ex-UK Alpha I Acc EUR 104 47 117 59 143 84 180 65 - - 1.18 1.54Guinness European Equity Income X GBPAcc 99 109 111 108 147 55 - - - - 1.24 -Halifax European C 103 83 117 61 147 58 185 48 167 53 1.53 1.82Hermes Europe Ex-UK Equity F GBP Acc 106 16 125 4 165 9 196 28 - - 0.89 -HL Multi-Manager European A Acc 105 32 121 15 - - - - - - - 0.58HSBC European Growth Accumulation C 103 75 116 76 144 81 173 79 166 56 - 2.07HSBC European Index Accumulation C 103 78 117 60 146 61 183 57 171 50 0.28 2.38HSBC GIF Euroland Equity AD 104 56 117 47 149 49 189 39 152 68 1.86 1.04IP European Equity Income Z Acc 102 90 114 90 147 57 210 11 205 23 - 2.98IP European Equity Z Acc 101 102 112 101 153 33 218 5 206 22 - 1.99IP European ex UK Enh Idx Z Acc 103 86 116 69 - - - - - - - 2.24IP European Opportunities Z Acc 104 48 111 109 146 65 202 20 224 11 - 1.50iShares Continen Eurp Eq Idx (UK) D Acc 103 76 117 54 147 60 182 59 - - 0.17 2.39Janus Henderson European Focus I Acc 101 105 114 93 144 76 195 29 196 30 - 1.36Janus Henderson European Gr I Acc 103 72 121 18 160 16 210 12 251 6 1.08 1.41Janus Henderson European Sel Opps I Acc 101 104 113 99 142 87 188 41 206 20 1.10 1.34Janus Henderson Instl Eurp Idx Opp I Acc 103 82 117 62 147 59 183 55 169 52 0.79 1.71JOHCM Continental European A GBP 104 62 113 96 148 52 197 26 214 17 0.84 2.53JPM Europe C Net Acc 104 36 119 28 153 32 202 19 186 36 0.93 1.62JPM Europe Dynamic (ex-UK) C Net Acc 103 67 117 55 152 36 212 10 205 24 0.93 1.32Jupiter European I Acc 109 4 128 2 165 8 220 4 316 1 1.04 0.43Jupiter European Income I Acc 103 70 119 31 150 42 184 52 182 41 - 2.85Jupiter European Special Sits I Acc 102 96 116 70 145 75 184 53 206 21 1.05 1.18L&G European Index Trust I Acc 103 77 117 58 146 67 183 56 172 48 0.31 2.53L&G European Trust I Acc 106 19 117 53 149 44 196 27 185 38 - 0.99Lazard European Alpha C Acc 105 26 119 33 148 51 189 40 184 39 - 1.49Lazard European Equity C Acc GBP 105 24 120 22 150 41 - - - - 1.28 -Legg Mason IF MC Eurp Eq Income X Acc £ 102 95 114 89 138 90 172 80 162 59 - 3.19LF Canlife European C Acc 103 84 115 82 146 66 179 70 155 66 - 1.35LF Miton Eurpn Opportunities B Acc 108 5 128 1 - - - - - - - 0.77Liontrust European Enh Inc Inst Acc H 104 38 112 100 126 97 165 84 - - - 3.26Liontrust European Growth I Inc 100 107 112 106 154 31 187 43 214 16 1.02 1.21Liontrust European Income Inst Acc 103 74 112 102 142 88 177 72 161 61 - 2.88Liontrust Sust Fut Eurp Gr 2 Net Acc 104 51 120 23 156 24 192 36 193 31 0.79 1.37M&G European Index Tracker GBP A Acc 103 79 116 65 144 79 180 66 167 54 0.70 2.02M&G European Select GBP I Acc 106 17 120 19 154 30 184 51 159 64 0.93 1.07Man GLG Continental Eurp Gr Prf Acc C 105 34 119 38 182 2 251 1 291 4 1.06 0.57Marlborough European Multi-Cap P Inc 101 99 122 13 211 1 249 2 220 13 - 1.00MFS® Meridian Continen Eurp Eq WH1 GBP 104 60 116 68 128 96 155 86 - - 1.02 -Montanaro European Income £ Inc 104 46 122 12 - - - - - - 0.83 2.46Neptune European Opportunities C Acc GBP 108 8 122 14 172 3 194 32 198 28 - 1.72Newton Continental European Inst W Acc 106 20 119 26 150 40 187 42 - - - 1.44Old Mutual European Eq ex UK R GBP Acc 101 98 115 83 138 92 178 71 175 47 0.98 2.00Old Mutual Henderson European U2 GBP Acc 100 106 113 95 143 82 - - - - - 1.70Old Mutual Threadneedle Eurp Sel U2 £Acc 104 39 119 30 149 48 - - - - - 1.19OYSTER Continental Eurp Sel R GBP D 103 88 114 94 166 7 - - - - 1.28 1.43Polar Capital European Ex UK Inc I £ Acc 104 53 115 84 - - - - - - - -Robeco QI Continental Eurp Cnsrv Eqs F £ 102 89 115 79 - - - - - - 0.68 -Royal London Europe ex UK Tracker Z Acc 103 87 117 63 146 69 - - - - - 2.28Royal London European Growth 106 18 123 6 155 27 191 37 170 51 1.57 -Royal London European Growth M Acc 105 23 119 37 155 26 201 23 233 9 0.70 1.65Royal London European Opps M Acc 104 43 119 35 154 28 195 30 - - - 1.42Russell Inv Continental Eurp Eq I 104 66 114 91 151 38 199 25 184 40 0.93 1.67Santander Europe (Excluding UK) Eqs A 103 71 116 71 148 50 185 49 175 46 1.04 1.76Schroder European Alpha Plus Z Acc 106 14 120 20 169 5 182 60 202 26 0.92 1.48Schroder European Opportunities Z Acc 104 54 116 73 142 86 187 44 204 25 0.85 1.75Schroder European Z GBP Acc 104 64 119 29 157 22 200 24 216 15 0.77 0.78Schroder Eurpn Alpha Income Z Acc 104 50 116 66 163 10 230 3 - - 0.92 2.67Scottish Widows European Gr A 104 58 117 56 145 72 174 78 149 69 1.63 1.14Scottish Widows Eurp Sel Gr A 105 25 117 51 144 77 164 85 145 71 1.63 0.54
FUND 6 MONTHS 1 YEAR 3 YEARS 5 YEARS 10 YEARS TER YIELD£ £ £ £ £ % %
SLI European Equity Growth Plat 1 Acc 104 61 116 67 148 53 182 61 186 37 - 1.81SLI European Equity Income Plat 1 Acc 104 59 114 92 143 83 179 69 - - - 2.62SLI European Ethical Equity Plat 1 Acc 105 22 118 44 148 54 185 47 149 70 - 1.53SLI European Trust 104 42 116 75 146 62 176 76 175 44 0.86 1.62SLI European Trust II Ret Acc 102 97 111 107 138 91 169 81 163 58 1.77 1.43Smith & Williamson European Equity B 104 40 120 24 149 45 193 33 193 32 0.87 0.50SSgA Europe ex UK Equity Tracker 104 57 117 64 146 63 183 58 166 55 0.90 0.24Stonehage European All Cap Equity B Inc 101 103 113 98 149 47 194 31 302 3 1.97 -SVM Continental Europe Instl 106 15 118 45 158 18 209 13 207 19 1.23 1.23T. Rowe Price Continental Eurp Eq C GBP 102 92 118 42 - - - - - - - -T. Rowe Price Continental Eurp Eq Q GBP 103 85 119 39 145 73 - - - - 0.82 -Threadneedle European Sel Z Acc GBP 104 37 120 25 149 43 192 35 244 8 0.82 0.96Threadneedle European Z Acc GBP 103 68 116 77 144 78 177 73 186 35 - 1.19TM Sanditon European A Acc 101 101 112 103 141 89 - - - - - 1.73Vanguard FTSE Dev Eurp ex UK Eq Idx Acc 104 52 117 57 147 56 184 50 - - 0.25 2.46Waverton European Capital Gr R GBP Inc 107 11 115 80 154 29 - - - - - 0.54Waverton European Income L GBP Inc 108 10 119 40 162 12 216 6 188 34 - 2.36Average/Total 104 109 117 109 151 97 191 86 195 71 1.00 1.68
(IA) EUROPE INCLUDING UKAllianz Europe Equity Gr Sel RT GBP 104 23 118 13 149 17 - - - - - -Allianz Europe Equity Growth P GBP 104 29 118 11 153 9 186 16 - - 0.72 0.79BGF European Value D2 102 44 111 44 140 27 186 15 195 13 1.06 -Candriam Quant Equities Europe C Acc EUR 104 27 115 24 143 24 168 33 150 28 1.91 -Capital Group Eurp Gr & Inc (LUX) Bh $ 99 50 101 49 - - - - - - 1.81 -Carmignac Pf Grande Europe W GBP Acc 103 39 116 23 - - - - - - 1.86 -Fidelity European Dynamic Gr W-Acc-GBP 105 16 121 7 166 1 198 5 236 5 1.16 -Fidelity Instl Pan European 103 40 113 37 141 26 175 25 188 16 0.88 1.77GAM Multistock Euroland Value Eq GBP R 111 1 121 6 164 2 197 7 161 27 0.98 -GAM Multistock Europe Focus Equity EUR B 105 17 116 20 151 12 165 36 135 32 1.85 -GAM Star (Lux) - European Momentum IAcc 108 5 120 9 159 6 216 2 217 8 2.52 -GAM Star European Equity Instl EUR Acc 105 11 117 17 153 8 185 17 198 12 1.70 -GS Europe CORE® Equity R Inc GBP 105 12 118 12 161 4 203 4 181 20 0.75 1.89Hermes European Alpha Equity F GBP Acc 100 49 112 43 144 20 167 35 - - 0.86 -IFSL Trade Union Unit Trust 104 30 116 22 134 36 149 41 138 31 1.10 1.47JOHCM European Concentrated Value B EUR 102 45 - - - - - - - - - -JOHCM European Select Val A GBP 101 47 115 30 150 15 198 6 255 3 1.45 0.53JPM Europe Equity Plus A perf (dist) GBP 104 26 115 25 143 23 196 9 219 7 1.82 1.46JPM Europe Select Eq Pls A perf(dist)GBP 104 24 113 36 130 41 167 34 162 26 1.80 1.22JPM Europe Strategic Growth A (dist) GBP 107 6 122 5 160 5 226 1 215 9 1.80 0.56JPM Europe Strategic Value A (dist) GBP 104 34 114 31 144 21 181 20 144 29 1.80 2.42Jupiter European Growth D GBP Acc 106 10 125 1 162 3 210 3 290 1 0.95 -Jupiter European Opps D EUR Acc 103 37 118 16 143 22 181 21 201 11 0.95 -Legg Mason QS MV Eurp Eq G&I A EUR DisA 101 48 110 47 132 37 163 37 139 30 1.84 1.69LO Funds Europe High Convc EUR NA 105 13 123 3 153 11 196 10 222 6 1.97 -M&G European Strategic Value GBP I Acc 105 20 115 27 147 19 191 12 - - 0.92 1.61M&G Pan European Dividend GBP I Acc 104 33 118 14 149 16 184 19 - - 0.94 3.06M&G Pan European Select GBP I Acc 109 3 122 4 158 7 185 18 184 19 0.92 1.38MFS® Meridian Blnd Rsrch Eurp Eq WH1 GBP 105 14 114 33 128 43 150 40 - - 0.98 -MFS® Meridian European Core Eq W1 GBP 106 8 123 2 - - - - - - 1.01 -MFS® Meridian European Research WH1 GBP 105 21 114 32 121 44 150 39 - - 0.97 -MFS® Meridian European Value W1 GBP 106 7 121 8 153 10 197 8 244 4 1.16 -New Capital Dynamic Eurp Eq GBP Ord Inc 104 32 112 42 131 39 170 29 - - 1.40 2.31Overstone UCITS European Eq A EUR 108 4 113 38 141 25 170 30 164 25 - 0.58Pioneer SICAV Euroland Equity N GBP ND 104 22 116 21 150 13 187 14 188 17 0.95 -Pioneer SICAV Eurp Eq Tgt Inc N GBP DSA 102 43 110 46 129 42 - - - - 0.94 6.97Pioneer SICAV Top Europn Plyrs N GBP ND 104 28 112 41 137 33 169 31 178 21 0.96 -Polar Capital European Income I Acc 103 35 113 39 140 29 - - - - - -Principal European Equity I Acc USD 106 9 118 15 148 18 188 13 184 18 1.13 -Schroder ISF Eurp Eq Yld Z Acc EUR 105 18 111 45 137 32 174 26 167 23 1.08 -SLI European Equity Uncons D Acc 102 46 109 48 130 40 162 38 - - 0.99 -SLI Pan-European Trust 105 19 114 34 138 31 173 27 164 24 0.78 2.14SVM All Europe SRI Instl 109 2 119 10 150 14 193 11 272 2 1.23 1.12T. Rowe Price European Eq Q EUR 103 42 115 26 132 38 177 24 175 22 0.78 -Threadneedle Pan European Z Acc GBP 104 31 115 28 140 28 179 22 214 10 - 1.32Threadneedle Pan Eurp Eq Div Z Inc GBP 103 38 112 40 135 35 172 28 190 15 1.14 3.33Threadneedle Pan Eurp Focus Z Acc GBP 103 36 116 19 136 34 178 23 194 14 0.92 1.10Vanguard SRI European Stock GBP Acc 104 25 115 29 139 30 169 32 - - 0.35 2.75Virgin Climate Change 103 41 114 35 118 45 148 42 - - 1.96 -Winton European Equity I GBP Acc 105 15 117 18 - - - - - - - -Average/Total 104 50 116 49 144 45 181 42 193 32 1.25 1.88
(IA) EUROPEAN SMALLER COMPANIESAberdeen European Smlr Coms Eq I Acc 107 17 122 19 155 18 173 18 190 16 - 0.64Baring Europe Select I GBP Inc 105 22 123 17 177 11 238 10 321 5 0.82 0.95BNY Mellon Small Cap Euroland GBP W Acc 107 16 124 16 - - - - - - 0.93 0.98Carmignac Pf Euro-Entrprs W GBP Acc 111 3 131 4 - - - - - - - -F&C European Small Cap R EUR Acc 104 23 120 22 143 20 203 17 234 12 1.20 -F&C European SmallCap Ex UK C Acc GBP 103 24 121 21 - - - - - - - 1.28IP European Small Companies Z Acc 107 15 118 24 166 16 226 13 171 17 - 0.82Janus Henderson European Smr Coms I Acc 108 13 134 2 207 1 273 1 275 8 1.08 0.73JPM Europe Dynamic Sm Cp A perf(dist)EUR 112 2 130 5 182 7 254 7 264 10 1.80 1.15JPM Europe Small Cap A (dist) GBP 109 9 127 10 175 13 249 8 233 13 1.80 1.56JPM Europe Smaller Companies C Acc 109 8 129 7 193 2 264 4 222 15 0.93 -Lazard European Smaller Coms C Acc 110 5 129 8 182 8 258 6 296 7 - 1.27M&G European Smaller Coms GBP I Acc 105 21 122 20 175 12 210 16 225 14 0.94 0.89MFS® Meridian European Smlr Coms W1 EUR 106 20 118 25 159 17 214 15 323 3 1.22 -Mirabaud Eqs Eurp Ex-Uk S&M D GBP Acc 110 7 124 14 - - - - - - 0.98 -Mirabaud Eqs Pan Eurp S&M D GBP Acc 112 1 125 12 - - - - - - 0.96 -Old Mutual Eurp Ex UK Smlr Coms R £ Acc 103 25 119 23 181 9 - - - - 0.95 -Pictet-Small Cap Europe I GBP 108 12 125 13 174 14 226 12 264 11 1.12 -Pioneer SICAV Eurpn Potential N GBP ND 106 19 123 18 154 19 - - - - 0.95 -Schroder European Sm Cos Z Acc 108 14 131 3 183 6 264 3 274 9 0.94 0.80SLI Europe ex UK Smlr Coms Plat £ Acc 109 10 124 15 180 10 265 2 322 4 - 1.26SLI European Smaller Coms D Acc 110 6 126 11 183 5 262 5 409 1 0.97 -T. Rowe Price Eurp Smlr Coms Eq Q GBP 111 4 136 1 187 3 248 9 - - 1.12 -Threadneedle Eurp Smlr Coms Z Acc GBP 107 18 128 9 185 4 229 11 331 2 1.05 0.61Threadneedle Pan EurpSmlrComs Z Acc GBP 108 11 129 6 172 15 215 14 299 6 0.93 0.73Average/Total 108 25 126 25 176 20 237 18 274 17 1.09 0.98
FUND 6 MONTHS 1 YEAR 3 YEARS 5 YEARS 10 YEARS TER YIELD FUND 6 MONTHS 1 YEAR 3 YEARS 5 YEARS 10 YEARS TER YIELD £ £ £ £ £ % % £ £ £ £ £ % %
* Register for your free 30-day trial today. After the trial has ended, you will be charged at the discounted rate of only £142 (£118.33 + VAT). No payment will be taken until your free trial has ended. Cancel any time within the 30 days and you will not be charged.
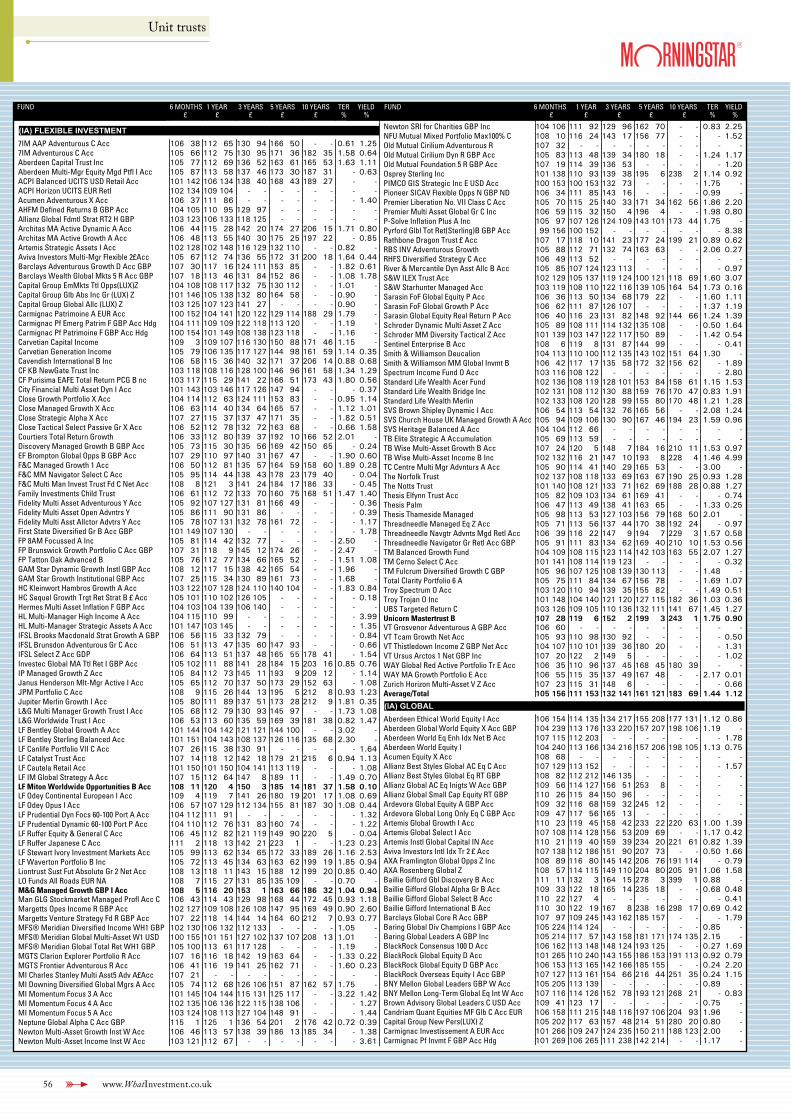
56 www.WhatInvestment.co.uk
Unit trusts
FUND 6 MONTHS 1 YEAR 3 YEARS 5 YEARS 10 YEARS TER YIELD£ £ £ £ £ % %
(IA) FLEXIBLE INVESTMENT7IM AAP Adventurous C Acc 106 38 112 65 130 94 166 50 - - 0.61 1.257IM Adventurous C Acc 105 66 112 75 130 95 171 36 182 35 1.58 0.64Aberdeen Capital Trust Inc 105 77 112 69 136 52 163 61 165 53 1.63 1.11Aberdeen Multi-Mgr Equity Mgd Ptfl I Acc 105 87 113 58 137 46 173 30 187 31 - 0.63ACPI Balanced UCITS USD Retail Acc 101 142 106 134 138 40 168 43 189 27 - -ACPI Horizon UCITS EUR Retl 102 134 109 104 - - - - - - - -Acumen Adventurous X Acc 106 37 111 86 - - - - - - - 1.40AHFM Defined Returns B GBP Acc 104 105 110 95 129 97 - - - - - -Allianz Global Fdmtl Strat RT2 H GBP 103 123 106 133 118 125 - - - - - -Architas MA Active Dynamic A Acc 106 44 115 28 142 20 174 27 206 15 1.71 0.80Architas MA Active Growth A Acc 106 48 113 55 140 30 175 25 197 22 - 0.85Artemis Strategic Assets I Acc 102 128 102 148 116 129 132 110 - - 0.82 -Aviva Investors Multi-Mgr Flexible 2£Acc 105 67 112 74 136 55 172 31 200 18 1.64 0.44Barclays Adventurous Growth D Acc GBP 107 30 117 16 124 111 153 85 - - 1.82 0.61Barclays Wealth Global Mkts 5 R Acc GBP 107 18 113 46 131 84 152 86 - - 1.08 1.78Capital Group EmMkts Ttl Opps(LUX)Z 104 108 108 117 132 75 130 112 - - 1.01 -Capital Group Glb Abs Inc Gr (LUX) Z 101 146 105 138 132 80 164 58 - - 0.90 -Capital Group Global Allc (LUX) Z 103 125 107 123 141 27 - - - - 0.90 -Carmignac Patrimoine A EUR Acc 100 152 104 141 120 122 129 114 188 29 1.79 -Carmignac Pf Emerg Patrim F GBP Acc Hdg 104 111 109 109 122 118 113 120 - - 1.19 -Carmignac Pf Patrimoine F GBP Acc Hdg 100 154 101 149 108 138 123 118 - - 1.16 -Carvetian Capital Income 109 3 109 107 116 130 150 88 171 46 1.15 -Carvetian Generation Income 105 79 106 135 117 127 144 98 161 59 1.14 0.35Cavendish International B Inc 106 58 115 36 140 32 171 37 206 14 0.88 0.68CF KB NewGate Trust Inc 103 118 108 116 128 100 146 96 161 58 1.34 1.29CF Purisima EAFE Total Return PCG B nc 103 117 115 29 141 22 166 51 173 43 1.80 0.56City Financial Multi Asset Dyn I Acc 101 143 103 146 117 126 147 94 - - - 0.37Close Growth Portfolio X Acc 104 114 112 63 124 111 153 83 - - 0.95 1.14Close Managed Growth X Acc 106 63 114 40 134 64 165 57 - - 1.12 1.01Close Strategic Alpha X Acc 107 27 115 37 137 47 171 35 - - 1.82 0.51Close Tactical Select Passive Gr X Acc 106 52 112 78 132 72 163 68 - - 0.66 1.58Courtiers Total Return Growth 106 33 112 80 139 37 192 10 166 52 2.01 -Discovery Managed Growth B GBP Acc 105 73 115 30 135 56 169 42 150 65 - 0.24EF Brompton Global Opps B GBP Acc 107 29 110 97 140 31 167 47 - - 1.90 0.60F&C Managed Growth 1 Acc 106 50 112 81 135 57 164 59 158 60 1.89 0.28F&C MM Navigator Select C Acc 105 95 114 44 138 43 178 23 179 40 - 0.04F&C Multi Man Invest Trust Fd C Net Acc 108 8 121 3 141 24 184 17 186 33 - 0.45Family Investments Child Trust 106 61 112 72 133 70 160 75 168 51 1.47 1.40Fidelity Multi Asset Adventurous Y Acc 105 92 107 127 131 81 166 49 - - - 0.36Fidelity Multi Asset Open Advntrs Y 105 86 111 90 131 86 - - - - - 0.39Fidelity Multi Asst Allctor Advtrs Y Acc 105 78 107 131 132 78 161 72 - - - 1.17First State Diversified Gr B Acc GBP 101 149 107 130 - - - - - - - 1.78FP 8AM Focussed A Inc 105 81 114 42 132 77 - - - - 2.50 -FP Brunswick Growth Portfolio C Acc GBP 107 31 118 9 145 12 174 26 - - 2.47 -FP Tatton Oak Advanced B 105 76 112 77 134 66 165 52 - - 1.51 1.08GAM Star Dynamic Growth Instl GBP Acc 108 12 117 15 138 42 165 54 - - 1.96 -GAM Star Growth Institutional GBP Acc 107 25 115 34 130 89 161 73 - - 1.68 -HC Kleinwort Hambros Growth A Acc 103 122 107 128 124 110 140 104 - - 1.83 0.84HC Sequel Growth Trgt Ret Strat B £ Acc 105 101 110 102 126 105 - - - - - 0.18Hermes Multi Asset Inflation F GBP Acc 104 103 104 139 106 140 - - - - - -HL Multi-Manager High Income A Acc 104 115 110 99 - - - - - - - 3.99HL Multi-Manager Strategic Assets A Acc 101 147 103 145 - - - - - - - 1.35IFSL Brooks Macdonald Strat Growth A GBP 106 56 115 33 132 79 - - - - - 0.84IFSL Brunsdon Adventurous Gr C Acc 106 51 113 47 135 60 147 93 - - - 0.66IFSL Select Z Acc GDP 106 64 113 51 137 48 165 55 178 41 - 1.54Investec Global MA Ttl Ret I GBP Acc 105 102 111 88 141 28 184 15 203 16 0.85 0.76IP Managed Growth Z Acc 105 84 112 73 145 11 193 9 209 12 - 1.14Janus Henderson Mlt-Mgr Active I Acc 105 65 112 70 137 50 173 29 152 63 - 1.08JPM Portfolio C Acc 108 9 115 26 144 13 195 5 212 8 0.93 1.23Jupiter Merlin Growth I Acc 105 80 111 89 137 51 173 28 212 9 1.81 0.35L&G Multi Manager Growth Trust I Acc 105 68 112 79 130 93 145 97 - - 1.73 1.08L&G Worldwide Trust I Acc 106 53 113 60 135 59 169 39 181 38 0.82 1.47LF Bentley Global Growth A Acc 101 144 104 142 121 121 144 100 - - 3.02 -LF Bentley Sterling Balanced Acc 101 151 104 143 108 137 126 116 135 68 2.30 -LF Canlife Portfolio VII C Acc 107 26 115 38 130 91 - - - - - 1.64LF Catalyst Trust Acc 107 14 118 12 142 18 179 21 215 6 0.94 1.13LF Cautela Retail Acc 101 150 101 150 104 141 113 119 - - - 1.08LF IM Global Strategy A Acc 107 15 112 64 147 8 189 11 - - 1.49 0.70LF Miton Worldwide Opportunities B Acc 108 11 120 4 150 3 185 14 181 37 1.58 0.10LF Odey Continental European I Acc 109 4 119 7 141 26 180 19 201 17 1.08 0.69LF Odey Opus I Acc 106 57 107 129 112 134 155 81 187 30 1.08 0.44LF Prudential Dyn Focs 60-100 Port A Acc 104 112 111 91 - - - - - - - 1.32LF Prudential Dynamic 60-100 Port P Acc 104 110 112 76 131 83 160 74 - - - 1.22LF Ruffer Equity & General C Acc 106 45 112 82 121 119 149 90 220 5 - 0.04LF Ruffer Japanese C Acc 111 2 118 13 142 21 223 1 - - 1.23 0.23LF Stewart Ivory Investment Markets Acc 105 99 113 62 134 65 172 33 189 26 1.16 2.53LF Waverton Portfolio B Inc 105 72 113 45 134 63 163 62 199 19 1.85 0.94Liontrust Sust Fut Absolute Gr 2 Net Acc 108 13 118 11 143 15 188 12 199 20 0.85 0.40LO Funds All Roads EUR NA 108 7 115 27 131 85 135 109 - - 0.70 -M&G Managed Growth GBP I Acc 108 5 116 20 153 1 163 66 186 32 1.04 0.94Man GLG Stockmarket Managed Profl Acc C 106 43 114 43 129 98 168 44 172 45 0.93 1.18Margetts Opes Income R GBP Acc 102 127 109 108 126 108 147 95 169 49 0.90 2.60Margetts Venture Strategy Fd R GBP Acc 107 22 118 14 144 14 164 60 212 7 0.93 0.77MFS® Meridian Diversified Income WH1 GBP 102 130 106 132 112 133 - - - - 1.05 -MFS® Meridian Global Multi-Asset W1 USD 100 155 101 151 127 102 137 107 208 13 1.01 -MFS® Meridian Global Total Ret WH1 GBP 105 100 113 61 117 128 - - - - 1.19 -MGTS Clarion Explorer Portfolio R Acc 107 16 116 18 142 19 163 64 - - 1.33 0.22MGTS Frontier Adventurous R Acc 106 41 116 19 141 25 162 71 - - 1.60 0.23MI Charles Stanley Multi Asst5 Adv A£Acc 107 21 - - - - - - - - - -MI Downing Diversified Global Mgrs A Acc 105 74 112 68 126 106 151 87 162 57 1.75 -MI Momentum Focus 3 A Acc 101 145 104 144 115 131 125 117 - - 3.22 1.42MI Momentum Focus 4 A Acc 102 135 106 136 122 115 138 106 - - - 1.27MI Momentum Focus 5 A Acc 103 124 108 113 127 104 148 91 - - - 1.44Neptune Global Alpha C Acc GBP 115 1 125 1 136 54 201 2 176 42 0.72 0.39Newton Multi-Asset Growth Inst W Acc 106 46 113 57 138 39 186 13 185 34 - 1.38Newton Multi-Asset Income Inst W Acc 103 121 112 67 - - - - - - - 3.61
FUND 6 MONTHS 1 YEAR 3 YEARS 5 YEARS 10 YEARS TER YIELD£ £ £ £ £ % %
Newton SRI for Charities GBP Inc 104 106 111 92 129 96 162 70 - - 0.83 2.25NFU Mutual Mixed Portfolio Max100% C 108 10 116 24 143 17 156 77 - - - 1.52Old Mutual Cirilium Adventurous R 107 32 - - - - - - - - - -Old Mutual Cirilium Dyn R GBP Acc 105 83 113 48 139 34 180 18 - - 1.24 1.17Old Mutual Foundation 5 R GBP Acc 107 19 114 39 136 53 - - - - - 1.20Osprey Sterling Inc 101 138 110 93 139 38 195 6 238 2 1.14 0.92PIMCO GIS Strategic Inc E USD Acc 100 153 100 153 132 73 - - - - 1.75 -Pioneer SICAV Flexible Opps N GBP ND 106 34 111 85 143 16 - - - - 0.99 -Premier Liberation No. VII Class C Acc 105 70 115 25 140 33 171 34 162 56 1.86 2.20Premier Multi Asset Global Gr C Inc 106 59 115 32 150 4 196 4 - - 1.98 0.80P-Solve Inflation Plus A Inc 105 97 107 126 124 109 143 101 173 44 1.75 -Pyrford Glbl Tot Ret(Sterling)B GBP Acc 99 156 100 152 - - - - - - - 8.38Rathbone Dragon Trust £ Acc 107 17 118 10 141 23 177 24 199 21 0.89 0.62RBS INV Adventurous Growth 105 88 112 71 132 74 163 63 - - 2.06 0.27RHFS Diversified Strategy C Acc 106 49 113 52 - - - - - - - -River & Mercantile Dyn Asst Allc B Acc 105 85 107 124 123 113 - - - - - 0.97S&W ILEX Trust Acc 102 129 105 137 119 124 100 121 118 69 1.60 3.07S&W Starhunter Managed Acc 103 119 108 110 122 116 139 105 164 54 1.73 0.16Sarasin FoF Global Equity P Acc 106 36 113 50 134 68 179 22 - - 1.60 1.11Sarasin FoF Global Growth P Acc 106 62 111 87 126 107 - - - - 1.37 1.19Sarasin Global Equity Real Return P Acc 106 40 116 23 131 82 148 92 144 66 1.24 1.39Schroder Dynamic Multi Asset Z Acc 105 89 108 111 114 132 135 108 - - 0.50 1.64Schroder MM Diversity Tactical Z Acc 101 139 103 147 122 117 150 89 - - 1.42 0.54Sentinel Enterprise B Acc 108 6 119 8 131 87 144 99 - - - 0.41Smith & Williamson Deucalion 104 113 110 100 112 135 143 102 151 64 1.30 -Smith & Williamson MM Global Invmt B 106 42 117 17 135 58 172 32 156 62 - 1.89Spectrum Income Fund O Acc 103 116 108 122 - - - - - - - 2.80Standard Life Wealth Acer Fund 102 136 108 119 128 101 153 84 158 61 1.15 1.53Standard Life Wealth Bridge Inc 102 131 108 112 130 88 159 76 170 47 0.83 1.91Standard Life Wealth Merlin 102 133 108 120 128 99 155 80 170 48 1.21 1.28SVS Brown Shipley Dynamic I Acc 106 54 113 54 132 76 165 56 - - 2.08 1.24SVS Church House UK Managed Growth A Acc 105 94 109 106 130 90 167 46 194 23 1.59 0.96SVS Heritage Balanced A Acc 104 104 112 66 - - - - - - - -TB Elite Strategic A Accumulation 105 69 113 59 - - - - - - - -TB Wise Multi-Asset Growth B Acc 107 24 120 5 148 7 184 16 210 11 1.53 0.97TB Wise Multi-Asset Income B Inc 102 132 116 21 147 10 193 8 228 4 1.46 4.99TC Centre Multi Mgr Advnturs A Acc 105 90 114 41 140 29 165 53 - - 3.00 -The Norfolk Trust 102 137 108 118 133 69 163 67 190 25 0.93 1.28The Notts Trust 101 140 108 121 133 71 162 69 188 28 0.88 1.27Thesis Elfynn Trust Acc 105 82 109 103 134 61 169 41 - - - 0.74Thesis Palm 106 47 113 49 138 41 163 65 - - 1.33 0.25Thesis Thameside Managed 105 98 113 53 127 103 156 79 168 50 2.01 -Threadneedle Managed Eq Z Acc 105 71 113 56 137 44 170 38 192 24 - 0.97Threadneedle Navgtr Advnts Mgd Retl Acc 106 39 116 22 147 9 194 7 229 3 1.57 0.58Threadneedle Navigator Gr Retl Acc GBP 105 91 111 83 134 62 169 40 210 10 1.53 0.56TM Balanced Growth Fund 104 109 108 115 123 114 142 103 163 55 2.07 1.27TM Cerno Select C Acc 101 141 108 114 119 123 - - - - - 0.32TM Fulcrum Diversified Growth C GBP 105 96 107 125 108 139 130 113 - - 1.48 -Total Clarity Portfolio 6 A 105 75 111 84 134 67 156 78 - - 1.69 1.07Troy Spectrum O Acc 103 120 110 94 139 35 155 82 - - 1.49 0.51Troy Trojan O Inc 101 148 104 140 121 120 127 115 182 36 1.03 0.36UBS Targeted Return C 103 126 109 105 110 136 132 111 141 67 1.45 1.27Unicorn Mastertrust B 107 28 119 6 152 2 199 3 243 1 1.75 0.90VT Grosvenor Adventurous A GBP Acc 106 60 - - - - - - - - - -VT Tcam Growth Net Acc 105 93 110 98 130 92 - - - - - 0.50VT Thistledown Income Z GBP Net Acc 104 107 110 101 139 36 180 20 - - - 1.31VT Ursus Arctos 1 Net GBP Inc 107 20 122 2 149 5 - - - - - 1.02WAY Global Red Active Portfolio Tr E Acc 106 35 110 96 137 45 168 45 180 39 - -WAY MA Growth Portfolio E Acc 106 55 115 35 137 49 167 48 - - 2.17 0.01Zurich Horizon Multi-Asset V Z Acc 107 23 115 31 148 6 - - - - - 0.66Average/Total 105 156 111 153 132 141 161 121 183 69 1.44 1.12
(IA) GLOBALAberdeen Ethical World Equity I Acc 106 154 114 135 134 217 155 208 177 131 1.12 0.86Aberdeen Global World Equity X Acc GBP 104 239 113 176 133 220 157 207 198 106 1.19 -Aberdeen World Eq Enh Idx Net B Acc 107 115 112 203 - - - - - - - 1.78Aberdeen World Equity I 104 240 113 166 134 216 157 206 198 105 1.13 0.75Acumen Equity X Acc 108 68 - - - - - - - - - -Allianz Best Styles Global AC Eq C Acc 107 129 113 152 - - - - - - - 1.57Allianz Best Styles Global Eq RT GBP 108 82 112 212 146 135 - - - - - -Allianz Global AC Eq Inigts W Acc GBP 109 56 114 127 156 51 253 8 - - - -Allianz Global Small Cap Equity RT GBP 110 26 115 84 150 96 - - - - - -Ardevora Global Equity A GBP Acc 109 32 116 68 159 32 245 12 - - - -Ardevora Global Long Only Eq C GBP Acc 109 47 117 56 165 13 - - - - - -Artemis Global Growth I Acc 110 23 119 45 158 42 233 22 220 63 1.00 1.39Artemis Global Select I Acc 107 108 114 128 156 53 209 69 - - 1.17 0.42Artemis Instl Global Capital IN Acc 110 21 119 40 159 39 234 20 221 61 0.82 1.39Aviva Investors Intl Idx Tr 2 £ Acc 107 138 112 186 151 90 207 73 - - 0.50 1.66AXA Framlington Global Opps Z Inc 108 89 116 80 145 142 206 76 191 114 - 0.79AXA Rosenberg Global Z 108 57 114 115 149 110 204 80 205 91 1.06 1.58Baillie Gifford Gbl Discovery B Acc 111 11 132 3 164 15 278 3 399 1 0.88 -Baillie Gifford Global Alpha Gr B Acc 109 33 122 18 165 14 235 18 - - 0.68 0.48Baillie Gifford Global Select B Acc 110 22 127 4 - - - - - - - 0.41Baillie Gifford International B Acc 110 30 122 19 167 8 238 16 298 17 0.69 0.42Barclays Global Core R Acc GBP 107 97 109 245 143 162 185 157 - - - 1.79Baring Global Div Champions I GBP Acc 105 224 114 124 - - - - - - 0.85 -Baring Global Leaders A GBP Inc 105 214 117 57 143 158 181 171 174 135 2.15 -BlackRock Consensus 100 D Acc 106 162 113 148 148 124 193 125 - - 0.27 1.69BlackRock Global Equity D Acc 101 265 110 240 143 155 186 153 191 113 0.92 0.79BlackRock Global Equity D GBP Acc 106 153 113 165 142 166 185 155 - - 0.24 2.20BlackRock Overseas Equity I Acc GBP 107 127 113 161 154 66 216 44 251 35 0.24 1.15BNY Mellon Global Leaders GBP W Acc 105 205 113 139 - - - - - - 0.89 -BNY Mellon Long-Term Global Eq Int W Acc 107 116 114 126 152 78 193 121 268 21 - 0.83Brown Advisory Global Leaders C USD Acc 109 41 123 17 - - - - - - 0.75 -Candriam Quant Equities MF Glb C Acc EUR 106 158 111 215 148 116 197 106 204 93 1.96 -Capital Group New Pers(LUX) Z 105 202 117 63 157 48 214 51 280 20 0.80 -Carmignac Investissement A EUR Acc 101 266 109 247 124 235 150 211 188 123 2.00 -Carmignac Pf Invmt F GBP Acc Hdg 101 269 106 265 111 238 142 214 - - 1.17 -
FUND 6 MONTHS 1 YEAR 3 YEARS 5 YEARS 10 YEARS TER YIELD FUND 6 MONTHS 1 YEAR 3 YEARS 5 YEARS 10 YEARS TER YIELD £ £ £ £ £ % % £ £ £ £ £ % %
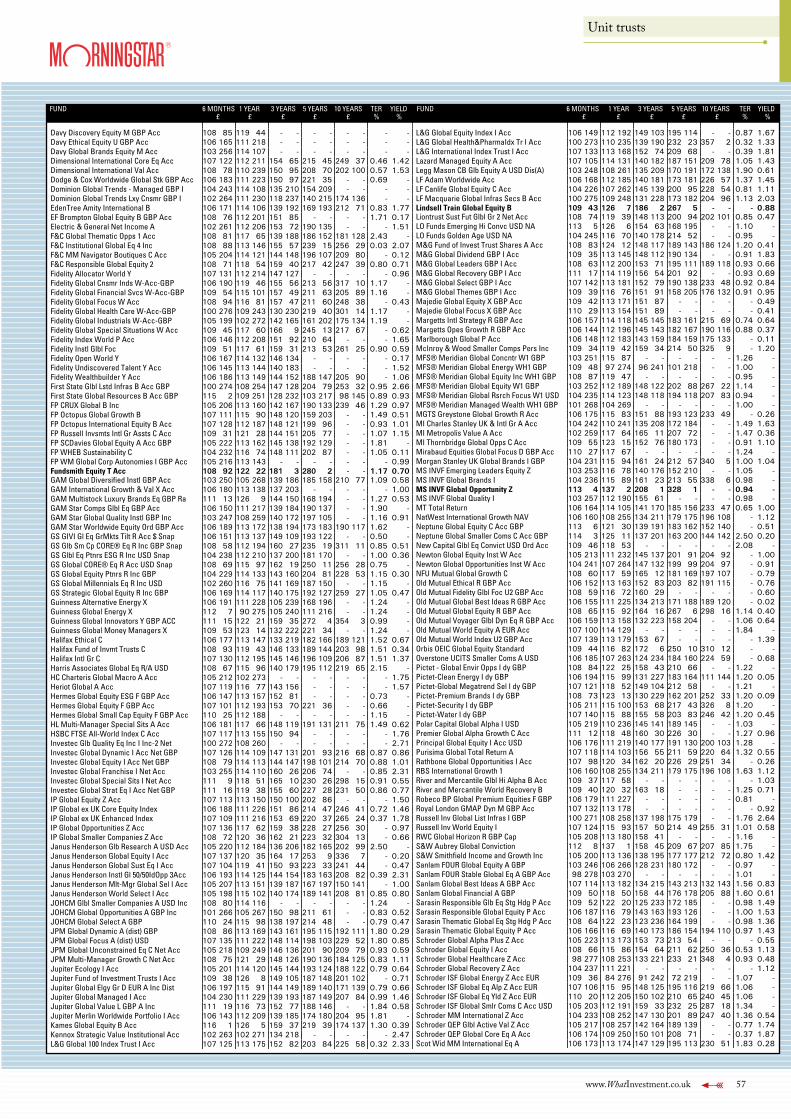
www.WhatInvestment.co.uk 57
Unit trusts
FUND 6 MONTHS 1 YEAR 3 YEARS 5 YEARS 10 YEARS TER YIELD£ £ £ £ £ % %
Davy Discovery Equity M GBP Acc 108 85 119 44 - - - - - - - -Davy Ethical Equity U GBP Acc 106 165 111 218 - - - - - - - -Davy Global Brands Equity M Acc 103 256 114 107 - - - - - - - -Dimensional International Core Eq Acc 107 122 112 211 154 65 215 45 249 37 0.46 1.42Dimensional International Val Acc 108 78 110 239 150 95 208 70 202 100 0.57 1.53Dodge & Cox Worldwide Global Stk GBP Acc 106 183 111 223 150 97 221 35 - - 0.69 -Dominion Global Trends - Managed GBP I 104 243 114 108 135 210 154 209 - - - -Dominion Global Trends Lxy Cnsmr GBP I 102 264 111 230 118 237 140 215 174 136 - -EdenTree Amity International B 106 171 114 106 139 192 169 193 212 71 0.83 1.77EF Brompton Global Equity B GBP Acc 108 76 112 201 151 85 - - - - 1.71 0.17Electric & General Net Income A 102 261 112 206 153 72 190 135 - - - 1.51F&C Global Thematic Opps 1 Acc 108 81 117 65 139 188 186 152 181 128 2.43 -F&C Institutional Global Eq 4 Inc 108 88 113 146 155 57 239 15 256 29 0.03 2.07F&C MM Navigator Boutiques C Acc 105 204 114 121 144 148 196 107 209 80 - 0.12F&C Responsible Global Equity 2 108 71 118 54 159 40 217 42 247 39 0.80 0.71Fidelity Allocator World Y 107 131 112 214 147 127 - - - - - 0.96Fidelity Global Cnsmr Inds W-Acc-GBP 106 190 119 46 155 56 213 56 317 10 1.17 -Fidelity Global Financial Svcs W-Acc-GBP 109 54 115 101 157 49 211 63 205 89 1.16 -Fidelity Global Focus W Acc 108 94 116 81 157 47 211 60 248 38 - 0.43Fidelity Global Health Care W-Acc-GBP 100 276 109 243 130 230 219 40 301 14 1.17 -Fidelity Global Industrials W-Acc-GBP 105 199 102 272 142 165 161 202 175 134 1.19 -Fidelity Global Special Situations W Acc 109 45 117 60 166 9 245 13 217 67 - 0.62Fidelity Index World P Acc 106 146 112 208 151 92 210 64 - - - 1.65Fidelity Instl Glbl Foc 109 51 117 61 159 31 213 53 261 25 0.90 0.59Fidelity Open World Y 106 167 114 132 146 134 - - - - - 0.17Fidelity Undiscovered Talent Y Acc 106 145 113 144 140 183 - - - - - 1.52Fidelity Wealthbuilder Y Acc 106 186 113 149 144 152 188 147 205 90 - 1.06First State Glbl Lstd Infras B Acc GBP 100 274 108 254 147 128 204 79 253 32 0.95 2.66First State Global Resources B Acc GBP 115 2 109 251 128 232 103 217 98 145 0.89 0.93FP CRUX Global B Inc 105 206 113 160 142 167 190 133 239 46 1.29 0.97FP Octopus Global Growth B 107 111 115 90 148 120 159 203 - - 1.49 0.51FP Octopus International Equity B Acc 107 128 112 187 148 121 199 96 - - 0.93 1.01FP Russell Invsmts Intl Gr Assts C Acc 109 31 121 28 144 151 205 77 - - 1.07 1.15FP SCDavies Global Equity A Acc GBP 105 222 113 162 145 138 192 129 - - 1.81 -FP WHEB Sustainability C 104 232 116 74 148 111 202 87 - - 1.05 0.11FP WM Global Corp Autonomies I GBP Acc 105 216 113 143 - - - - - - - 0.99Fundsmith Equity T Acc 108 92 122 22 181 3 280 2 - - 1.17 0.70GAM Global Diversified Instl GBP Acc 103 250 105 268 139 186 185 158 210 77 1.09 0.58GAM International Growth & Val X Acc 106 180 113 138 137 203 - - - - - 1.00GAM Multistock Luxury Brands Eq GBP Ra 111 13 126 9 144 150 168 194 - - 1.27 0.53GAM Star Comps Glbl Eq GBP Acc 106 150 111 217 139 184 190 137 - - 1.90 -GAM Star Global Quality Instl GBP Inc 103 247 108 259 140 172 197 105 - - 1.16 0.91GAM Star Worldwide Equity Ord GBP Acc 106 189 113 172 138 194 173 183 190 117 1.62 -GS GIVI Gl Eq GrMkts Tilt R Acc $ Snap 106 151 113 137 149 109 193 122 - - 0.50 -GS Glb Sm Cp CORE® Eq R Inc GBP Snap 108 58 112 194 160 27 235 19 311 11 0.85 0.51GS Glbl Eq Ptnrs ESG R Inc USD Snap 104 238 112 210 137 200 181 170 - - 1.00 0.36GS Global CORE® Eq R Acc USD Snap 108 69 115 97 162 19 250 11 256 28 0.75 -GS Global Equity Ptnrs R Inc GBP 104 229 114 133 143 160 204 81 228 53 1.15 0.30GS Global Millennials Eq R Inc USD 102 260 116 75 141 169 187 150 - - 1.15 -GS Strategic Global Equity R Inc GBP 106 169 114 117 140 175 192 127 259 27 1.05 0.47Guinness Alternative Energy X 106 191 111 228 105 239 168 196 - - 1.24 -Guinness Global Energy X 112 7 90 275 105 240 111 216 - - 1.24 -Guinness Global Innovators Y GBP ACC 111 15 122 21 159 35 272 4 354 3 0.99 -Guinness Global Money Managers X 109 53 123 14 132 222 221 34 - - 1.24 -Halifax Ethical C 106 177 113 147 133 219 182 166 189 121 1.52 0.67Halifax Fund of Invmt Trusts C 108 93 119 43 146 133 189 144 203 98 1.51 0.34Halifax Intl Gr C 107 130 112 195 145 146 196 109 206 87 1.51 1.37Harris Associates Global Eq R/A USD 108 67 115 96 140 179 195 112 219 65 2.15 -HC Charteris Global Macro A Acc 105 212 102 273 - - - - - - - 1.75Heriot Global A Acc 107 119 116 77 143 156 - - - - - 1.57Hermes Global Equity ESG F GBP Acc 106 147 113 157 152 81 - - - - 0.73 -Hermes Global Equity F GBP Acc 107 101 112 193 153 70 221 36 - - 0.66 -Hermes Global Small Cap Equity F GBP Acc 110 25 112 188 - - - - - - 1.15 -HL Multi-Manager Special Sits A Acc 106 181 117 66 148 119 191 131 211 75 1.49 0.62HSBC FTSE All-World Index C Acc 107 117 113 155 150 94 - - - - - 1.76Investec Glb Quality Eq Inc I Inc-2 Net 100 272 108 260 - - - - - - - 2.71Investec Global Dynamic I Acc Net GBP 107 126 114 109 147 131 201 93 216 68 0.87 0.86Investec Global Equity I Acc Net GBP 108 79 114 113 144 147 198 101 214 70 0.88 1.01Investec Global Franchise I Net Acc 103 255 114 110 160 26 206 74 - - 0.85 2.31Investec Global Special Sits I Net Acc 111 9 118 51 165 10 230 26 298 15 0.91 0.55Investec Global Strat Eq I Acc Net GBP 111 16 119 38 155 60 227 28 231 50 0.86 0.77IP Global Equity Z Acc 107 113 113 150 150 100 202 86 - - - 1.50IP Global ex UK Core Equity Index 106 188 111 226 151 86 214 47 246 41 0.72 1.46IP Global ex UK Enhanced Index 107 109 111 216 153 69 220 37 265 24 0.37 1.78IP Global Opportunities Z Acc 107 136 117 62 159 38 228 27 256 30 - 0.97IP Global Smaller Companies Z Acc 108 72 120 36 162 21 223 32 304 13 - 0.66Janus Henderson Glb Research A USD Acc 105 220 112 184 136 206 182 165 202 99 2.50 -Janus Henderson Global Equity I Acc 107 137 120 35 164 17 253 9 336 7 - 0.20Janus Henderson Global Sust Eq I Acc 107 104 119 41 150 93 223 33 241 44 - 0.47Janus Henderson Instl Gl 50/50IdOpp 3Acc 106 193 114 125 144 154 183 163 208 82 0.39 2.31Janus Henderson Mlt-Mgr Global Sel I Acc 105 207 113 151 139 187 167 197 150 141 - 1.00Janus Henderson World Select I Acc 105 198 115 102 140 174 189 141 208 81 0.85 0.80JOHCM Glbl Smaller Companies A USD Inc 108 80 114 116 - - - - - - 1.24 -JOHCM Global Opportunities A GBP Inc 101 266 105 267 150 98 211 61 - - 0.83 0.52JOHCM Global Select A GBP 110 24 115 98 138 197 214 48 - - 0.79 0.47JPM Global Dynamic A (dist) GBP 108 86 113 169 143 161 195 115 192 111 1.80 0.29JPM Global Focus A (dist) USD 107 135 111 222 148 114 198 103 229 52 1.80 0.85JPM Global Unconstrained Eq C Net Acc 105 218 109 249 146 136 201 90 209 79 0.93 0.59JPM Multi-Manager Growth C Net Acc 108 75 121 29 148 126 190 136 184 125 0.83 1.11Jupiter Ecology I Acc 105 201 114 120 145 144 193 124 188 122 0.79 0.64Jupiter Fund of Investment Trusts I Acc 109 38 126 8 149 105 187 148 201 102 - 0.71Jupiter Global Elgy Gr D EUR A Inc Dist 106 197 115 91 144 149 189 140 171 139 0.79 0.66Jupiter Global Managed I Acc 104 230 111 229 139 193 187 149 207 84 0.99 1.46Jupiter Global Value L GBP A Inc 111 19 116 73 152 77 188 146 - - 1.84 0.58Jupiter Merlin Worldwide Portfolio I Acc 106 143 112 209 139 185 174 180 204 95 1.81 -Kames Global Equity B Acc 116 1 126 5 159 37 219 39 174 137 1.30 0.39Kennox Strategic Value Institutional Acc 102 263 102 271 134 218 - - - - - 2.47L&G Global 100 Index Trust I Acc 107 125 113 175 152 82 203 84 225 58 0.32 2.33
FUND 6 MONTHS 1 YEAR 3 YEARS 5 YEARS 10 YEARS TER YIELD£ £ £ £ £ % %
L&G Global Equity Index I Acc 106 149 112 192 149 103 195 114 - - 0.87 1.67L&G Global Health&PharmaIdx Tr I Acc 100 273 110 235 139 190 232 23 357 2 0.32 1.33L&G International Index Trust I Acc 107 133 113 168 152 74 209 68 - - 0.39 1.81Lazard Managed Equity A Acc 107 105 114 131 140 182 187 151 209 78 1.05 1.43Legg Mason CB Glb Equity A USD Dis(A) 103 248 108 261 135 209 170 191 172 138 1.90 0.61LF Adam Worldwide Acc 106 168 112 185 140 181 173 181 226 57 1.37 1.45LF Canlife Global Equity C Acc 104 226 107 262 145 139 200 95 228 54 0.81 1.11LF Macquarie Global Infras Secs B Acc 100 275 109 248 131 228 173 182 204 96 1.13 2.03Lindsell Train Global Equity B 109 43 126 7 186 2 267 5 - - - 0.88Liontrust Sust Fut Glbl Gr 2 Net Acc 108 74 119 39 148 113 200 94 202 101 0.85 0.47LO Funds Emerging Hi Convc USD NA 113 5 126 6 154 63 168 195 - - 1.10 -LO Funds Golden Age USD NA 104 245 116 70 140 178 214 52 - - 0.95 -M&G Fund of Invest Trust Shares A Acc 108 83 124 12 148 117 189 143 186 124 1.20 0.41M&G Global Dividend GBP I Acc 109 35 113 145 148 112 190 134 - - 0.91 1.83M&G Global Leaders GBP I Acc 108 63 112 200 153 71 195 111 189 118 0.93 0.66M&G Global Recovery GBP I Acc 111 17 114 119 156 54 201 92 - - 0.93 0.69M&G Global Select GBP I Acc 107 142 113 181 152 79 190 138 233 48 0.92 0.84M&G Global Themes GBP I Acc 109 39 116 76 151 91 158 205 176 132 0.91 0.95Majedie Global Equity X GBP Acc 109 42 113 171 151 87 - - - - - 0.49Majedie Global Focus X GBP Acc 110 29 113 154 151 89 - - - - - 0.41Margetts Intl Strategy R GBP Acc 106 157 114 118 145 145 183 161 215 69 0.74 0.64Margetts Opes Growth R GBP Acc 106 144 112 196 145 143 182 167 190 116 0.88 0.37Marlborough Global P Acc 106 148 112 183 143 159 184 159 175 133 - 0.11McInroy & Wood Smaller Comps Pers Inc 109 34 119 42 159 34 214 50 325 9 - 1.20MFS® Meridian Global Concntr W1 GBP 103 251 115 87 - - - - - - 1.26 -MFS® Meridian Global Energy WH1 GBP 109 48 97 274 96 241 101 218 - - 1.00 -MFS® Meridian Global Equity Inc WH1 GBP 108 87 119 47 - - - - - - 0.95 -MFS® Meridian Global Equity W1 GBP 103 252 112 189 148 122 202 88 267 22 1.14 -MFS® Meridian Global Rsrch Focus W1 USD 104 235 114 123 148 118 194 118 207 83 0.94 -MFS® Meridian Managed Wealth WH1 GBP 101 268 104 269 - - - - - - 1.00 -MGTS Greystone Global Growth R Acc 106 175 115 83 151 88 193 123 233 49 - 0.26MI Charles Stanley UK & Intl Gr A Acc 104 242 110 241 135 208 172 184 - - 1.49 1.63MI Metropolis Value A Acc 102 259 117 64 165 11 207 72 - - 1.47 0.36MI Thornbridge Global Opps C Acc 109 55 123 15 152 76 180 173 - - 0.91 1.10Mirabaud Equities Global Focus D GBP Acc 110 27 117 67 - - - - - - 1.24 -Morgan Stanley UK Global Brands I GBP 104 231 115 94 161 24 212 57 340 5 1.00 1.04MS INVF Emerging Leaders Equity Z 103 253 116 78 140 176 152 210 - - 1.05 -MS INVF Global Brands I 104 236 115 89 161 23 213 55 338 6 0.98 -MS INVF Global Opportunity Z 113 4 137 2 208 1 328 1 - - 0.94 -MS INVF Global Quality I 103 257 112 190 155 61 - - - - 0.98 -MT Total Return 106 164 114 105 141 170 185 156 233 47 0.65 1.00NatWest International Growth NAV 106 160 108 255 134 211 179 175 196 108 - 1.12Neptune Global Equity C Acc GBP 113 6 121 30 139 191 183 162 152 140 - 0.51Neptune Global Smaller Coms C Acc GBP 114 3 125 11 137 201 163 200 144 142 2.50 0.20New Capital Glbl Eq Convict USD Ord Acc 109 46 118 53 - - - - - - 2.08 -Newton Global Equity Inst W Acc 105 213 111 232 145 137 201 91 204 92 - 1.00Newton Global Opportunities Inst W Acc 104 241 107 264 147 132 199 99 204 97 - 0.91NFU Mutual Global Growth C 108 60 117 59 165 12 181 169 197 107 - 0.79Old Mutual Ethical R GBP Acc 106 152 113 163 152 83 203 82 191 115 - 0.76Old Mutual Fidelity Glbl Foc U2 GBP Acc 108 59 116 72 160 29 - - - - - 0.60Old Mutual Global Best Ideas R GBP Acc 106 155 111 225 134 213 171 188 189 120 - 0.02Old Mutual Global Equity R GBP Acc 108 65 115 92 164 16 267 6 298 16 1.14 0.40Old Mutual Voyager Glbl Dyn Eq R GBP Acc 106 159 113 158 132 223 158 204 - - 1.06 0.64Old Mutual World Equity A EUR Acc 107 100 114 129 - - - - - - 1.84 -Old Mutual World Index U2 GBP Acc 107 139 113 179 153 67 - - - - - 1.39Orbis OEIC Global Equity Standard 109 44 116 82 172 6 250 10 310 12 - -Overstone UCITS Smaller Coms A USD 106 185 107 263 124 234 184 160 224 59 - 0.68Pictet - Global Envir Opps I dy GBP 108 84 122 25 158 43 210 66 - - 1.22 -Pictet-Clean Energy I dy GBP 106 194 115 99 131 227 183 164 111 144 1.20 0.05Pictet-Global Megatrend Sel I dy GBP 107 121 118 52 149 104 212 58 - - 1.21 -Pictet-Premium Brands I dy GBP 108 73 123 13 130 229 162 201 252 33 1.20 0.09Pictet-Security I dy GBP 105 211 115 100 153 68 217 43 326 8 1.20 -Pictet-Water I dy GBP 107 140 115 88 155 58 203 83 246 42 1.20 0.45Polar Capital Global Alpha I USD 105 219 110 236 145 141 189 145 - - 1.03 -Premier Global Alpha Growth C Acc 111 12 118 48 160 30 226 30 - - 1.27 0.96Principal Global Equity I Acc USD 106 176 111 219 140 177 191 130 200 103 1.28 -Purisima Global Total Return A 107 118 114 103 156 55 211 59 220 64 1.32 0.55Rathbone Global Opportunities I Acc 107 98 120 34 162 20 226 29 251 34 - 0.26RBS International Growth 1 106 160 108 255 134 211 179 175 196 108 1.63 1.12River and Mercantile Glbl Hi Alpha B Acc 109 37 117 58 - - - - - - - 1.03River and Mercantile World Recovery B 109 40 120 32 163 18 - - - - 1.25 0.71Robeco BP Global Premium Equities F GBP 106 179 111 227 - - - - - - 0.81 -Royal London GMAP Dyn M GBP Acc 107 132 113 178 - - - - - - - 0.92Russell Inv Global List Infras I GBP 100 271 108 258 137 198 175 179 - - 1.76 2.64Russell Inv World Equity I 107 124 115 93 157 50 214 49 255 31 1.01 0.58RWC Global Horizon R GBP Cap 105 208 113 180 158 41 - - - - 1.16 -S&W Aubrey Global Conviction 112 8 137 1 158 45 209 67 207 85 1.75 -S&W Smithfield Income and Growth Inc 105 200 113 136 138 195 177 177 212 72 0.80 1.42Sanlam FOUR Global Equity A GBP 103 246 106 266 128 231 180 172 - - 0.97 -Sanlam FOUR Stable Global Eq A GBP Acc 98 278 103 270 - - - - - - 1.01 -Sanlam Global Best Ideas A GBP Acc 107 114 113 182 134 215 143 213 132 143 1.56 0.83Sanlam Global Financial A GBP 109 50 118 50 158 44 176 178 205 88 1.60 0.61Sarasin Responsible Glb Eq Stg Hdg P Acc 109 52 122 20 125 233 172 185 - - 0.98 1.49Sarasin Responsible Global Equity P Acc 106 187 116 79 143 163 193 126 - - 1.00 1.53Sarasin Thematic Global Eq Stg Hdg P Acc 108 64 122 23 123 236 164 199 - - 0.98 1.36Sarasin Thematic Global Equity P Acc 106 166 116 69 140 173 186 154 194 110 0.97 1.43Schroder Global Alpha Plus Z Acc 105 223 113 173 153 73 213 54 - - - 0.55Schroder Global Equity I Acc 108 66 115 86 154 64 211 62 250 36 0.53 1.13Schroder Global Healthcare Z Acc 98 277 108 253 133 221 233 21 348 4 0.93 0.48Schroder Global Recovery Z Acc 104 237 111 221 - - - - - - - 1.12Schroder ISF Global Energy Z Acc EUR 109 36 84 276 91 242 72 219 - - 1.07 -Schroder ISF Global Eq Alp Z Acc EUR 107 106 115 95 148 125 195 116 219 66 1.06 -Schroder ISF Global Eq Yld Z Acc EUR 110 20 112 205 150 102 210 65 240 45 1.06 -Schroder ISF Global Smlr Coms C Acc USD 105 203 112 191 159 33 232 25 287 18 1.34 -Schroder MM International Z Acc 104 233 108 252 147 130 201 89 247 40 1.36 0.54Schroder QEP Glbl Active Val Z Acc 105 217 108 257 142 164 189 139 - - 0.77 1.74Schroder QEP Global Core Eq A Acc 106 174 109 250 150 101 208 71 - - 0.37 1.87Scot Wid MM International Eq A 106 173 113 174 147 129 195 113 230 51 1.83 0.28
FUND 6 MONTHS 1 YEAR 3 YEARS 5 YEARS 10 YEARS TER YIELD FUND 6 MONTHS 1 YEAR 3 YEARS 5 YEARS 10 YEARS TER YIELD £ £ £ £ £ % % £ £ £ £ £ % %
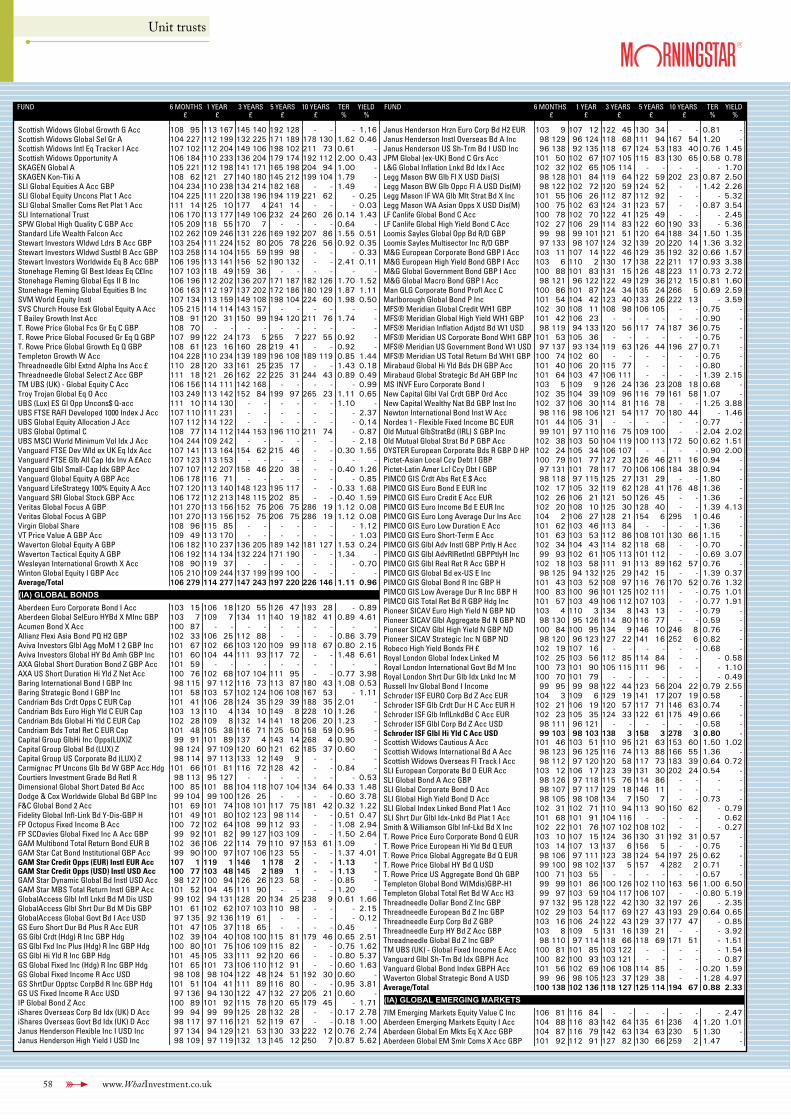
58 www.WhatInvestment.co.uk
Unit trusts
FUND 6 MONTHS 1 YEAR 3 YEARS 5 YEARS 10 YEARS TER YIELD£ £ £ £ £ % %
Scottish Widows Global Growth G Acc 108 95 113 167 145 140 192 128 - - - 1.16Scottish Widows Global Sel Gr A 104 227 112 199 132 225 171 189 178 130 1.62 0.46Scottish Widows Intl Eq Tracker I Acc 107 102 112 204 149 106 198 102 211 73 0.61 -Scottish Widows Opportunity A 106 184 110 233 136 204 179 174 192 112 2.00 0.43SKAGEN Global A 105 221 112 198 141 171 165 198 204 94 1.00 -SKAGEN Kon-Tiki A 108 62 121 27 140 180 145 212 199 104 1.79 -SLI Global Equities A Acc GBP 104 234 110 238 134 214 182 168 - - 1.49 -SLI Global Equity Uncons Plat 1 Acc 104 225 111 220 138 196 194 119 221 62 - 0.25SLI Global Smaller Coms Ret Plat 1 Acc 111 14 125 10 177 4 241 14 - - - 0.03SLI International Trust 106 170 113 177 149 106 232 24 260 26 0.14 1.43SPW Global High Quality C GBP Acc 105 209 118 55 170 7 - - - - 0.64 -Standard Life Wealth Falcon Acc 102 262 109 246 131 226 169 192 207 86 1.55 0.51Stewart Investors Wldwd Ldrs B Acc GBP 103 254 111 224 152 80 205 78 226 56 0.92 0.35Stewart Investors Wldwd Sustbl B Acc GBP 103 258 114 104 155 59 199 98 - - - 0.33Stewart Investors Worldwide Eq B Acc GBP 106 195 113 141 156 52 190 132 - - 2.41 0.11Stonehage Fleming Gl Best Ideas Eq C£Inc 107 103 118 49 159 36 - - - - - -Stonehage Fleming Global Eqs II B Inc 106 196 112 202 136 207 171 187 182 126 1.70 1.52Stonehage Fleming Global Equities B Inc 106 163 112 197 137 202 172 186 180 129 1.87 1.11SVM World Equity Instl 107 134 113 159 149 108 198 104 224 60 1.98 0.50SVS Church House Esk Global Equity A Acc 105 215 114 114 143 157 - - - - - -T Bailey Growth Inst Acc 108 91 120 31 150 99 194 120 211 76 1.74 -T. Rowe Price Global Fcs Gr Eq C GBP 108 70 - - - - - - - - - -T. Rowe Price Global Focused Gr Eq Q GBP 107 99 122 24 173 5 255 7 227 55 0.92 -T. Rowe Price Global Growth Eq Q GBP 108 61 123 16 160 28 219 41 - - 0.92 -Templeton Growth W Acc 104 228 110 234 139 189 196 108 189 119 0.85 1.44Threadneedle Glbl Extnd Alpha Ins Acc £ 110 28 120 33 161 25 235 17 - - 1.43 0.18Threadneedle Global Select Z Acc GBP 111 18 121 26 162 22 225 31 244 43 0.89 0.49TM UBS (UK) - Global Equity C Acc 106 156 114 111 142 168 - - - - - 0.99Troy Trojan Global Eq O Acc 103 249 113 142 152 84 199 97 265 23 1.11 0.65UBS (Lux) ES Gl Opp Uncons$ Q-acc 111 10 114 130 - - - - - - 1.10 -UBS FTSE RAFI Developed 1000 Index J Acc 107 110 111 231 - - - - - - - 2.37UBS Global Equity Allocation J Acc 107 112 114 122 - - - - - - - 0.14UBS Global Optimal C 108 77 114 112 144 153 196 110 211 74 - 0.87UBS MSCI World Minimum Vol Idx J Acc 104 244 109 242 - - - - - - - 2.18Vanguard FTSE Dev Wld ex UK Eq Idx Acc 107 141 113 164 154 62 215 46 - - 0.30 1.55Vanguard FTSE Glb All Cap Idx Inv A £Acc 107 123 113 153 - - - - - - - -Vanguard Glbl Small-Cap Idx GBP Acc 107 107 112 207 158 46 220 38 - - 0.40 1.26Vanguard Global Equity A GBP Acc 106 178 116 71 - - - - - - - 0.85Vanguard LifeStrategy 100% Equity A Acc 107 120 113 140 148 123 195 117 - - 0.33 1.68Vanguard SRI Global Stock GBP Acc 106 172 112 213 148 115 202 85 - - 0.40 1.59Veritas Global Focus A GBP 101 270 113 156 152 75 206 75 286 19 1.12 0.08Veritas Global Focus A GBP 101 270 113 156 152 75 206 75 286 19 1.12 0.08Virgin Global Share 108 96 115 85 - - - - - - - 1.12VT Price Value A GBP Acc 109 49 113 170 - - - - - - - 1.03Waverton Global Equity A GBP 106 182 110 237 136 205 189 142 181 127 1.53 0.24Waverton Tactical Equity A GBP 106 192 114 134 132 224 171 190 - - 1.34 -Wesleyan International Growth X Acc 108 90 119 37 - - - - - - - 0.70Winton Global Equity I GBP Acc 105 210 109 244 137 199 199 100 - - - -Average/Total 106 279 114 277 147 243 197 220 226 146 1.11 0.96
(IA) GLOBAL BONDSAberdeen Euro Corporate Bond I Acc 103 15 106 18 120 55 126 47 193 28 - 0.89Aberdeen Global SelEuro HYBd X MInc GBP 103 7 109 7 134 11 140 19 182 41 0.89 4.61Acumen Bond X Acc 100 87 - - - - - - - - - -Allianz Flexi Asia Bond PQ H2 GBP 102 33 106 25 112 88 - - - - 0.86 3.79Aviva Investors Glbl Agg MoM 1 2 GBP Inc 101 67 102 66 103 120 109 99 118 67 0.80 2.15Aviva Investors Global HY Bd Amh GBP Inc 101 60 104 44 111 93 117 72 - - 1.48 6.61AXA Global Short Duration Bond Z GBP Acc 101 59 - - - - - - - - - -AXA US Short Duration Hi Yld Z Net Acc 100 76 102 68 107 104 111 95 - - 0.77 3.98Baring International Bond I GBP Inc 98 115 97 112 116 73 113 87 180 43 1.08 0.53Baring Strategic Bond I GBP Inc 101 58 103 57 102 124 106 108 167 53 - 1.11Candriam Bds Crdt Opps C EUR Cap 101 41 106 28 124 35 129 39 188 35 2.01 -Candriam Bds Euro High Yld C EUR Cap 103 13 110 4 134 10 149 8 228 10 1.26 -Candriam Bds Global Hi Yld C EUR Cap 102 28 109 8 132 14 141 18 206 20 1.23 -Candriam Bds Total Ret C EUR Cap 101 48 105 38 116 71 125 50 158 59 0.95 -Capital Group GlbHi Inc Opps(LUX)Z 99 91 101 89 137 4 143 14 268 4 0.90 -Capital Group Global Bd (LUX) Z 98 124 97 109 120 60 121 62 185 37 0.60 -Capital Group US Corporate Bd (LUX) Z 98 114 97 113 133 12 149 9 - - - -Carmignac Pf Uncons Glb Bd W GBP Acc Hdg 101 66 101 81 116 72 128 42 - - 0.84 -Courtiers Investment Grade Bd Retl R 98 113 95 127 - - - - - - - 0.53Dimensional Global Short Dated Bd Acc 100 85 101 88 104 118 107 104 134 64 0.33 1.48Dodge & Cox Worldwide Global Bd GBP Inc 99 104 99 100 126 25 - - - - 0.60 3.78F&C Global Bond 2 Acc 101 69 101 74 108 101 117 75 181 42 0.32 1.22Fidelity Global Infl-Link Bd Y-Dis-GBP H 101 49 101 80 102 123 98 114 - - 0.51 0.47FP Octopus Fixed Income B Acc 100 72 102 64 108 99 112 93 - - 1.08 2.94FP SCDavies Global Fixed Inc A Acc GBP 99 92 101 82 99 127 103 109 - - 1.50 2.64GAM Multibond Total Return Bond EUR B 102 36 106 22 114 79 110 97 153 61 1.09 -GAM Star Cat Bond Institutional GBP Acc 99 90 100 97 107 106 123 55 - - 1.37 4.01GAM Star Credit Opps (EUR) Instl EUR Acc 107 1 119 1 146 1 178 2 - - 1.13 -GAM Star Credit Opps (USD) Instl USD Acc 100 77 103 48 145 2 189 1 - - 1.13 -GAM Star Dynamic Global Bd Instl USD Acc 98 127 100 94 126 26 123 58 - - 0.85 -GAM Star MBS Total Return Instl GBP Acc 101 52 104 45 111 90 - - - - 1.20 -GlobalAccess Glbl Infl Lnkd Bd M Dis USD 99 102 94 131 128 20 134 25 238 9 0.61 1.66GlobalAccess Glbl Shrt Dur Bd M Dis GBP 101 61 102 62 107 103 110 98 - - - 2.15GlobalAccess Global Govt Bd I Acc USD 97 135 92 136 119 61 - - - - - 0.12GS Euro Short Dur Bd Plus R Acc EUR 101 47 105 37 118 65 - - - - 0.45 -GS Glbl Crdt (Hdg) R Inc GBP Hdg 102 39 104 40 108 100 115 81 179 46 0.65 2.51GS Glbl Fxd Inc Plus (Hdg) R Inc GBP Hdg 100 80 101 75 106 109 115 82 - - 0.75 1.62GS Glbl Hi Yld R Inc GBP Hdg 101 45 105 33 111 92 120 66 - - 0.80 5.37GS Global Fixed Inc (Hdg) R Inc GBP Hdg 101 65 101 73 106 110 112 91 - - 0.60 1.63GS Global Fixed Income R Acc USD 98 108 98 104 122 48 124 51 192 30 0.60 -GS ShrtDur Opptsc CorpBd R Inc GBP Hdg 101 51 104 41 111 89 116 80 - - 0.95 3.81GS US Fixed Income R Acc USD 97 136 94 130 122 47 132 27 205 21 0.60 -IP Global Bond Z Acc 100 89 101 92 115 78 120 65 179 45 - 1.71iShares Overseas Corp Bd Idx (UK) D Acc 99 94 99 99 125 28 132 28 - - 0.17 2.78iShares Overseas Govt Bd Idx (UK) D Acc 98 117 97 116 121 52 119 67 - - 0.18 1.00Janus Henderson Flexible Inc I USD Inc 97 134 94 129 121 53 130 33 222 12 0.76 2.74Janus Henderson High Yield I USD Inc 98 109 97 119 132 13 145 12 250 7 0.87 5.62
FUND 6 MONTHS 1 YEAR 3 YEARS 5 YEARS 10 YEARS TER YIELD£ £ £ £ £ % %
Janus Henderson Hrzn Euro Corp Bd H2 EUR 103 9 107 12 122 45 130 34 - - 0.81 -Janus Henderson Instl Overseas Bd A Inc 98 129 96 124 118 68 111 94 167 54 1.20 -Janus Henderson US Sh-Trm Bd I USD Inc 96 138 92 135 118 67 124 53 183 40 0.76 1.45JPM Global (ex-UK) Bond C Grs Acc 101 50 102 67 107 105 115 83 130 65 0.58 0.78L&G Global Inflation Lnkd Bd Idx I Acc 102 32 102 65 105 114 - - - - - 1.70Legg Mason BW Glb FI X USD Dis(S) 98 128 101 84 119 64 122 59 202 23 0.87 2.50Legg Mason BW Glb Oppc FI A USD Dis(M) 98 122 102 72 120 59 124 52 - - 1.42 2.26Legg Mason IF WA Glb Mlt Strat Bd X Inc 101 55 106 26 112 87 112 92 - - - 5.32Legg Mason WA Asian Opps X USD Dis(M) 100 75 102 63 124 31 123 57 - - 0.87 3.54LF Canlife Global Bond C Acc 100 78 102 70 122 41 125 49 - - - 2.45LF Canlife Global High Yield Bond C Acc 102 27 106 29 114 83 122 60 190 33 - 5.36Loomis Sayles Global Opp Bd R/D GBP 99 98 99 101 121 51 120 64 188 34 1.50 1.35Loomis Sayles Multisector Inc R/D GBP 97 133 98 107 124 32 139 20 220 14 1.36 3.32M&G European Corporate Bond GBP I Acc 103 11 107 14 122 46 129 35 192 32 0.66 1.57M&G European High Yield Bond GBP I Acc 103 6 110 2 130 17 138 22 211 17 0.93 3.38M&G Global Government Bond GBP I Acc 100 88 101 83 131 15 126 48 223 11 0.73 2.72M&G Global Macro Bond GBP I Acc 98 121 96 122 122 49 129 36 212 15 0.81 1.60Man GLG Corporate Bond Profl Acc C 100 86 101 87 124 34 135 24 266 5 0.69 2.59Marlborough Global Bond P Inc 101 54 104 42 123 40 133 26 222 13 - 3.59MFS® Meridian Global Credit WH1 GBP 102 30 108 11 108 98 106 105 - - 0.75 -MFS® Meridian Global High Yield WH1 GBP 101 42 106 23 - - - - - - 0.90 -MFS® Meridian Inflation Adjstd Bd W1 USD 98 119 94 133 120 56 117 74 187 36 0.75 -MFS® Meridian US Corporate Bond WH1 GBP 101 53 105 36 - - - - - - 0.75 -MFS® Meridian US Government Bond W1 USD 97 137 93 134 119 63 126 44 196 27 0.71 -MFS® Meridian US Total Return Bd WH1 GBP 100 74 102 60 - - - - - - 0.75 -Mirabaud Global Hi Yld Bds DH GBP Acc 101 40 106 20 115 77 - - - - 0.80 -Mirabaud Global Strategic Bd AH GBP Inc 101 64 103 47 106 111 - - - - 1.39 2.15MS INVF Euro Corporate Bond I 103 5 109 9 126 24 136 23 208 18 0.68 -New Capital Glbl Val Crdt GBP Ord Acc 102 35 104 39 109 96 116 79 161 58 1.07 -New Capital Wealthy Nat Bd GBP Inst Inc 102 37 106 30 114 81 116 78 - - 1.25 3.88Newton International Bond Inst W Acc 98 116 98 106 121 54 117 70 180 44 - 1.46Nordea 1 - Flexible Fixed Income BC EUR 101 44 105 31 - - - - - - 0.77 -Old Mutual GlbStratBd (IRL) S GBP Inc 99 101 97 110 116 75 109 100 - - 2.04 2.02Old Mutual Global Strat Bd P GBP Acc 102 38 103 50 104 119 100 113 172 50 0.62 1.51OYSTER European Corporate Bds R GBP D HP 102 24 105 34 106 107 - - - - 0.90 2.00Pictet-Asian Local Ccy Debt I GBP 100 79 101 77 127 23 126 46 211 16 0.94 -Pictet-Latin Amer Lcl Ccy Dbt I GBP 97 131 101 78 117 70 106 106 184 38 0.94 -PIMCO GIS Crdt Abs Ret E $ Acc 98 118 97 115 125 27 131 29 - - 1.80 -PIMCO GIS Euro Bond E EUR Inc 102 17 105 32 119 62 128 41 176 48 1.36 -PIMCO GIS Euro Credit E Acc EUR 102 26 106 21 121 50 126 45 - - 1.36 -PIMCO GIS Euro Income Bd E EUR Inc 102 20 108 10 125 30 128 40 - - 1.39 4.13PIMCO GIS Euro Long Average Dur Ins Acc 104 2 106 27 128 21 154 6 295 1 0.46 -PIMCO GIS Euro Low Duration E Acc 101 62 103 46 113 84 - - - - 1.36 -PIMCO GIS Euro Short-Term E Acc 101 63 103 53 112 86 108 101 130 66 1.15 -PIMCO GIS Glbl Adv Instl GBP Prtly H Acc 102 34 104 43 114 82 118 68 - - 0.70 -PIMCO GIS Glbl AdvRlRetIntl GBPPtlyH Inc 99 93 102 61 105 113 101 112 - - 0.69 3.07PIMCO GIS Glbl Real Ret R Acc GBP H 102 18 103 58 111 91 113 89 162 57 0.76 -PIMCO GIS Global Bd ex-US E Inc 98 125 94 132 125 29 142 15 - - 1.39 0.37PIMCO GIS Global Bond R Inc GBP H 101 43 103 52 108 97 116 76 170 52 0.76 1.32PIMCO GIS Low Average Dur R Inc GBP H 100 83 100 96 101 125 102 111 - - 0.75 1.01PIMCO GIS Total Ret Bd R GBP Hdg Inc 101 57 103 49 106 112 107 103 - - 0.77 1.91Pioneer SICAV Euro High Yield N GBP ND 103 4 110 3 134 8 143 13 - - 0.79 -Pioneer SICAV Glbl Aggregate Bd N GBP ND 98 130 95 126 114 80 116 77 - - 0.59 -Pioneer SICAV Glbl High Yield N GBP ND 100 84 100 95 134 9 146 10 246 8 0.76 -Pioneer SICAV Strategic Inc N GBP ND 98 120 96 123 127 22 141 16 252 6 0.82 -Robeco High Yield Bonds FH £ 102 19 107 16 - - - - - - 0.68 -Royal London Global Index Linked M 102 25 103 56 112 85 114 84 - - - 0.58Royal London International Govt Bd M Inc 100 73 101 90 105 115 111 96 - - - 1.10Royal London Shrt Dur Glb Idx Lnkd Inc M 100 70 101 79 - - - - - - - 0.49Russell Inv Global Bond I Income 99 95 99 98 122 44 123 56 204 22 0.79 2.55Schroder ISF EURO Corp Bd Z Acc EUR 104 3 109 6 129 19 141 17 207 19 0.58 -Schroder ISF Glb Crdt Dur H C Acc EUR H 102 21 106 19 120 57 117 71 146 63 0.74 -Schroder ISF Glb InflLnkdBd C Acc EUR 102 23 105 35 124 33 122 61 175 49 0.66 -Schroder ISF Glbl Corp Bd Z Acc USD 98 111 96 121 - - - - - - 0.58 -Schroder ISF Glbl Hi Yld C Acc USD 99 103 98 103 138 3 158 3 278 3 0.80 -Scottish Widows Cautious A Acc 101 46 103 51 110 95 121 63 153 60 1.50 1.02Scottish Widows International Bd A Acc 98 123 96 125 116 74 113 88 166 55 1.36 -Scottish Widows Overseas FI Track I Acc 98 112 97 120 120 58 117 73 183 39 0.64 0.72SLI European Corporate Bd D EUR Acc 103 12 106 17 123 39 131 30 202 24 0.54 -SLI Global Bond A Acc GBP 98 126 97 118 115 76 114 86 - - - -SLI Global Corporate Bond D Acc 98 107 97 117 129 18 146 11 - - - -SLI Global High Yield Bond D Acc 98 105 98 108 134 7 150 7 - - 0.73 -SLI Global Index Linked Bond Plat 1 Acc 102 31 102 71 110 94 113 90 150 62 - 0.79SLI Shrt Dur Glbl Idx-Lnkd Bd Plat 1 Acc 101 68 101 91 104 116 - - - - - 0.62Smith & Williamson Glbl Inf-Lkd Bd X Inc 102 22 101 76 107 102 108 102 - - - 0.27T. Rowe Price Euro Corporate Bond Q EUR 103 10 107 15 124 36 130 31 192 31 0.57 -T. Rowe Price European Hi Yld Bd Q EUR 103 14 107 13 137 6 156 5 - - 0.75 -T. Rowe Price Global Aggregate Bd Q EUR 98 106 97 111 123 38 124 54 197 25 0.62 -T. Rowe Price Global HY Bd Q USD 99 100 98 102 137 5 157 4 282 2 0.71 -T. Rowe Price US Aggregate Bond Qh GBP 100 71 103 55 - - - - - - 0.57 -Templeton Global Bond W(Mdis)GBP-H1 99 99 101 86 100 126 102 110 163 56 1.00 6.50Templeton Global Total Ret Bd W Acc H3 99 97 103 59 104 117 106 107 - - 0.80 5.19Threadneedle Dollar Bond Z Inc GBP 97 132 95 128 122 42 130 32 197 26 - 2.35Threadneedle European Bd Z Inc GBP 102 29 103 54 117 69 127 43 193 29 0.64 0.65Threadneedle Eurp Corp Bd Z GBP 103 16 106 24 122 43 129 37 177 47 - 0.85Threadneedle Eurp HY Bd Z Acc GBP 103 8 109 5 131 16 139 21 - - - 3.92Threadneedle Global Bd Z Inc GBP 98 110 97 114 118 66 118 69 171 51 - 1.51TM UBS (UK) - Global Fixed Income E Acc 100 81 101 85 103 122 - - - - - 1.54Vanguard Glbl Sh-Tm Bd Idx GBPH Acc 100 82 100 93 103 121 - - - - - 0.87Vanguard Global Bond Index GBPH Acc 101 56 102 69 106 108 114 85 - - 0.20 1.59Waverton Global Strategic Bond A USD 99 96 98 105 123 37 129 38 - - 1.28 4.97Average/Total 100 138 102 136 118 127 125 114 194 67 0.88 2.33
(IA) GLOBAL EMERGING MARKETS7IM Emerging Markets Equity Value C Inc 106 81 116 84 - - - - - - - 2.47Aberdeen Emerging Markets Equity I Acc 104 88 116 83 142 64 135 61 236 4 1.20 1.01Aberdeen Global Em Mkts Eq X Acc GBP 104 87 116 79 142 63 134 63 230 5 1.30 -Aberdeen Global EM Smlr Coms X Acc GBP 101 92 112 91 127 82 130 66 259 2 1.47 -
FUND 6 MONTHS 1 YEAR 3 YEARS 5 YEARS 10 YEARS TER YIELD FUND 6 MONTHS 1 YEAR 3 YEARS 5 YEARS 10 YEARS TER YIELD £ £ £ £ £ % % £ £ £ £ £ % %
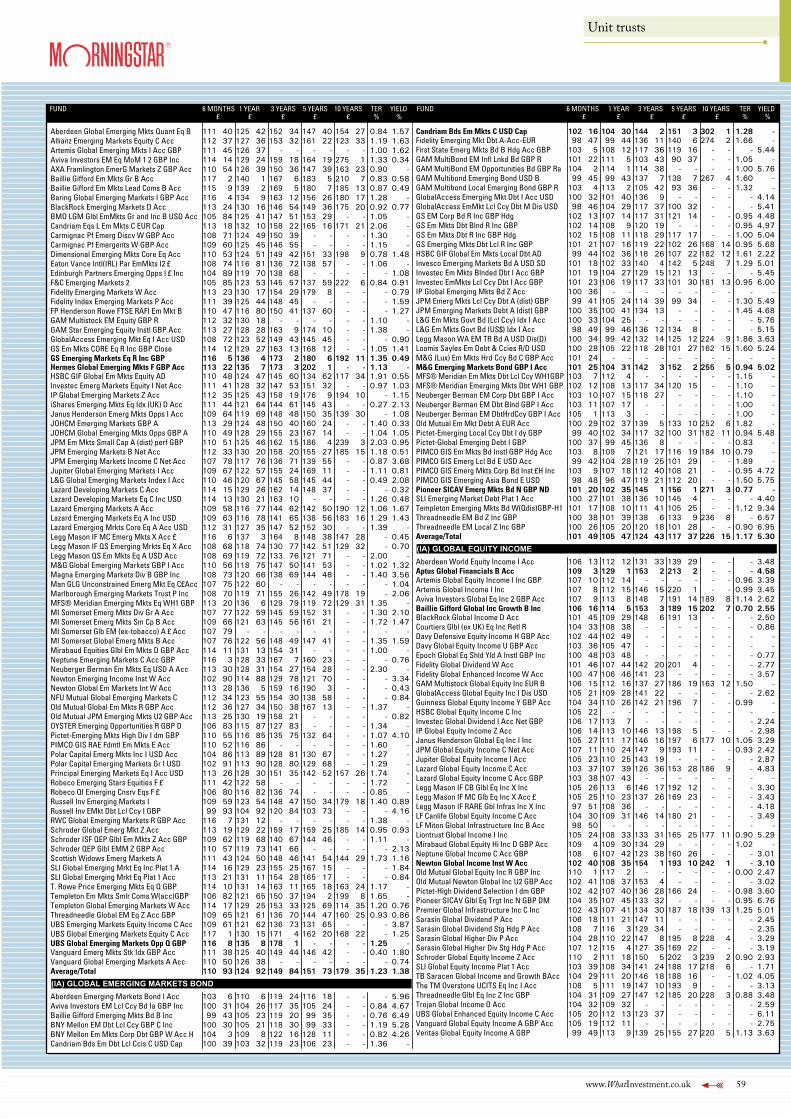
www.WhatInvestment.co.uk 59
Unit trusts
FUND 6 MONTHS 1 YEAR 3 YEARS 5 YEARS 10 YEARS TER YIELD£ £ £ £ £ % %
Aberdeen Global Emerging Mkts Quant Eq B 111 40 125 42 152 34 147 40 154 27 0.84 1.57Allianz Emerging Markets Equity C Acc 112 37 127 36 153 32 161 22 123 33 1.19 1.63Artemis Global Emerging Mkts I Acc GBP 111 45 126 37 - - - - - - 1.00 1.62Aviva Investors EM Eq MoM 1 2 GBP Inc 114 14 129 24 159 18 164 19 275 1 1.33 0.34AXA Framlington EmerG Markets Z GBP Acc 110 54 126 39 150 36 147 39 163 23 0.90 -Baillie Gifford Em Mkts Gr B Acc 117 2 140 1 167 6 183 5 210 7 0.83 0.58Baillie Gifford Em Mkts Lead Coms B Acc 115 9 139 2 169 5 180 7 185 13 0.87 0.49Baring Global Emerging Markets I GBP Acc 116 4 134 9 163 12 156 26 180 17 1.28 -BlackRock Emerging Markets D Acc 113 24 130 16 146 54 149 36 175 20 0.92 0.77BMO LGM Glbl EmMkts Gr and Inc B USD Acc 105 84 125 41 147 51 153 29 - - 1.05 -Candriam Eqs L Em Mkts C EUR Cap 113 18 132 10 158 22 165 16 171 21 2.06 -Carmignac Pf Emerg Discv W GBP Acc 108 71 124 49 150 39 - - - - 1.30 -Carmignac Pf Emergents W GBP Acc 109 60 125 45 146 55 - - - - 1.15 -Dimensional Emerging Mkts Core Eq Acc 110 53 124 51 149 42 151 33 198 9 0.78 1.48Eaton Vance Intl(IRL) Par EmMkts I2 £ 108 74 116 81 136 72 138 57 - - 1.06 -Edinburgh Partners Emerging Opps I £ Inc 104 89 119 70 138 68 - - - - - 1.08F&C Emerging Markets 2 105 85 123 53 145 57 137 59 222 6 0.84 0.91Fidelity Emerging Markets W Acc 113 23 130 17 154 29 179 8 - - - 0.79Fidelity Index Emerging Markets P Acc 111 39 125 44 148 45 - - - - - 1.59FP Henderson Rowe FTSE RAFI Em Mkt B 110 47 116 80 150 41 137 60 - - - 1.27GAM Multistock EM Equity GBP R 112 32 130 18 - - - - - - 1.10 -GAM Star Emerging Equity Instl GBP Acc 113 27 128 28 163 9 174 10 - - 1.38 -GlobalAccess Emerging Mkt Eq I Acc USD 108 72 123 52 149 43 145 45 - - - 0.90GS Em Mkts CORE Eq R Inc GBP Close 114 12 129 27 163 13 168 12 - - 1.05 1.41GS Emerging Markets Eq R Inc GBP 116 5 136 4 173 2 180 6 192 11 1.35 0.49Hermes Global Emerging Mkts F GBP Acc 113 22 135 7 173 3 202 1 - - 1.13 -HSBC GIF Global Em Mkts Equity AD 110 48 124 47 145 60 134 62 117 34 1.91 0.55Investec Emerg Markets Equity I Net Acc 111 41 128 32 147 53 151 32 - - 0.97 1.03IP Global Emerging Markets Z Acc 112 35 125 43 158 19 176 9 194 10 - 1.15iShares Emerging Mkts Eq Idx (UK) D Acc 111 44 121 64 144 61 145 43 - - 0.27 2.13Janus Henderson Emerg Mkts Opps I Acc 109 64 119 69 148 48 150 35 139 30 - 1.08JOHCM Emerging Markets GBP A 113 29 124 48 150 40 160 24 - - 1.40 0.33JOHCM Global Emerging Mkts Opps GBP A 110 49 128 29 155 23 167 14 - - 1.04 1.05JPM Em Mkts Small Cap A (dist) perf GBP 110 51 125 46 162 15 186 4 239 3 2.03 0.95JPM Emerging Markets B Net Acc 112 33 130 20 158 20 155 27 185 15 1.18 0.51JPM Emerging Markets Income C Net Acc 107 78 117 76 136 71 139 55 - - 0.87 3.68Jupiter Global Emerging Markets I Acc 109 67 122 57 155 24 169 11 - - 1.11 0.81L&G Global Emerging Markets Index I Acc 110 46 120 67 145 58 145 44 - - 0.49 2.08Lazard Developing Markets C Acc 114 15 129 26 162 14 148 37 - - - 0.32Lazard Developing Markets Eq C Inc USD 114 13 130 21 163 10 - - - - 1.26 0.48Lazard Emerging Markets A Acc 109 58 116 77 144 62 142 50 190 12 1.06 1.67Lazard Emerging Markets Eq A Inc USD 109 63 116 78 141 65 138 56 183 16 1.29 1.43Lazard Emerging Mrkts Core Eq A Acc USD 112 31 127 35 147 52 152 30 - - 1.39 -Legg Mason IF MC Emerg Mkts X Acc £ 116 6 137 3 164 8 148 38 147 28 - 0.45Legg Mason IF QS Emerging Mrkts Eq X Acc 108 68 118 74 130 77 142 51 129 32 - 0.70Legg Mason QS Em Mkts Eq A USD Acc 108 69 119 72 133 76 121 71 - - 2.00 -M&G Global Emerging Markets GBP I Acc 110 56 118 75 147 50 141 53 - - 1.02 1.32Magna Emerging Markets Div B GBP Inc 108 73 120 66 138 69 144 48 - - 1.40 3.56Man GLG Unconstrained Emerg Mkt Eq C£Acc 107 75 122 60 - - - - - - - 1.04Marlborough Emerging Markets Trust P Inc 108 70 119 71 155 26 142 49 178 19 - 2.06MFS® Meridian Emerging Mkts Eq WH1 GBP 113 20 136 6 129 79 119 72 129 31 1.35 -MI Somerset Emerg Mkts Div Gr A Acc 107 77 122 59 145 59 152 31 - - 1.30 2.10MI Somerset Emerg Mkts Sm Cp B Acc 109 66 121 63 145 56 161 21 - - 1.72 1.47MI Somerset Glb EM (ex-tobacco) A £ Acc 107 79 - - - - - - - - - -MI Somerset Global Emerg Mkts B Acc 107 76 122 56 148 49 147 41 - - 1.35 1.59Mirabaud Equities Glbl Em Mkts D GBP Acc 114 11 131 13 154 31 - - - - 1.00 -Neptune Emerging Markets C Acc GBP 116 3 128 33 167 7 160 23 - - - 0.76Neuberger Berman Em Mkts Eq USD A Acc 113 30 128 31 154 27 154 28 - - 2.30 -Newton Emerging Income Inst W Acc 102 90 114 88 129 78 121 70 - - - 3.34Newton Global Em Markets Int W Acc 113 28 136 5 159 16 190 3 - - - 0.43NFU Mutual Global Emerging Markets C 112 34 123 55 154 30 138 58 - - - 0.84Old Mutual Global Em Mkts R GBP Acc 112 36 127 34 150 38 167 13 - - 1.37 -Old Mutual JPM Emerging Mkts U2 GBP Acc 113 25 130 19 158 21 - - - - - 0.82OYSTER Emerging Opportunities R GBP D 106 83 115 87 127 83 - - - - 1.34 -Pictet-Emerging Mkts High Div I dm GBP 110 55 116 85 135 75 132 64 - - 1.07 4.10PIMCO GIS RAE Fdmtl Em Mkts E Acc 110 52 116 86 - - - - - - 1.60 -Polar Capital Emerg Mkts Inc I USD Acc 104 86 113 89 128 81 130 67 - - 1.27 -Polar Capital Emerging Markets Gr I USD 102 91 113 90 128 80 129 68 - - 1.29 -Principal Emerging Markets Eq I Acc USD 113 26 128 30 151 35 142 52 157 26 1.74 -Robeco Emerging Stars Equities F £ 111 42 122 58 - - - - - - 1.72 -Robeco QI Emerging Cnsrv Eqs F £ 106 80 116 82 136 74 - - - - 0.85 -Russell Inv Emerging Markets I 109 59 123 54 148 47 150 34 179 18 1.40 0.89Russell Inv EMkt Dbt Lcl Ccy I GBP 99 93 104 92 120 84 103 73 - - - 4.16RWC Global Emerging Markets R GBP Acc 116 7 131 12 - - - - - - 1.38 -Schroder Global Emerg Mkt Z Acc 113 19 129 22 159 17 159 25 185 14 0.95 0.93Schroder ISF QEP Glbl Em Mkts Z Acc GBP 109 62 119 68 140 67 144 46 - - 1.11 -Schroder QEP Glbl EMM Z GBP Acc 110 57 119 73 141 66 - - - - - 2.13Scottish Widows Emerg Markets A 111 43 124 50 148 46 141 54 144 29 1.73 1.16SLI Global Emerging Mrkt Eq Inc Plat 1 A 114 16 129 23 155 25 167 15 - - - 1.84SLI Global Emerging Mrkt Eq Plat 1 Acc 113 21 131 11 154 28 165 17 - - - 0.84T. Rowe Price Emerging Mkts Eq Q GBP 114 10 131 14 163 11 165 18 163 24 1.17 -Templeton Em Mkts Smlr Coms W(acc)GBP 106 82 121 65 150 37 194 2 199 8 1.65 -Templeton Global Emerging Markets W Acc 114 17 129 25 153 33 125 69 114 35 1.20 0.76Threadneedle Global EM Eq Z Acc GBP 109 65 121 61 136 70 144 47 160 25 0.93 0.86UBS Emerging Markets Equity Income C Acc 109 61 121 62 136 73 131 65 - - - 3.87UBS Global Emerging Markets Equity C Acc 117 1 130 15 171 4 162 20 168 22 - 1.25UBS Global Emerging Markets Opp Q GBP 116 8 135 8 178 1 - - - - 1.25 -Vanguard Emerg Mkts Stk Idx GBP Acc 111 38 125 40 149 44 146 42 - - 0.40 1.80Vanguard Global Emerging Markets A Acc 110 50 126 38 - - - - - - - 0.74Average/Total 110 93 124 92 149 84 151 73 179 35 1.23 1.38
(IA) GLOBAL EMERGING MARKETS BONDAberdeen Emerging Markets Bond I Acc 103 6 110 6 119 24 116 18 - - - 5.96Aviva Investors EM Lcl Ccy Bd Ia GBP Inc 100 31 104 26 117 35 105 24 - - 0.84 4.67Baillie Gifford Emerging Mkts Bd B Inc 99 43 105 23 119 20 99 35 - - 0.76 6.49BNY Mellon EM Dbt Lcl Ccy GBP C Inc 100 30 105 21 118 30 99 33 - - 1.19 5.28BNY Mellon Em Mkts Corp Dbt GBP W Acc H 104 3 109 8 122 16 128 11 - - 0.82 4.26Candriam Bds Em Dbt Lcl Ccis C USD Cap 100 39 103 32 119 23 106 23 - - 1.36 -
FUND 6 MONTHS 1 YEAR 3 YEARS 5 YEARS 10 YEARS TER YIELD£ £ £ £ £ % %
Candriam Bds Em Mkts C USD Cap 102 16 104 30 144 2 151 3 302 1 1.28 -Fidelity Emerging Mkt Dbt A-Acc-EUR 98 47 99 44 136 11 140 6 274 2 1.66 -First State Emerg Mkts Bd B Hdg Acc GBP 103 5 108 12 117 36 119 16 - - - 5.44GAM MultiBond EM Infl Lnkd Bd GBP R 101 22 111 5 103 43 90 37 - - 1.05 -GAM MultiBond EM Opportunities Bd GBP Ra 104 2 114 1 114 38 - - - - 1.00 5.76GAM Multibond Emerging Bond USD B 99 45 99 43 137 7 138 7 267 4 1.60 -GAM Multibond Local Emerging Bond GBP R 103 4 113 2 105 42 93 36 - - 1.32 -GlobalAccess Emerging Mkt Dbt I Acc USD 100 32 101 40 136 9 - - - - - 4.14GlobalAccess EmMkt Lcl Ccy Dbt M Dis USD 98 46 104 29 117 37 100 32 - - - 5.41GS EM Corp Bd R Inc GBP Hdg 102 13 107 14 117 31 121 14 - - 0.95 4.48GS Em Mkts Dbt Blnd R Inc GBP 102 14 108 9 120 19 - - - - 0.95 4.97GS Em Mkts Dbt R Inc GBP Hdg 102 15 108 11 118 29 117 17 - - 1.00 5.04GS Emerging Mkts Dbt Lcl R Inc GBP 101 21 107 16 119 22 102 26 168 14 0.95 5.68HSBC GIF Global Em Mkts Local Dbt AD 99 44 102 36 118 26 107 22 182 12 1.61 2.22Invesco Emerging Markets Bd A USD SD 101 18 102 33 140 4 142 5 248 7 1.29 5.01Investec Em Mkts Blnded Dbt I Acc GBP 101 19 104 27 129 15 121 13 - - - 5.45Investec EmMkts Lcl Ccy Dbt I Acc GBP 101 23 106 19 117 33 101 30 181 13 0.95 6.00IP Global Emerging Mkts Bd Z Acc 100 36 - - - - - - - - - -JPM Emerg Mkts Lcl Ccy Dbt A (dist) GBP 99 41 105 24 114 39 99 34 - - 1.30 5.49JPM Emerging Markets Debt A (dist) GBP 100 35 100 41 134 13 - - - - 1.45 4.68L&G Em Mkts Govt Bd (Lcl Ccy) Idx I Acc 100 33 104 25 - - - - - - - 5.76L&G Em Mkts Govt Bd (US$) Idx I Acc 98 49 99 46 136 12 134 8 - - - 5.15Legg Mason WA EM TR Bd A USD Dis(D) 100 34 99 42 132 14 125 12 224 9 1.86 3.63Loomis Sayles Em Debt & Ccies R/D USD 100 28 105 22 118 28 101 27 162 15 1.60 5.24M&G (Lux) Em Mkts Hrd Ccy Bd C GBP Acc 101 24 - - - - - - - - - -M&G Emerging Markets Bond GBP I Acc 101 25 104 31 142 3 152 2 255 5 0.94 5.02MFS® Meridian Em Mkts Dbt Lcl Ccy WH1GBP 103 7 112 4 - - - - - - 1.15 -MFS® Meridian Emerging Mkts Dbt WH1 GBP 102 12 108 13 117 34 120 15 - - 1.10 -Neuberger Berman EM Corp Dbt GBP I Acc 103 10 107 15 118 27 - - - - 1.10 -Neuberger Berman EM Dbt Blnd GBP I Acc 103 11 107 17 - - - - - - 1.00 -Neuberger Berman EM DbtHrdCcy GBP I Acc 105 1 113 3 - - - - - - 1.00 -Old Mutual Em Mkt Debt A EUR Acc 100 29 102 37 139 5 133 10 252 6 1.82 -Pictet-Emerging Local Ccy Dbt I dy GBP 99 40 102 34 117 32 100 31 182 11 0.94 5.48Pictet-Global Emerging Debt I GBP 100 37 99 45 136 8 - - - - 0.83 -PIMCO GIS Em Mkts Bd Instl GBP Hdg Acc 103 8 109 7 121 17 116 19 184 10 0.79 -PIMCO GIS Emerg Lcl Bd E USD Acc 99 42 104 28 119 25 101 29 - - 1.89 -PIMCO GIS Emerg Mkts Corp Bd Inst £H Inc 103 9 107 18 112 40 108 21 - - 0.95 4.72PIMCO GIS Emerging Asia Bond E USD 98 48 96 47 119 21 112 20 - - 1.50 5.75Pioneer SICAV Emerg Mkts Bd N GBP ND 101 20 102 35 145 1 156 1 271 3 0.77 -SLI Emerging Market Debt Plat 1 Acc 100 27 101 38 136 10 145 4 - - - 4.40Templeton Emerging Mkts Bd W(Qdis)GBP-H1 101 17 108 10 111 41 105 25 - - 1.12 9.34Threadneedle EM Bd Z Inc GBP 100 38 101 39 138 6 133 9 236 8 - 6.57Threadneedle EM Local Z Inc GBP 100 26 105 20 120 18 101 28 - - 0.90 6.95Average/Total 101 49 105 47 124 43 117 37 226 15 1.17 5.30
(IA) GLOBAL EQUITY INCOMEAberdeen World Equity Income I Acc 106 13 112 12 131 33 139 29 - - - 3.48Aptus Global Financials B Acc 109 3 129 1 153 2 213 2 - - - 4.58Artemis Global Equity Income I Inc GBP 107 10 112 14 - - - - - - 0.96 3.39Artemis Global Income I Inc 107 8 112 15 146 15 220 1 - - 0.99 3.45Aviva Investors Global Eq Inc 2 GBP Acc 107 9 113 8 148 7 191 14 189 8 1.14 2.62Baillie Gifford Global Inc Growth B Inc 106 16 114 5 153 3 189 15 202 7 0.70 2.55BlackRock Global Income D Acc 101 45 109 29 148 6 191 13 - - - 2.50Courtiers Glbl (ex UK) Eq Inc Retl R 104 33 108 38 - - - - - - - 0.86Davy Defensive Equity Income H GBP Acc 102 44 102 49 - - - - - - - -Davy Global Equity Income U GBP Acc 103 36 105 47 - - - - - - - -Epoch Global Eq Shld Yld A Instl GBP Inc 100 48 103 48 - - - - - - - 0.77Fidelity Global Dividend W Acc 101 46 107 44 142 20 201 4 - - - 2.77Fidelity Global Enhanced Income W Acc 100 47 106 46 141 23 - - - - - 3.57GAM Multistock Global Equity Inc EUR B 106 15 112 16 137 27 186 19 163 12 1.50 -GlobalAccess Global Equity Inc I Dis USD 105 21 109 28 141 22 - - - - - 2.62Guinness Global Equity Income Y GBP Acc 104 34 110 26 142 21 196 7 - - 0.99 -HSBC Global Equity Income C Inc 105 22 - - - - - - - - - -Investec Global Dividend I Acc Net GBP 106 17 113 7 - - - - - - - 2.24IP Global Equity Income Z Acc 106 14 113 10 146 13 198 5 - - - 2.98Janus Henderson Global Eq Inc I Inc 105 27 111 17 146 16 197 6 177 10 1.05 3.29JPM Global Equity Income C Net Acc 107 11 110 24 147 9 193 11 - - 0.93 2.42Jupiter Global Equity Income I Acc 105 23 110 25 143 19 - - - - - 2.87Lazard Global Equity Income C Acc 103 37 107 39 126 36 153 28 186 9 - 4.83Lazard Global Equity Income C Acc GBP 103 38 107 43 - - - - - - - -Legg Mason IF CB Glbl Eq Inc X Inc 105 26 113 6 146 17 192 12 - - - 3.30Legg Mason IF MC Glb Eq Inc X Acc £ 105 25 110 23 137 26 169 23 - - - 3.43Legg Mason IF RARE Gbl Infras Inc X Inc 97 51 108 36 - - - - - - - 4.18LF Canlife Global Equity Income C Acc 104 30 109 31 146 14 180 21 - - - 3.49LF Miton Global Infrastructure Inc B Acc 98 50 - - - - - - - - - -Liontrust Global Income I Inc 105 24 108 33 133 31 165 25 177 11 0.90 5.29Mirabaud Global Equity Hi Inc D GBP Acc 109 4 109 30 134 29 - - - - 1.02 -Neptune Global Income C Acc GBP 108 6 107 42 123 38 160 26 - - - 3.01Newton Global Income Inst W Acc 102 40 108 35 154 1 193 10 242 1 - 3.10Old Mutual Global Equity Inc R GBP Inc 110 1 117 2 - - - - - - 0.00 2.47Old Mutual Newton Global Inc U2 GBP Acc 102 41 108 37 153 4 - - - - - 3.02Pictet-High Dividend Selection I dm GBP 102 42 107 40 136 28 166 24 - - 0.98 3.60Pioneer SICAV Glbl Eq Trgt Inc N GBP DM 104 35 107 45 133 32 - - - - 0.95 6.76Premier Global Infrastructure Inc C Inc 102 43 107 41 134 30 187 18 139 13 1.25 5.01Sarasin Global Dividend P Acc 106 18 111 21 147 11 - - - - - 2.45Sarasin Global Dividend Stg Hdg P Acc 108 7 116 3 129 34 - - - - - 2.35Sarasin Global Higher Div P Acc 104 28 110 22 147 8 195 8 228 4 - 3.29Sarasin Global Higher Div Stg Hdg P Acc 107 12 115 4 127 35 169 22 - - - 3.19Schroder Global Equity Income Z Acc 110 2 111 18 150 5 202 3 239 2 0.90 2.93SLI Global Equity Income Plat 1 Acc 103 39 108 34 141 24 188 17 218 6 - 1.71TB Saracen Global Income and Growth BAcc 104 29 111 20 146 18 188 16 - - 1.02 4.05The TM Overstone UCITS Eq Inc I Acc 108 5 111 19 147 10 193 9 - - - 3.13Threadneedle Glbl Eq Inc Z Inc GBP 104 31 109 27 147 12 185 20 228 3 0.88 3.48Trojan Global Income O Acc 104 32 109 32 - - - - - - - 2.59UBS Global Enhanced Equity Income C Acc 105 20 112 13 123 37 - - - - - 6.11Vanguard Global Equity Income A GBP Acc 105 19 112 11 - - - - - - - 2.75Veritas Global Equity Income A GBP 99 49 113 9 139 25 155 27 220 5 1.13 3.63
FUND 6 MONTHS 1 YEAR 3 YEARS 5 YEARS 10 YEARS TER YIELD FUND 6 MONTHS 1 YEAR 3 YEARS 5 YEARS 10 YEARS TER YIELD £ £ £ £ £ % % £ £ £ £ £ % %
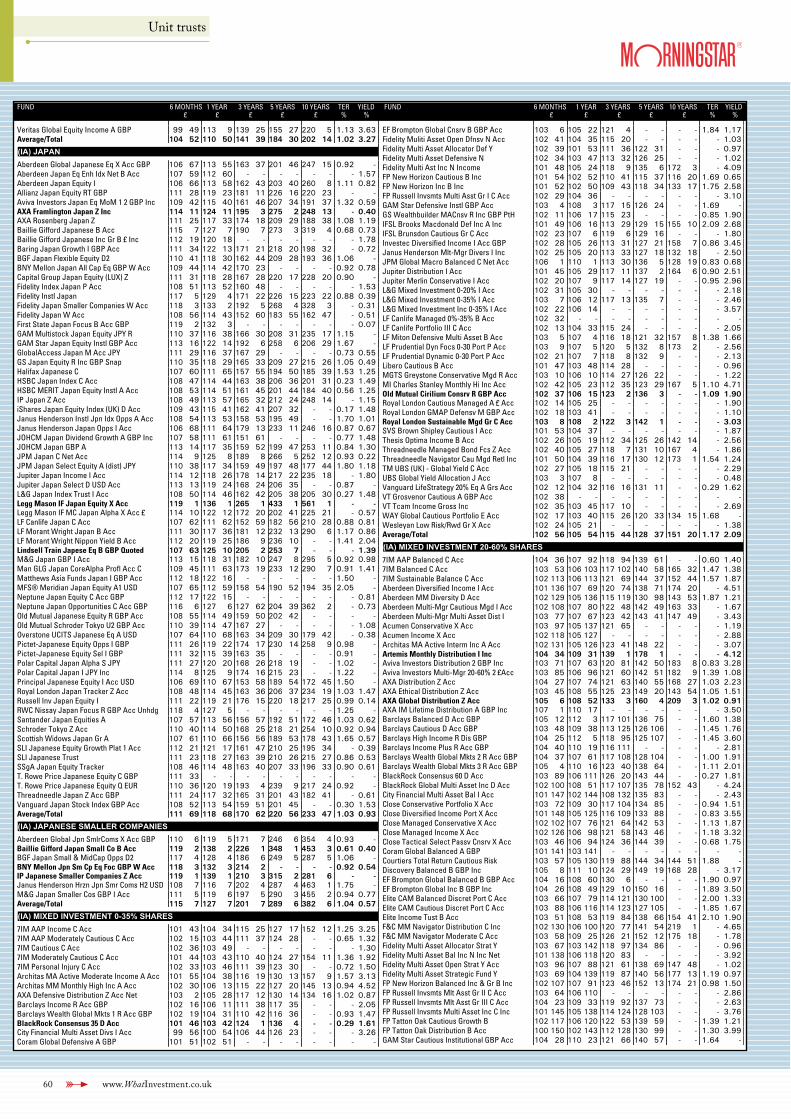
60 www.WhatInvestment.co.uk
Unit trusts
FUND 6 MONTHS 1 YEAR 3 YEARS 5 YEARS 10 YEARS TER YIELD£ £ £ £ £ % %
Veritas Global Equity Income A GBP 99 49 113 9 139 25 155 27 220 5 1.13 3.63Average/Total 104 52 110 50 141 39 184 30 202 14 1.02 3.27
(IA) JAPANAberdeen Global Japanese Eq X Acc GBP 106 67 113 55 163 37 201 46 247 15 0.92 -Aberdeen Japan Eq Enh Idx Net B Acc 107 59 112 60 - - - - - - - 1.57Aberdeen Japan Equity I 106 66 113 58 162 43 203 40 260 8 1.11 0.82Allianz Japan Equity RT GBP 111 28 119 23 181 11 226 16 220 23 - -Aviva Investors Japan Eq MoM 1 2 GBP Inc 109 42 115 40 161 46 207 34 191 37 1.32 0.59AXA Framlington Japan Z Inc 114 11 124 11 195 3 275 2 248 13 - 0.40AXA Rosenberg Japan Z 111 25 117 33 174 18 209 29 188 38 1.08 1.19Baillie Gifford Japanese B Acc 115 7 127 7 190 7 273 3 319 4 0.68 0.73Baillie Gifford Japanese Inc Gr B £ Inc 112 19 120 18 - - - - - - - 1.78Baring Japan Growth I GBP Acc 111 34 122 13 171 21 218 20 198 32 - 0.72BGF Japan Flexible Equity D2 110 41 118 30 162 44 209 28 193 36 1.06 -BNY Mellon Japan All Cap Eq GBP W Acc 109 44 114 42 170 23 - - - - 0.92 0.78Capital Group Japan Equity (LUX) Z 111 31 118 28 167 28 220 17 228 20 0.90 -Fidelity Index Japan P Acc 108 51 113 52 160 48 - - - - - 1.53Fidelity Instl Japan 117 5 129 4 171 22 226 15 223 22 0.88 0.39Fidelity Japan Smaller Companies W Acc 118 3 133 2 192 5 268 4 328 3 - 0.31Fidelity Japan W Acc 108 56 114 43 152 60 183 55 162 47 - 0.51First State Japan Focus B Acc GBP 119 2 132 3 - - - - - - - 0.07GAM Multistock Japan Equity JPY R 110 37 116 38 166 30 208 31 235 17 1.15 -GAM Star Japan Equity Instl GBP Acc 113 16 122 14 192 6 258 6 206 29 1.67 -GlobalAccess Japan M Acc JPY 111 29 116 37 167 29 - - - - 0.73 0.55GS Japan Equity R Inc GBP Snap 110 35 118 29 165 33 209 27 215 26 1.05 0.49Halifax Japanese C 107 60 111 65 157 55 194 50 185 39 1.53 1.25HSBC Japan Index C Acc 108 47 114 44 163 38 206 36 201 31 0.23 1.49HSBC MERIT Japan Equity Instl A Acc 108 53 114 51 161 45 201 44 184 40 0.56 1.25IP Japan Z Acc 108 49 113 57 165 32 212 24 248 14 - 1.15iShares Japan Equity Index (UK) D Acc 109 43 115 41 162 41 207 32 - - 0.17 1.48Janus Henderson Instl Jpn Idx Opps A Acc 108 54 113 53 158 53 195 49 - - 1.70 1.01Janus Henderson Japan Opps I Acc 106 68 111 64 179 13 233 11 246 16 0.87 0.67JOHCM Japan Dividend Growth A GBP Inc 107 58 111 61 151 61 - - - - 0.77 1.48JOHCM Japan GBP A 113 14 117 35 159 52 199 47 253 11 0.84 1.30JPM Japan C Net Acc 114 9 125 8 189 8 266 5 252 12 0.93 0.22JPM Japan Select Equity A (dist) JPY 110 38 117 34 159 49 197 48 177 44 1.80 1.18Jupiter Japan Income I Acc 114 12 118 26 178 14 217 22 235 18 - 1.80Jupiter Japan Select D USD Acc 113 13 119 24 168 24 206 35 - - 0.87 -L&G Japan Index Trust I Acc 108 50 114 46 162 42 205 38 205 30 0.27 1.48Legg Mason IF Japan Equity X Acc 119 1 136 1 265 1 433 1 561 1 - -Legg Mason IF MC Japan Alpha X Acc £ 114 10 122 12 172 20 202 41 225 21 - 0.57LF Canlife Japan C Acc 107 62 111 62 152 59 182 56 210 28 0.88 0.81LF Morant Wright Japan B Acc 111 30 117 36 181 12 232 13 290 6 1.17 0.86LF Morant Wright Nippon Yield B Acc 112 20 119 25 186 9 236 10 - - 1.41 2.04Lindsell Train Japese Eq B GBP Quoted 107 63 125 10 205 2 253 7 - - - 1.39M&G Japan GBP I Acc 113 15 118 31 182 10 247 8 295 5 0.92 0.98Man GLG Japan CoreAlpha Profl Acc C 109 45 111 63 173 19 233 12 290 7 0.91 1.41Matthews Asia Funds Japan I GBP Acc 112 18 122 16 - - - - - - 1.50 -MFS® Meridian Japan Equity A1 USD 107 65 112 59 158 54 190 52 194 35 2.05 -Neptune Japan Equity C Acc GBP 112 17 122 15 - - - - - - - 0.81Neptune Japan Opportunities C Acc GBP 116 6 127 6 127 62 204 39 362 2 - 0.73Old Mutual Japanese Equity R GBP Acc 108 55 114 49 159 50 202 42 - - - -Old Mutual Schroder Tokyo U2 GBP Acc 110 39 114 47 167 27 - - - - - 1.08Overstone UCITS Japanese Eq A USD 107 64 110 68 163 34 209 30 179 42 - 0.38Pictet-Japanese Equity Opps I GBP 111 26 119 22 174 17 230 14 258 9 0.98 -Pictet-Japanese Equity Sel I GBP 111 32 115 39 163 35 - - - - 0.91 -Polar Capital Japan Alpha S JPY 111 27 120 20 168 26 218 19 - - 1.02 -Polar Capital Japan I JPY Inc 114 8 125 9 174 16 215 23 - - 1.22 -Principal Japanese Equity I Acc USD 106 69 110 67 153 58 189 54 172 45 1.50 -Royal London Japan Tracker Z Acc 108 48 114 45 163 36 206 37 234 19 1.03 1.47Russell Inv Japan Equity I 111 22 119 21 176 15 220 18 217 25 0.99 0.14RWC Nissay Japan Focus R GBP Acc Unhdg 118 4 127 5 - - - - - - 1.25 -Santander Japan Equities A 107 57 113 56 156 57 192 51 172 46 1.03 0.62Schroder Tokyo Z Acc 110 40 114 50 168 25 218 21 254 10 0.92 0.94Scottish Widows Japan Gr A 107 61 110 66 156 56 189 53 178 43 1.65 0.57SLI Japanese Equity Growth Plat 1 Acc 112 21 121 17 161 47 210 25 195 34 - 0.39SLI Japanese Trust 111 23 118 27 163 39 210 26 215 27 0.86 0.53SSgA Japan Equity Tracker 108 46 114 48 163 40 207 33 196 33 0.90 0.61T. Rowe Price Japanese Equity C GBP 111 33 - - - - - - - - - -T. Rowe Price Japanese Equity Q EUR 110 36 120 19 193 4 239 9 217 24 0.92 -Threadneedle Japan Z Acc GBP 111 24 117 32 165 31 201 43 182 41 - 0.61Vanguard Japan Stock Index GBP Acc 108 52 113 54 159 51 201 45 - - 0.30 1.53Average/Total 111 69 118 68 170 62 220 56 233 47 1.03 0.93
(IA) JAPANESE SMALLER COMPANIESAberdeen Global Jpn SmlrComs X Acc GBP 110 6 119 5 171 7 246 6 354 4 0.93 -Baillie Gifford Japan Small Co B Acc 119 2 138 2 226 1 348 1 453 3 0.61 0.40BGF Japan Small & MidCap Opps D2 117 4 128 4 186 6 249 5 287 5 1.06 -BNY Mellon Jpn Sm Cp Eq Foc GBP W Acc 118 3 132 3 214 2 - - - - 0.92 0.54IP Japanese Smaller Companies Z Acc 119 1 139 1 210 3 315 2 281 6 - -Janus Henderson Hrzn Jpn Smr Coms H2 USD 108 7 116 7 202 4 287 4 463 1 1.75 -M&G Japan Smaller Cos GBP I Acc 111 5 119 6 197 5 290 3 455 2 0.94 0.77Average/Total 115 7 127 7 201 7 289 6 382 6 1.04 0.57
(IA) MIXED INVESTMENT 0-35% SHARES7IM AAP Income C Acc 101 43 104 34 115 25 127 17 152 12 1.25 3.257IM AAP Moderately Cautious C Acc 102 15 103 44 111 37 124 28 - - 0.65 1.327IM Cautious C Acc 102 36 103 49 - - - - - - - 1.307IM Moderately Cautious C Acc 101 44 103 43 110 40 124 27 154 11 1.36 1.927IM Personal Injury C Acc 102 33 103 46 111 39 123 30 - - 0.72 1.50Architas MA Active Moderate Income A Acc 101 55 104 38 116 19 130 13 157 9 1.57 3.13Architas MM Monthly High Inc A Acc 102 30 106 13 115 22 127 20 145 13 0.94 4.52AXA Defensive Distribution Z Acc Net 103 2 105 28 117 12 130 14 134 16 1.02 0.87Barclays Income R Acc GBP 102 16 106 11 111 38 117 35 - - - 2.05Barclays Wealth Global Mkts 1 R Acc GBP 102 19 104 31 110 42 116 36 - - 0.93 1.47BlackRock Consensus 35 D Acc 101 46 103 42 124 1 136 4 - - 0.29 1.61City Financial Multi Asset Divs I Acc 99 56 100 54 106 44 126 23 - - - 3.26Coram Global Defensive A GBP 101 51 102 51 - - - - - - - -
FUND 6 MONTHS 1 YEAR 3 YEARS 5 YEARS 10 YEARS TER YIELD£ £ £ £ £ % %
EF Brompton Global Cnsrv B GBP Acc 103 6 105 22 121 4 - - - - 1.84 1.17Fidelity Muliti Asset Open Dfnsv N Acc 102 41 104 35 115 20 - - - - - 1.03Fidelity Multi Asset Allocator Def Y 102 39 101 53 111 36 122 31 - - - 0.97Fidelity Multi Asset Defensive N 102 34 103 47 113 32 126 25 - - - 1.02Fidelity Multi Ast Inc N Income 101 48 105 24 118 9 135 6 172 3 - 4.09FP New Horizon Cautious B Inc 101 54 102 52 110 41 115 37 116 20 1.69 0.65FP New Horizon Inc B Inc 101 52 102 50 109 43 118 34 133 17 1.75 2.58FP Russell Invsmts Multi Asst Gr I C Acc 102 29 104 36 - - - - - - - 3.10GAM Star Defensive Instl GBP Acc 103 4 108 3 117 15 126 24 - - 1.69 -GS Wealthbuilder MACnsv R Inc GBP PtH 102 11 106 17 115 23 - - - - 0.85 1.90IFSL Brooks Macdonald Def Inc A Inc 101 49 106 16 113 29 129 15 155 10 2.09 2.68IFSL Brunsdon Cautious Gr C Acc 102 23 107 6 119 6 129 16 - - - 1.80Investec Diversified Income I Acc GBP 102 28 105 26 113 31 127 21 158 7 0.86 3.45Janus Henderson Mlt-Mgr Divers I Inc 102 25 105 20 113 33 127 18 132 18 - 2.50JPM Global Macro Balanced C Net Acc 106 1 110 1 113 30 136 5 128 19 0.83 0.68Jupiter Distribution I Acc 101 45 105 29 117 11 137 2 164 6 0.90 2.51Jupiter Merlin Conservative I Acc 102 20 107 9 117 14 127 19 - - 0.95 2.96L&G Mixed Investment 0-20% I Acc 102 31 105 30 - - - - - - - 2.18L&G Mixed Investment 0-35% I Acc 103 7 106 12 117 13 135 7 - - - 2.46L&G Mixed Investment Inc 0-35% I Acc 102 22 106 14 - - - - - - - 3.57LF Canlife Managed 0%-35% B Acc 102 32 - - - - - - - - - -LF Canlife Portfolio III C Acc 102 13 104 33 115 24 - - - - - 2.05LF Miton Defensive Multi Asset B Acc 103 5 107 4 116 18 121 32 157 8 1.38 1.66LF Prudential Dyn Focs 0-30 Port P Acc 103 9 107 5 120 5 132 8 173 2 - 2.56LF Prudential Dynamic 0-30 Port P Acc 102 21 107 7 118 8 132 9 - - - 2.13Libero Cautious B Acc 101 47 103 48 114 28 - - - - - 0.96MGTS Greystone Conservative Mgd R Acc 103 10 106 10 114 27 126 22 - - - 1.22MI Charles Stanley Monthly Hi Inc Acc 102 42 105 23 112 35 123 29 167 5 1.10 4.71Old Mutual Cirilium Consrv R GBP Acc 102 37 106 15 123 2 136 3 - - 1.09 1.90Royal London Cautious Managed A £ Acc 102 14 105 25 - - - - - - - 1.90Royal London GMAP Defensv M GBP Acc 102 18 103 41 - - - - - - - 1.10Royal London Sustainable Mgd Gr C Acc 103 8 108 2 122 3 142 1 - - - 3.03SVS Brown Shipley Cautious I Acc 101 53 104 37 - - - - - - - 1.87Thesis Optima Income B Acc 102 26 105 19 112 34 125 26 142 14 - 2.56Threadneedle Managed Bond Fcs Z Acc 102 40 105 27 118 7 131 10 167 4 - 1.86Threadneedle Navigator Cau Mgd Retl Inc 101 50 104 39 116 17 130 12 173 1 1.54 1.24TM UBS (UK) - Global Yield C Acc 102 27 105 18 115 21 - - - - - 2.29UBS Global Yield Allocation J Acc 103 3 107 8 - - - - - - - 0.48Vanguard LifeStrategy 20% Eq A Grs Acc 102 12 104 32 116 16 131 11 - - 0.29 1.62VT Grosvenor Cautious A GBP Acc 102 38 - - - - - - - - - -VT Tcam Income Gross Inc 102 35 103 45 117 10 - - - - - 2.69WAY Global Cautious Portfolio E Acc 102 17 103 40 115 26 120 33 134 15 1.68 -Wesleyan Low Risk/Rwd Gr X Acc 102 24 105 21 - - - - - - - 1.38Average/Total 102 56 105 54 115 44 128 37 151 20 1.17 2.09
(IA) MIXED INVESTMENT 20-60% SHARES7IM AAP Balanced C Acc 104 36 107 92 118 94 139 61 - - 0.60 1.407IM Balanced C Acc 103 53 106 103 117 102 140 58 165 32 1.47 1.387IM Sustainable Balance C Acc 102 113 106 113 121 69 144 37 152 44 1.57 1.87Aberdeen Diversified Income I Acc 101 136 107 69 120 74 138 71 174 20 - 4.51Aberdeen MM Diversity D Acc 102 129 105 136 115 119 130 98 143 53 1.87 1.21Aberdeen Multi-Mgr Cautious Mgd I Acc 102 108 107 80 122 48 142 49 163 33 - 1.67Aberdeen Multi-Mgr Multi Asset Dist I 103 77 107 67 123 42 143 41 147 49 - 3.43Acumen Conservative X Acc 103 97 105 137 121 65 - - - - - 1.19Acumen Income X Acc 102 118 105 127 - - - - - - - 2.88Architas MA Active Interm Inc A Acc 102 131 105 126 123 41 148 22 - - - 3.07Artemis Monthly Distribution I Inc 104 34 109 31 139 1 178 1 - - - 4.12Aviva Investors Distribution 2 GBP Inc 103 71 107 63 120 81 142 50 183 8 0.83 3.28Aviva Investors Multi-Mgr 20-60% 2 £Acc 103 85 106 96 121 60 142 51 182 9 1.39 1.08AXA Distribution Z Acc 104 27 107 74 121 63 140 55 168 27 1.03 2.23AXA Ethical Distribution Z Acc 103 45 108 55 125 23 149 20 143 54 1.05 1.51AXA Global Distribution Z Acc 105 6 108 52 133 3 160 4 209 3 1.02 0.91AXA IM Lifetime Distribution A GBP Inc 107 1 110 17 - - - - - - - 3.50Barclays Balanced D Acc GBP 105 12 112 3 117 101 136 75 - - 1.60 1.38Barclays Cautious D Acc GBP 103 48 109 38 113 125 126 106 - - 1.45 1.76Barclays High Income R Dis GBP 104 25 112 5 118 95 125 107 - - 1.45 3.60Barclays Income Plus R Acc GBP 104 40 110 19 116 111 - - - - - 2.81Barclays Wealth Global Mkts 2 R Acc GBP 104 37 107 61 117 108 128 104 - - 1.00 1.91Barclays Wealth Global Mkts 3 R Acc GBP 105 4 110 16 123 40 138 64 - - 1.11 2.01BlackRock Consensus 60 D Acc 103 89 106 111 126 20 143 44 - - 0.27 1.81BlackRock Global Multi Asset Inc D Acc 102 100 108 51 117 107 135 78 152 43 - 4.24City Financial Multi Asset Bal I Acc 101 147 102 144 108 132 135 83 - - - 2.43Close Conservative Portfolio X Acc 103 72 109 30 117 104 134 85 - - 0.94 1.51Close Diversified Income Port X Acc 101 148 105 125 116 109 133 88 - - 0.83 3.55Close Managed Conservative X Acc 102 102 107 76 121 64 142 53 - - 1.13 1.87Close Managed Income X Acc 102 126 106 98 121 58 143 46 - - 1.18 3.32Close Tactical Select Passv Cnsrv X Acc 103 46 106 94 124 36 144 39 - - 0.68 1.75Coram Global Balanced A GBP 101 141 103 141 - - - - - - - -Courtiers Total Return Cautious Risk 103 57 105 130 119 88 144 34 144 51 1.88 -Discovery Balanced B GBP Inc 105 8 111 10 124 29 149 19 168 28 - 3.17EF Brompton Global Balanced B GBP Acc 104 16 108 60 130 6 - - - - 1.90 0.97EF Brompton Global Inc B GBP Inc 104 26 108 49 129 10 150 16 - - 1.89 3.50Elite CAM Balanced Discret Port C Acc 103 66 107 79 114 121 130 100 - - 2.00 1.33Elite CAM Cautious Discret Port C Acc 103 88 106 116 114 123 127 105 - - 1.85 1.67Elite Income Tust B Acc 103 51 108 53 119 84 138 66 154 41 2.10 1.90F&C MM Navigator Distribution C Inc 102 130 106 100 120 77 141 54 219 1 - 4.65F&C MM Navigator Moderate C Acc 103 58 109 25 126 21 152 12 175 18 - 1.78Fidelity Multi Asset Allocator Strat Y 103 67 103 142 118 97 134 86 - - - 0.96Fidelity Multi Asset Bal Inc N Inc Net 101 138 106 118 120 83 - - - - - 3.92Fidelity Multi Asset Open Strat Y Acc 103 96 107 88 121 61 138 69 147 48 - 1.02Fidelity Multi Asset Strategic Fund Y 103 69 104 139 119 87 140 56 177 13 1.19 0.97FP New Horizon Balanced Inc & Gr B Inc 102 107 107 91 123 46 152 13 174 21 0.98 1.50FP Russell Invsmts Mlt Asst Gr II C Acc 103 64 106 110 - - - - - - - 2.86FP Russell Invsmts Mlt Asst Gr III C Acc 104 23 109 33 119 92 137 73 - - - 2.63FP Russell Invsmts Multi Asset Inc C Inc 101 145 105 138 114 124 128 103 - - - 3.76FP Tatton Oak Cautious Growth B 102 117 106 120 122 53 139 59 - - 1.39 1.21FP Tatton Oak Distribution B Acc 100 150 102 143 112 128 130 99 - - 1.30 3.99GAM Star Cautious Institutional GBP Acc 104 28 110 23 121 66 140 57 - - 1.64 -
FUND 6 MONTHS 1 YEAR 3 YEARS 5 YEARS 10 YEARS TER YIELD FUND 6 MONTHS 1 YEAR 3 YEARS 5 YEARS 10 YEARS TER YIELD £ £ £ £ £ % % £ £ £ £ £ % %
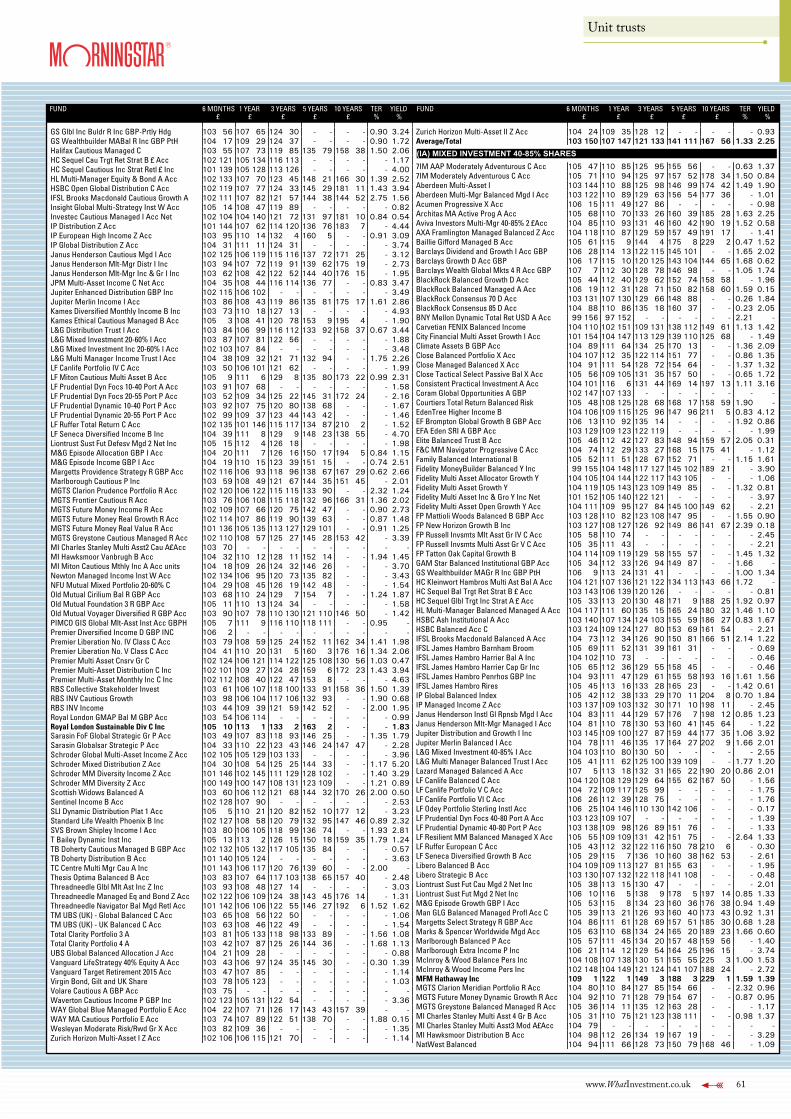
www.WhatInvestment.co.uk 61
Unit trusts
FUND 6 MONTHS 1 YEAR 3 YEARS 5 YEARS 10 YEARS TER YIELD£ £ £ £ £ % %
GS Glbl Inc Buldr R Inc GBP-Prtly Hdg 103 56 107 65 124 30 - - - - 0.90 3.24GS Wealthbuilder MABal R Inc GBP PtH 104 17 109 29 124 37 - - - - 0.90 1.72Halifax Cautious Managed C 103 55 107 73 119 85 135 79 158 38 1.50 2.06HC Sequel Cau Trgt Ret Strat B £ Acc 102 121 105 134 116 113 - - - - - 1.17HC Sequel Cautious Inc Strat Retl £ Inc 101 139 105 128 113 126 - - - - - 4.00HL Multi-Manager Equity & Bond A Acc 102 133 107 70 123 45 148 21 166 30 1.39 2.52HSBC Open Global Distribution C Acc 102 119 107 77 124 33 145 29 181 11 1.43 3.94IFSL Brooks Macdonald Cautious Growth A 102 111 107 82 121 57 144 38 144 52 2.75 1.56Insight Global Multi-Strategy Inst W Acc 105 14 108 47 119 89 - - - - - 0.82Investec Cautious Managed I Acc Net 102 104 104 140 121 72 131 97 181 10 0.84 0.54IP Distribution Z Acc 101 144 107 62 114 120 136 76 183 7 - 4.44IP European High Income Z Acc 103 95 110 14 132 4 160 5 - - 0.91 3.09IP Global Distribution Z Acc 104 31 111 11 124 31 - - - - - 3.74Janus Henderson Cautious Mgd I Acc 102 125 106 119 115 116 137 72 171 25 - 3.12Janus Henderson Mlt-Mgr Distr I Inc 103 94 107 72 119 91 139 62 175 19 - 2.73Janus Henderson Mlt-Mgr Inc & Gr I Inc 103 62 108 42 122 52 144 40 176 15 - 1.95JPM Multi-Asset Income C Net Acc 104 35 108 44 116 114 136 77 - - 0.83 3.47Jupiter Enhanced Distribution GBP Inc 102 115 106 102 - - - - - - - 3.49Jupiter Merlin Income I Acc 103 86 108 43 119 86 135 81 175 17 1.61 2.86Kames Diversified Monthly Income B Inc 103 73 110 18 127 13 - - - - - 4.93Kames Ethical Cautious Managed B Acc 105 3 108 41 120 78 153 9 195 4 - 1.90L&G Distribution Trust I Acc 103 84 106 99 116 112 133 92 158 37 0.67 3.44L&G Mixed Investment 20-60% I Acc 103 87 107 81 122 56 - - - - - 1.88L&G Mixed Investment Inc 20-60% I Acc 102 103 107 84 - - - - - - - 3.48L&G Multi Manager Income Trust I Acc 104 38 109 32 121 71 132 94 - - 1.75 2.26LF Canlife Portfolio IV C Acc 103 50 106 101 121 62 - - - - - 1.99LF Miton Cautious Multi Asset B Acc 105 9 111 6 129 8 135 80 173 22 0.99 2.31LF Prudential Dyn Focs 10-40 Port A Acc 103 91 107 68 - - - - - - - 1.58LF Prudential Dyn Focs 20-55 Port P Acc 103 52 109 34 125 22 145 31 172 24 - 2.16LF Prudential Dynamic 10-40 Port P Acc 103 92 107 75 120 80 138 68 - - - 1.67LF Prudential Dynamic 20-55 Port P Acc 102 99 109 37 123 44 143 42 - - - 1.46LF Ruffer Total Return C Acc 102 135 101 146 115 117 134 87 210 2 - 1.52LF Seneca Diversified Income B Inc 104 39 111 8 129 9 148 23 138 55 - 4.70Liontrust Sust Fut Defesv Mgd 2 Net Inc 105 15 112 4 126 18 - - - - - 1.98M&G Episode Allocation GBP I Acc 104 20 111 7 126 16 150 17 194 5 0.84 1.15M&G Episode Income GBP I Acc 104 19 110 15 123 39 151 15 - - 0.74 2.51Margetts Providence Strategy R GBP Acc 102 116 106 93 118 96 138 67 167 29 0.62 2.66Marlborough Cautious P Inc 103 59 108 49 121 67 144 35 151 45 - 2.01MGTS Clarion Prudence Portfolio R Acc 102 120 106 122 115 115 133 90 - - 2.32 1.24MGTS Frontier Cautious R Acc 103 76 106 108 115 118 132 96 166 31 1.36 2.02MGTS Future Money Income R Acc 102 109 107 66 120 75 142 47 - - 0.90 2.73MGTS Future Money Real Growth R Acc 102 114 107 86 119 90 139 63 - - 0.87 1.48MGTS Future Money Real Value R Acc 101 136 105 135 113 127 129 101 - - 0.91 1.25MGTS Greystone Cautious Managed R Acc 102 110 108 57 125 27 145 28 153 42 - 3.39MI Charles Stanley Multi Asst2 Cau A£Acc 103 70 - - - - - - - - - -MI Hawksmoor Vanbrugh B Acc 104 32 110 12 128 11 152 14 - - 1.94 1.45MI Miton Cautious Mthly Inc A Acc units 104 18 109 26 124 32 146 26 - - - 3.70Newton Managed Income Inst W Acc 102 134 106 95 120 73 135 82 - - - 3.43NFU Mutual Mixed Portfolio 20-60% C 104 29 108 45 126 19 142 48 - - - 1.54Old Mutual Cirilium Bal R GBP Acc 103 68 110 24 129 7 154 7 - - 1.24 1.87Old Mutual Foundation 3 R GBP Acc 105 11 110 13 124 34 - - - - - 1.58Old Mutual Voyager Diversified R GBP Acc 103 90 107 78 110 130 121 110 146 50 - 1.42PIMCO GIS Global Mlt-Asst Inst Acc GBPH 105 7 111 9 116 110 118 111 - - 0.95 -Premier Diversified Income D GBP INC 106 2 - - - - - - - - - -Premier Liberation No. IV Class C Acc 103 79 108 59 125 24 152 11 162 34 1.41 1.98Premier Liberation No. V Class C Acc 104 41 110 20 131 5 160 3 176 16 1.34 2.06Premier Multi Asset Cnsrv Gr C 102 124 106 121 114 122 125 108 130 56 1.03 0.47Premier Multi-Asset Distribution C Inc 102 101 109 27 124 28 159 6 172 23 1.43 3.94Premier Multi-Asset Monthly Inc C Inc 102 112 108 40 122 47 153 8 - - - 4.63RBS Collective Stakeholder Invest 103 61 106 107 118 100 133 91 158 36 1.50 1.39RBS INV Cautious Growth 103 98 106 104 117 106 132 93 - - 1.90 0.68RBS INV Income 103 44 109 39 121 59 142 52 - - 2.00 1.95Royal London GMAP Bal M GBP Acc 103 54 106 114 - - - - - - - 0.99Royal London Sustainable Div C Inc 105 10 113 1 133 2 163 2 - - - 1.83Sarasin FoF Global Strategic Gr P Acc 103 49 107 83 118 93 146 25 - - 1.35 1.79Sarasin Globalsar Strategic P Acc 104 33 110 22 123 43 146 24 147 47 - 2.28Schroder Global Multi-Asset Income Z Acc 102 105 105 129 103 133 - - - - - 3.96Schroder Mixed Distribution Z Acc 104 30 108 54 125 25 144 33 - - 1.17 5.20Schroder MM Diversity Income Z Acc 101 146 102 145 111 129 128 102 - - 1.40 3.29Schroder MM Diversity Z Acc 100 149 100 147 108 131 123 109 - - 1.21 0.89Scottish Widows Balanced A 103 60 106 112 121 68 144 32 170 26 2.00 0.50Sentinel Income B Acc 102 128 107 90 - - - - - - - 2.53SLI Dynamic Distribution Plat 1 Acc 105 5 110 21 120 82 152 10 177 12 - 3.23Standard Life Wealth Phoenix B Inc 102 127 108 58 120 79 132 95 147 46 0.89 2.32SVS Brown Shipley Income I Acc 103 80 106 105 118 99 136 74 - - 1.93 2.81T Bailey Dynamic Inst Inc 105 13 113 2 126 15 150 18 159 35 1.79 1.24TB Doherty Cautious Managed B GBP Acc 102 132 105 132 117 105 135 84 - - - 0.57TB Doherty Distribution B Acc 101 140 105 124 - - - - - - - 3.63TC Centre Multi Mgr Cau A Inc 101 143 106 117 120 76 139 60 - - 2.00 -Thesis Optima Balanced B Acc 103 83 107 64 117 103 138 65 157 40 - 2.48Threadneedle Glbl Mlt Ast Inc Z Inc 103 93 108 48 127 14 - - - - - 3.03Threadneedle Managed Eq and Bond Z Acc 102 122 106 109 124 38 143 45 176 14 - 1.31Threadneedle Navigator Bal Mgd Retl Acc 101 142 106 106 122 55 146 27 192 6 1.52 1.62TM UBS (UK) - Global Balanced C Acc 103 65 108 56 122 50 - - - - - 1.06TM UBS (UK) - UK Balanced C Acc 103 63 108 46 122 49 - - - - - 1.54Total Clarity Portfolio 3 A 103 81 105 133 118 98 133 89 - - 1.56 1.08Total Clarity Portfolio 4 A 103 42 107 87 125 26 144 36 - - 1.68 1.13UBS Global Balanced Allocation J Acc 104 21 109 28 - - - - - - - 0.88Vanguard LifeStrategy 40% Equity A Acc 103 43 106 97 124 35 145 30 - - 0.30 1.39Vanguard Target Retirement 2015 Acc 103 47 107 85 - - - - - - - 1.14Virgin Bond, Gilt and UK Share 103 78 105 123 - - - - - - - 1.03Volare Cautious A GBP Acc 103 75 - - - - - - - - - -Waverton Cautious Income P GBP Inc 102 123 105 131 122 54 - - - - - 3.36WAY Global Blue Managed Portfolio E Acc 104 22 107 71 126 17 143 43 157 39 - -WAY MA Cautious Portfolio E Acc 103 74 107 89 122 51 138 70 - - 1.88 0.15Wesleyan Moderate Risk/Rwd Gr X Acc 103 82 109 36 - - - - - - - 1.35Zurich Horizon Multi-Asset I Z Acc 102 106 106 115 121 70 - - - - - 1.14
FUND 6 MONTHS 1 YEAR 3 YEARS 5 YEARS 10 YEARS TER YIELD£ £ £ £ £ % %
Zurich Horizon Multi-Asset II Z Acc 104 24 109 35 128 12 - - - - - 0.93Average/Total 103 150 107 147 121 133 141 111 167 56 1.33 2.25
(IA) MIXED INVESTMENT 40-85% SHARES7IM AAP Moderately Adventurous C Acc 105 47 110 85 125 95 155 56 - - 0.63 1.377IM Moderately Adventurous C Acc 105 71 110 94 125 97 157 52 178 34 1.50 0.84Aberdeen Multi-Asset I 103 144 110 88 125 98 146 99 174 42 1.49 1.90Aberdeen Multi-Mgr Balanced Mgd I Acc 103 122 110 89 129 63 156 54 177 36 - 1.01Acumen Progressive X Acc 106 15 111 49 127 86 - - - - - 0.98Architas MA Active Prog A Acc 105 68 110 70 133 26 160 39 185 28 1.63 2.25Aviva Investors Multi-Mgr 40-85% 2 £Acc 104 85 110 93 131 46 160 42 190 19 1.52 0.58AXA Framlington Managed Balanced Z Acc 104 118 110 87 129 59 157 49 191 17 - 1.41Baillie Gifford Managed B Acc 105 61 115 9 144 4 175 8 229 2 0.47 1.52Barclays Dividend and Growth I Acc GBP 106 28 114 13 122 115 145 101 - - 1.65 2.02Barclays Growth D Acc GBP 106 17 115 10 120 125 143 104 144 65 1.68 0.62Barclays Wealth Global Mkts 4 R Acc GBP 107 7 112 30 128 78 146 98 - - 1.05 1.74BlackRock Balanced Growth D Acc 105 44 112 40 129 62 152 74 158 58 - 1.96BlackRock Balanced Managed A Acc 106 19 112 31 128 71 150 82 158 60 1.59 0.15BlackRock Consensus 70 D Acc 103 131 107 130 129 66 148 88 - - 0.26 1.84BlackRock Consensus 85 D Acc 104 88 110 86 135 18 160 37 - - 0.23 2.05BNY Mellon Dynamic Total Ret USD A Acc 99 156 97 152 - - - - - - 2.21 -Carvetian FENIX Balanced Income 104 110 102 151 109 131 138 112 149 61 1.13 1.42City Financial Multi Asset Growth I Acc 101 154 104 147 113 129 139 110 125 68 - 1.49Climate Assets B GBP Acc 104 89 111 64 134 25 170 13 - - 1.36 2.09Close Balanced Portfolio X Acc 104 107 112 35 122 114 151 77 - - 0.86 1.35Close Managed Balanced X Acc 104 91 111 54 128 72 154 64 - - 1.37 1.32Close Tactical Select Passive Bal X Acc 105 56 109 105 131 35 157 50 - - 0.65 1.72Consistent Practical Investment A Acc 104 101 116 6 131 44 169 14 197 13 1.11 3.16Coram Global Opportunities A GBP 102 147 107 133 - - - - - - - -Courtiers Total Return Balanced Risk 105 48 108 125 128 68 168 17 158 59 1.90 -EdenTree Higher Income B 104 106 109 115 125 96 147 96 211 5 0.83 4.12EF Brompton Global Growth B GBP Acc 106 13 110 92 135 14 - - - - 1.92 0.86EFA Eden SRI A GBP Acc 103 129 109 123 122 119 - - - - - 1.99Elite Balanced Trust B Acc 105 46 112 42 127 83 148 94 159 57 2.05 0.31F&C MM Navigator Progressive C Acc 104 74 112 29 133 27 168 15 175 41 - 1.12Family Balanced International B 105 52 111 51 128 67 152 71 - - 1.15 1.61Fidelity MoneyBuilder Balanced Y Inc 99 155 104 148 117 127 145 102 189 21 - 3.90Fidelity Multi Asset Allocator Growth Y 104 105 104 144 122 117 143 105 - - - 1.06Fidelity Multi Asset Growth Y 104 119 105 143 123 109 149 85 - - 1.32 0.81Fidelity Multi Asset Inc & Gro Y Inc Net 101 152 105 140 122 121 - - - - - 3.97Fidelity Multi Asset Open Growth Y Acc 104 111 109 95 127 84 145 100 149 62 - 2.21FP Mattioli Woods Balanced B GBP Acc 103 128 110 82 123 108 147 95 - - 1.55 0.90FP New Horizon Growth B Inc 103 127 108 127 126 92 149 86 141 67 2.39 0.18FP Russell Invsmts Mlt Asst Gr IV C Acc 105 58 110 74 - - - - - - - 2.45FP Russell Invsmts Multi Asst Gr V C Acc 105 35 111 43 - - - - - - - 2.21FP Tatton Oak Capital Growth B 104 114 109 119 129 58 155 57 - - 1.45 1.32GAM Star Balanced Institutional GBP Acc 105 34 112 33 126 94 149 87 - - 1.66 -GS Wealthbuilder MAGr R Inc GBP PtH 106 9 113 24 131 41 - - - - 1.00 1.34HC Kleinwort Hambros Multi Ast Bal A Acc 104 121 107 136 121 122 134 113 143 66 1.72 -HC Sequel Bal Trgt Ret Strat B £ Acc 103 143 106 139 120 126 - - - - - 0.81HC Sequel Glbl Trgt Inc Strat A £ Acc 105 33 113 20 130 48 171 9 188 25 1.92 0.97HL Multi-Manager Balanced Managed A Acc 104 117 111 60 135 15 165 24 180 32 1.46 1.10HSBC Ash Institutional A Acc 103 140 107 134 124 103 155 59 186 27 0.83 1.67HSBC Balanced Acc C 103 124 109 124 127 80 153 69 161 54 - 2.21IFSL Brooks Macdonald Balanced A Acc 104 73 112 34 126 90 150 81 166 51 2.14 1.22IFSL James Hambro Barnham Broom 105 69 111 52 131 39 161 31 - - - 0.69IFSL James Hambro Harrier Bal A Inc 104 102 110 73 - - - - - - - 0.46IFSL James Hambro Harrier Cap Gr Inc 105 65 112 36 129 55 158 45 - - - 0.46IFSL James Hambro Penrhos GBP Inc 104 93 111 47 129 61 155 58 193 16 1.61 1.56IFSL James Hambro Rires 105 45 113 16 133 28 165 23 - - 1.42 0.61IP Global Balanced Index 105 42 112 38 133 29 170 11 204 8 0.70 1.84IP Managed Income Z Acc 103 137 109 103 132 30 171 10 198 11 - 2.45Janus Henderson Instl Gl Rpnsb Mgd I Acc 104 83 111 44 129 57 176 7 198 12 0.85 1.23Janus Henderson Mlt-Mgr Managed I Acc 104 81 110 78 130 53 160 41 145 64 - 1.22Jupiter Distribution and Growth I Inc 103 145 109 100 127 87 159 44 177 35 1.06 3.92Jupiter Merlin Balanced I Acc 104 78 111 46 135 17 164 27 202 9 1.66 2.01L&G Mixed Investment 40-85% I Acc 104 103 110 80 130 50 - - - - - 2.55L&G Multi Manager Balanced Trust I Acc 105 41 111 62 125 100 139 109 - - 1.77 1.20Lazard Managed Balanced A Acc 107 5 113 18 132 31 165 22 190 20 0.86 2.01LF Canlife Balanced C Acc 104 120 108 129 129 64 155 62 167 50 - 1.56LF Canlife Portfolio V C Acc 104 72 109 117 125 99 - - - - - 1.75LF Canlife Portfolio VI C Acc 106 26 112 39 128 75 - - - - - 1.76LF Odey Portfolio Sterling Instl Acc 106 25 104 146 110 130 142 106 - - - 0.17LF Prudential Dyn Focs 40-80 Port A Acc 103 123 109 107 - - - - - - - 1.39LF Prudential Dynamic 40-80 Port P Acc 103 138 109 98 126 89 151 76 - - - 1.33LF Resilient MM Balanced Managed X Acc 105 55 109 109 131 42 151 75 - - 2.64 1.33LF Ruffer European C Acc 105 43 112 32 122 116 150 78 210 6 - 0.30LF Seneca Diversified Growth B Acc 105 29 115 7 136 10 160 38 162 53 - 2.61Libero Balanced B Acc 104 109 109 113 127 81 155 63 - - - 1.95Libero Strategic B Acc 103 130 107 132 122 118 141 108 - - - 0.48Liontrust Sust Fut Cau Mgd 2 Net Inc 105 38 113 15 130 47 - - - - - 2.01Liontrust Sust Fut Mgd 2 Net Inc 106 10 116 5 138 9 178 5 197 14 0.85 1.33M&G Episode Growth GBP I Acc 105 53 115 8 134 23 160 36 176 38 0.94 1.49Man GLG Balanced Managed Profl Acc C 105 39 113 21 126 93 160 40 173 43 0.92 1.31Margetts Select Strategy R GBP Acc 104 86 111 61 128 69 157 51 185 30 0.68 1.28Marks & Spencer Worldwide Mgd Acc 105 63 110 68 134 24 165 20 189 23 1.66 0.60Marlborough Balanced P Acc 105 57 111 45 134 20 157 48 159 56 - 1.40Marlborough Extra Income P Inc 106 21 114 12 129 54 164 25 196 15 - 3.74McInroy & Wood Balance Pers Inc 104 108 107 138 130 51 155 55 225 3 1.00 1.53McInroy & Wood Income Pers Inc 102 148 104 149 121 124 141 107 188 24 - 2.72MFM Hathaway Inc 109 1 122 1 149 3 188 3 229 1 1.59 1.39MGTS Clarion Meridian Portfolio R Acc 104 80 110 84 127 85 154 66 - - 2.32 0.96MGTS Future Money Dynamic Growth R Acc 104 92 110 71 128 79 154 67 - - 0.87 0.95MGTS Greystone Balanced Managed R Acc 105 36 114 11 135 12 163 28 - - - 1.17MI Charles Stanley Multi Asst 4 Gr B Acc 105 31 110 75 121 123 138 111 - - 0.98 1.37MI Charles Stanley Multi Asst3 Mod A£Acc 104 79 - - - - - - - - - -MI Hawksmoor Distribution B Acc 104 98 112 26 134 19 167 19 - - - 3.29NatWest Balanced 104 94 111 66 128 73 150 79 168 46 - 1.09
FUND 6 MONTHS 1 YEAR 3 YEARS 5 YEARS 10 YEARS TER YIELD FUND 6 MONTHS 1 YEAR 3 YEARS 5 YEARS 10 YEARS TER YIELD £ £ £ £ £ % % £ £ £ £ £ % %
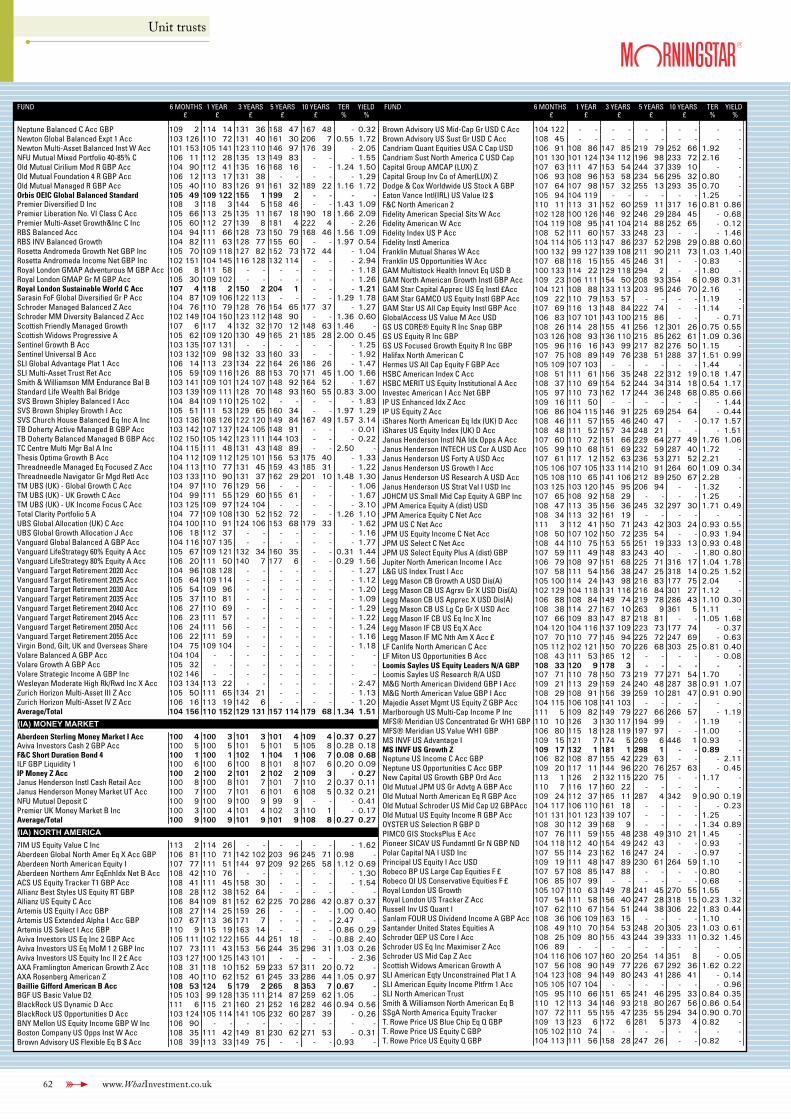
62 www.WhatInvestment.co.uk
Unit trusts
FUND 6 MONTHS 1 YEAR 3 YEARS 5 YEARS 10 YEARS TER YIELD£ £ £ £ £ % %
Neptune Balanced C Acc GBP 109 2 114 14 131 36 158 47 167 48 - 0.32Newton Global Balanced Expt 1 Acc 103 126 110 72 131 40 161 30 206 7 0.55 1.72Newton Multi-Asset Balanced Inst W Acc 101 153 105 141 123 110 146 97 176 39 - 2.05NFU Mutual Mixed Portfolio 40-85% C 106 11 112 28 135 13 149 83 - - - 1.55Old Mutual Cirilium Mod R GBP Acc 104 90 112 41 135 16 168 16 - - 1.24 1.50Old Mutual Foundation 4 R GBP Acc 106 12 113 17 131 38 - - - - - 1.29Old Mutual Managed R GBP Acc 105 40 110 83 126 91 161 32 189 22 1.16 1.72Orbis OEIC Global Balanced Standard 105 49 109 122 155 1 199 2 - - - -Premier Diversified D Inc 108 3 118 3 144 5 158 46 - - 1.43 1.09Premier Liberation No. VI Class C Acc 105 66 113 25 135 11 167 18 190 18 1.66 2.09Premier Multi-Asset Growth&Inc C Inc 105 60 112 27 139 8 181 4 222 4 - 2.26RBS Balanced Acc 104 94 111 66 128 73 150 79 168 46 1.56 1.09RBS INV Balanced Growth 104 82 111 63 128 77 155 60 - - 1.97 0.54Rosetta Andromeda Growth Net GBP Inc 105 70 109 118 127 82 152 73 172 44 - 1.04Rosetta Andromeda Income Net GBP Inc 102 151 104 145 116 128 132 114 - - - 2.94Royal London GMAP Adventurous M GBP Acc 106 8 111 58 - - - - - - - 1.18Royal London GMAP Gr M GBP Acc 105 30 109 102 - - - - - - - 1.26Royal London Sustainable World C Acc 107 4 118 2 150 2 204 1 - - - 1.21Sarasin FoF Global Diversified Gr P Acc 104 87 109 106 122 113 - - - - 1.29 1.78Schroder Managed Balanced Z Acc 104 76 110 79 128 76 154 65 177 37 - 1.27Schroder MM Diversity Balanced Z Acc 102 149 104 150 123 112 148 90 - - 1.36 0.60Scottish Friendly Managed Growth 107 6 117 4 132 32 170 12 148 63 1.46 -Scottish Widows Progressive A 105 62 109 120 130 49 165 21 185 28 2.00 0.45Sentinel Growth B Acc 103 135 107 131 - - - - - - - 1.25Sentinel Universal B Acc 103 132 109 98 132 33 160 33 - - - 1.92SLI Global Advantage Plat 1 Acc 106 14 113 23 134 22 164 26 186 26 - 1.47SLI Multi-Asset Trust Ret Acc 105 59 109 116 126 88 153 70 171 45 1.00 1.66Smith & Williamson MM Endurance Bal B 103 141 109 101 124 107 148 92 164 52 - 1.67Standard Life Wealth Bal Bridge 103 139 109 111 128 70 148 93 160 55 0.83 3.00SVS Brown Shipley Balanced I Acc 104 84 109 110 125 102 - - - - - 1.83SVS Brown Shipley Growth I Acc 105 51 111 53 129 65 160 34 - - 1.97 1.29SVS Church House Balanced Eq Inc A Inc 103 136 108 126 122 120 149 84 167 49 1.57 3.14TB Doherty Active Managed B GBP Acc 103 142 107 137 124 105 148 91 - - - 0.01TB Doherty Balanced Managed B GBP Acc 102 150 105 142 123 111 144 103 - - - 0.22TC Centre Multi Mgr Bal A Inc 104 115 111 48 131 43 148 89 - - 2.50 -Thesis Optima Growth B Acc 104 112 109 112 125 101 156 53 175 40 - 1.33Threadneedle Managed Eq Focused Z Acc 104 113 110 77 131 45 159 43 185 31 - 1.22Threadneedle Navigator Gr Mgd Retl Acc 103 133 110 90 131 37 162 29 201 10 1.48 1.30TM UBS (UK) - Global Growth C Acc 104 97 110 76 129 56 - - - - - 1.06TM UBS (UK) - UK Growth C Acc 104 99 111 55 129 60 155 61 - - - 1.67TM UBS (UK) - UK Income Focus C Acc 103 125 109 97 124 104 - - - - - 3.10Total Clarity Portfolio 5 A 104 77 109 108 130 52 152 72 - - 1.26 1.10UBS Global Allocation (UK) C Acc 104 100 110 91 124 106 153 68 179 33 - 1.62UBS Global Growth Allocation J Acc 106 18 112 37 - - - - - - - 1.16Vanguard Global Balanced A GBP Acc 104 116 107 135 - - - - - - - 1.77Vanguard LifeStrategy 60% Equity A Acc 105 67 109 121 132 34 160 35 - - 0.31 1.44Vanguard LifeStrategy 80% Equity A Acc 106 20 111 50 140 7 177 6 - - 0.29 1.56Vanguard Target Retirement 2020 Acc 104 96 108 128 - - - - - - - 1.27Vanguard Target Retirement 2025 Acc 105 64 109 114 - - - - - - - 1.12Vanguard Target Retirement 2030 Acc 105 54 109 96 - - - - - - - 1.20Vanguard Target Retirement 2035 Acc 105 37 110 81 - - - - - - - 1.09Vanguard Target Retirement 2040 Acc 106 27 110 69 - - - - - - - 1.29Vanguard Target Retirement 2045 Acc 106 23 111 57 - - - - - - - 1.22Vanguard Target Retirement 2050 Acc 106 24 111 56 - - - - - - - 1.24Vanguard Target Retirement 2055 Acc 106 22 111 59 - - - - - - - 1.16Virgin Bond, Gilt, UK and Overseas Share 104 75 109 104 - - - - - - - 1.18Volare Balanced A GBP Acc 104 104 - - - - - - - - - -Volare Growth A GBP Acc 105 32 - - - - - - - - - -Volare Strategic Income A GBP Inc 102 146 - - - - - - - - - -Wesleyan Moderate High Rk/Rwd Inc X Acc 103 134 113 22 - - - - - - - 2.47Zurich Horizon Multi-Asset III Z Acc 105 50 111 65 134 21 - - - - - 1.13Zurich Horizon Multi-Asset IV Z Acc 106 16 113 19 142 6 - - - - - 1.20Average/Total 104 156 110 152 129 131 157 114 179 68 1.34 1.51
(IA) MONEY MARKETAberdeen Sterling Money Market I Acc 100 4 100 3 101 3 101 4 109 4 0.37 0.27Aviva Investors Cash 2 GBP Acc 100 5 100 5 101 5 101 5 105 8 0.28 0.18F&C Short Duration Bond 4 100 1 100 1 102 1 104 1 106 7 0.08 0.68ILF GBP Liquidity 1 100 6 100 6 100 8 101 8 107 6 0.20 0.09IP Money Z Acc 100 2 100 2 101 2 102 2 109 3 - 0.27Janus Henderson Instl Cash Retail Acc 100 8 100 8 101 7 101 7 110 2 0.37 0.11Janus Henderson Money Market UT Acc 100 7 100 7 101 6 101 6 108 5 0.32 0.21NFU Mutual Deposit C 100 9 100 9 100 9 99 9 - - - 0.41Premier UK Money Market B Inc 100 3 100 4 101 4 102 3 110 1 - 0.17Average/Total 100 9 100 9 101 9 101 9 108 8 0.27 0.27
(IA) NORTH AMERICA7IM US Equity Value C Inc 113 2 114 26 - - - - - - - 1.62Aberdeen Global North Amer Eq X Acc GBP 106 81 110 71 142 102 203 96 245 71 0.98 -Aberdeen North American Equity I 107 77 111 51 144 97 209 92 265 58 1.12 0.69Aberdeen Northern Amr EqEnhIdx Net B Acc 108 42 110 76 - - - - - - - 1.30ACS US Equity Tracker T1 GBP Acc 108 41 111 45 158 30 - - - - - 1.54Allianz Best Styles US Equity RT GBP 108 28 112 38 152 64 - - - - - -Allianz US Equity C Acc 106 84 109 81 152 62 225 70 286 42 0.87 0.37Artemis US Equity I Acc GBP 108 27 114 25 159 26 - - - - 1.00 0.40Artemis US Extended Alpha I Acc GBP 107 67 113 36 171 7 - - - - 2.47 -Artemis US Select I Acc GBP 110 9 115 19 163 14 - - - - 0.86 0.29Aviva Investors US Eq Inc 2 GBP Acc 105 111 102 122 155 44 251 18 - - 0.88 2.40Aviva Investors US Eq MoM 1 2 GBP Inc 107 73 111 43 153 56 244 35 296 31 1.03 0.26Aviva Investors US Equity Inc II 2 £ Acc 103 127 100 125 143 101 - - - - - 2.36AXA Framlington American Growth Z Acc 108 31 118 10 152 59 233 57 311 20 0.72 -AXA Rosenberg American Z 108 40 110 62 152 61 245 33 286 44 1.05 0.97Baillie Gifford American B Acc 108 53 124 5 179 2 265 8 353 7 0.67 -BGF US Basic Value D2 105 103 99 128 135 111 214 87 259 62 1.05 -BlackRock US Dynamic D Acc 111 6 115 21 160 21 252 16 282 46 0.94 0.56BlackRock US Opportunities D Acc 103 124 105 114 141 105 232 60 287 39 - 0.26BNY Mellon US Equity Income GBP W Inc 106 90 - - - - - - - - - -Boston Company US Opps Inst W Acc 108 35 111 42 149 81 230 62 271 53 - 0.31Brown Advisory US Flexible Eq B $ Acc 108 39 113 33 149 75 - - - - 0.93 -
FUND 6 MONTHS 1 YEAR 3 YEARS 5 YEARS 10 YEARS TER YIELD£ £ £ £ £ % %
Brown Advisory US Mid-Cap Gr USD C Acc 104 122 - - - - - - - - - -Brown Advisory US Sust Gr USD C Acc 108 45 - - - - - - - - - -Candriam Quant Equities USA C Cap USD 106 91 108 86 147 85 219 79 252 66 1.92 -Candriam Sust North America C USD Cap 101 130 101 124 134 112 196 98 233 72 2.16 -Capital Group AMCAP (LUX) Z 107 63 111 47 153 54 244 37 339 10 - -Capital Group Inv Co of Amer(LUX) Z 106 93 108 96 153 58 234 56 295 32 0.80 -Dodge & Cox Worldwide US Stock A GBP 107 64 107 98 157 32 255 13 293 35 0.70 -Eaton Vance Intl(IRL) US Value I2 $ 105 94 104 119 - - - - - - 1.25 -F&C North American 2 110 11 113 31 152 60 259 11 317 16 0.81 0.86Fidelity American Special Sits W Acc 102 128 100 126 146 92 246 29 284 45 - 0.68Fidelity American W Acc 104 119 108 95 141 104 214 88 252 65 - 0.12Fidelity Index US P Acc 108 52 111 60 157 33 248 23 - - - 1.46Fidelity Instl America 104 114 105 113 147 86 237 52 298 29 0.88 0.60Franklin Mutual Shares W Acc 100 132 99 127 139 108 211 90 211 73 1.03 1.40Franklin US Opportunities W Acc 107 68 116 15 155 45 246 31 - - 0.83 -GAM Multistock Health Innovt Eq USD B 100 133 114 22 129 118 294 2 - - 1.80 -GAM North American Growth Instl GBP Acc 109 23 106 111 154 50 208 93 354 6 0.98 0.31GAM Star Capital Apprec US Eq Instl £Acc 104 121 108 88 133 113 203 95 246 70 2.16 -GAM Star GAMCO US Equity Instl GBP Acc 109 22 110 79 153 57 - - - - 1.19 -GAM Star US All Cap Equity Instl GBP Acc 107 69 116 13 148 84 222 74 - - 1.14 -GlobalAccess US Value M Acc USD 106 83 107 101 143 100 215 86 - - - 0.71GS US CORE® Equity R Inc Snap GBP 108 26 114 28 155 41 256 12 301 26 0.75 0.55GS US Equity R Inc GBP 103 126 108 93 136 110 215 85 262 61 1.09 0.36GS US Focused Growth Equity R Inc GBP 105 96 116 16 143 99 217 82 276 50 1.15 -Halifax North American C 107 75 108 89 149 76 238 51 288 37 1.51 0.99Hermes US All Cap Equity F GBP Acc 105 109 107 103 - - - - - - 1.44 -HSBC American Index C Acc 108 51 111 61 156 35 248 22 312 19 0.18 1.47HSBC MERIT US Equity Institutional A Acc 108 37 110 69 154 52 244 34 314 18 0.54 1.17Investec American I Acc Net GBP 105 97 110 73 162 17 244 36 248 68 0.85 0.66IP US Enhanced Idx Z Acc 109 16 111 50 - - - - - - - 1.44IP US Equity Z Acc 106 86 104 115 146 91 225 69 254 64 - 0.44iShares North American Eq Idx (UK) D Acc 108 46 111 57 155 46 240 47 - - 0.17 1.57iShares US Equity Index (UK) D Acc 108 48 111 52 157 34 248 21 - - - 1.51Janus Henderson Instl NA Idx Opps A Acc 107 60 110 72 151 66 229 64 277 49 1.76 1.06Janus Henderson INTECH US Cor A USD Acc 105 99 110 68 151 69 232 59 287 40 1.72 -Janus Henderson US Forty A USD Acc 107 61 117 12 152 63 236 53 271 52 2.21 -Janus Henderson US Growth I Acc 105 106 107 105 133 114 210 91 264 60 1.09 0.34Janus Henderson US Research A USD Acc 105 108 110 65 141 106 212 89 250 67 2.28 -Janus Henderson US Strat Val I USD Inc 103 125 103 120 145 95 206 94 - - 1.32 -JOHCM US Small Mid Cap Equity A GBP Inc 107 65 108 92 158 29 - - - - 1.25 -JPM America Equity A (dist) USD 108 47 113 35 156 36 245 32 297 30 1.71 0.49JPM America Equity C Net Acc 108 34 113 32 161 19 - - - - - -JPM US C Net Acc 111 3 112 41 150 71 243 42 303 24 0.93 0.55JPM US Equity Income C Net Acc 108 50 107 102 150 72 235 54 - - 0.93 1.94JPM US Select C Net Acc 108 44 110 75 153 55 251 19 333 13 0.93 0.48JPM US Select Equity Plus A (dist) GBP 107 59 111 49 148 83 243 40 - - 1.80 0.80Jupiter North American Income I Acc 106 79 108 97 151 68 225 71 316 17 1.04 1.78L&G US Index Trust I Acc 107 58 111 54 156 38 247 25 318 14 0.25 1.52Legg Mason CB Growth A USD Dis(A) 105 100 114 24 143 98 216 83 177 75 2.04 -Legg Mason CB US Agrsv Gr X USD Dis(A) 102 129 104 118 131 116 216 84 301 27 1.12 -Legg Mason CB US Apprec X USD Dis(A) 106 88 108 84 149 74 219 78 286 43 1.10 0.30Legg Mason CB US Lg Cp Gr X USD Acc 108 38 114 27 167 10 263 9 361 5 1.11 -Legg Mason IF CB US Eq Inc X Inc 107 66 109 83 147 87 218 81 - - 1.05 1.68Legg Mason IF CB US Eq X Acc 104 120 104 116 137 109 223 73 177 74 - 0.37Legg Mason IF MC Nth Am X Acc £ 107 70 110 77 145 94 225 72 247 69 - 0.63LF Canlife North American C Acc 105 112 102 121 150 70 226 68 303 25 0.81 0.40LF Miton US Opportunities B Acc 108 43 111 53 165 12 - - - - - 0.08Loomis Sayles US Equity Leaders N/A GBP 108 33 120 9 178 3 - - - - - -Loomis Sayles US Research R/A USD 107 71 110 78 150 73 219 77 271 54 1.70 -M&G North American Dividend GBP I Acc 109 21 113 29 159 24 240 48 287 38 0.91 1.07M&G North American Value GBP I Acc 108 29 108 91 156 39 259 10 281 47 0.91 0.90Majedie Asset Mgmt US Equity Z GBP Acc 104 115 106 108 141 103 - - - - - -Marlborough US Multi-Cap Income P Inc 111 5 109 82 149 79 227 66 266 57 - 1.19MFS® Meridian US Concentrated Gr WH1 GBP 110 10 126 3 130 117 194 99 - - 1.19 -MFS® Meridian US Value WH1 GBP 106 80 115 18 128 119 197 97 - - 1.00 -MS INVF US Advantage I 109 15 121 7 174 5 269 6 446 1 0.93 -MS INVF US Growth Z 109 17 132 1 181 1 298 1 - - 0.89 -Neptune US Income C Acc GBP 106 82 108 87 155 42 229 63 - - - 2.11Neptune US Opportunities C Acc GBP 109 20 117 11 144 96 220 76 257 63 - 0.45New Capital US Growth GBP Ord Acc 113 1 126 2 132 115 220 75 - - 1.17 -Old Mutual JPM US Gr Advtg A GBP Acc 110 7 116 17 160 22 - - - - - -Old Mutual North American Eq R GBP Acc 109 24 112 37 165 11 287 4 342 9 0.90 0.19Old Mutual Schroder US Mid Cap U2 GBPAcc 104 117 106 110 161 18 - - - - - 0.23Old Mutual US Equity Income R GBP Acc 101 131 101 123 139 107 - - - - 1.25 -OYSTER US Selection R GBP D 108 30 112 39 168 9 - - - - 1.34 0.89PIMCO GIS StocksPlus E Acc 107 76 111 59 155 48 238 49 310 21 1.45 -Pioneer SICAV US Fundamntl Gr N GBP ND 104 118 112 40 154 49 242 43 - - 0.93 -Polar Capital NA I USD Inc 107 55 114 23 162 16 247 24 - - 0.97 -Principal US Equity I Acc USD 109 19 111 48 147 89 230 61 264 59 1.10 -Robeco BP US Large Cap Equities F £ 107 57 108 85 147 88 - - - - 0.80 -Robeco QI US Conservative Equities F £ 106 85 107 99 - - - - - - 0.68 -Royal London US Growth 105 107 110 63 149 78 241 45 270 55 1.55 -Royal London US Tracker Z Acc 107 54 111 58 156 40 247 28 318 15 0.23 1.32Russell Inv US Quant I 107 62 110 67 154 51 244 38 306 22 1.83 0.44Sanlam FOUR US Dividend Income A GBP Acc 108 36 106 109 163 15 - - - - 1.10 -Santander United States Equities A 108 49 110 70 154 53 248 20 305 23 1.03 0.61Schroder QEP US Core I Acc 108 25 109 80 155 43 244 39 333 11 0.32 1.45Schroder US Eq Inc Maximiser Z Acc 106 89 - - - - - - - - - -Schroder US Mid Cap Z Acc 104 116 106 107 160 20 254 14 351 8 - 0.05Scottish Widows American Growth A 107 56 108 90 149 77 226 67 292 36 1.62 0.22SLI American Eqty Unconstrained Plat 1 A 104 123 108 94 149 80 243 41 286 41 - 0.14SLI American Equity Income Pltfrm 1 Acc 105 105 107 104 - - - - - - - 0.96SLI North American Trust 105 95 110 66 151 65 241 46 295 33 0.84 0.35Smith & Williamson North American Eq B 110 12 113 34 146 93 218 80 267 56 0.86 0.54SSgA North America Equity Tracker 107 72 111 55 155 47 235 55 294 34 0.90 0.70T. Rowe Price US Blue Chip Eq Q GBP 109 13 123 6 172 6 281 5 373 4 0.82 -T. Rowe Price US Equity C GBP 105 102 110 74 - - - - - - - -T. Rowe Price US Equity Q GBP 104 113 111 56 158 28 247 26 - - 0.82 -
FUND 6 MONTHS 1 YEAR 3 YEARS 5 YEARS 10 YEARS TER YIELD FUND 6 MONTHS 1 YEAR 3 YEARS 5 YEARS 10 YEARS TER YIELD £ £ £ £ £ % % £ £ £ £ £ % %
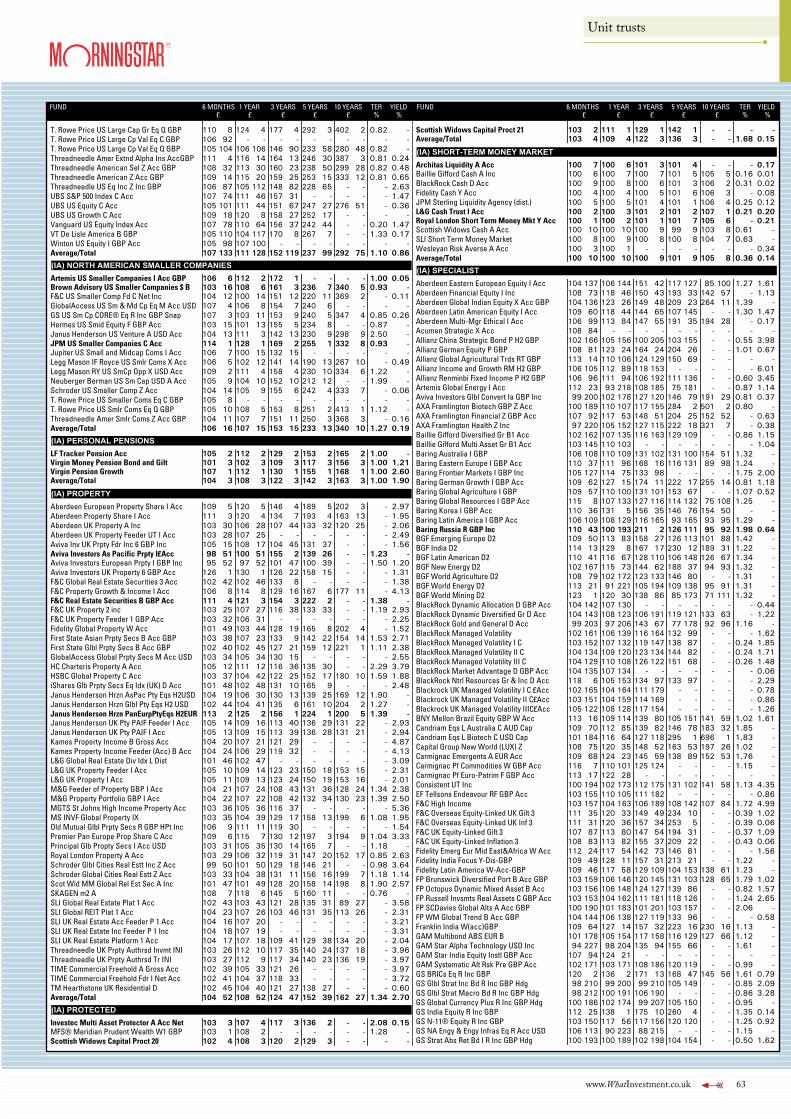
www.WhatInvestment.co.uk 63
Unit trusts
FUND 6 MONTHS 1 YEAR 3 YEARS 5 YEARS 10 YEARS TER YIELD£ £ £ £ £ % %
T. Rowe Price US Large Cap Gr Eq Q GBP 110 8 124 4 177 4 292 3 402 2 0.82 -T. Rowe Price US Large Cp Val Eq C GBP 106 92 - - - - - - - - - -T. Rowe Price US Large Cp Val Eq Q GBP 105 104 106 106 146 90 233 58 280 48 0.82 -Threadneedle Amer Extnd Alpha Ins AccGBP 111 4 116 14 164 13 246 30 387 3 0.81 0.24Threadneedle American Sel Z Acc GBP 108 32 113 30 160 23 238 50 299 28 0.82 0.48Threadneedle American Z Acc GBP 109 14 115 20 159 25 253 15 333 12 0.81 0.65Threadneedle US Eq Inc Z Inc GBP 106 87 105 112 148 82 228 65 - - - 2.63UBS S&P 500 Index C Acc 107 74 111 46 157 31 - - - - - 1.47UBS US Equity C Acc 105 101 111 44 151 67 247 27 276 51 - 0.36UBS US Growth C Acc 109 18 120 8 158 27 252 17 - - - -Vanguard US Equity Index Acc 107 78 110 64 156 37 242 44 - - 0.20 1.47VT De Lisle America B GBP 105 110 104 117 170 8 267 7 - - 1.33 0.17Winton US Equity I GBP Acc 105 98 107 100 - - - - - - - -Average/Total 107 133 111 128 152 119 237 99 292 75 1.10 0.86
(IA) NORTH AMERICAN SMALLER COMPANIESArtemis US Smaller Companies I Acc GBP 106 6 112 2 172 1 - - - - 1.00 0.05Brown Advisory US Smaller Companies $ B 103 16 108 6 161 3 236 7 340 5 0.93 -F&C US Smaller Comp Fd C Net Inc 104 12 100 14 151 12 220 11 369 2 - 0.11GlobalAccess US Sm & Md Cp Eq M Acc USD 107 4 106 8 154 7 240 6 - - - -GS US Sm Cp CORE® Eq R Inc GBP Snap 107 3 103 11 153 9 240 5 347 4 0.85 0.26Hermes US Smid Equity F GBP Acc 103 15 101 13 155 5 234 8 - - 0.87 -Janus Henderson US Venture A USD Acc 104 13 111 3 142 13 230 9 298 9 2.50 -JPM US Smaller Companies C Acc 114 1 128 1 169 2 255 1 332 8 0.93 -Jupiter US Small and Midcap Coms I Acc 106 7 100 15 132 15 - - - - - -Legg Mason IF Royce US Smlr Coms X Acc 106 5 102 12 141 14 190 13 267 10 - 0.49Legg Mason RY US SmCp Opp X USD Acc 109 2 111 4 158 4 230 10 334 6 1.22 -Neuberger Berman US Sm Cap USD A Acc 105 9 104 10 152 10 212 12 - - 1.99 -Schroder US Smaller Comp Z Acc 104 14 105 9 155 6 242 4 333 7 - 0.06T. Rowe Price US Smaller Coms Eq C GBP 105 8 - - - - - - - - - -T. Rowe Price US Smlr Coms Eq Q GBP 105 10 108 5 153 8 251 2 413 1 1.12 -Threadneedle Amer Smlr Coms Z Acc GBP 104 11 107 7 151 11 250 3 368 3 - 0.16Average/Total 106 16 107 15 153 15 233 13 340 10 1.27 0.19
(IA) PERSONAL PENSIONSLF Tracker Pension Acc 105 2 112 2 129 2 153 2 165 2 1.00 -Virgin Money Pension Bond and Gilt 101 3 102 3 109 3 117 3 156 3 1.00 1.21Virgin Pension Growth 107 1 112 1 130 1 155 1 168 1 1.00 2.60Average/Total 104 3 108 3 122 3 142 3 163 3 1.00 1.90
(IA) PROPERTYAberdeen European Property Share I Acc 109 5 120 5 146 4 189 5 202 3 - 2.97Aberdeen Property Share I Acc 111 3 120 4 134 7 193 4 163 13 - 1.95Aberdeen UK Property A Inc 103 30 106 28 107 44 133 32 120 25 - 2.06Aberdeen UK Property Feeder UT I Acc 103 28 107 25 - - - - - - - 2.49Aviva Inv UK Prpty Fdr Inc 6 GBP Inc 105 15 108 17 104 45 131 37 - - - 1.56Aviva Investors As Pacific Prpty I£Acc 98 51 100 51 155 2 139 26 - - 1.23 -Aviva Investors European Prpty I GBP Inc 95 52 97 52 101 47 100 39 - - 1.50 1.20Aviva Investors UK Property 6 GBP Acc 126 1 130 1 126 22 158 15 - - - 1.31F&C Global Real Estate Securities 3 Acc 102 42 102 46 133 8 - - - - - 1.38F&C Property Growth & Income I Acc 106 8 114 8 129 16 167 6 177 11 - 4.13F&C Real Estate Securities B GBP Acc 111 4 121 3 154 3 222 2 - - 1.38 -F&C UK Property 2 inc 103 25 107 27 116 38 133 33 - - 1.19 2.93F&C UK Property Feeder 1 GBP Acc 103 32 106 31 - - - - - - - 2.25Fidelity Global Property W Acc 101 49 103 44 128 19 165 8 202 4 - 1.52First State Asian Prpty Secs B Acc GBP 103 38 107 23 133 9 142 22 154 14 1.53 2.71First State Glbl Prpty Secs B Acc GBP 102 40 102 45 127 21 159 12 221 1 1.11 2.38GlobalAccess Global Prpty Secs M Acc USD 103 34 105 34 130 15 - - - - - 2.55HC Charteris Property A Acc 105 12 111 12 116 36 135 30 - - 2.29 3.79HSBC Global Property C Acc 103 37 104 42 122 25 152 17 180 10 1.59 1.88iShares Glb Prpty Secs Eq Idx (UK) D Acc 101 48 102 48 131 10 165 9 - - - 2.48Janus Henderson Hrzn AsPac Pty Eqs H2USD 104 19 106 30 130 13 139 25 169 12 1.90 -Janus Henderson Hrzn Glbl Pty Eqs H2 USD 102 44 104 41 135 6 161 10 204 2 1.27 -Janus Henderson Hrzn PanEurpPtyEqs H2EUR 113 2 125 2 156 1 224 1 200 5 1.39 -Janus Henderson UK Pty PAIF Feeder I Acc 105 14 109 16 113 40 136 29 131 22 - 2.93Janus Henderson UK Pty PAIF I Acc 105 13 109 15 113 39 136 28 131 21 - 2.94Kames Property Income B Gross Acc 104 20 107 21 121 29 - - - - - 4.87Kames Property Income Feeder (Acc) B Acc 104 24 106 29 119 32 - - - - - 4.13L&G Global Real Estate Div Idx L Dist 101 46 102 47 - - - - - - - 3.09L&G UK Property Feeder I Acc 105 10 109 14 123 23 150 18 153 15 - 2.31L&G UK Property I Acc 105 11 109 13 123 24 150 19 153 16 - 2.01M&G Feeder of Property GBP I Acc 104 21 107 24 108 43 131 36 128 24 1.34 2.38M&G Property Portfolio GBP I Acc 104 22 107 22 108 42 132 34 130 23 1.39 2.50MGTS St Johns High Income Property Acc 103 36 105 36 116 37 - - - - - 5.36MS INVF Global Property IX 103 35 104 39 129 17 158 13 199 6 1.08 1.95Old Mutual Glbl Prpty Secs R GBP HPt Inc 106 9 111 11 119 30 - - - - - 1.54Premier Pan Europe Prop Share C Acc 109 6 115 7 130 12 197 3 194 9 1.04 3.33Principal Glb Propty Secs I Acc USD 103 31 105 35 130 14 165 7 - - 1.18 -Royal London Property A Acc 103 29 106 32 119 31 147 20 152 17 0.85 2.63Schroder Glbl Cities Real Estt Inc Z Acc 99 50 101 50 129 18 146 21 - - 0.98 3.64Schroder Global Cities Real Estt Z Acc 103 33 104 38 131 11 156 16 199 7 1.18 1.14Scot Wid MM Global Rel Est Sec A Inc 101 47 101 49 128 20 158 14 198 8 1.90 2.57SKAGEN m2 A 108 7 118 6 145 5 160 11 - - 0.76 -SLI Global Real Estate Plat 1 Acc 102 43 103 43 121 28 135 31 89 27 - 3.58SLI Global REIT Plat 1 Acc 104 23 107 26 103 46 131 35 113 26 - 2.31SLI UK Real Estate Acc Feeder P 1 Acc 104 16 107 20 - - - - - - - 3.21SLI UK Real Estate Inc Feeder P 1 Inc 104 18 107 19 - - - - - - - 3.31SLI UK Real Estate Platform 1 Acc 104 17 107 18 109 41 129 38 134 20 - 2.04Threadneedle UK Prpty Authrsd Invmt INI 103 26 112 10 117 35 140 24 137 18 - 3.96Threadneedle UK Prpty Authrsd Tr INI 103 27 112 9 117 34 140 23 136 19 - 3.97TIME Commercial Freehold A Gross Acc 102 39 105 33 121 26 - - - - - 3.97TIME Commercial Freehold Fdr I Net Acc 102 41 104 37 118 33 - - - - - 3.72TM Hearthstone UK Residential D 102 45 104 40 121 27 138 27 - - - 0.60Average/Total 104 52 108 52 124 47 152 39 162 27 1.34 2.70
(IA) PROTECTEDInvestec Multi Asset Protector A Acc Net 103 3 107 4 117 3 136 2 - - 2.08 0.15MFS® Meridian Prudent Wealth W1 GBP 103 1 108 2 - - - - - - 1.28 -Scottish Widows Capital Proct 20 102 4 108 3 120 2 129 3 - - - -
FUND 6 MONTHS 1 YEAR 3 YEARS 5 YEARS 10 YEARS TER YIELD£ £ £ £ £ % %
Scottish Widows Capital Proct 21 103 2 111 1 129 1 142 1 - - - -Average/Total 103 4 109 4 122 3 136 3 - - 1.68 0.15
(IA) SHORT-TERM MONEY MARKETArchitas Liquidity A Acc 100 7 100 6 101 3 101 4 - - - 0.17Baillie Gifford Cash A Inc 100 6 100 7 100 7 101 5 105 5 0.16 0.01BlackRock Cash D Acc 100 9 100 8 100 6 101 3 106 2 0.31 0.02Fidelity Cash Y Acc 100 4 100 4 100 5 101 6 106 3 - 0.08JPM Sterling Liquidity Agency (dist.) 100 5 100 5 101 4 101 1 106 4 0.25 0.12L&G Cash Trust I Acc 100 2 100 3 101 2 101 2 107 1 0.21 0.20Royal London Short Term Money Mkt Y Acc 100 1 100 2 101 1 101 7 105 6 - 0.21Scottish Widows Cash A Acc 100 10 100 10 100 9 99 9 103 8 0.61 -SLI Short Term Money Market 100 8 100 9 100 8 100 8 104 7 0.63 -Wesleyan Risk Averse A Acc 100 3 100 1 - - - - - - - 0.34Average/Total 100 10 100 10 100 9 101 9 105 8 0.36 0.14
(IA) SPECIALISTAberdeen Eastern European Equity I Acc 104 137 106 144 151 42 117 127 85 100 1.27 1.61Aberdeen Financial Equity I Inc 108 73 118 46 150 43 193 33 142 57 - 1.13Aberdeen Global Indian Equity X Acc GBP 104 136 123 26 149 48 209 23 264 11 1.39 -Aberdeen Latin American Equity I Acc 109 60 118 44 144 65 107 145 - - 1.30 1.47Aberdeen Multi-Mgr Ethical I Acc 106 99 113 84 147 55 191 35 194 28 - 0.17Acumen Strategic X Acc 108 84 - - - - - - - - - -Allianz China Strategic Bond P H2 GBP 102 166 105 156 100 205 103 155 - - 0.55 3.98Allianz German Equity P GBP 108 81 123 24 164 24 204 26 - - 1.01 0.67Allianz Global Agricultural Trds RT GBP 113 14 110 106 124 129 150 69 - - - -Allianz Income and Growth RM H2 GBP 106 105 112 89 118 153 - - - - - 6.01Allianz Renminbi Fixed Income P H2 GBP 106 96 111 94 106 192 111 136 - - 0.60 3.45Artemis Global Energy I Acc 112 23 93 218 108 185 75 181 - - 0.87 1.14Aviva Investors Glbl Convert Ia GBP Inc 99 200 102 178 127 120 146 79 191 29 0.81 0.37AXA Framlington Biotech GBP Z Acc 100 189 110 107 117 155 284 2 501 2 0.80 -AXA Framlington Financial Z GBP Acc 107 92 117 53 148 51 204 25 152 52 - 0.63AXA Framlington Health Z Inc 97 220 105 152 127 115 222 18 321 7 - 0.38Baillie Gifford Diversified Gr B1 Acc 102 162 107 135 116 163 129 109 - - 0.86 1.15Baillie Gifford Multi Asset Gr B1 Acc 103 145 110 103 - - - - - - - 1.04Baring Australia I GBP 106 108 110 109 131 102 131 100 154 51 1.32 -Baring Eastern Europe I GBP Acc 110 37 111 96 168 16 116 131 89 98 1.24 -Baring Frontier Markets I GBP Inc 105 127 114 75 133 98 - - - - 1.75 2.00Baring German Growth I GBP Acc 109 62 127 15 174 11 222 17 255 14 0.81 1.18Baring Global Agriculture I GBP 109 57 110 100 131 101 153 67 - - 1.07 0.52Baring Global Resources I GBP Acc 115 8 107 133 127 116 114 132 75 108 1.25 -Baring Korea I GBP Acc 110 36 131 5 156 35 146 76 154 50 - -Baring Latin America I GBP Acc 106 109 108 129 116 165 93 165 93 95 1.29 -Baring Russia R GBP Inc 110 43 100 193 211 2 126 111 95 92 1.98 0.64BGF Emerging Europe D2 109 50 113 83 158 27 126 113 101 88 1.42 -BGF India D2 114 13 129 8 167 17 230 12 189 31 1.22 -BGF Latin American D2 110 41 116 67 128 110 106 148 126 67 1.34 -BGF New Energy D2 102 167 115 73 144 62 188 37 94 93 1.32 -BGF World Agriculture D2 108 79 102 172 123 133 146 80 - - 1.31 -BGF World Energy D2 113 21 91 221 105 194 109 138 95 91 1.31 -BGF World Mining D2 123 1 120 30 138 86 85 173 71 111 1.32 -BlackRock Dynamic Allocation D GBP Acc 104 142 107 130 - - - - - - - 0.44BlackRock Dynamic Diversified Gr D Acc 104 143 108 123 106 191 119 121 133 63 - 1.22BlackRock Gold and General D Acc 99 203 97 206 143 67 77 178 92 96 1.16 -BlackRock Managed Volatility 102 161 106 139 116 164 132 99 - - - 1.62BlackRock Managed Volatility I C 103 152 107 132 119 147 138 87 - - 0.24 1.85BlackRock Managed Volatility II C 104 134 109 120 123 134 144 82 - - 0.24 1.71BlackRock Managed Volatility III C 104 129 110 108 126 122 151 68 - - 0.26 1.48BlackRock Market Advantage D GBP Acc 104 135 107 134 - - - - - - - 0.06BlackRock Ntrl Resources Gr & Inc D Acc 118 6 105 153 134 97 133 97 - - - 2.29Blackrock UK Managed Volatility I C £Acc 102 165 104 164 111 179 - - - - - 0.78Blackrock UK Managed Volatility II C£Acc 103 151 104 159 114 169 - - - - - 0.86Blackrock UK Managed Volatility IIIC£Acc 105 122 108 128 117 154 - - - - - 1.26BNY Mellon Brazil Equity GBP W Acc 113 16 109 114 139 80 105 151 141 59 1.02 1.61Candriam Eqs L Australia C AUD Cap 109 70 112 85 139 82 146 78 183 32 1.85 -Candriam Eqs L Biotech C USD Cap 101 184 116 64 127 118 295 1 696 1 1.83 -Capital Group New World (LUX) Z 108 75 120 35 148 52 163 53 197 26 1.02 -Carmignac Emergents A EUR Acc 109 68 124 23 145 59 138 89 152 53 1.76 -Carmignac Pf Commodities W GBP Acc 116 7 110 101 125 124 - - - - 1.15 -Carmignac Pf Euro-Patrim F GBP Acc 113 17 122 28 - - - - - - - -Consistent UT Inc 100 194 102 173 112 175 131 102 141 58 1.13 4.35EF Tellsons Endeavour RF GBP Acc 103 155 110 105 111 182 - - - - - 0.86F&C High Income 103 157 104 163 106 189 108 142 107 84 1.72 4.99F&C Overseas Equity-Linked UK Gilt 3 111 35 120 33 149 49 234 10 - - 0.39 1.02F&C Overseas Equity-Linked UK Inf 3 111 31 120 36 157 34 253 5 - - 0.39 0.06F&C UK Equity-Linked Gilt 3 107 87 113 80 147 54 194 31 - - 0.37 1.09F&C UK Equity-Linked Inflation 3 108 83 113 82 155 37 209 22 - - 0.43 0.06Fidelity Emerg Eur Mid East&Africa W Acc 112 24 117 54 142 73 146 81 - - - 1.56Fidelity India Focus Y-Dis-GBP 109 49 128 11 157 31 213 21 - - 1.22 -Fidelity Latin America W-Acc-GBP 109 46 117 58 129 109 104 153 138 61 1.23 -FP Brunswick Diversified Port B Acc GBP 103 159 106 146 120 145 131 103 128 65 1.79 1.02FP Octopus Dynamic Mixed Asset B Acc 103 156 106 148 124 127 139 86 - - 0.82 1.57FP Russell Invsmts Real Assets C GBP Acc 103 153 104 162 111 181 118 126 - - 1.24 2.65FP SCDavies Global Alts A Acc GBP 100 190 101 183 101 201 103 157 - - 2.06 -FP WM Global Trend B Acc GBP 104 144 106 138 127 119 133 96 - - - 0.58Franklin India W(acc)GBP 109 64 127 14 157 32 223 16 230 16 1.13 -GAM Multibond ABS EUR B 101 178 105 154 117 158 116 129 127 66 1.12 -GAM Star Alpha Technology USD Inc 94 227 98 204 135 94 155 66 - - 1.61 -GAM Star India Equity Instl GBP Acc 107 94 124 21 - - - - - - - -GAM Systematic Alt Rsk Pre GBP Acc 102 171 103 171 108 186 120 119 - - 0.99 -GS BRICs Eq R Inc GBP 120 2 136 2 171 13 168 47 145 56 1.61 0.79GS Glbl Strat Inc Bd R Inc GBP Hdg 98 210 99 200 99 210 105 149 - - 0.85 2.09GS Glbl Strat Macro Bd R Inc GBP Hdg 98 212 100 191 106 190 - - - - 0.86 3.28GS Global Currency Plus R Inc GBP Hdg 100 186 102 174 99 207 105 150 - - 0.95 -GS India Equity R Inc GBP 112 25 138 1 175 10 260 4 - - 1.35 0.14GS N-11® Equity R Inc GBP 103 150 117 56 117 156 120 120 - - 1.25 0.92GS NA Engy & Engy Infras Eq R Acc USD 106 113 90 223 88 215 - - - - 1.15 -GS Strat Abs Ret Bd I R Inc GBP Hdg 100 193 100 189 102 198 104 154 - - 0.50 1.62
FUND 6 MONTHS 1 YEAR 3 YEARS 5 YEARS 10 YEARS TER YIELD FUND 6 MONTHS 1 YEAR 3 YEARS 5 YEARS 10 YEARS TER YIELD £ £ £ £ £ % % £ £ £ £ £ % %
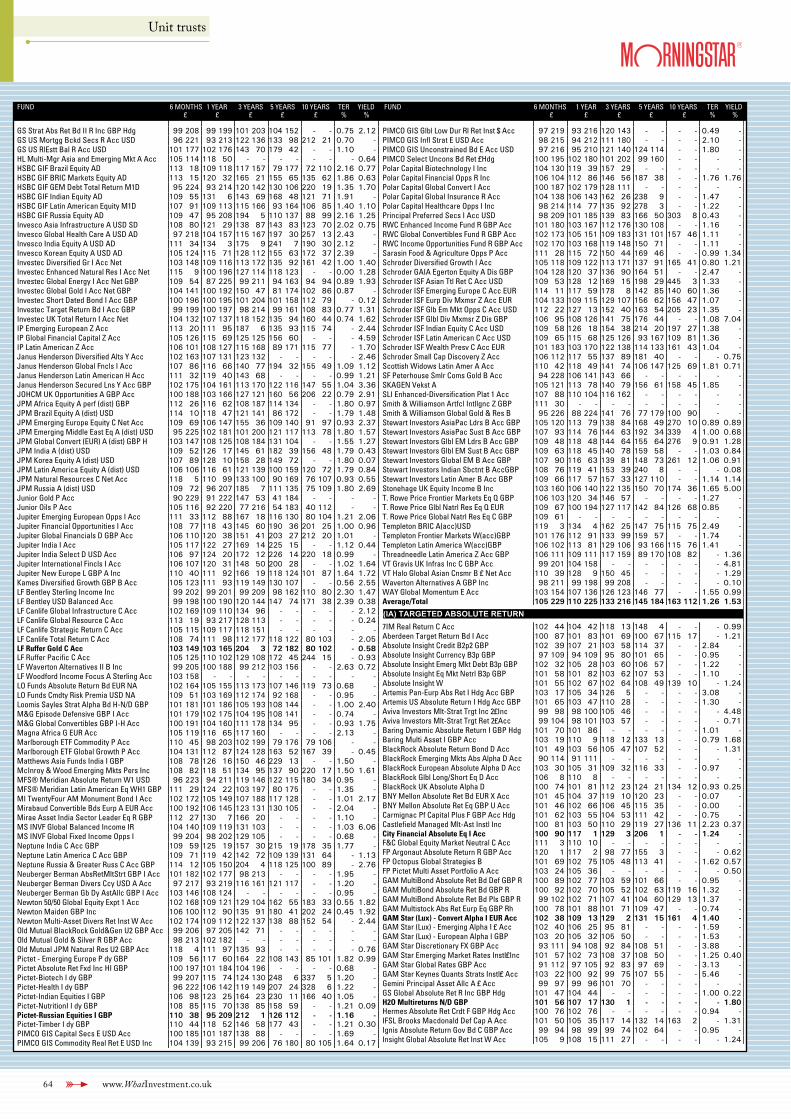
64 www.WhatInvestment.co.uk
Unit trusts
FUND 6 MONTHS 1 YEAR 3 YEARS 5 YEARS 10 YEARS TER YIELD£ £ £ £ £ % %
GS Strat Abs Ret Bd II R Inc GBP Hdg 99 208 99 199 101 203 104 152 - - 0.75 2.12GS US Mortgg Bckd Secs R Acc USD 96 221 93 213 122 136 133 98 212 21 0.70 -GS US RlEstt Bal R Acc USD 101 177 102 176 143 70 179 42 - - 1.10 -HL Multi-Mgr Asia and Emerging Mkt A Acc 105 114 118 50 - - - - - - - 0.64HSBC GIF Brazil Equity AD 113 18 109 118 117 157 79 177 72 110 2.16 0.77HSBC GIF BRIC Markets Equity AD 113 15 120 32 165 21 155 65 135 62 1.86 0.63HSBC GIF GEM Debt Total Return M1D 95 224 93 214 120 142 130 106 220 19 1.35 1.70HSBC GIF Indian Equity AD 109 55 131 6 143 69 168 48 121 71 1.91 -HSBC GIF Latin American Equity M1D 107 91 109 113 115 166 93 164 106 85 1.40 1.10HSBC GIF Russia Equity AD 109 47 95 208 194 5 110 137 88 99 2.16 1.25Invesco Asia Infrastructure A USD SD 108 80 121 29 138 87 143 83 123 70 2.02 0.75Invesco Global Health Care A USD AD 97 218 104 157 115 167 197 30 257 13 2.43 -Invesco India Equity A USD AD 111 34 134 3 175 9 241 7 190 30 2.12 -Invesco Korean Equity A USD AD 105 124 115 71 128 112 155 63 172 37 2.39 -Investec Diversified Gr I Acc Net 103 148 109 116 113 172 135 92 161 42 1.00 1.40Investec Enhanced Natural Res I Acc Net 115 9 100 196 127 114 118 123 - - 0.00 1.28Investec Global Energy I Acc Net GBP 109 54 87 225 99 211 94 163 94 94 0.89 1.93Investec Global Gold I Acc Net GBP 104 141 100 192 150 47 81 174 102 86 0.87 -Investec Short Dated Bond I Acc GBP 100 196 100 195 101 204 101 158 112 79 - 0.12Investec Target Return Bd I Acc GBP 99 199 100 197 98 214 99 161 108 83 0.77 1.31Investec UK Total Return I Acc Net 104 132 107 137 118 152 135 94 160 44 0.74 1.62IP Emerging European Z Acc 113 20 111 95 187 6 135 93 115 74 - 2.44IP Global Financial Capital Z Acc 105 126 115 69 125 125 156 60 - - - 4.59IP Latin American Z Acc 106 101 108 127 115 168 89 171 115 77 - 1.70Janus Henderson Diversified Alts Y Acc 102 163 107 131 123 132 - - - - - 2.46Janus Henderson Global Fncls I Acc 107 86 116 66 140 77 194 32 155 49 1.09 1.12Janus Henderson Latin American H Acc 111 32 119 40 143 68 - - - - 0.99 1.21Janus Henderson Secured Lns Y Acc GBP 102 175 104 161 113 170 122 116 147 55 1.04 3.36JOHCM UK Opportunities A GBP Acc 100 188 103 166 127 121 160 56 206 22 0.79 2.91JPM Africa Equity A perf (dist) GBP 112 26 116 62 108 187 114 134 - - 1.80 0.97JPM Brazil Equity A (dist) USD 114 10 118 47 121 141 86 172 - - 1.79 1.48JPM Emerging Europe Equity C Net Acc 109 69 106 147 155 36 109 140 91 97 0.93 2.37JPM Emerging Middle East Eq A (dist) USD 95 225 102 181 101 200 121 117 113 78 1.80 1.57JPM Global Convert (EUR) A (dist) GBP H 103 147 108 125 108 184 131 104 - - 1.55 1.27JPM India A (dist) USD 109 52 126 17 145 61 182 39 156 48 1.79 0.43JPM Korea Equity A (dist) USD 107 89 128 10 158 28 149 72 - - 1.80 0.07JPM Latin America Equity A (dist) USD 106 106 116 61 121 139 100 159 120 72 1.79 0.84JPM Natural Resources C Net Acc 118 5 110 99 133 100 90 169 76 107 0.93 0.55JPM Russia A (dist) USD 109 72 96 207 185 7 111 135 75 109 1.80 2.69Junior Gold P Acc 90 229 91 222 147 53 41 184 - - - -Junior Oils P Acc 105 116 92 220 77 216 54 183 40 112 - -Jupiter Emerging European Opps I Acc 111 33 112 88 167 18 116 130 80 104 1.21 2.06Jupiter Financial Opportunities I Acc 108 77 118 43 145 60 190 36 201 25 1.00 0.96Jupiter Global Financials D GBP Acc 106 110 120 38 151 41 203 27 212 20 1.01 -Jupiter India I Acc 105 117 122 27 169 14 225 15 - - 1.12 0.44Jupiter India Select D USD Acc 106 97 124 20 172 12 226 14 220 18 0.99 -Jupiter International Fincls I Acc 106 107 120 31 148 50 200 28 - - 1.02 1.64Jupiter New Europe L GBP A Inc 110 40 111 92 166 19 118 124 101 87 1.64 1.72Kames Diversified Growth GBP B Acc 105 123 111 93 119 149 130 107 - - 0.56 2.55LF Bentley Sterling Income Inc 99 202 99 201 99 209 98 162 110 80 2.30 1.47LF Bentley USD Balanced Acc 99 198 100 190 120 144 147 74 171 38 2.39 0.38LF Canlife Global Infrastructure C Acc 102 169 109 110 134 96 - - - - - 2.12LF Canlife Global Resource C Acc 113 19 93 217 128 113 - - - - - 0.24LF Canlife Strategic Return C Acc 105 115 109 117 118 151 - - - - - -LF Canlife Total Return C Acc 108 74 111 98 112 177 118 122 80 103 - 2.05LF Ruffer Gold C Acc 103 149 103 165 204 3 72 182 80 102 - 0.58LF Ruffer Pacific C Acc 105 125 110 102 129 108 172 45 244 15 - 0.93LF Waverton Alternatives II B Inc 99 205 100 188 99 212 103 156 - - 2.63 0.72LF Woodford Income Focus A Sterling Acc 103 158 - - - - - - - - - -LO Funds Absolute Return Bd EUR NA 102 164 105 155 113 173 107 146 119 73 0.68 -LO Funds Cmdty Risk Premia USD NA 109 51 103 169 112 174 92 168 - - 0.95 -Loomis Sayles Strat Alpha Bd H-N/D GBP 101 181 101 186 105 193 108 144 - - 1.00 2.40M&G Episode Defensive GBP I Acc 101 179 102 175 104 195 108 141 - - 0.74 -M&G Global Convertibles GBP I-H Acc 100 191 104 160 111 178 134 95 - - 0.93 1.75Magna Africa G EUR Acc 105 119 116 65 117 160 - - - - 2.13 -Marlborough ETF Commodity P Acc 110 45 98 203 102 199 79 176 79 106 - -Marlborough ETF Global Growth P Acc 104 131 112 87 124 128 163 52 167 39 - 0.45Matthews Asia Funds India I GBP 108 78 126 16 150 46 229 13 - - 1.50 -McInroy & Wood Emerging Mkts Pers Inc 108 82 118 51 134 95 137 90 220 17 1.50 1.61MFS® Meridian Absolute Return W1 USD 96 223 94 211 119 146 122 115 180 34 0.95 -MFS® Meridian Latin American Eq WH1 GBP 111 29 124 22 103 197 80 175 - - 1.35 -MI TwentyFour AM Monument Bond I Acc 102 172 105 149 107 188 117 128 - - 1.01 2.17Mirabaud Convertible Bds Eurp A EUR Acc 100 192 106 145 123 131 130 105 - - 2.04 -Mirae Asset India Sector Leader Eq R GBP 112 27 130 7 166 20 - - - - 1.10 -MS INVF Global Balanced Income IR 104 140 109 119 131 103 - - - - 1.03 6.06MS INVF Global Fixed Income Opps I 99 204 98 202 129 105 - - - - 0.68 -Neptune India C Acc GBP 109 59 125 19 157 30 215 19 178 35 1.77 -Neptune Latin America C Acc GBP 109 71 119 42 142 72 109 139 131 64 - 1.13Neptune Russia & Greater Russ C Acc GBP 114 12 105 150 204 4 118 125 100 89 - 2.76Neuberger Berman AbsRetMltStrt GBP I Acc 101 182 102 177 98 213 - - - - 1.95 -Neuberger Berman Divers Ccy USD A Acc 97 217 93 219 116 161 121 117 - - 1.20 -Neuberger Berman Gb Dy AstAllc GBP I Acc 103 146 108 124 - - - - - - 0.95 -Newton 50/50 Global Equity Expt 1 Acc 102 168 109 121 129 104 162 55 183 33 0.55 1.82Newton Maiden GBP Inc 106 100 112 90 135 91 180 41 202 24 0.45 1.92Newton Multi-Asset Divers Ret Inst W Acc 102 174 109 112 122 137 138 88 152 54 - 2.44Old Mutual BlackRock Gold&Gen U2 GBP Acc 99 206 97 205 142 71 - - - - - -Old Mutual Gold & Silver R GBP Acc 98 213 102 182 - - - - - - - -Old Mutual JPM Natural Res U2 GBP Acc 118 4 111 97 135 93 - - - - - 0.76Pictet - Emerging Europe P dy GBP 109 56 117 60 164 22 108 143 85 101 1.82 0.99Pictet Absolute Ret Fxd Inc HI GBP 100 197 101 184 104 196 - - - - 0.68 -Pictet-Biotech I dy GBP 99 207 115 74 124 130 248 6 337 5 1.20 -Pictet-Health I dy GBP 96 222 106 142 119 149 207 24 328 6 1.22 -Pictet-Indian Equities I GBP 106 98 123 25 164 23 230 11 166 40 1.05 -Pictet-NutritionI I dy GBP 108 85 115 70 138 85 158 59 - - 1.21 0.09Pictet-Russian Equities I GBP 110 38 95 209 212 1 126 112 - - 1.16 -Pictet-Timber I dy GBP 110 44 118 52 146 58 177 43 - - 1.21 0.30PIMCO GIS Capital Secs E USD Acc 100 185 101 187 138 88 - - - - 1.69 -PIMCO GIS Commodity Real Ret E USD Inc 104 139 93 215 99 206 76 180 80 105 1.64 0.17
FUND 6 MONTHS 1 YEAR 3 YEARS 5 YEARS 10 YEARS TER YIELD£ £ £ £ £ % %
PIMCO GIS Glbl Low Dur Rl Ret Inst $ Acc 97 219 93 216 120 143 - - - - 0.49 -PIMCO GIS Infl Strat E USD Acc 98 215 94 212 111 180 - - - - 2.10 -PIMCO GIS Unconstrained Bd E Acc USD 97 216 95 210 121 140 124 114 - - 1.80 -PIMCO Select Uncons Bd Ret £Hdg 100 195 102 180 101 202 99 160 - - - -Polar Capital Biotechnology I Inc 104 130 119 39 157 29 - - - - - -Polar Capital Financial Opps R Inc 106 104 112 86 146 56 187 38 - - 1.76 1.76Polar Capital Global Convert I Acc 100 187 102 179 128 111 - - - - - -Polar Capital Global Insurance R Acc 104 138 106 143 162 26 238 9 - - 1.47 -Polar Capital Healthcare Opps I Inc 98 214 114 77 135 92 278 3 - - 1.22 -Principal Preferred Secs I Acc USD 98 209 101 185 139 83 166 50 303 8 0.43 -RWC Enhanced Income Fund R GBP Acc 101 180 103 167 112 176 130 108 - - 1.16 -RWC Global Convertibles Fund R GBP Acc 102 173 105 151 109 183 131 101 157 46 1.11 -RWC Income Opportunities Fund R GBP Acc 102 170 103 168 119 148 150 71 - - 1.11 -Sarasin Food & Agriculture Opps P Acc 111 28 115 72 150 44 169 46 - - 0.99 1.34Schroder Diversified Growth I Acc 105 118 109 122 113 171 137 91 165 41 0.80 1.21Schroder GAIA Egerton Equity A Dis GBP 104 128 120 37 136 90 164 51 - - 2.47 -Schroder ISF Asian Ttl Ret C Acc USD 109 53 128 12 169 15 198 29 445 3 1.33 -Schroder ISF Emerging Europe C Acc EUR 114 11 117 59 178 8 142 85 140 60 1.36 -Schroder ISF Eurp Div Mxmsr Z Acc EUR 104 133 109 115 129 107 156 62 156 47 1.07 -Schroder ISF Glb Em Mkt Opps C Acc USD 112 22 127 13 152 40 163 54 205 23 1.35 -Schroder ISF Glbl Div Mxmsr Z Dis GBP 106 95 108 126 141 75 176 44 - - 1.08 7.04Schroder ISF Indian Equity C Acc USD 109 58 126 18 154 38 214 20 197 27 1.38 -Schroder ISF Latin American C Acc USD 109 65 115 68 125 126 93 167 109 81 1.36 -Schroder ISF Wealth Presv C Acc EUR 101 183 103 170 122 138 114 133 161 43 1.04 -Schroder Small Cap Discovery Z Acc 106 112 117 55 137 89 181 40 - - - 0.75Scottish Widows Latin Amer A Acc 110 42 118 49 141 74 106 147 125 69 1.81 0.71SF Peterhouse Smlr Coms Gold B Acc 94 228 106 141 143 66 - - - - - -SKAGEN Vekst A 105 121 113 78 140 79 156 61 158 45 1.85 -SLI Enhanced-Diversification Plat 1 Acc 107 88 110 104 116 162 - - - - - -Smith & Williamson Artfcl Intllgnc Z GBP 111 30 - - - - - - - - - -Smith & Williamson Global Gold & Res B 95 226 88 224 141 76 77 179 100 90 - -Stewart Investors AsiaPac Ldrs B Acc GBP 105 120 113 79 138 84 168 49 270 10 0.89 0.89Stewart Investors AsiaPac Sust B Acc GBP 107 93 114 76 144 63 192 34 339 4 1.00 0.68Stewart Investors Glbl EM Ldrs B Acc GBP 109 48 118 48 144 64 155 64 276 9 0.91 1.28Stewart Investors Glbl EM Sust B Acc GBP 109 63 118 45 140 78 159 58 - - 1.03 0.84Stewart Investors Global EM B Acc GBP 107 90 116 63 139 81 148 73 261 12 1.06 0.91Stewart Investors Indian Sbctnt B AccGBP 108 76 119 41 153 39 240 8 - - - 0.08Stewart Investors Latin Amer B Acc GBP 109 66 117 57 157 33 127 110 - - 1.14 1.14Stonehage UK Equity Income B Inc 103 160 106 140 122 135 150 70 174 36 1.65 5.00T. Rowe Price Frontier Markets Eq Q GBP 106 103 120 34 146 57 - - - - 1.27 -T. Rowe Price Glbl Natrl Res Eq Q EUR 109 67 100 194 127 117 142 84 126 68 0.85 -T. Rowe Price Global Natrl Res Eq C GBP 109 61 - - - - - - - - - -Templeton BRIC A(acc)USD 119 3 134 4 162 25 147 75 115 75 2.49 -Templeton Frontier Markets W(acc)GBP 101 176 112 91 133 99 159 57 - - 1.74 -Templeton Latin America W(acc)GBP 106 102 113 81 129 106 93 166 115 76 1.41 -Threadneedle Latin America Z Acc GBP 106 111 109 111 117 159 89 170 108 82 - 1.36VT Gravis UK Infras Inc C GBP Acc 99 201 104 158 - - - - - - - 4.81VT Halo Global Asian Cnsmr B £ Net Acc 110 39 128 9 150 45 - - - - - 1.29Waverton Alternatives A GBP Inc 98 211 99 198 99 208 - - - - - 0.10WAY Global Momentum E Acc 103 154 107 136 126 123 146 77 - - 1.55 0.99Average/Total 105 229 110 225 133 216 145 184 163 112 1.26 1.53
(IA) TARGETED ABSOLUTE RETURN7IM Real Return C Acc 102 44 104 42 118 13 148 4 - - - 0.99Aberdeen Target Return Bd I Acc 100 87 101 83 101 69 100 67 115 17 - 1.21Absolute Insight Credit B2p2 GBP 102 39 107 21 103 58 114 37 - - 2.84 -Absolute Insight Currency B3p GBP 97 109 94 109 95 80 101 65 - - 0.95 -Absolute Insight Emerg Mkt Debt B3p GBP 102 32 105 28 103 60 106 57 - - 1.22 -Absolute Insight Eq Mkt Netrl B3p GBP 101 58 101 82 103 62 107 53 - - 1.10 -Absolute Insight W 101 55 102 67 102 64 108 49 139 10 - 1.24Artemis Pan-Eurp Abs Ret I Hdg Acc GBP 103 17 105 34 126 5 - - - - 3.08 -Artemis US Absolute Return I Hdg Acc GBP 101 65 103 47 110 28 - - - - 1.30 -Aviva Investors Mlt-Strat Trgt Inc 2£Inc 99 98 98 100 105 46 - - - - - 4.48Aviva Investors Mlt-Strat Trgt Ret 2£Acc 99 104 98 101 103 57 - - - - - 0.71Baring Dynamic Absolute Return I GBP Hdg 101 70 101 86 - - - - - - 1.01 -Baring Multi Asset I GBP Acc 103 19 110 9 118 12 133 13 - - 0.79 1.68BlackRock Absolute Return Bond D Acc 101 49 103 56 105 47 107 52 - - - 1.31BlackRock Emerging Mkts Abs Alpha D Acc 90 114 91 111 - - - - - - - -BlackRock European Absolute Alpha D Acc 103 30 105 31 109 32 116 33 - - 0.97 -BlackRock Glbl Long/Short Eq D Acc 106 8 110 8 - - - - - - - -BlackRock UK Absolute Alpha D 100 74 101 81 112 23 124 21 134 12 0.93 0.25BNY Mellon Absolute Ret Bd EUR X Acc 101 45 104 37 119 10 120 23 - - 0.07 -BNY Mellon Absolute Ret Eq GBP U Acc 101 46 102 66 106 45 115 35 - - 0.00 -Carmignac Pf Capital Plus F GBP Acc Hdg 101 62 103 55 104 53 111 42 - - 0.75 -Castlefield Managed Mlt-Ast Instl Inc 100 81 103 50 110 29 119 27 136 11 2.23 0.37City Financial Absolute Eq I Acc 100 90 117 1 129 3 206 1 - - 1.24 -F&C Global Equity Market Neutral C Acc 111 3 110 10 - - - - - - - -FP Argonaut Absolute Return R GBP Acc 120 1 117 2 98 77 155 3 - - - 0.62FP Octopus Global Strategies B 101 69 102 75 105 48 113 41 - - 1.62 0.57FP Pictet Multi Asset Portfolio A Acc 103 24 105 36 - - - - - - - 0.50GAM MultiBond Absolute Ret Bd Def GBP R 100 89 102 77 103 59 101 66 - - 0.95 -GAM MultiBond Absolute Ret Bd GBP R 100 92 102 70 105 52 102 63 119 16 1.32 -GAM MultiBond Absolute Ret Bd Pls GBP R 99 102 102 71 107 41 104 60 129 13 1.37 -GAM Multistock Abs Ret Eurp Eq GBP Rh 100 78 101 88 101 71 109 47 - - 0.74 -GAM Star (Lux) - Convert Alpha I EUR Acc 102 38 109 13 129 2 131 15 161 4 1.40 -GAM Star (Lux) - Emerging Alpha I £ Acc 102 40 106 25 95 81 - - - - 1.59 -GAM Star (Lux) - European Alpha I GBP 103 20 105 32 105 50 - - - - 1.53 -GAM Star Discretionary FX GBP Acc 93 111 94 108 92 84 108 51 - - 3.88 -GAM Star Emerging Market Rates Instl£Inc 101 57 102 73 108 37 108 50 - - 1.25 0.40GAM Star Global Rates GBP Acc 91 112 97 105 92 83 97 69 - - 3.13 -GAM Star Keynes Quants Strats Instl£ Acc 103 22 100 92 99 75 107 55 - - 5.46 -Gemini Principal Asset Allc A £ Acc 99 97 99 96 101 70 - - - - - -GS Global Absolute Ret R Inc GBP Hdg 101 47 104 44 - - - - - - 1.00 0.22H2O Multireturns N/D GBP 101 56 107 17 130 1 - - - - - 1.80Hermes Absolute Ret Crdt F GBP Hdg Acc 100 76 102 76 - - - - - - 0.94 -IFSL Brooks Macdonald Def Cap A Acc 101 50 105 35 117 14 132 14 163 2 - 1.31Ignis Absolute Return Gov Bd C GBP Acc 99 94 98 99 99 74 102 64 - - 0.95 -Insight Global Absolute Ret Inst W Acc 105 9 108 15 111 27 - - - - - 1.24
FUND 6 MONTHS 1 YEAR 3 YEARS 5 YEARS 10 YEARS TER YIELD FUND 6 MONTHS 1 YEAR 3 YEARS 5 YEARS 10 YEARS TER YIELD £ £ £ £ £ % % £ £ £ £ £ % %
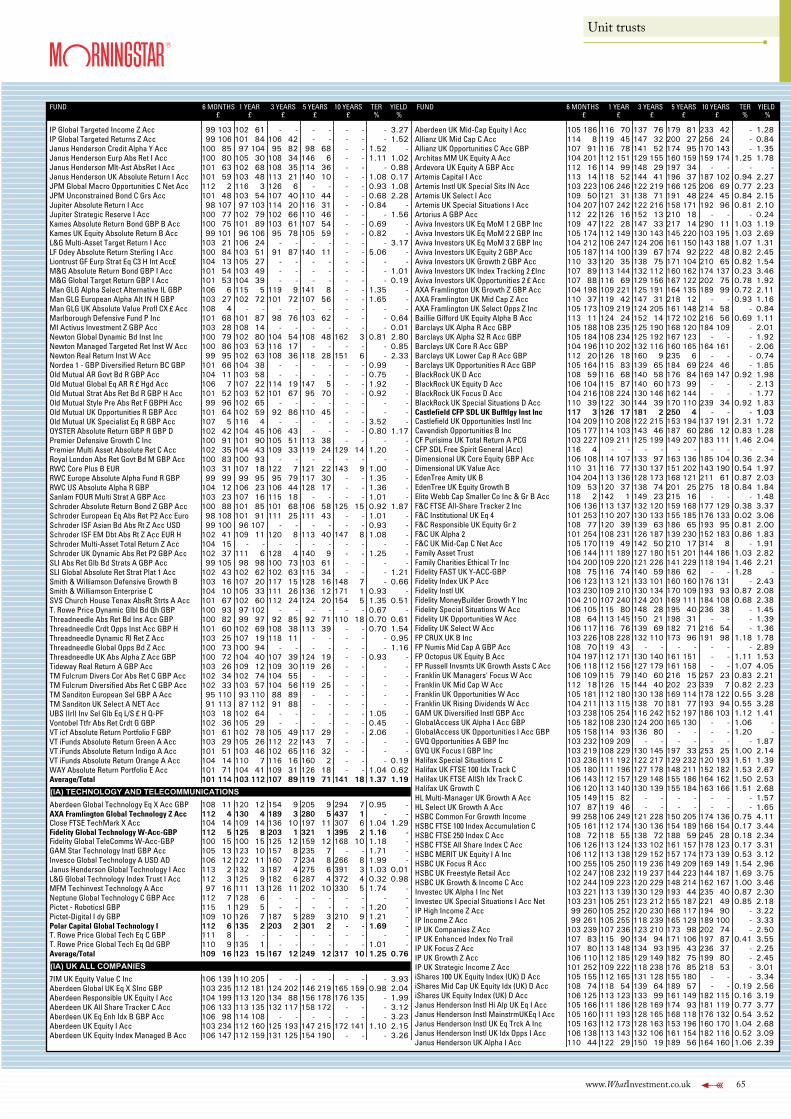
www.WhatInvestment.co.uk 65
Unit trusts
FUND 6 MONTHS 1 YEAR 3 YEARS 5 YEARS 10 YEARS TER YIELD£ £ £ £ £ % %
IP Global Targeted Income Z Acc 99 103 102 61 - - - - - - - 3.27IP Global Targeted Returns Z Acc 99 106 101 84 106 42 - - - - - 1.52Janus Henderson Credit Alpha Y Acc 100 85 97 104 95 82 98 68 - - 1.52 -Janus Henderson Eurp Abs Ret I Acc 100 80 105 30 108 34 146 6 - - 1.11 1.02Janus Henderson Mlt-Ast AbsRet I Acc 101 63 102 68 108 35 114 36 - - - 0.88Janus Henderson UK Absolute Return I Acc 101 59 103 48 113 21 140 10 - - 1.08 0.17JPM Global Macro Opportunities C Net Acc 112 2 116 3 126 6 - - - - 0.93 1.08JPM Unconstrained Bond C Grs Acc 101 48 103 54 107 40 110 44 - - 0.68 2.28Jupiter Absolute Return I Acc 98 107 97 103 114 20 116 31 - - 0.84 -Jupiter Strategic Reserve I Acc 100 77 102 79 102 66 110 46 - - - 1.56Kames Absolute Return Bond GBP B Acc 100 75 101 89 103 61 107 54 - - 0.69 -Kames UK Equity Absolute Return B Acc 99 101 96 106 95 78 105 59 - - 0.82 -L&G Multi-Asset Target Return I Acc 103 21 106 24 - - - - - - - 3.17LF Odey Absolute Return Sterling I Acc 100 84 103 51 91 87 140 11 - - 5.06 -Liontrust GF Eurp Strat Eq C3 H Int Acc£ 104 13 105 27 - - - - - - - -M&G Absolute Return Bond GBP I Acc 101 54 103 49 - - - - - - - 1.01M&G Global Target Return GBP I Acc 101 53 104 39 - - - - - - - 0.19Man GLG Alpha Select Alternative IL GBP 106 6 115 5 119 9 141 8 - - 1.35 -Man GLG European Alpha Alt IN H GBP 103 27 102 72 101 72 107 56 - - 1.65 -Man GLG UK Absolute Value Profl CX £ Acc 108 4 - - - - - - - - - -Marlborough Defensive Fund P Inc 101 68 101 87 98 76 103 62 - - - 0.64MI Activus Investment Z GBP Acc 103 28 108 14 - - - - - - - 0.01Newton Global Dynamic Bd Inst Inc 100 79 102 80 104 54 108 48 162 3 0.81 2.80Newton Managed Targeted Ret Inst W Acc 100 86 103 53 116 17 - - - - - 0.85Newton Real Return Inst W Acc 99 95 102 63 108 36 118 28 151 6 - 2.33Nordea 1 - GBP Diversified Return BC GBP 101 66 104 38 - - - - - - 0.99 -Old Mutual AR Govt Bd R GBP Acc 104 11 103 58 - - - - - - 0.75 -Old Mutual Global Eq AR R £ Hgd Acc 106 7 107 22 114 19 147 5 - - 1.92 -Old Mutual Strat Abs Ret Bd R GBP H Acc 101 52 103 52 101 67 95 70 - - 0.92 -Old Mutual Style Pre Abs Ret F GBPH Acc 99 96 102 65 - - - - - - - -Old Mutual UK Opportunities R GBP Acc 101 64 102 59 92 86 110 45 - - - -Old Mutual UK Specialist Eq R GBP Acc 107 5 116 4 - - - - - - 3.52 -OYSTER Absolute Return GBP R GBP D 102 42 104 45 106 43 - - - - 0.80 1.17Premier Defensive Growth C Inc 100 91 101 90 105 51 113 38 - - - -Premier Multi Asset Absolute Ret C Acc 102 35 104 43 109 33 119 24 129 14 1.20 -Royal London Abs Ret Govt Bd M GBP Acc 100 83 100 93 - - - - - - - -RWC Core Plus B EUR 103 31 107 18 122 7 121 22 143 9 1.00 -RWC Europe Absolute Alpha Fund R GBP 99 99 99 95 95 79 117 30 - - 1.35 -RWC US Absolute Alpha R GBP 104 12 106 23 106 44 128 17 - - 1.36 -Sanlam FOUR Multi Strat A GBP Acc 103 23 107 16 115 18 - - - - 1.01 -Schroder Absolute Return Bond Z GBP Acc 100 88 101 85 101 68 106 58 125 15 0.92 1.87Schroder European Eq Abs Ret P2 Acc Euro 98 108 101 91 111 25 111 43 - - 1.01 -Schroder ISF Asian Bd Abs Rt Z Acc USD 99 100 96 107 - - - - - - 0.93 -Schroder ISF EM Dbt Abs Rt Z Acc EUR H 102 41 109 11 120 8 113 40 147 8 1.08 -Schroder Multi-Asset Total Return Z Acc 104 15 - - - - - - - - - -Schroder UK Dynamic Abs Ret P2 GBP Acc 102 37 111 6 128 4 140 9 - - 1.25 -SLI Abs Ret Glb Bd Strats A GBP Acc 99 105 98 98 100 73 103 61 - - - -SLI Global Absolute Ret Strat Plat 1 Acc 102 43 102 62 102 63 115 34 - - - 1.21Smith & Williamson Defensive Growth B 103 16 107 20 117 15 128 16 148 7 - 0.66Smith & Williamson Enterprise C 104 10 105 33 111 26 136 12 171 1 0.93 -SVS Church House Tenax AbsRt Strts A Acc 101 67 102 60 112 24 124 20 154 5 1.35 0.51T. Rowe Price Dynamic Glbl Bd Qh GBP 100 93 97 102 - - - - - - 0.67 -Threadneedle Abs Ret Bd Ins Acc GBP 100 82 99 97 92 85 92 71 110 18 0.70 0.61Threadneedle Crdt Opps Inst Acc GBP H 101 60 102 69 108 38 113 39 - - 0.70 1.54Threadneedle Dynamic Rl Ret Z Acc 103 25 107 19 118 11 - - - - - 0.95Threadneedle Global Opps Bd Z Acc 100 73 100 94 - - - - - - - 1.16Threadneedle UK Abs Alpha Z Acc GBP 100 72 104 40 107 39 124 19 - - 0.93 -Tideway Real Return A GBP Acc 103 26 109 12 109 30 119 26 - - - -TM Fulcrum Divers Cor Abs Ret C GBP Acc 102 34 102 74 104 55 - - - - - -TM Fulcrum Diversified Abs Ret C GBP Acc 102 33 103 57 104 56 119 25 - - - -TM Sanditon European Sel GBP A Acc 95 110 93 110 88 89 - - - - - -TM Sanditon UK Select A NET Acc 91 113 87 112 91 88 - - - - - -UBS (Irl) Inv Sel Glb Eq L/S £ H Q-PF 103 18 102 64 - - - - - - 1.05 -Vontobel Ttfr Abs Ret Crdt G GBP 102 36 105 29 - - - - - - 0.45 -VT icf Absolute Return Portfolio F GBP 101 61 102 78 105 49 117 29 - - 2.06 -VT iFunds Absolute Return Green A Acc 103 29 105 26 112 22 143 7 - - - -VT iFunds Absolute Return Indigo A Acc 101 51 103 46 102 65 116 32 - - - -VT iFunds Absolute Return Orange A Acc 104 14 110 7 116 16 160 2 - - - 0.19WAY Absolute Return Portfolio E Acc 101 71 104 41 109 31 126 18 - - 1.04 0.62Average/Total 101 114 103 112 107 89 119 71 141 18 1.37 1.19
(IA) TECHNOLOGY AND TELECOMMUNICATIONSAberdeen Global Technology Eq X Acc GBP 108 11 120 12 154 9 205 9 294 7 0.95 -AXA Framlington Global Technology Z Acc 112 4 130 4 189 3 280 5 437 1 - -Close FTSE TechMark X Acc 104 14 109 14 136 10 197 11 307 6 1.04 1.29Fidelity Global Technology W-Acc-GBP 112 5 125 8 203 1 321 1 395 2 1.16 -Fidelity Global TeleComms W-Acc-GBP 100 15 100 15 125 12 159 12 168 10 1.18 -GAM Star Technology Instl GBP Acc 105 13 123 10 157 8 235 7 - - 1.71 -Invesco Global Technology A USD AD 106 12 122 11 160 7 234 8 266 8 1.99 -Janus Henderson Global Technology I Acc 113 2 132 3 187 4 275 6 391 3 1.03 0.01L&G Global Technology Index Trust I Acc 112 3 125 9 182 6 287 4 372 4 0.32 0.98MFM Techinvest Technology A Acc 97 16 111 13 126 11 202 10 330 5 1.74 -Neptune Global Technology C GBP Acc 112 7 128 6 - - - - - - - -Pictet - RoboticsI GBP 115 1 129 5 - - - - - - 1.20 -Pictet-Digital I dy GBP 109 10 126 7 187 5 289 3 210 9 1.21 -Polar Capital Global Technology I 112 6 135 2 203 2 301 2 - - 1.69 -T. Rowe Price Global Tech Eq C GBP 111 8 - - - - - - - - - -T. Rowe Price Global Tech Eq Qd GBP 110 9 135 1 - - - - - - 1.01 -Average/Total 109 16 123 15 167 12 249 12 317 10 1.25 0.76
(IA) UK ALL COMPANIES7IM UK Equity Value C Inc 106 139 110 205 - - - - - - - 3.93Aberdeen Global UK Eq X SInc GBP 103 235 112 181 124 202 146 219 165 159 0.98 2.04Aberdeen Responsible UK Equity I Acc 104 199 113 120 134 88 156 178 176 135 - 1.99Aberdeen UK All Share Tracker C Acc 106 133 113 135 132 117 158 172 - - - 3.12Aberdeen UK Eq Enh Idx B GBP Acc 106 98 114 108 - - - - - - - 3.23Aberdeen UK Equity I Acc 103 234 112 160 125 193 147 215 172 141 1.10 2.15Aberdeen UK Equity Index Managed B Acc 106 147 112 159 131 125 154 190 - - - 3.26
FUND 6 MONTHS 1 YEAR 3 YEARS 5 YEARS 10 YEARS TER YIELD£ £ £ £ £ % %
Aberdeen UK Mid-Cap Equity I Acc 105 186 116 70 137 76 179 81 233 42 - 1.28Allianz UK Mid Cap C Acc 114 8 119 45 147 32 200 27 256 24 - 0.84Allianz UK Opportunities C Acc GBP 107 91 116 78 141 52 174 95 170 143 - 1.35Architas MM UK Equity A Acc 104 201 112 151 129 155 160 159 159 174 1.25 1.78Ardevora UK Equity A GBP Acc 112 16 114 99 148 29 197 34 - - - -Artemis Capital I Acc 113 14 118 52 144 41 196 37 187 102 0.94 2.27Artemis Instl UK Special Sits IN Acc 103 223 106 246 122 219 166 125 206 69 0.77 2.23Artemis UK Select I Acc 109 50 121 31 138 71 191 48 224 45 0.84 2.15Artemis UK Special Situations I Acc 104 207 107 242 122 216 158 171 192 96 0.81 2.10Artorius A GBP Acc 112 22 126 16 152 13 210 18 - - - 0.24Aviva Investors UK Eq MoM 1 2 GBP Inc 109 47 122 28 147 33 217 14 290 11 1.03 1.19Aviva Investors UK Eq MoM 2 2 GBP Inc 105 174 112 149 130 143 145 220 103 195 1.03 2.69Aviva Investors UK Eq MoM 3 2 GBP Inc 104 212 106 247 124 206 161 150 143 188 1.07 1.31Aviva Investors UK Equity 2 GBP Acc 105 187 114 100 139 67 174 92 222 48 0.82 2.45Aviva Investors UK Growth 2 GBP Acc 110 33 120 35 138 75 171 104 210 65 0.82 1.54Aviva Investors UK Index Tracking 2 £Inc 107 89 113 144 132 112 160 162 174 137 0.23 3.46Aviva Investors UK Opportunities 2 £ Acc 107 88 116 69 129 156 167 122 202 75 0.78 1.92AXA Framlington UK Growth Z GBP Acc 104 198 109 221 125 191 164 135 189 99 0.72 2.11AXA Framlington UK Mid Cap Z Acc 110 37 119 42 147 31 218 12 - - 0.93 1.16AXA Framlington UK Select Opps Z Inc 105 173 109 219 124 205 161 148 214 58 - 0.84Baillie Gifford UK Equity Alpha B Acc 113 11 124 24 152 14 172 102 216 56 0.69 1.11Barclays UK Alpha R Acc GBP 105 188 108 235 125 190 168 120 184 109 - 2.01Barclays UK Alpha S2 R Acc GBP 105 184 108 234 125 192 167 123 - - - 1.92Barclays UK Core R Acc GBP 104 196 110 202 132 116 160 165 164 161 - 2.06Barclays UK Lower Cap R Acc GBP 112 20 126 18 160 9 235 6 - - - 0.74Barclays UK Opportunities R Acc GBP 105 164 115 83 139 65 184 69 224 46 - 1.85BlackRock UK D Acc 108 59 116 68 140 58 176 84 169 147 0.92 1.98BlackRock UK Equity D Acc 106 104 115 87 140 60 173 99 - - - 2.13BlackRock UK Focus D Acc 104 216 108 224 130 146 162 144 - - - 1.77BlackRock UK Special Situations D Acc 110 39 122 30 144 39 170 110 239 34 0.92 1.83Castlefield CFP SDL UK Bufftlgy Inst Inc 117 3 126 17 181 2 250 4 - - - 1.03Castlefield UK Opportunities Instl Inc 104 209 110 208 122 215 153 194 137 191 2.31 1.72Cavendish Opportunities B Inc 105 177 114 103 143 46 187 60 286 12 0.83 1.28CF Purisima UK Total Return A PCG 103 227 109 211 125 199 149 207 183 111 1.46 2.04CFP SDL Free Spirit General (Acc) 116 4 - - - - - - - - - -Dimensional UK Core Equity GBP Acc 106 108 114 107 133 97 163 136 185 104 0.36 2.34Dimensional UK Value Acc 110 31 116 77 130 137 151 202 143 190 0.54 1.97EdenTree Amity UK B 104 204 113 136 128 173 168 121 211 61 0.87 2.03EdenTree UK Equity Growth B 109 53 120 37 138 74 201 25 275 18 0.84 1.84Elite Webb Cap Smaller Co Inc & Gr B Acc 118 2 142 1 149 23 215 16 - - - 1.48F&C FTSE All-Share Tracker 2 Inc 106 136 113 137 132 120 159 168 177 129 0.38 3.37F&C Institutional UK Eq 4 101 253 110 207 130 133 155 185 176 133 0.02 3.06F&C Responsible UK Equity Gr 2 108 77 120 39 139 63 186 65 193 95 0.81 2.00F&C UK Alpha 2 101 254 108 231 126 187 139 230 152 183 0.86 1.83F&C UK Mid-Cap C Net Acc 105 170 119 49 142 50 210 17 314 8 - 1.91Family Asset Trust 106 144 111 189 127 180 151 201 144 186 1.03 2.82Family Charities Ethical Tr Inc 104 200 109 220 121 226 141 229 118 194 1.46 2.21Fidelity FAST UK Y-ACC-GBP 108 75 116 74 140 59 186 62 - - 1.28 -Fidelity Index UK P Acc 106 123 113 121 133 101 160 160 176 131 - 2.43Fidelity Instl UK 103 230 109 210 130 134 170 109 193 93 0.87 2.08Fidelity MoneyBuilder Growth Y Inc 104 210 107 240 124 201 169 111 184 108 0.68 2.38Fidelity Special Situations W Acc 106 105 115 80 148 28 195 40 236 38 - 1.45Fidelity UK Opportunities W Acc 108 64 113 145 150 21 198 31 - - - 1.39Fidelity UK Select W Acc 106 117 116 76 139 69 182 71 216 54 - 1.36FP CRUX UK B Inc 103 226 108 228 132 110 173 96 191 98 1.18 1.78FP Numis Mid Cap A GBP Acc 108 70 119 43 - - - - - - - 2.89FP Octopus UK Equity B Acc 104 197 112 171 130 140 161 151 - - 1.11 1.53FP Russell Invsmts UK Growth Assts C Acc 106 118 112 156 127 179 161 158 - - 1.07 4.05Franklin UK Managers' Focus W Acc 106 109 115 79 140 60 216 15 257 23 0.83 2.21Franklin UK Mid Cap W Acc 112 18 126 15 144 40 202 23 339 7 0.82 2.23Franklin UK Opportunities W Acc 105 181 112 180 130 138 169 114 178 122 0.55 3.28Franklin UK Rising Dividends W Acc 104 211 113 115 138 70 181 77 193 94 0.55 3.28GAM UK Diversified Instl GBP Acc 103 238 105 254 116 242 152 197 186 103 1.12 1.41GlobalAccess UK Alpha I Acc GBP 105 182 108 230 124 200 165 130 - - 1.06 -GlobalAccess UK Opportunities I Acc GBP 105 158 114 93 136 80 - - - - 1.20 -GVQ Opportunities A GBP Inc 103 232 109 209 - - - - - - - 1.87GVQ UK Focus I GBP Inc 103 219 108 229 130 145 197 33 253 25 1.00 2.14Halifax Special Situations C 103 236 111 192 122 217 129 232 120 193 1.51 1.39Halifax UK FTSE 100 Idx Track C 105 180 111 196 127 178 148 211 152 182 1.53 2.67Halifax UK FTSE AllSh Idx Track C 106 143 112 157 129 148 155 186 164 162 1.50 2.53Halifax UK Growth C 106 120 113 140 130 139 155 184 163 166 1.51 2.68HL Multi-Manager UK Growth A Acc 105 149 115 82 - - - - - - - 1.57HL Select UK Growth A Acc 107 87 119 46 - - - - - - - 1.65HSBC Common For Growth Income 99 258 106 249 121 228 150 205 174 136 0.75 4.11HSBC FTSE 100 Index Accumulation C 105 161 112 174 130 136 154 189 166 154 0.17 3.44HSBC FTSE 250 Index C Acc 108 72 118 55 138 72 188 59 245 28 0.18 2.34HSBC FTSE All Share Index C Acc 106 126 113 124 133 102 161 157 178 123 0.17 3.31HSBC MERIT UK Equity I A Inc 106 112 113 138 129 152 157 174 173 139 0.53 3.12HSBC UK Focus R Acc 100 255 105 250 119 236 149 209 169 149 1.54 2.96HSBC UK Freestyle Retail Acc 102 247 108 232 119 237 144 223 144 187 1.69 3.75HSBC UK Growth & Income C Acc 102 244 109 223 120 229 148 214 162 167 1.00 3.46Investec UK Alpha I Inc Net 103 221 113 139 130 129 193 44 235 40 0.87 2.30Investec UK Special Situations I Acc Net 103 231 105 251 123 212 155 187 221 49 0.85 2.18IP High Income Z Acc 99 260 105 252 120 230 168 117 194 90 - 3.22IP Income Z Acc 99 261 105 255 118 239 165 129 189 100 - 3.33IP UK Companies Z Acc 103 239 107 236 123 210 173 98 202 74 - 2.50IP UK Enhanced Index No Trail 107 83 115 90 134 94 171 106 197 87 0.41 3.55IP UK Focus Z Acc 107 80 113 148 134 93 195 43 236 37 - 2.25IP UK Growth Z Acc 106 110 112 185 129 149 182 75 199 80 - 2.45IP UK Strategic Income Z Acc 101 252 109 222 118 238 176 85 218 53 - 3.01iShares 100 UK Equity Index (UK) D Acc 105 155 112 165 131 128 155 180 - - - 3.34iShares Mid Cap UK Equity Idx (UK) D Acc 108 74 118 54 139 64 189 57 - - 0.19 2.56iShares UK Equity Index (UK) D Acc 106 125 113 123 133 99 161 149 182 115 0.16 3.19Janus Henderson Instl Hi Alp UK Eq I Acc 105 166 111 186 128 169 174 93 181 119 0.77 3.77Janus Henderson Instl MainstrmUKEq I Acc 105 160 111 193 128 165 168 118 176 132 0.54 3.52Janus Henderson Instl UK Eq Trck A Inc 105 163 112 173 128 163 153 196 160 170 1.04 2.68Janus Henderson Instl UK Idx Opps I Acc 106 138 113 143 132 106 161 154 182 116 0.52 3.09Janus Henderson UK Alpha I Acc 110 44 122 29 150 19 189 56 164 160 1.06 2.39
FUND 6 MONTHS 1 YEAR 3 YEARS 5 YEARS 10 YEARS TER YIELD FUND 6 MONTHS 1 YEAR 3 YEARS 5 YEARS 10 YEARS TER YIELD £ £ £ £ £ % % £ £ £ £ £ % %
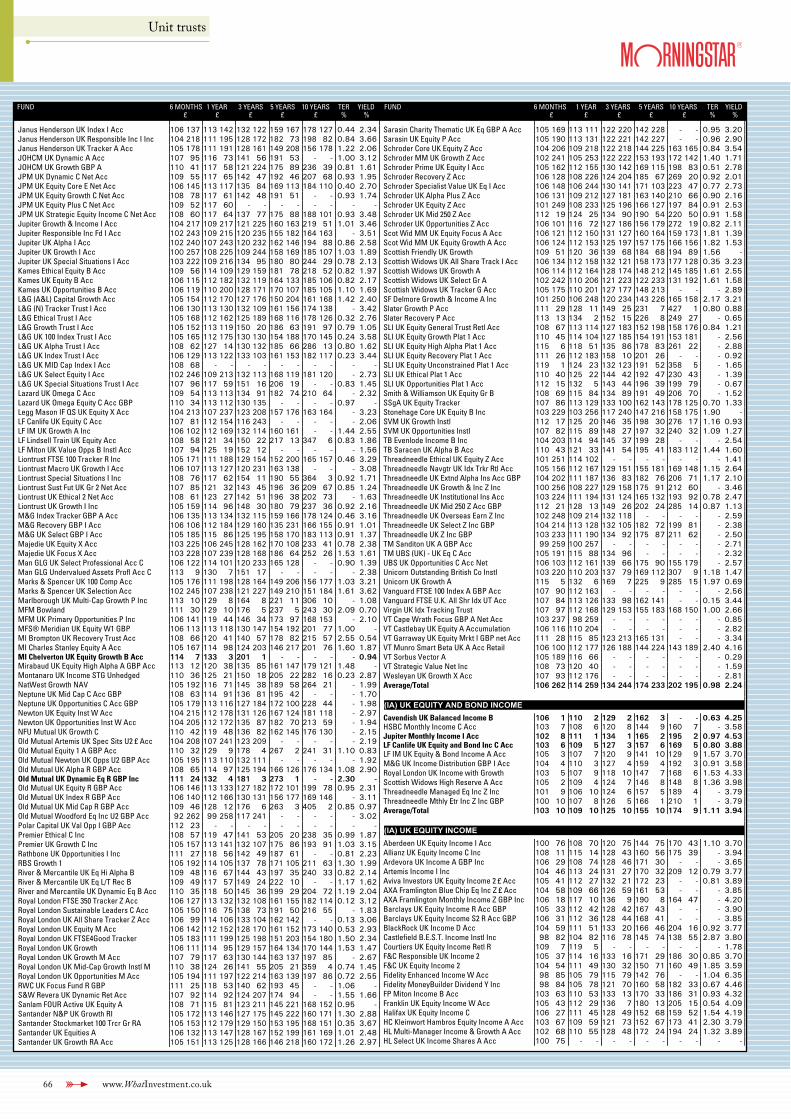
66 www.WhatInvestment.co.uk
Unit trusts
FUND 6 MONTHS 1 YEAR 3 YEARS 5 YEARS 10 YEARS TER YIELD£ £ £ £ £ % %
Janus Henderson UK Index I Acc 106 137 113 142 132 122 159 167 178 127 0.44 2.34Janus Henderson UK Responsible Inc I Inc 104 218 111 195 128 172 182 73 198 82 0.84 3.66Janus Henderson UK Tracker A Acc 105 178 111 191 128 161 149 208 156 178 1.22 2.06JOHCM UK Dynamic A Acc 107 95 116 73 141 56 191 53 - - 1.00 3.12JOHCM UK Growth GBP A 110 41 117 58 121 224 175 89 236 39 0.81 1.61JPM UK Dynamic C Net Acc 109 55 117 65 142 47 192 46 207 68 0.93 1.95JPM UK Equity Core E Net Acc 106 145 113 117 135 84 169 113 184 110 0.40 2.70JPM UK Equity Growth C Net Acc 108 78 117 61 142 48 191 51 - - 0.93 1.74JPM UK Equity Plus C Net Acc 109 52 117 60 - - - - - - - -JPM UK Strategic Equity Income C Net Acc 108 60 117 64 137 77 175 88 188 101 0.93 3.48Jupiter Growth & Income I Acc 104 217 109 217 121 225 160 163 219 51 1.01 3.46Jupiter Responsible Inc Fd I Acc 102 243 109 215 120 235 155 182 164 163 - 3.51Jupiter UK Alpha I Acc 102 240 107 243 120 232 162 146 194 88 0.86 2.58Jupiter UK Growth I Acc 100 257 108 225 109 244 158 169 185 107 1.03 1.89Jupiter UK Special Situations I Acc 103 222 109 216 134 95 180 80 244 29 0.78 2.13Kames Ethical Equity B Acc 109 56 114 109 129 159 181 78 218 52 0.82 1.97Kames UK Equity B Acc 106 115 112 182 132 119 164 133 185 106 0.82 2.17Kames UK Opportunities B Acc 106 119 110 200 128 171 170 107 185 105 1.10 1.69L&G (A&L) Capital Growth Acc 105 154 112 170 127 176 150 204 161 168 1.42 2.40L&G (N) Tracker Trust I Acc 106 130 113 130 132 109 161 156 174 138 - 3.42L&G Ethical Trust I Acc 105 168 112 162 125 189 168 116 178 126 0.32 2.76L&G Growth Trust I Acc 105 152 113 119 150 20 186 63 191 97 0.79 1.05L&G UK 100 Index Trust I Acc 105 165 112 175 130 130 154 188 170 145 0.24 3.58L&G UK Alpha Trust I Acc 108 62 127 14 130 132 185 66 286 13 0.80 1.62L&G UK Index Trust I Acc 106 129 113 122 133 103 161 153 182 117 0.23 3.44L&G UK MID Cap Index I Acc 108 68 - - - - - - - - - -L&G UK Select Equity I Acc 102 246 109 213 132 113 168 119 181 120 - 2.73L&G UK Special Situations Trust I Acc 107 96 117 59 151 16 206 19 - - 0.83 1.45Lazard UK Omega C Acc 109 54 113 113 134 91 182 74 210 64 - 2.32Lazard UK Omega Equity C Acc GBP 110 34 113 112 130 135 - - - - 0.97 -Legg Mason IF QS UK Equity X Acc 104 213 107 237 123 208 157 176 163 164 - 3.23LF Canlife UK Equity C Acc 107 81 112 154 116 243 - - - - - 2.06LF IM UK Growth A Inc 106 102 112 169 132 114 160 161 - - 1.44 2.55LF Lindsell Train UK Equity Acc 108 58 121 34 150 22 217 13 347 6 0.83 1.86LF Miton UK Value Opps B Instl Acc 107 94 125 19 152 12 - - - - - 1.56Liontrust FTSE 100 Tracker R Inc 105 171 111 188 129 154 152 200 165 157 0.46 3.29Liontrust Macro UK Growth I Acc 106 107 113 127 120 231 163 138 - - - 3.08Liontrust Special Situations I Inc 108 76 117 62 154 11 190 55 364 3 0.92 1.71Liontrust Sust Fut UK Gr 2 Net Acc 107 85 121 32 143 45 196 36 209 67 0.85 1.24Liontrust UK Ethical 2 Net Acc 108 61 123 27 142 51 196 38 202 73 - 1.63Liontrust UK Growth I Inc 105 159 114 96 148 30 180 79 237 36 0.92 2.16M&G Index Tracker GBP A Acc 106 135 113 134 132 115 159 166 178 124 0.46 3.16M&G Recovery GBP I Acc 106 106 112 184 129 160 135 231 166 155 0.91 1.01M&G UK Select GBP I Acc 105 185 115 86 125 195 158 170 183 113 0.91 1.37Majedie UK Equity X Acc 103 225 106 245 128 162 170 108 233 41 0.78 2.38Majedie UK Focus X Acc 103 228 107 239 128 168 186 64 252 26 1.53 1.61Man GLG UK Select Professional Acc C 106 122 114 101 120 233 165 128 - - 0.90 1.39Man GLG Undervalued Assets Profl Acc C 113 9 130 7 151 17 - - - - - 2.38Marks & Spencer UK 100 Comp Acc 105 176 111 198 128 164 149 206 156 177 1.03 3.21Marks & Spencer UK Selection Acc 102 245 107 238 121 227 149 210 151 184 1.61 3.62Marlborough UK Multi-Cap Growth P Inc 113 10 129 8 164 8 221 11 306 10 - 1.08MFM Bowland 111 30 129 10 176 5 237 5 243 30 2.09 0.70MFM UK Primary Opportunities P Inc 106 141 119 44 146 34 173 97 168 153 - 2.10MFS® Meridian UK Equity W1 GBP 106 113 113 118 130 147 154 192 201 77 1.00 -MI Brompton UK Recovery Trust Acc 108 66 120 41 140 57 178 82 215 57 2.55 0.54MI Charles Stanley Equity A Acc 105 167 114 98 124 203 146 217 201 76 1.60 1.87MI Chelverton UK Equity Growth B Acc 114 7 133 3 201 1 - - - - - 0.94Mirabaud UK Equity High Alpha A GBP Acc 113 12 120 38 135 85 161 147 179 121 1.48 -Montanaro UK Income STG Unhedged 110 36 125 21 150 18 205 22 282 16 0.23 2.87NatWest Growth NAV 105 192 116 71 145 38 189 58 264 21 - 1.99Neptune UK Mid Cap C Acc GBP 108 63 114 91 136 81 195 42 - - - 1.70Neptune UK Opportunities C Acc GBP 105 179 113 116 127 184 172 100 228 44 - 1.98Newton UK Equity Inst W Acc 104 215 112 178 131 126 167 124 181 118 - 2.97Newton UK Opportunities Inst W Acc 104 205 112 172 135 87 182 70 213 59 - 1.94NFU Mutual UK Growth C 110 42 119 48 136 82 162 145 176 130 - 2.15Old Mutual Artemis UK Spec Sits U2 £ Acc 104 208 107 241 123 209 - - - - - 2.19Old Mutual Equity 1 A GBP Acc 110 32 129 9 178 4 267 2 241 31 1.10 0.83Old Mutual Newton UK Opps U2 GBP Acc 105 195 113 110 132 111 - - - - - 1.92Old Mutual UK Alpha R GBP Acc 108 65 114 97 125 194 166 126 176 134 1.08 2.90Old Mutual UK Dynamic Eq R GBP Inc 111 24 132 4 181 3 273 1 - - 2.30 -Old Mutual UK Equity R GBP Acc 106 146 113 133 127 182 172 101 199 78 0.95 2.31Old Mutual UK Index R GBP Acc 106 140 112 166 130 131 156 177 169 146 - 3.11Old Mutual UK Mid Cap R GBP Acc 109 46 128 12 176 6 263 3 405 2 0.85 0.97Old Mutual Woodford Eq Inc U2 GBP Acc 92 262 99 258 117 241 - - - - - 3.02Polar Capital UK Val Opp I GBP Acc 112 23 - - - - - - - - - -Premier Ethical C Inc 108 57 119 47 141 53 205 20 238 35 0.99 1.87Premier UK Growth C Inc 105 157 113 141 132 107 175 86 193 91 1.03 3.15Rathbone UK Opportunities I Inc 111 27 118 56 142 49 187 61 - - 0.81 2.23RBS Growth 1 105 192 114 105 137 78 171 105 211 63 1.30 1.99River & Mercantile UK Eq Hi Alpha B 109 48 116 67 144 43 197 35 240 33 0.82 2.14River & Mercantile UK Eq L/T Rec B 109 49 117 57 149 24 222 10 - - 1.17 1.62River and Mercantile UK Dynamic Eq B Acc 110 35 118 50 145 36 199 29 204 72 1.19 2.04Royal London FTSE 350 Tracker Z Acc 106 127 113 132 132 108 161 155 182 114 0.12 3.12Royal London Sustainable Leaders C Acc 105 150 116 75 138 73 191 50 216 55 - 1.83Royal London UK All Share Tracker Z Acc 106 99 114 106 133 104 162 142 - - 0.13 3.06Royal London UK Equity M Acc 106 142 112 152 128 170 161 152 173 140 0.53 2.93Royal London UK FTSE4Good Tracker 105 183 111 199 125 198 151 203 154 180 1.50 2.34Royal London UK Growth 106 111 114 95 129 157 164 134 170 144 1.53 1.47Royal London UK Growth M Acc 107 79 117 63 130 144 163 137 197 85 - 2.67Royal London UK Mid-Cap Growth Instl M 110 38 124 26 141 55 205 21 359 4 0.74 1.45Royal London UK Opportunities M Acc 105 194 111 197 122 214 163 139 197 86 0.72 2.55RWC UK Focus Fund R GBP 111 25 118 53 140 62 193 45 - - 1.06 -S&W Revera UK Dynamic Ret Acc 107 92 114 92 124 207 174 94 - - 1.55 1.66Sanlam FOUR Active UK Equity A 108 71 115 81 123 211 145 221 168 152 0.95 -Santander N&P UK Growth RI 105 172 113 146 127 175 145 222 160 171 1.30 2.88Santander Stockmarket 100 Trcr Gr RA 105 153 112 179 129 150 153 195 168 151 0.35 3.67Santander UK Equities A 106 132 113 147 128 167 152 199 161 169 1.01 2.48Santander UK Growth RA Acc 105 151 113 125 128 166 146 218 160 172 1.26 2.97
FUND 6 MONTHS 1 YEAR 3 YEARS 5 YEARS 10 YEARS TER YIELD£ £ £ £ £ % %
Sarasin Charity Thematic UK Eq GBP A Acc 105 169 113 111 122 220 142 228 - - 0.95 3.20Sarasin UK Equity P Acc 105 190 113 131 122 221 142 227 - - 0.96 2.90Schroder Core UK Equity Z Acc 104 206 109 218 122 218 144 225 163 165 0.84 3.54Schroder MM UK Growth Z Acc 102 241 105 253 122 222 153 193 172 142 1.40 1.71Schroder Prime UK Equity I Acc 105 162 112 155 130 142 169 115 198 83 0.51 2.78Schroder Recovery Z Acc 106 128 108 226 124 204 185 67 269 20 0.92 2.01Schroder Specialist Value UK Eq I Acc 106 148 106 244 130 141 171 103 223 47 0.77 2.73Schroder UK Alpha Plus Z Acc 106 131 109 212 127 181 163 140 210 66 0.90 2.16Schroder UK Equity Z Acc 101 249 108 233 125 196 166 127 197 84 0.91 2.53Schroder UK Mid 250 Z Acc 112 19 124 25 134 90 190 54 220 50 0.91 1.58Schroder UK Opportunities Z Acc 106 101 116 72 127 186 156 179 272 19 0.82 2.11Scot Wid MM UK Equity Focus A Acc 106 121 112 150 131 127 160 164 159 173 1.81 1.39Scot Wid MM UK Equity Growth A Acc 106 124 112 153 125 197 157 175 166 156 1.82 1.53Scottish Friendly UK Growth 109 51 120 36 139 68 184 68 194 89 1.56 -Scottish Widows UK All Share Track I Acc 106 134 112 158 132 121 158 173 177 128 0.35 3.23Scottish Widows UK Growth A 106 114 112 164 128 174 148 212 145 185 1.61 2.55Scottish Widows UK Select Gr A 102 242 110 206 121 223 122 233 131 192 1.61 1.58Scottish Widows UK Tracker G Acc 105 175 110 201 127 177 148 213 - - - 2.89SF Delmore Growth & Income A Inc 101 250 106 248 120 234 143 226 165 158 2.17 3.21Slater Growth P Acc 111 29 128 11 149 25 231 7 427 1 0.80 0.88Slater Recovery P Acc 113 13 134 2 152 15 226 8 249 27 - 0.65SLI UK Equity General Trust Retl Acc 108 67 113 114 127 183 152 198 158 176 0.84 1.21SLI UK Equity Growth Plat 1 Acc 110 45 114 104 127 185 154 191 153 181 - 2.56SLI UK Equity High Alpha Plat 1 Acc 115 6 118 51 135 86 178 83 261 22 - 2.88SLI UK Equity Recovery Plat 1 Acc 111 26 112 183 158 10 201 26 - - - 0.92SLI UK Equity Unconstrained Plat 1 Acc 119 1 124 23 132 123 191 52 358 5 - 1.65SLI UK Ethical Plat 1 Acc 110 40 125 22 144 42 192 47 230 43 - 1.39SLI UK Opportunities Plat 1 Acc 112 15 132 5 143 44 196 39 199 79 - 0.67Smith & Williamson UK Equity Gr B 108 69 115 84 134 89 191 49 206 70 - 1.52SSgA UK Equity Tracker 107 86 113 129 133 100 162 143 178 125 0.70 1.33Stonehage Core UK Equity B Inc 103 229 103 256 117 240 147 216 158 175 1.90 -SVM UK Growth Instl 112 17 125 20 146 35 198 30 276 17 1.16 0.93SVM UK Opportunities Instl 107 82 115 89 148 27 197 32 240 32 1.09 1.27TB Evenlode Income B Inc 104 203 114 94 145 37 199 28 - - - 2.54TB Saracen UK Alpha B Acc 110 43 121 33 141 54 195 41 183 112 1.44 1.60Threadneedle Ethical UK Equity Z Acc 101 251 114 102 - - - - - - - 1.41Threadneedle Navgtr UK Idx Trkr Rtl Acc 105 156 112 167 129 151 155 181 169 148 1.15 2.64Threadneedle UK Extnd Alpha Ins Acc GBP 104 202 111 187 136 83 182 76 206 71 1.17 2.10Threadneedle UK Growth & Inc Z Inc 100 256 108 227 129 158 175 91 212 60 - 3.46Threadneedle UK Institutional Ins Acc 103 224 111 194 131 124 165 132 193 92 0.78 2.47Threadneedle UK Mid 250 Z Acc GBP 112 21 128 13 149 26 202 24 285 14 0.87 1.13Threadneedle UK Overseas Earn Z Inc 102 248 109 214 132 118 - - - - - 2.59Threadneedle UK Select Z Inc GBP 104 214 113 128 132 105 182 72 199 81 - 2.38Threadneedle UK Z Inc GBP 103 233 111 190 134 92 175 87 211 62 - 2.50TM Sanditon UK A GBP Acc 99 259 100 257 - - - - - - - 2.71TM UBS (UK) - UK Eq C Acc 105 191 115 88 134 96 - - - - - 2.32UBS UK Opportunities C Acc Net 106 103 112 161 139 66 175 90 155 179 - 2.57Unicorn Outstanding British Co Instl 103 220 110 203 137 79 169 112 307 9 1.18 1.47Unicorn UK Growth A 115 5 132 6 169 7 225 9 285 15 1.97 0.69Vanguard FTSE 100 Index A GBP Acc 107 90 112 163 - - - - - - - 2.56Vanguard FTSE U.K. All Shr Idx UT Acc 107 84 113 126 133 98 162 141 - - 0.15 3.44Virgin UK Idx Tracking Trust 107 97 112 168 129 153 155 183 168 150 1.00 2.66VT Cape Wrath Focus GBP A Net Acc 103 237 98 259 - - - - - - - 0.85VT Castlebay UK Equity A Accumulation 106 116 110 204 - - - - - - - 2.82VT Garraway UK Equity Mrkt I GBP net Acc 111 28 115 85 123 213 165 131 - - - 3.34VT Munro Smart Beta UK A Acc Retail 106 100 112 177 126 188 144 224 143 189 2.40 4.16VT Sorbus Vector A 105 189 116 66 - - - - - - - 0.29VT Strategic Value Net Inc 108 73 120 40 - - - - - - - 1.59Wesleyan UK Growth X Acc 107 93 112 176 - - - - - - - 2.81Average/Total 106 262 114 259 134 244 174 233 202 195 0.98 2.24
(IA) UK EQUITY AND BOND INCOMECavendish UK Balanced Income B 106 1 110 2 129 2 162 3 - - 0.63 4.25HSBC Monthly Income C Acc 103 7 108 6 120 8 144 9 160 7 - 3.58Jupiter Monthly Income I Acc 102 8 111 1 134 1 165 2 195 2 0.97 4.53LF Canlife UK Equity and Bond Inc C Acc 103 6 109 5 127 3 157 6 169 5 0.80 3.88LF IM UK Equity & Bond Income A Acc 105 3 107 7 120 9 141 10 129 9 1.57 3.70M&G UK Income Distribution GBP I Acc 104 4 110 3 127 4 159 4 192 3 0.91 3.58Royal London UK Income with Growth 103 5 107 9 118 10 147 7 168 6 1.53 4.33Scottish Widows High Reserve A Acc 105 2 109 4 124 7 146 8 148 8 1.36 3.98Threadneedle Managed Eq Inc Z Inc 101 9 106 10 124 6 157 5 189 4 - 3.79Threadneedle Mthly Etr Inc Z Inc GBP 100 10 107 8 126 5 166 1 210 1 - 3.79Average/Total 103 10 109 10 125 10 155 10 174 9 1.11 3.94
(IA) UK EQUITY INCOMEAberdeen UK Equity Income I Acc 100 76 108 70 120 75 144 75 170 43 1.10 3.70Allianz UK Equity Income C Inc 108 11 115 14 128 43 160 56 175 39 - 3.94Ardevora UK Income A GBP Inc 106 29 108 74 128 46 171 30 - - - 3.65Artemis Income I Inc 104 46 113 24 131 27 170 32 209 12 0.79 3.77Aviva Investors UK Equity Income 2 £ Acc 105 41 112 27 132 21 172 23 - - 0.81 3.89AXA Framlington Blue Chip Eq Inc Z £ Acc 104 58 109 66 126 59 161 53 - - - 3.85AXA Framlington Monthly Income Z GBP Inc 106 18 117 10 136 9 190 8 164 47 - 4.20Barclays UK Equity Income R Acc GBP 105 33 112 42 128 42 167 43 - - - 3.90Barclays UK Equity Income S2 R Acc GBP 106 31 112 36 128 44 168 41 - - - 3.85BlackRock UK Income D Acc 104 59 111 51 133 20 166 46 204 16 0.92 3.77Castlefield B.E.S.T. Income Instl Inc 98 82 104 82 116 78 145 74 138 55 2.87 3.80Courtiers UK Equity Income Retl R 109 7 119 5 - - - - - - - 1.78F&C Responsible UK Income 2 105 37 114 16 133 16 171 29 186 30 0.85 3.70F&C UK Equity Income 2 104 54 111 49 130 32 150 71 160 49 1.85 3.59Fidelity Enhanced Income W Acc 98 85 105 79 115 79 142 76 - - 1.04 6.35Fidelity MoneyBuilder Dividend Y Inc 98 84 105 78 121 70 160 58 182 33 0.67 4.46FP Miton Income B Acc 103 63 110 53 133 13 170 33 186 31 0.93 4.32Franklin UK Equity Income W Acc 105 43 112 29 136 7 180 13 205 15 0.54 4.09Halifax UK Equity Income C 106 27 111 45 128 49 152 68 159 52 1.54 4.19HC Kleinwort Hambros Equity Income A Acc 103 67 109 59 121 73 152 67 173 41 2.30 3.79HL Multi-Manager Income & Growth A Acc 102 68 110 55 128 48 172 24 194 24 1.32 3.89HL Select UK Income Shares A Acc 100 75 - - - - - - - - - -
FUND 6 MONTHS 1 YEAR 3 YEARS 5 YEARS 10 YEARS TER YIELD FUND 6 MONTHS 1 YEAR 3 YEARS 5 YEARS 10 YEARS TER YIELD £ £ £ £ £ % % £ £ £ £ £ % %
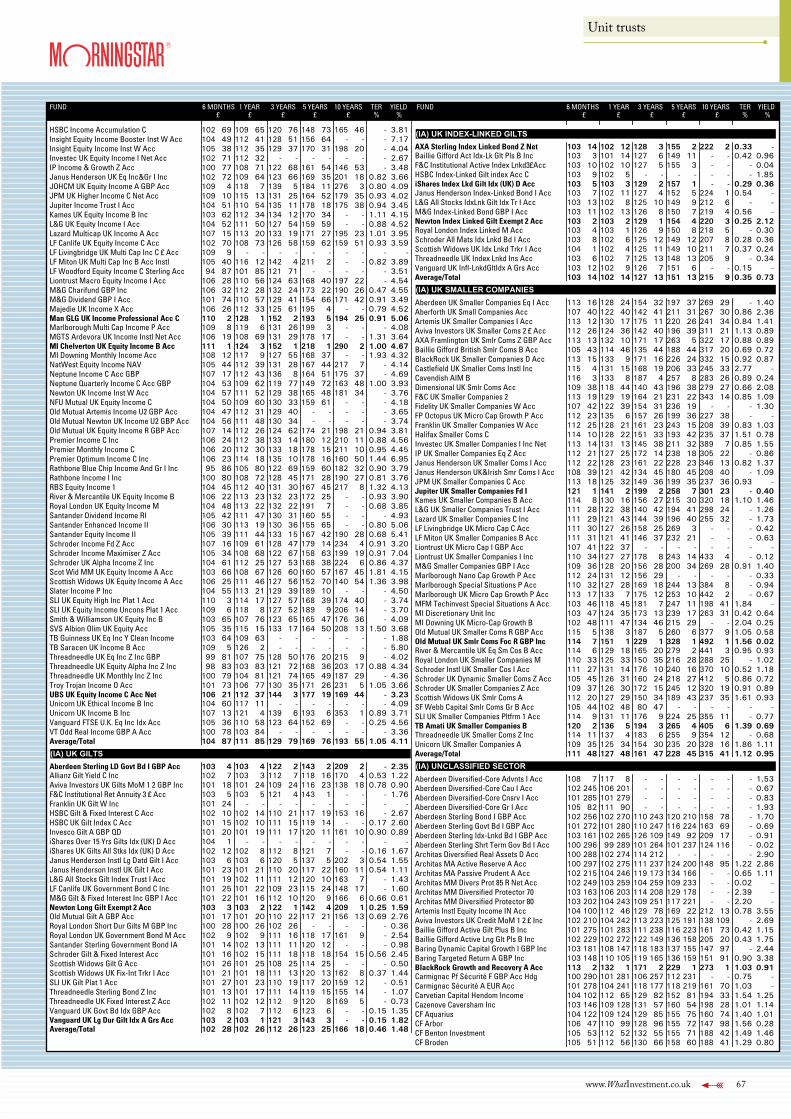
www.WhatInvestment.co.uk 67
Unit trusts
FUND 6 MONTHS 1 YEAR 3 YEARS 5 YEARS 10 YEARS TER YIELD£ £ £ £ £ % %
HSBC Income Accumulation C 102 69 109 65 120 76 148 73 165 46 - 3.81Insight Equity Income Booster Inst W Acc 104 49 112 41 128 51 156 64 - - - 7.17Insight Equity Income Inst W Acc 105 38 112 35 129 37 170 31 198 20 - 4.04Investec UK Equity Income I Net Acc 102 71 112 32 - - - - - - - 2.67IP Income & Growth Z Acc 100 77 108 71 122 68 161 54 146 53 - 3.48Janus Henderson UK Eq Inc&Gr I Inc 102 72 109 64 123 66 169 35 201 18 0.82 3.66JOHCM UK Equity Income A GBP Acc 109 4 118 7 139 5 184 11 276 3 0.80 4.09JPM UK Higher Income C Net Acc 109 10 115 13 131 25 164 52 179 35 0.93 4.02Jupiter Income Trust I Acc 104 51 110 54 135 11 178 18 175 38 0.94 3.45Kames UK Equity Income B Inc 103 62 112 34 134 12 170 34 - - 1.11 4.15L&G UK Equity Income I Acc 104 52 111 50 127 54 159 59 - - 0.88 4.52Lazard Multicap UK Income A Acc 107 15 113 20 133 19 171 27 195 23 1.01 3.95LF Canlife UK Equity Income C Acc 102 70 108 73 126 58 159 62 159 51 0.93 3.59LF Livingbridge UK Multi Cap Inc C £ Acc 109 9 - - - - - - - - - -LF Miton UK Multi Cap Inc B Acc Instl 105 40 116 12 142 4 211 2 - - 0.82 3.89LF Woodford Equity Income C Sterling Acc 94 87 101 85 121 71 - - - - - 3.51Liontrust Macro Equity Income I Acc 106 28 110 56 124 63 168 40 197 22 - 4.54M&G Charifund GBP Inc 106 32 112 28 132 24 173 22 190 26 0.47 4.55M&G Dividend GBP I Acc 101 74 110 57 129 41 154 66 171 42 0.91 3.49Majedie UK Income X Acc 106 26 112 33 125 61 195 4 - - 0.79 4.52Man GLG UK Income Professional Acc C 110 2 128 1 152 2 193 5 194 25 0.91 5.06Marlborough Multi Cap Income P Acc 109 8 119 6 131 26 199 3 - - - 4.08MGTS Ardevora UK Income Instl Net Acc 106 19 108 69 131 29 178 17 - - 1.31 3.64MI Chelverton UK Equity Income B Acc 111 1 124 3 152 1 218 1 290 2 1.00 4.67MI Downing Monthly Income Acc 108 12 117 9 127 55 168 37 - - 1.93 4.32NatWest Equity Income NAV 105 44 112 39 131 28 167 44 217 7 - 4.14Neptune Income C Acc GBP 107 17 112 43 136 8 164 51 175 37 - 4.69Neptune Quarterly Income C Acc GBP 104 53 109 62 119 77 149 72 163 48 1.00 3.93Newton UK Income Inst W Acc 104 57 111 52 129 38 165 48 181 34 - 3.76NFU Mutual UK Equity Income C 104 50 109 60 130 33 159 61 - - - 4.18Old Mutual Artemis Income U2 GBP Acc 104 47 112 31 129 40 - - - - - 3.65Old Mutual Newton UK Income U2 GBP Acc 104 56 111 48 130 34 - - - - - 3.74Old Mutual UK Equity Income R GBP Acc 107 14 112 26 124 62 174 21 198 21 0.94 3.81Premier Income C Inc 106 24 112 38 133 14 180 12 210 11 0.88 4.56Premier Monthly Income C 106 20 112 30 133 18 178 15 211 10 0.95 4.45Premier Optimum Income C Inc 106 23 114 18 135 10 178 16 160 50 1.44 6.95Rathbone Blue Chip Income And Gr I Inc 95 86 105 80 122 69 159 60 182 32 0.90 3.79Rathbone Income I Inc 100 80 108 72 128 45 171 28 190 27 0.81 3.76RBS Equity Income 1 104 45 112 40 131 30 167 45 217 8 1.32 4.13River & Mercantile UK Equity Income B 106 22 113 23 132 23 172 25 - - 0.93 3.90Royal London UK Equity Income M 104 48 113 22 132 22 191 7 - - 0.68 3.85Santander Dividend Income RI 105 42 111 47 130 31 160 55 - - - 4.93Santander Enhanced Income II 106 30 113 19 130 36 155 65 - - 0.80 5.06Santander Equity Income II 105 39 111 44 133 15 167 42 190 28 0.68 5.41Schroder Income Fd Z Acc 107 16 109 61 128 47 179 14 234 4 0.91 3.20Schroder Income Maximiser Z Acc 105 34 108 68 122 67 158 63 199 19 0.91 7.04Schroder UK Alpha Income Z Inc 104 61 112 25 127 53 168 38 224 6 0.86 4.37Scot Wid MM UK Equity Income A Acc 103 66 108 67 126 60 160 57 167 45 1.81 4.15Scottish Widows UK Equity Income A Acc 106 25 111 46 127 56 152 70 140 54 1.36 3.98Slater Income P Inc 104 55 113 21 129 39 189 10 - - - 4.50SLI UK Equity High Inc Plat 1 Acc 110 3 114 17 127 57 168 39 174 40 - 3.74SLI UK Equity Income Uncons Plat 1 Acc 109 6 118 8 127 52 189 9 206 14 - 3.70Smith & Williamson UK Equity Inc B 103 65 107 76 123 65 165 47 176 36 - 4.09SVS Albion Olim UK Equity Acc 105 35 115 15 133 17 164 50 208 13 1.50 3.68TB Guinness UK Eq Inc Y Clean Income 103 64 109 63 - - - - - - - 1.88TB Saracen UK Income B Acc 109 5 126 2 - - - - - - - 5.80Threadneedle UK Eq Inc Z Inc GBP 99 81 107 75 128 50 176 20 215 9 - 4.02Threadneedle UK Equity Alpha Inc Z Inc 98 83 103 83 121 72 168 36 203 17 0.88 4.34Threadneedle UK Monthly Inc Z Inc 100 79 104 81 121 74 165 49 187 29 - 4.36Troy Trojan Income O Acc 101 73 106 77 130 35 171 26 231 5 1.05 3.66UBS UK Equity Income C Acc Net 106 21 112 37 144 3 177 19 169 44 - 3.23Unicorn UK Ethical Income B Inc 104 60 117 11 - - - - - - - 4.09Unicorn UK Income B Inc 107 13 121 4 139 6 193 6 353 1 0.89 3.71Vanguard FTSE U.K. Eq Inc Idx Acc 105 36 110 58 123 64 152 69 - - 0.25 4.56VT Odd Real Income GBP A Acc 100 78 103 84 - - - - - - - 3.36Average/Total 104 87 111 85 129 79 169 76 193 55 1.05 4.11
(IA) UK GILTSAberdeen Sterling LD Govt Bd I GBP Acc 103 4 103 4 122 2 143 2 209 2 - 2.35Allianz Gilt Yield C Inc 102 7 103 3 112 7 118 16 170 4 0.53 1.22Aviva Investors UK Gilts MoM 1 2 GBP Inc 101 18 101 24 109 24 116 23 138 18 0.78 0.90F&C Institutional Ret Annuity 3 £ Acc 103 5 103 5 121 4 143 1 - - - 1.76Franklin UK Gilt W Inc 101 24 - - - - - - - - - -HSBC Gilt & Fixed Interest C Acc 102 10 102 14 110 21 117 19 153 16 - 2.67HSBC UK Gilt Index C Acc 101 15 102 10 111 15 119 14 - - 0.17 2.60Invesco Gilt A GBP QD 101 20 101 19 111 17 120 11 161 10 0.90 0.89iShares Over 15 Yrs Gilts Idx (UK) D Acc 104 1 - - - - - - - - - -iShares UK Gilts All Stks Idx (UK) D Acc 102 12 102 8 112 8 121 7 - - 0.16 1.67Janus Henderson Instl Lg Datd Gilt I Acc 103 6 103 6 120 5 137 5 202 3 0.54 1.55Janus Henderson Instl UK Gilt I Acc 101 23 101 21 110 20 117 22 160 11 0.54 1.11L&G All Stocks Gilt Index Trust I Acc 101 19 102 11 111 12 120 10 163 7 - 1.43LF Canlife UK Government Bond C Inc 101 25 101 22 109 23 115 24 148 17 - 1.60M&G Gilt & Fixed Interest Inc GBP I Acc 101 22 101 16 112 10 120 9 166 6 0.66 0.61Newton Long Gilt Exempt 2 Acc 103 3 103 2 122 1 142 4 209 1 0.25 1.59Old Mutual Gilt A GBP Acc 101 17 101 20 110 22 117 21 156 13 0.69 2.76Royal London Short Dur Gilts M GBP Inc 100 28 100 26 102 26 - - - - - 0.36Royal London UK Government Bond M Acc 102 9 102 9 111 16 118 17 161 9 - 2.54Santander Sterling Government Bond IA 101 14 102 13 111 11 120 12 - - - 0.98Schroder Gilt & Fixed Interest Acc 101 16 102 15 111 18 118 18 154 15 0.56 2.45Scottish Widows Gilt G Acc 101 26 101 25 108 25 114 25 - - - 0.50Scottish Widows UK Fix-Int Trkr I Acc 101 21 101 18 111 13 120 13 162 8 0.37 1.44SLI UK Gilt Plat 1 Acc 101 27 101 23 110 19 117 20 159 12 - 0.51Threadneedle Sterling Bond Z Inc 101 13 101 17 111 14 119 15 155 14 - 1.07Threadneedle UK Fixed Interest Z Acc 102 11 102 12 112 9 120 8 169 5 - 0.73Vanguard UK Govt Bd Idx GBP Acc 102 8 102 7 112 6 123 6 - - 0.15 1.35Vanguard UK Lg Dur Gilt Idx A Grs Acc 103 2 103 1 121 3 143 3 - - 0.15 1.82Average/Total 102 28 102 26 112 26 123 25 166 18 0.46 1.48
FUND 6 MONTHS 1 YEAR 3 YEARS 5 YEARS 10 YEARS TER YIELD£ £ £ £ £ % %
(IA) UK INDEX-LINKED GILTSAXA Sterling Index Linked Bond Z Net 103 14 102 12 128 3 155 2 222 2 0.33 -Baillie Gifford Act Idx-Lk Glt Pls B Inc 103 3 101 14 127 6 149 11 - - 0.42 0.96F&C Institutional Active Index Lnkd3£Acc 103 10 102 10 127 5 155 3 - - - 0.04HSBC Index-Linked Gilt index Acc C 103 9 102 5 - - - - - - - 1.85iShares Index Lkd Gilt Idx (UK) D Acc 103 5 103 3 129 2 157 1 - - 0.29 0.36Janus Henderson Index-Linked Bond I Acc 103 7 102 11 127 4 152 5 224 1 0.54 -L&G All Stocks IdxLnk Gilt Idx Tr I Acc 103 13 102 8 125 10 149 9 212 6 - -M&G Index-Linked Bond GBP I Acc 103 11 102 13 126 8 150 7 219 4 0.56 -Newton Index Linked Gilt Exempt 2 Acc 103 2 103 2 129 1 154 4 220 3 0.25 2.12Royal London Index Linked M Acc 103 4 103 1 126 9 150 8 218 5 - 0.30Schroder All Mats Idx Lnkd Bd I Acc 103 8 102 6 125 12 149 12 207 8 0.28 0.36Scottish Widows UK Idx Lnkd Trkr I Acc 104 1 102 4 125 11 149 10 211 7 0.37 0.24Threadneedle UK Index Lnkd Ins Acc 103 6 102 7 125 13 148 13 205 9 - 0.34Vanguard UK Infl-LnkdGltIdx A Grs Acc 103 12 102 9 126 7 151 6 - - 0.15 -Average/Total 103 14 102 14 127 13 151 13 215 9 0.35 0.73
(IA) UK SMALLER COMPANIESAberdeen UK Smaller Companies Eq I Acc 113 16 128 24 154 32 197 37 269 29 - 1.40Aberforth UK Small Companies Acc 107 40 122 40 142 41 211 31 267 30 0.86 2.36Artemis UK Smaller Companies I Acc 113 12 130 17 175 11 220 26 241 34 0.84 1.41Aviva Investors UK Smaller Coms 2 £ Acc 112 26 124 36 142 40 196 39 311 21 1.13 0.89AXA Framlington UK Smlr Coms Z GBP Acc 113 13 132 10 171 17 263 5 322 17 0.88 0.89Baillie Gifford British Smlr Coms B Acc 105 43 114 46 135 44 188 44 317 20 0.69 0.72BlackRock UK Smaller Companies D Acc 113 15 133 9 171 16 226 24 332 15 0.92 0.87Castlefield UK Smaller Coms Instl Inc 115 4 131 15 168 19 206 33 245 33 2.77 -Cavendish AIM B 116 3 133 8 187 4 257 8 283 26 0.89 0.24Dimensional UK Smlr Coms Acc 109 38 118 44 140 43 196 38 279 27 0.66 2.08F&C UK Smaller Companies 2 113 19 129 19 164 21 231 22 343 14 0.85 1.09Fidelity UK Smaller Companies W Acc 107 42 122 39 154 31 236 19 - - - 1.30FP Octopus UK Micro Cap Growth P Acc 112 23 135 6 157 26 199 36 227 38 - -Franklin UK Smaller Companies W Acc 112 25 128 21 161 23 243 15 208 39 0.83 1.03Halifax Smaller Coms C 114 10 128 22 151 33 193 42 235 37 1.51 0.78Investec UK Smaller Companies I Inc Net 113 14 131 13 145 38 211 32 389 7 0.85 1.55IP UK Smaller Companies Eq Z Acc 112 21 127 25 172 14 238 18 305 22 - 0.86Janus Henderson UK Smaller Coms I Acc 112 22 128 23 161 22 228 23 346 13 0.82 1.37Janus Henderson UK&Irish Smr Coms I Acc 108 39 121 42 134 45 180 45 208 40 - 1.09JPM UK Smaller Companies C Acc 113 18 125 32 149 36 199 35 237 36 0.93 -Jupiter UK Smaller Companies Fd I 121 1 141 2 199 2 258 7 301 23 - 0.40Kames UK Smaller Companies B Acc 114 8 130 16 156 27 215 30 320 18 1.10 1.46L&G UK Smaller Companies Trust I Acc 111 28 122 38 140 42 194 41 298 24 - 1.26Lazard UK Smaller Companies C Inc 111 29 121 43 144 39 196 40 255 32 - 1.73LF Livingbridge UK Micro Cap C Acc 111 30 127 26 158 25 269 3 - - - 0.42LF Miton UK Smaller Companies B Acc 111 31 121 41 146 37 232 21 - - - 0.63Liontrust UK Micro Cap I GBP Acc 107 41 122 37 - - - - - - - -Liontrust UK Smaller Companies I Inc 110 34 127 27 178 8 243 14 433 4 - 0.12M&G Smaller Companies GBP I Acc 109 36 128 20 156 28 200 34 269 28 0.91 1.40Marlborough Nano Cap Growth P Acc 112 24 131 12 156 29 - - - - - 0.33Marlborough Special Situations P Acc 110 32 127 28 169 18 244 13 384 8 - 0.94Marlborough UK Micro Cap Growth P Acc 113 17 133 7 175 12 253 10 442 2 - 0.67MFM Techinvest Special Situations A Acc 103 46 118 45 181 7 247 11 198 41 1.84 -MI Discretionary Unit Inc 103 47 124 35 173 13 239 17 263 31 0.42 0.64MI Downing UK Micro-Cap Growth B 102 48 111 47 134 46 215 29 - - 2.04 0.25Old Mutual UK Smaller Coms R GBP Acc 115 5 138 3 187 5 260 6 377 9 1.05 0.58Old Mutual UK Smlr Coms Foc R GBP Inc 114 7 151 1 229 1 328 1 492 1 1.56 0.02River & Mercantile UK Eq Sm Cos B Acc 114 6 129 18 165 20 279 2 441 3 0.95 0.93Royal London UK Smaller Companies M 110 33 125 33 150 35 216 28 288 25 - 1.02Schroder Instl UK Smaller Cos I Acc 111 27 131 14 176 10 240 16 370 10 0.52 1.18Schroder UK Dynamic Smaller Coms Z Acc 105 45 126 31 160 24 218 27 412 5 0.86 0.72Schroder UK Smaller Companies Z Acc 109 37 126 30 172 15 245 12 320 19 0.91 0.89Scottish Widows UK Smlr Coms A 112 20 127 29 150 34 189 43 237 35 1.61 0.93SF Webb Capital Smlr Coms Gr B Acc 105 44 102 48 80 47 - - - - - -SLI UK Smaller Companies Pltfrm 1 Acc 114 9 131 11 176 9 224 25 355 11 - 0.77TB Amati UK Smaller Companies B 120 2 136 5 194 3 265 4 405 6 1.39 0.69Threadneedle UK Smaller Coms Z Inc 114 11 137 4 183 6 255 9 354 12 - 0.68Unicorn UK Smaller Companies A 109 35 125 34 154 30 235 20 328 16 1.86 1.11Average/Total 111 48 127 48 161 47 228 45 315 41 1.12 0.95
(IA) UNCLASSIFIED SECTORAberdeen Diversified-Core Advnts I Acc 108 7 117 8 - - - - - - - 1.53Aberdeen Diversified-Core Cau I Acc 102 245 106 201 - - - - - - - 0.67Aberdeen Diversified-Core Cnsrv I Acc 101 285 101 279 - - - - - - - 0.83Aberdeen Diversified-Core Gr I Acc 105 82 111 90 - - - - - - - 1.93Aberdeen Sterling Bond I GBP Acc 102 256 102 270 110 243 120 210 158 78 - 1.70Aberdeen Sterling Govt Bd I GBP Acc 101 272 101 280 110 247 116 224 163 69 - 0.69Aberdeen Sterling Idx-Lnkd Bd I GBP Acc 103 161 102 265 126 109 149 92 209 17 - 0.91Aberdeen Sterling Shrt Term Gov Bd I Acc 100 296 99 289 101 264 101 237 124 116 - 0.02Architas Diversified Real Assets D Acc 100 288 102 274 114 212 - - - - - 2.90Architas MA Active Reserve A Acc 100 297 102 275 111 237 124 200 148 95 1.22 2.86Architas MA Passive Prudent A Acc 102 215 104 246 119 173 134 166 - - 0.65 1.11Architas MM Divers Prot 85 R Net Acc 102 249 103 259 104 259 109 233 - - 0.02 -Architas MM Diversified Protector 70 103 163 106 203 114 208 129 178 - - 2.39 -Architas MM Diversified Protector 80 103 202 104 243 109 251 117 221 - - 2.20 -Artemis Instl Equity Income IN Acc 104 100 112 46 129 78 169 22 212 13 0.78 3.55Aviva Investors UK Credit MoM 1 2 £ Inc 102 210 104 242 113 223 125 191 138 109 - 2.69Baillie Gifford Active Gilt Plus B Inc 101 275 101 283 111 238 116 223 161 73 0.42 1.15Baillie Gifford Active Lng Glt Pls B Inc 102 229 102 272 122 149 136 158 205 20 0.43 1.75Baring Dynamic Capital Growth I GBP Inc 103 181 108 147 118 183 137 155 147 97 - 2.44Baring Targeted Return A GBP Inc 103 148 110 105 119 165 136 159 151 91 0.90 3.38BlackRock Growth and Recovery A Acc 113 2 132 1 171 2 229 1 273 1 1.03 0.91Carmignac Pf Sécurité F GBP Acc Hdg 100 290 101 281 106 257 112 231 - - 0.75 -Carmignac Sécurité A EUR Acc 101 278 104 241 118 177 118 219 161 70 1.03 -Carvetian Capital Hendom Income 104 102 112 65 129 82 152 81 194 33 1.54 1.25Cazenove Caversham Inc 103 146 109 128 131 57 160 54 198 28 1.01 1.14CF Aquarius 104 122 109 124 129 85 155 75 160 74 1.40 1.01CF Arbor 106 47 110 99 128 96 155 72 147 98 1.56 0.28CF Benton Investment 105 53 112 52 132 55 155 71 188 42 1.49 1.46CF Broden 105 51 112 56 130 66 158 60 188 41 1.29 0.80
FUND 6 MONTHS 1 YEAR 3 YEARS 5 YEARS 10 YEARS TER YIELD FUND 6 MONTHS 1 YEAR 3 YEARS 5 YEARS 10 YEARS TER YIELD £ £ £ £ £ % % £ £ £ £ £ % %
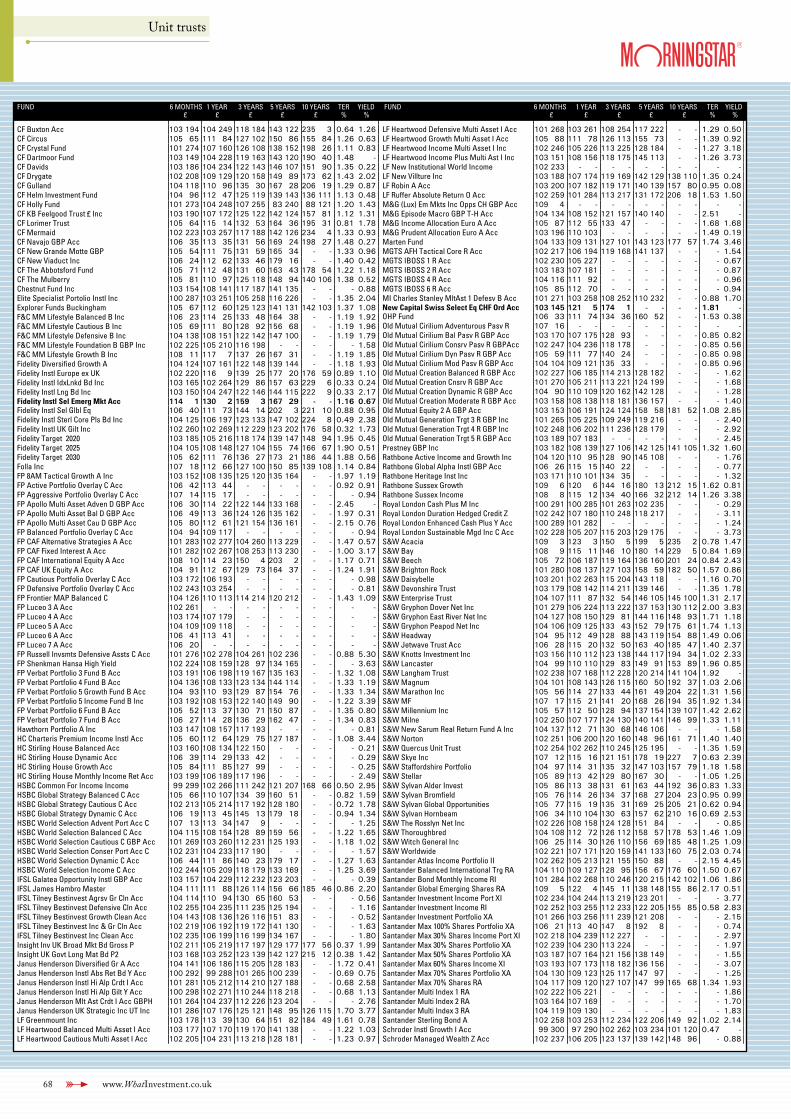
68 www.WhatInvestment.co.uk
Unit trusts
FUND 6 MONTHS 1 YEAR 3 YEARS 5 YEARS 10 YEARS TER YIELD£ £ £ £ £ % %
CF Buxton Acc 103 194 104 249 118 184 143 122 235 3 0.64 1.26CF Circus 105 65 111 84 127 102 150 86 155 84 1.26 0.63CF Crystal Fund 101 274 107 160 126 108 138 152 198 26 1.11 0.83CF Dartmoor Fund 103 149 104 228 119 163 143 120 190 40 1.48 -CF Davids 103 186 104 234 122 143 146 107 151 90 1.35 0.22CF Drygate 102 208 109 129 120 158 149 89 173 62 1.43 2.02CF Gulland 104 118 110 96 135 30 167 28 206 19 1.29 0.87CF Helm Investment Fund 104 96 112 47 125 119 139 143 136 111 1.13 0.48CF Holly Fund 101 273 104 248 107 255 83 240 88 121 1.20 1.43CF KB Feelgood Trust £ Inc 103 190 107 172 125 122 142 124 157 81 1.12 1.31CF Lorimer Trust 105 64 115 14 132 53 164 36 195 31 0.81 1.78CF Mermaid 102 223 103 257 117 188 142 126 234 4 1.33 0.93CF Navajo GBP Acc 106 35 113 35 131 56 169 24 198 27 1.48 0.27CF New Grande Motte GBP 105 54 111 75 131 59 165 34 - - 1.33 0.96CF New Viaduct Inc 106 24 112 62 133 46 179 16 - - 1.40 0.42CF The Abbotsford Fund 105 71 112 48 131 60 163 43 178 54 1.22 1.18CF The Mulberry 105 81 110 97 125 118 148 94 140 106 1.38 0.52Chestnut Fund Inc 103 154 108 141 117 187 141 135 - - - 0.88Elite Specialist Portolio Instl Inc 100 287 103 251 105 258 116 226 - - 1.35 2.04Explorer Funds Buckingham 105 67 112 60 125 123 141 131 142 103 1.37 1.08F&C MM Lifestyle Balanced B Inc 106 23 114 25 133 48 164 38 - - 1.19 1.92F&C MM Lifestyle Cautious B Inc 105 69 111 80 128 92 156 68 - - 1.19 1.96F&C MM Lifestyle Defensive B Inc 104 138 108 151 122 142 147 100 - - 1.19 1.79F&C MM Lifestyle Foundation B GBP Inc 102 225 105 210 116 198 - - - - - 1.58F&C MM Lifestyle Growth B Inc 108 11 117 7 137 26 167 31 - - 1.19 1.85Fidelity Diversified Growth A 104 124 107 161 122 148 139 144 - - 1.18 1.93Fidelity Instl Europe ex UK 102 220 116 9 139 25 177 20 176 59 0.89 1.10Fidelity Instl IdxLnkd Bd Inc 103 165 102 264 129 86 157 63 229 6 0.33 0.24Fidelity Instl Lng Bd Inc 103 150 104 247 122 146 144 115 222 9 0.33 2.17Fidelity Instl Sel Emerg Mkt Acc 114 1 130 2 159 3 167 29 - - 1.16 0.67Fidelity Instl Sel Glbl Eq 106 40 111 73 144 14 202 3 221 10 0.88 0.95Fidelity Instl Sterl Core Pls Bd Inc 104 125 106 197 123 133 147 102 224 8 0.49 2.38Fidelity Instl UK Gilt Inc 102 260 102 269 112 229 123 202 176 58 0.32 1.73Fidelity Target 2020 103 185 105 216 118 174 139 147 148 94 1.95 0.45Fidelity Target 2025 104 105 108 148 127 104 155 74 166 67 1.90 0.51Fidelity Target 2030 105 62 111 76 136 27 173 21 186 44 1.88 0.56Folla Inc 107 18 112 66 127 100 150 85 139 108 1.14 0.84FP 8AM Tactical Growth A Inc 103 152 108 135 125 120 135 164 - - 1.97 1.19FP Active Portfolio Overlay C Acc 106 42 113 44 - - - - - - 0.92 0.91FP Aggressive Portfolio Overlay C Acc 107 14 115 17 - - - - - - - 0.94FP Apollo Multi Asset Adven D GBP Acc 106 30 114 22 122 144 133 168 - - 2.45 -FP Apollo Multi Asset Bal D GBP Acc 106 49 113 36 124 126 135 162 - - 1.97 0.31FP Apollo Multi Asset Cau D GBP Acc 105 80 112 61 121 154 136 161 - - 2.15 0.76FP Balanced Portfolio Overlay C Acc 104 94 109 117 - - - - - - - 0.94FP CAF Alternative Strategies A Acc 101 283 102 277 104 260 113 229 - - 1.47 0.57FP CAF Fixed Interest A Acc 101 282 102 267 108 253 113 230 - - 1.00 3.17FP CAF International Equity A Acc 108 10 114 23 150 4 203 2 - - 1.17 0.71FP CAF UK Equity A Acc 104 91 112 67 129 73 164 37 - - 1.24 1.91FP Cautious Portfolio Overlay C Acc 103 172 106 193 - - - - - - - 0.98FP Defensive Portfolio Overlay C Acc 102 243 103 254 - - - - - - - 0.81FP Frontier MAP Balanced C 104 126 110 113 114 214 120 212 - - 1.43 1.09FP Luceo 3 A Acc 102 261 - - - - - - - - - -FP Luceo 4 A Acc 103 174 107 179 - - - - - - - -FP Luceo 5 A Acc 104 109 109 118 - - - - - - - -FP Luceo 6 A Acc 106 41 113 41 - - - - - - - -FP Luceo 7 A Acc 106 20 - - - - - - - - - -FP Russell Invsmts Defensive Assts C Acc 101 276 102 278 104 261 102 236 - - 0.88 5.30FP Shenkman Hansa High Yield 102 224 108 159 128 97 134 165 - - - 3.63FP Verbat Portfolio 3 Fund B Acc 103 191 106 198 119 167 135 163 - - 1.32 1.08FP Verbat Portfolio 4 Fund B Acc 104 136 108 133 123 134 144 114 - - 1.33 1.19FP Verbat Portfolio 5 Growth Fund B Acc 104 93 110 93 129 87 154 76 - - 1.33 1.34FP Verbat Portfolio 5 Income Fund B Inc 103 192 108 153 122 140 149 90 - - 1.22 3.39FP Verbat Portfolio 6 Fund B Acc 105 52 113 37 130 71 150 87 - - 1.35 0.80FP Verbat Portfolio 7 Fund B Acc 106 27 114 28 136 29 162 47 - - 1.34 0.83Hawthorn Portfolio A Inc 103 147 108 157 117 193 - - - - - 0.81HC Charteris Premium Income Instl Acc 105 60 112 64 129 75 127 187 - - 1.08 3.44HC Stirling House Balanced Acc 103 160 108 134 122 150 - - - - - 0.21HC Stirling House Dynamic Acc 106 39 114 29 133 42 - - - - - 0.29HC Stirling House Growth Acc 105 84 111 85 127 99 - - - - - 0.25HC Stirling House Monthly Income Ret Acc 103 199 106 189 117 196 - - - - - 2.49HSBC Common For Income Income 99 299 102 266 111 242 121 207 168 66 0.50 2.95HSBC Global Strategy Balanced C Acc 105 66 110 107 134 39 160 51 - - 0.82 1.59HSBC Global Strategy Cautious C Acc 102 213 105 214 117 192 128 180 - - 0.72 1.78HSBC Global Strategy Dynamic C Acc 106 19 113 45 145 13 179 18 - - 0.94 1.34HSBC World Selection Advent Port Acc C 107 13 113 34 147 9 - - - - - 1.25HSBC World Selection Balanced C Acc 104 115 108 154 128 89 159 56 - - 1.22 1.65HSBC World Selection Cautious C GBP Acc 101 269 103 260 112 231 125 193 - - 1.18 1.02HSBC World Selection Conser Port Acc C 102 231 104 233 117 190 - - - - - 1.57HSBC World Selection Dynamic C Acc 106 44 111 86 140 23 179 17 - - 1.27 1.63HSBC World Selection Income C Acc 102 244 105 209 118 179 133 169 - - 1.25 3.69IFSL Galatea Opportunity Instl GBP Acc 103 157 104 229 112 232 123 203 - - - 0.39IFSL James Hambro Master 104 111 111 88 126 114 156 66 185 46 0.86 2.20IFSL Tilney Bestinvest Agrsv Gr Cln Acc 104 114 110 94 130 65 160 53 - - - 0.56IFSL Tilney Bestinvest Defensive Cln Acc 102 255 104 235 111 235 125 194 - - - 1.16IFSL Tilney Bestinvest Growth Clean Acc 104 143 108 136 126 116 151 83 - - - 0.52IFSL Tilney Bestinvest Inc & Gr Cln Acc 102 219 106 192 119 172 141 130 - - - 1.63IFSL Tilney Bestinvest Inc Clean Acc 102 235 106 199 116 199 134 167 - - - 1.80Insight Inv UK Broad Mkt Bd Gross P 102 211 105 219 117 197 129 177 177 56 0.37 1.99Insight UK Govt Long Mat Bd P2 103 168 103 252 123 139 142 127 215 12 0.38 1.42Janus Henderson Diversified Gr A Acc 104 141 106 186 115 205 128 183 - - 1.72 0.41Janus Henderson Instl Abs Ret Bd Y Acc 100 292 99 288 101 265 100 239 - - 0.69 0.75Janus Henderson Instl Hi Alp Crdt I Acc 101 281 105 212 114 210 127 188 - - 0.68 2.58Janus Henderson Instl Hi Alp Gilt Y Acc 100 298 102 271 110 244 118 218 - - 0.68 1.13Janus Henderson Mlt Ast Crdt I Acc GBPH 101 264 104 237 112 226 123 204 - - - 2.76Janus Henderson UK Strategic Inc UT Inc 101 286 107 176 125 121 148 95 126 115 1.70 3.77LF Greenmount Inc 103 178 113 39 130 64 151 82 184 49 1.61 0.78LF Heartwood Balanced Multi Asset I Acc 103 177 107 170 119 170 141 138 - - 1.22 1.03LF Heartwood Cautious Multi Asset I Acc 102 205 104 231 113 218 128 181 - - 1.23 0.97
FUND 6 MONTHS 1 YEAR 3 YEARS 5 YEARS 10 YEARS TER YIELD£ £ £ £ £ % %
LF Heartwood Defensive Multi Asset I Acc 101 268 103 261 108 254 117 222 - - 1.29 0.50LF Heartwood Growth Multi Asset I Acc 105 88 111 78 126 113 155 73 - - 1.39 0.92LF Heartwood Income Multi Asset I Inc 102 246 105 226 113 225 128 184 - - 1.27 3.18LF Heartwood Income Plus Multi Ast I Inc 103 151 108 156 118 175 145 113 - - 1.26 3.73LF New Institutional World Income 102 233 - - - - - - - - - -LF New Villture Inc 103 188 107 174 119 169 142 129 138 110 1.35 0.24LF Robin A Acc 103 200 107 182 119 171 140 139 157 80 0.95 0.08LF Ruffer Absolute Return O Acc 102 259 101 284 113 217 131 172 206 18 1.53 1.50M&G (Lux) Em Mkts Inc Opps CH GBP Acc 109 4 - - - - - - - - - -M&G Episode Macro GBP T-H Acc 104 134 108 152 121 157 140 140 - - 2.51 -M&G Income Allocation Euro A Acc 105 87 112 55 133 47 - - - - 1.68 1.68M&G Prudent Allocation Euro A Acc 103 196 110 103 - - - - - - 1.49 0.19Marten Fund 104 133 109 131 127 101 143 123 177 57 1.74 3.46MGTS AFH Tactical Core R Acc 102 217 106 194 119 168 141 137 - - - 1.54MGTS IBOSS 1 R Acc 102 230 105 227 - - - - - - - 0.67MGTS IBOSS 2 R Acc 103 183 107 181 - - - - - - - 0.87MGTS IBOSS 4 R Acc 104 116 111 92 - - - - - - - 0.96MGTS IBOSS 6 R Acc 105 85 112 70 - - - - - - - 0.94MI Charles Stanley MltAst 1 Defesv B Acc 101 271 103 258 108 252 110 232 - - 0.88 1.70New Capital Swiss Select Eq CHF Ord Acc 103 145 121 5 174 1 - - - - 1.81 -OHP Fund 106 33 111 74 134 36 160 52 - - 1.53 0.38Old Mutual Cirilium Adventurous Pasv R 107 16 - - - - - - - - - -Old Mutual Cirilium Bal Pasv R GBP Acc 103 170 107 175 128 93 - - - - 0.85 0.82Old Mutual Cirilium Consrv Pasv R GBPAcc 102 247 104 236 118 178 - - - - 0.85 0.56Old Mutual Cirilium Dyn Pasv R GBP Acc 105 59 111 77 140 24 - - - - 0.85 0.98Old Mutual Cirilium Mod Pasv R GBP Acc 104 104 109 121 135 33 - - - - 0.85 0.96Old Mutual Creation Balanced R GBP Acc 102 227 106 185 114 213 128 182 - - - 1.62Old Mutual Creation Cnsrv R GBP Acc 101 270 105 211 113 221 124 199 - - - 1.68Old Mutual Creation Dynamic R GBP Acc 104 90 110 109 120 162 142 128 - - - 1.28Old Mutual Creation Moderate R GBP Acc 103 158 108 138 118 181 136 157 - - - 1.40Old Mutual Equity 2 A GBP Acc 103 153 106 191 124 124 158 58 181 52 1.08 2.85Old Mutual Generation Trgt 3 R GBP Inc 101 265 105 225 109 249 119 216 - - - 2.40Old Mutual Generation Trgt 4 R GBP Inc 102 248 106 202 111 236 128 179 - - - 2.92Old Mutual Generation Trgt 5 R GBP Acc 103 189 107 183 - - - - - - - 2.45Prestney GBP Inc 103 182 108 139 127 106 142 125 141 105 1.32 1.60Rathbone Active Income and Growth Inc 104 120 110 95 128 90 145 108 - - - 1.76Rathbone Global Alpha Instl GBP Acc 106 26 115 15 140 22 - - - - - 0.77Rathbone Heritage Inst Inc 103 171 110 101 134 35 - - - - - 1.32Rathbone Sussex Growth 109 6 120 6 144 16 180 13 212 15 1.62 0.81Rathbone Sussex Income 108 8 115 12 134 40 166 32 212 14 1.26 3.38Royal London Cash Plus M Inc 100 291 100 285 101 263 102 235 - - - 0.29Royal London Duration Hedged Credit Z 102 242 107 180 110 248 118 217 - - - 3.11Royal London Enhanced Cash Plus Y Acc 100 289 101 282 - - - - - - - 1.24Royal London Sustainable Mgd Inc C Acc 102 228 105 207 115 203 129 175 - - - 3.73S&W Acacia 109 3 123 3 150 5 199 5 235 2 0.78 1.47S&W Bay 108 9 115 11 146 10 180 14 229 5 0.84 1.69S&W Beech 105 72 106 187 119 164 136 160 201 24 0.84 2.43S&W Brighton Rock 101 280 108 137 127 103 158 59 182 50 1.57 0.86S&W Daisybelle 103 201 102 263 115 204 143 118 - - 1.16 0.70S&W Devonshire Trust 103 179 108 142 114 211 139 146 - - 1.35 1.78S&W Enterprise Trust 104 107 111 87 132 54 146 105 145 100 1.31 2.17S&W Gryphon Dover Net Inc 101 279 105 224 113 222 137 153 130 112 2.00 3.83S&W Gryphon East River Net Inc 104 127 108 150 129 81 144 116 148 93 1.71 1.18S&W Gryphon Peapod Net Inc 104 106 109 125 133 43 152 79 175 61 1.74 1.13S&W Headway 104 95 112 49 128 88 143 119 154 88 1.49 0.06S&W Jetwave Trust Acc 106 28 115 20 132 50 163 40 185 47 1.40 2.37S&W Knotts Investment Inc 103 156 110 112 123 138 144 117 194 34 1.02 2.33S&W Lancaster 104 99 110 110 129 83 149 91 153 89 1.96 0.85S&W Langham Trust 102 238 107 168 112 228 120 214 141 104 1.92 -S&W Magnum 104 101 108 143 126 115 160 50 192 37 1.03 2.06S&W Marathon Inc 105 56 114 27 133 44 161 49 204 22 1.31 1.56S&W MF 107 17 115 21 141 20 168 26 194 35 1.92 1.34S&W Millennium Inc 105 57 112 50 128 94 137 154 139 107 1.42 2.62S&W Milne 102 250 107 177 124 130 140 141 146 99 1.33 1.11S&W New Sarum Real Return Fund A Inc 104 137 112 71 130 68 146 106 - - - 1.58S&W Norton 102 251 106 200 120 160 148 96 161 71 1.40 1.40S&W Quercus Unit Trust 102 254 102 262 110 245 125 195 - - 1.35 1.59S&W Skye Inc 107 12 115 16 121 151 178 19 227 7 0.63 2.39S&W Staffordshire Portfolio 104 97 114 31 135 32 147 103 157 79 1.18 1.58S&W Stellar 105 89 113 42 129 80 167 30 - - 1.05 1.25S&W Sylvan Alder Invest 105 86 113 38 131 61 163 44 192 36 0.83 1.33S&W Sylvan Bromfield 105 76 114 26 134 37 168 27 204 23 0.95 0.99S&W Sylvan Global Opportunities 105 77 115 19 135 31 169 25 205 21 0.62 0.94S&W Sylvan Hornbeam 106 34 110 104 130 63 157 62 210 16 0.69 2.53S&W The Rosslyn Net Inc 102 226 108 158 124 128 151 84 - - - 0.85S&W Thoroughbred 104 108 112 72 126 112 158 57 178 53 1.46 1.09S&W Witch General Inc 106 25 114 30 126 110 156 69 185 48 1.25 1.09S&W Worldwide 102 221 107 171 120 159 141 133 160 75 2.03 0.74Santander Atlas Income Portfolio II 102 262 105 213 121 155 150 88 - - 2.15 4.45Santander Balanced International Trg RA 104 110 109 127 128 95 156 67 176 60 1.50 0.67Santander Bond Monthly Income RI 101 284 102 268 110 246 120 215 142 102 1.06 1.86Santander Global Emerging Shares RA 109 5 122 4 145 11 138 148 155 86 2.17 0.51Santander Investment Income Port XI 102 234 104 244 113 219 123 201 - - - 3.77Santander Investment Income RI 102 252 103 255 112 233 122 205 155 85 0.58 2.83Santander Investment Portfolio XA 101 266 103 256 111 239 121 208 - - - 2.15Santander Max 100% Shares Portfolio XA 106 21 113 40 147 8 192 8 - - - 0.74Santander Max 30% Shares Income Port XI 102 218 104 239 112 227 - - - - - 2.97Santander Max 30% Shares Portfolio XA 102 239 104 230 113 224 - - - - - 1.97Santander Max 50% Shares Portfolio XA 103 187 107 164 121 156 138 149 - - - 1.55Santander Max 60% Shares Income XI 103 193 107 173 118 182 136 156 - - - 3.07Santander Max 70% Shares Portfolio XA 104 130 109 123 125 117 147 97 - - - 1.25Santander Max 70% Shares RA 104 117 109 120 127 107 147 99 165 68 1.34 1.93Santander Multi Index 1 RA 102 222 105 221 - - - - - - - 1.86Santander Multi Index 2 RA 103 164 107 169 - - - - - - - 1.70Santander Multi Index 3 RA 104 119 109 130 - - - - - - - 1.83Santander Sterling Bond A 102 258 103 253 112 234 122 206 149 92 1.02 2.14Schroder Instl Growth I Acc 99 300 97 290 102 262 103 234 101 120 0.47 -Schroder Managed Wealth Z Acc 102 237 106 205 123 137 139 142 148 96 - 0.88
FUND 6 MONTHS 1 YEAR 3 YEARS 5 YEARS 10 YEARS TER YIELD FUND 6 MONTHS 1 YEAR 3 YEARS 5 YEARS 10 YEARS TER YIELD £ £ £ £ £ % % £ £ £ £ £ % %
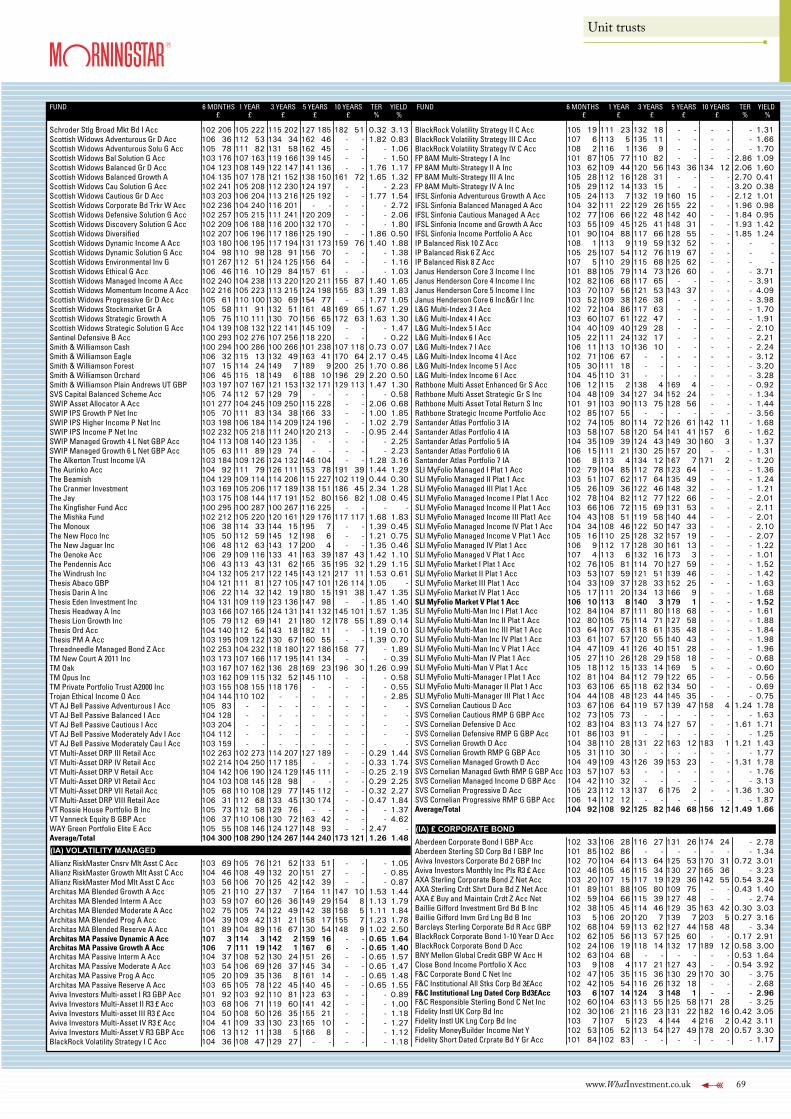
www.WhatInvestment.co.uk 69
Unit trusts
FUND 6 MONTHS 1 YEAR 3 YEARS 5 YEARS 10 YEARS TER YIELD£ £ £ £ £ % %
Schroder Stlg Broad Mkt Bd I Acc 102 206 105 222 115 202 127 185 182 51 0.32 3.13Scottish Widows Adventurous Gr D Acc 106 36 112 53 134 34 162 46 - - 1.82 0.83Scottish Widows Adventurous Solu G Acc 105 78 111 82 131 58 162 45 - - - 1.06Scottish Widows Bal Solution G Acc 103 176 107 163 119 166 139 145 - - - 1.50Scottish Widows Balanced Gr D Acc 104 123 108 149 122 147 141 136 - - 1.76 1.17Scottish Widows Balanced Growth A 104 135 107 178 121 152 138 150 161 72 1.65 1.32Scottish Widows Cau Solution G Acc 102 241 105 208 112 230 124 197 - - - 2.23Scottish Widows Cautious Gr D Acc 103 203 106 204 113 216 125 192 - - 1.77 1.54Scottish Widows Corporate Bd Trkr W Acc 102 236 104 240 116 201 - - - - - 2.72Scottish Widows Defensive Solution G Acc 102 257 105 215 111 241 120 209 - - - 2.06Scottish Widows Discovery Solution G Acc 102 209 106 188 116 200 132 170 - - - 1.80Scottish Widows Diversified 102 207 106 196 117 186 125 190 - - 1.86 0.50Scottish Widows Dynamic Income A Acc 103 180 106 195 117 194 131 173 159 76 1.40 1.88Scottish Widows Dynamic Solution G Acc 104 98 110 98 128 91 156 70 - - - 1.38Scottish Widows Environmental Inv G 101 267 112 51 124 125 156 64 - - - 1.16Scottish Widows Ethical G Acc 106 46 116 10 129 84 157 61 - - - 1.03Scottish Widows Managed Income A Acc 102 240 104 238 113 220 120 211 155 87 1.40 1.65Scottish Widows Momentum Income A Acc 102 216 105 223 113 215 124 198 155 83 1.39 1.83Scottish Widows Progressive Gr D Acc 105 61 110 100 130 69 154 77 - - 1.77 1.05Scottish Widows Stockmarket Gr A 105 58 111 91 132 51 161 48 169 65 1.67 1.29Scottish Widows Strategic Growth A 105 75 110 111 130 70 156 65 172 63 1.63 1.30Scottish Widows Strategic Solution G Acc 104 139 108 132 122 141 145 109 - - - 1.47Sentinel Defensive B Acc 100 293 102 276 107 256 118 220 - - - 0.22Smith & Williamson Cash 100 294 100 286 100 266 101 238 107 118 0.73 0.07Smith & Williamson Eagle 106 32 115 13 132 49 163 41 170 64 2.17 0.45Smith & Williamson Forest 107 15 114 24 149 7 189 9 200 25 1.70 0.86Smith & Williamson Orchard 106 45 115 18 149 6 188 10 196 29 2.20 0.50Smith & Williamson Plain Andrews UT GBP 103 197 107 167 121 153 132 171 129 113 1.47 1.30SVS Capital Balanced Scheme Acc 105 74 112 57 129 79 - - - - - 0.58SWIP Asset Allocator A Acc 101 277 104 245 109 250 115 228 - - 2.06 0.68SWIP IPS Growth P Net Inc 105 70 111 83 134 38 166 33 - - 1.00 1.85SWIP IPS Higher Income P Net Inc 103 198 106 184 114 209 124 196 - - 1.02 2.79SWIP IPS Income P Net Inc 102 232 105 218 111 240 120 213 - - 0.95 2.44SWIP Managed Growth 4 L Net GBP Acc 104 113 108 140 123 135 - - - - - 2.25SWIP Managed Growth 6 L Net GBP Acc 105 63 111 89 129 74 - - - - - 2.23The Alkerton Trust Income I/A 103 184 109 126 124 132 146 104 - - 1.28 3.16The Aurinko Acc 104 92 111 79 126 111 153 78 191 39 1.44 1.29The Beamish 104 129 109 114 114 206 115 227 102 119 0.44 0.30The Cranmer Investment 103 169 105 206 117 189 138 151 186 45 2.34 1.28The Jay 103 175 108 144 117 191 152 80 156 82 1.08 0.45The Kingfisher Fund Acc 100 295 100 287 100 267 116 225 - - - -The Mishka Fund 102 212 105 220 120 161 129 176 117 117 1.68 1.83The Monoux 106 38 114 33 144 15 195 7 - - 1.39 0.45The New Floco Inc 105 50 112 59 145 12 198 6 - - 1.21 0.75The New Jaguar Inc 106 48 112 63 143 17 200 4 - - 1.35 0.46The Oenoke Acc 106 29 109 116 133 41 163 39 187 43 1.42 1.10The Pendennis Acc 106 43 113 43 131 62 165 35 195 32 1.29 1.15The Windrush Inc 104 132 105 217 122 145 143 121 217 11 1.53 0.61Thesis Abaco GBP 104 121 111 81 127 105 147 101 126 114 1.05 -Thesis Darin A Inc 106 22 114 32 142 19 180 15 191 38 1.47 1.35Thesis Eden Investment Inc 104 131 109 119 123 136 147 98 - - 1.85 1.40Thesis Headway A Inc 103 166 107 165 124 131 141 132 145 101 1.57 1.35Thesis Lion Growth Inc 105 79 112 69 141 21 180 12 178 55 1.89 0.14Thesis Ord Acc 104 140 112 54 143 18 182 11 - - 1.19 0.10Thesis PM A Acc 103 195 109 122 130 67 160 55 - - 1.39 0.70Threadneedle Managed Bond Z Acc 102 253 104 232 118 180 127 186 158 77 - 1.89TM New Court A 2011 Inc 103 173 107 166 117 195 141 134 - - - 0.39TM Oak 103 167 107 162 136 28 169 23 196 30 1.26 0.99TM Opus Inc 103 162 109 115 132 52 145 110 - - - 0.58TM Private Portfolio Trust A2000 Inc 103 155 108 155 118 176 - - - - - 0.55Trojan Ethical Income O Acc 104 144 110 102 - - - - - - - 2.85VT AJ Bell Passive Adventurous I Acc 105 83 - - - - - - - - - -VT AJ Bell Passive Balanced I Acc 104 128 - - - - - - - - - -VT AJ Bell Passive Cautious I Acc 103 204 - - - - - - - - - -VT AJ Bell Passive Moderately Adv I Acc 104 112 - - - - - - - - - -VT AJ Bell Passive Moderately Cau I Acc 103 159 - - - - - - - - - -VT Multi-Asset DRP III Retail Acc 102 263 102 273 114 207 127 189 - - 0.29 1.44VT Multi-Asset DRP IV Retail Acc 102 214 104 250 117 185 - - - - 0.33 1.74VT Multi-Asset DRP V Retail Acc 104 142 106 190 124 129 145 111 - - 0.25 2.19VT Multi-Asset DRP VI Retail Acc 104 103 108 145 128 98 - - - - 0.29 2.25VT Multi-Asset DRP VII Retail Acc 105 68 110 108 129 77 145 112 - - 0.32 2.27VT Multi-Asset DRP VIII Retail Acc 106 31 112 68 133 45 130 174 - - 0.47 1.84VT Rossie House Portfolio B Inc 105 73 112 58 129 76 - - - - - 1.37VT Vanneck Equity B GBP Acc 106 37 110 106 130 72 163 42 - - - 4.62WAY Green Portfolio Elite E Acc 105 55 108 146 124 127 148 93 - - 2.47 -Average/Total 104 300 108 290 124 267 144 240 173 121 1.26 1.48
(IA) VOLATILITY MANAGEDAllianz RiskMaster Cnsrv Mlt Asst C Acc 103 69 105 76 121 52 133 51 - - - 1.05Allianz RiskMaster Growth Mlt Asst C Acc 104 46 108 49 132 20 151 27 - - - 0.85Allianz RiskMaster Mod Mlt Asst C Acc 103 56 106 70 125 42 142 39 - - - 0.87Architas MA Blended Growth A Acc 105 21 110 27 137 7 164 11 147 10 1.53 1.44Architas MA Blended Interm A Acc 103 59 107 60 126 36 149 29 154 8 1.13 1.79Architas MA Blended Moderate A Acc 102 75 105 74 122 49 142 38 158 5 1.11 1.84Architas MA Blended Prog A Acc 104 39 109 42 131 21 158 17 155 7 1.23 1.78Architas MA Blended Reserve A Acc 101 89 104 89 116 67 130 54 148 9 1.02 2.50Architas MA Passive Dynamic A Acc 107 3 114 3 142 2 159 16 - - 0.65 1.64Architas MA Passive Growth A Acc 106 7 111 19 142 1 167 6 - - 0.65 1.40Architas MA Passive Interm A Acc 104 37 108 52 130 24 151 26 - - 0.65 1.57Architas MA Passive Moderate A Acc 103 54 106 69 126 37 145 34 - - 0.65 1.47Architas MA Passive Prog A Acc 105 20 109 35 136 8 161 14 - - 0.65 1.48Architas MA Passive Reserve A Acc 103 65 105 78 122 45 140 45 - - 0.65 1.55Aviva Investors Multi-asset I R3 GBP Acc 101 92 103 92 110 81 123 63 - - - 0.89Aviva Investors Multi-Asset II R3 £ Acc 103 68 106 71 119 60 141 42 - - - 1.00Aviva Investors Multi-asset III R3 £ Acc 104 50 108 50 126 35 155 21 - - - 1.18Aviva Investors Multi-Asset IV R3 £ Acc 104 41 109 33 130 23 165 10 - - - 1.27Aviva Investors Multi-Asset V R3 GBP Acc 106 13 112 11 138 5 166 8 - - - 1.12BlackRock Volatility Strategy I C Acc 104 36 108 47 129 27 - - - - - 1.18
FUND 6 MONTHS 1 YEAR 3 YEARS 5 YEARS 10 YEARS TER YIELD£ £ £ £ £ % %
BlackRock Volatility Strategy II C Acc 105 19 111 23 132 18 - - - - - 1.31BlackRock Volatility Strategy III C Acc 107 6 113 5 135 11 - - - - - 1.66BlackRock Volatility Strategy IV C Acc 108 2 116 1 136 9 - - - - - 1.70FP 8AM Multi-Strategy I A Inc 101 87 105 77 110 82 - - - - 2.86 1.09FP 8AM Multi-Strategy II A Inc 103 62 109 44 120 56 143 36 134 12 2.06 1.60FP 8AM Multi-Strategy III A Inc 105 28 112 16 128 31 - - - - 2.70 0.41FP 8AM Multi-Strategy IV A Inc 105 29 112 14 133 15 - - - - 3.20 0.38IFSL Sinfonia Adventurous Growth A Acc 105 24 113 7 132 19 160 15 - - 2.12 1.01IFSL Sinfonia Balanced Managed A Acc 104 32 111 22 129 26 155 22 - - 1.96 0.98IFSL Sinfonia Cautious Managed A Acc 102 77 106 66 122 48 142 40 - - 1.84 0.95IFSL Sinfonia Income and Growth A Acc 103 55 109 45 125 41 148 31 - - 1.93 1.42IFSL Sinfonia Income Portfolio A Acc 101 90 104 88 117 66 128 55 - - 1.85 1.24IP Balanced Risk 10 Z Acc 108 1 113 9 119 59 132 52 - - - -IP Balanced Risk 6 Z Acc 105 25 107 54 112 76 119 67 - - - -IP Balanced Risk 8 Z Acc 107 5 110 29 115 68 125 62 - - - -Janus Henderson Core 3 Income I Inc 101 88 105 79 114 73 126 60 - - - 3.71Janus Henderson Core 4 Income I Inc 102 82 106 68 117 65 - - - - - 3.91Janus Henderson Core 5 Income I Inc 103 70 107 56 121 53 143 37 - - - 4.09Janus Henderson Core 6 Inc&Gr I Inc 103 52 109 38 126 38 - - - - - 3.98L&G Multi-Index 3 I Acc 102 72 104 86 117 63 - - - - - 1.70L&G Multi-Index 4 I Acc 103 60 107 61 122 47 - - - - - 1.91L&G Multi-Index 5 I Acc 104 40 109 40 129 28 - - - - - 2.10L&G Multi-Index 6 I Acc 105 22 111 24 132 17 - - - - - 2.21L&G Multi-Index 7 I Acc 106 11 113 10 136 10 - - - - - 2.24L&G Multi-Index Income 4 I Acc 102 71 106 67 - - - - - - - 3.12L&G Multi-Index Income 5 I Acc 105 30 111 18 - - - - - - - 3.20L&G Multi-Index Income 6 I Acc 104 45 110 31 - - - - - - - 3.28Rathbone Multi Asset Enhanced Gr S Acc 106 12 115 2 138 4 169 4 - - - 0.92Rathbone Multi Asset Strategic Gr S Inc 104 48 109 34 127 34 152 24 - - - 1.34Rathbone Multi Asset Total Return S Inc 101 91 103 90 113 75 128 56 - - - 1.44Rathbone Strategic Income Portfolio Acc 102 85 107 55 - - - - - - - 3.56Santander Atlas Portfolio 3 IA 102 74 105 80 114 72 126 61 142 11 - 1.68Santander Atlas Portfolio 4 IA 103 58 107 58 120 54 141 41 157 6 - 1.62Santander Atlas Portfolio 5 IA 104 35 109 39 124 43 149 30 160 3 - 1.37Santander Atlas Portfolio 6 IA 106 15 111 21 130 25 157 20 - - - 1.31Santander Atlas Portfolio 7 IA 106 8 113 4 134 12 167 7 171 2 - 1.20SLI MyFolio Managed I Plat 1 Acc 102 79 104 85 112 78 123 64 - - - 1.36SLI MyFolio Managed II Plat 1 Acc 103 51 107 62 117 64 135 49 - - - 1.24SLI MyFolio Managed III Plat 1 Acc 105 26 109 36 122 46 148 32 - - - 1.21SLI MyFolio Managed Income I Plat 1 Acc 102 78 104 82 112 77 122 66 - - - 2.01SLI MyFolio Managed Income II Plat 1 Acc 103 66 106 72 115 69 131 53 - - - 2.11SLI MyFolio Managed Income III Plat1 Acc 104 43 108 51 119 58 140 44 - - - 2.01SLI MyFolio Managed Income IV Plat 1 Acc 104 34 108 46 122 50 147 33 - - - 2.10SLI MyFolio Managed Income V Plat 1 Acc 105 16 110 25 128 32 157 19 - - - 2.07SLI MyFolio Managed IV Plat 1 Acc 106 9 112 17 128 30 161 13 - - - 1.22SLI MyFolio Managed V Plat 1 Acc 107 4 113 6 132 16 173 3 - - - 1.01SLI MyFolio Market I Plat 1 Acc 102 76 105 81 114 70 127 59 - - - 1.52SLI MyFolio Market II Plat 1 Acc 103 53 107 59 121 51 139 46 - - - 1.42SLI MyFolio Market III Plat 1 Acc 104 33 109 37 128 33 152 25 - - - 1.63SLI MyFolio Market IV Plat 1 Acc 105 17 111 20 134 13 166 9 - - - 1.68SLI MyFolio Market V Plat 1 Acc 106 10 113 8 140 3 179 1 - - - 1.52SLI MyFolio Multi-Man Inc I Plat 1 Acc 102 84 104 87 111 80 118 68 - - - 1.61SLI MyFolio Multi-Man Inc II Plat 1 Acc 102 80 105 75 114 71 127 58 - - - 1.88SLI MyFolio Multi-Man Inc III Plat 1 Acc 103 64 107 63 118 61 135 48 - - - 1.84SLI MyFolio Multi-Man Inc IV Plat 1 Acc 103 61 107 57 120 55 140 43 - - - 1.98SLI MyFolio Multi-Man Inc V Plat 1 Acc 104 47 109 41 126 40 151 28 - - - 1.96SLI MyFolio Multi-Man IV Plat 1 Acc 105 27 110 26 128 29 158 18 - - - 0.68SLI MyFolio Multi-Man V Plat 1 Acc 105 18 112 15 133 14 169 5 - - - 0.60SLI MyFolio Multi-Manager I Plat 1 Acc 102 81 104 84 112 79 122 65 - - - 0.56SLI MyFolio Multi-Manager II Plat 1 Acc 103 63 106 65 118 62 134 50 - - - 0.69SLI MyFolio Multi-Manager III Plat 1 Acc 104 44 108 48 123 44 145 35 - - - 0.75SVS Cornelian Cautious D Acc 103 67 106 64 119 57 139 47 158 4 1.24 1.78SVS Cornelian Cautious RMP G GBP Acc 102 73 105 73 - - - - - - - 1.63SVS Cornelian Defensive D Acc 102 83 104 83 113 74 127 57 - - 1.61 1.71SVS Cornelian Defensive RMP G GBP Acc 101 86 103 91 - - - - - - - 1.25SVS Cornelian Growth D Acc 104 38 110 28 131 22 163 12 183 1 1.21 1.43SVS Cornelian Growth RMP G GBP Acc 105 31 110 30 - - - - - - - 1.77SVS Cornelian Managed Growth D Acc 104 49 109 43 126 39 153 23 - - 1.31 1.78SVS Cornelian Managed Gwth RMP G GBP Acc 103 57 107 53 - - - - - - - 1.76SVS Cornelian Managed Income D GBP Acc 104 42 110 32 - - - - - - - 3.13SVS Cornelian Progressive D Acc 105 23 112 13 137 6 175 2 - - 1.36 1.30SVS Cornelian Progressive RMP G GBP Acc 106 14 112 12 - - - - - - - 1.87Average/Total 104 92 108 92 125 82 146 68 156 12 1.49 1.66
(IA) £ CORPORATE BONDAberdeen Corporate Bond I GBP Acc 102 33 106 28 116 27 131 26 174 24 - 2.78Aberdeen Sterling SD Corp Bd I GBP Inc 101 85 102 86 - - - - - - - 1.34Aviva Investors Corporate Bd 2 GBP Inc 102 70 104 64 113 64 125 53 170 31 0.72 3.01Aviva Investors Monthly Inc Pls R3 £ Acc 102 46 105 46 115 34 130 27 165 36 - 3.23AXA Sterling Corporate Bond Z Net Acc 103 20 107 15 117 19 129 36 142 55 0.54 3.24AXA Sterling Crdt Shrt Dura Bd Z Net Acc 101 89 101 88 105 80 109 75 - - 0.43 1.40AXA £ Buy and Maintain Crdt Z Acc Net 102 59 104 66 115 39 127 48 - - - 2.74Baillie Gifford Investment Grd Bd B Inc 102 38 105 45 114 46 129 35 163 42 0.30 3.03Baillie Gifford Invm Grd Lng Bd B Inc 103 5 106 20 120 7 139 7 203 5 0.27 3.16Barclays Sterling Corporate Bd R Acc GBP 102 68 104 59 113 62 127 44 158 48 - 3.34BlackRock Corporate Bond 1-10 Year D Acc 102 62 105 56 113 57 125 60 - - 0.17 2.91BlackRock Corporate Bond D Acc 102 24 106 19 118 14 132 17 189 12 0.58 3.00BNY Mellon Global Credit GBP W Acc H 102 63 104 68 - - - - - - 0.53 1.64Close Bond Income Portfolio X Acc 103 9 108 4 117 21 127 43 - - 0.54 3.92F&C Corporate Bond C Net Inc 102 47 105 35 115 36 130 29 170 30 - 3.75F&C Institutional All Stks Corp Bd 3£Acc 102 42 105 54 116 26 132 18 - - - 2.68F&C Institutional Lng Dated Corp Bd3£Acc 103 6 107 14 124 3 148 1 - - - 2.96F&C Responsible Sterling Bond C Net Inc 102 60 104 63 113 55 125 58 171 28 - 3.25Fidelity Instl UK Corp Bd Inc 102 30 106 21 116 23 131 22 182 16 0.42 3.05Fidelity Instl UK Lng Corp Bd Inc 103 7 107 5 123 4 144 4 216 2 0.42 3.11Fidelity MoneyBuilder Income Net Y 102 53 105 52 113 54 127 49 178 20 0.57 3.30Fidelity Short Dated Crprate Bd Y Gr Acc 101 84 102 83 - - - - - - - 1.17
FUND 6 MONTHS 1 YEAR 3 YEARS 5 YEARS 10 YEARS TER YIELD FUND 6 MONTHS 1 YEAR 3 YEARS 5 YEARS 10 YEARS TER YIELD £ £ £ £ £ % % £ £ £ £ £ % %
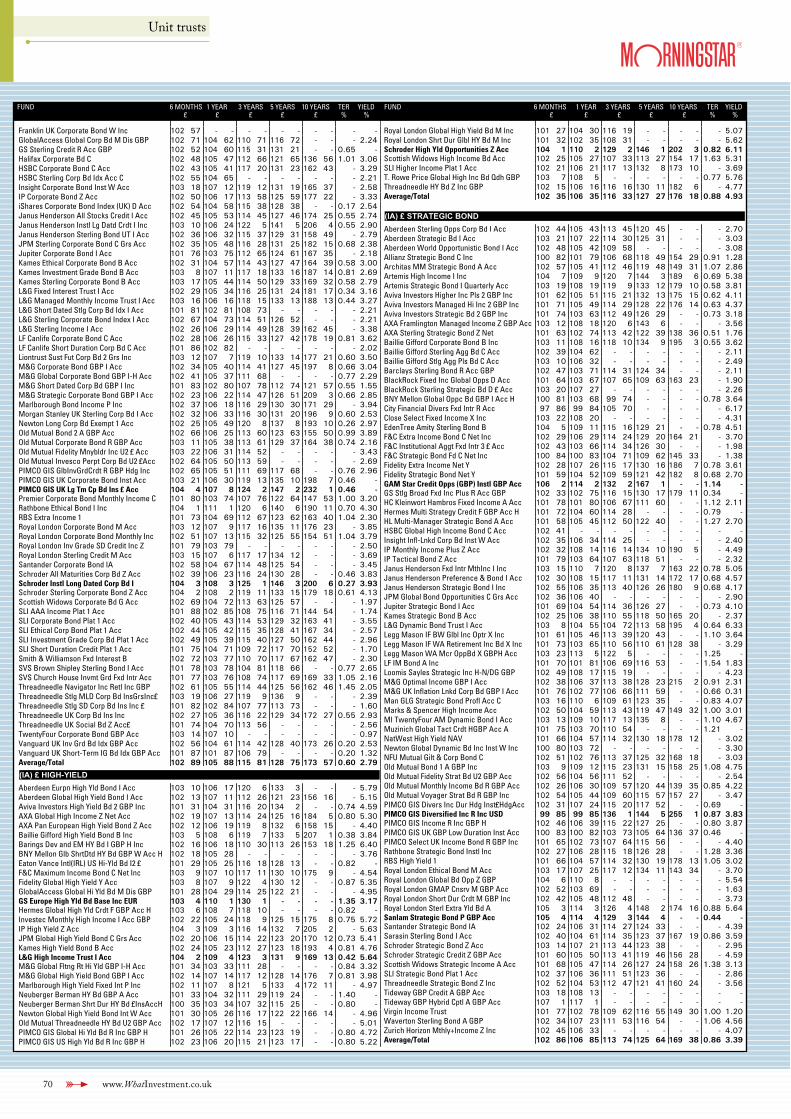
70 www.WhatInvestment.co.uk
Unit trusts
FUND 6 MONTHS 1 YEAR 3 YEARS 5 YEARS 10 YEARS TER YIELD£ £ £ £ £ % %
Franklin UK Corporate Bond W Inc 102 57 - - - - - - - - - -GlobalAccess Global Corp Bd M Dis GBP 102 71 104 62 110 71 116 72 - - - 2.24GS Sterling Credit R Acc GBP 102 52 104 60 115 31 131 21 - - 0.65 -Halifax Corporate Bd C 102 48 105 47 112 66 121 65 136 56 1.01 3.06HSBC Corporate Bond C Acc 102 43 105 41 117 20 131 23 162 43 - 3.29HSBC Sterling Corp Bd Idx Acc C 102 55 104 65 - - - - - - - 2.21Insight Corporate Bond Inst W Acc 103 18 107 12 119 12 131 19 165 37 - 2.58IP Corporate Bond Z Acc 102 50 106 17 113 58 125 59 177 22 - 3.33iShares Corporate Bond Index (UK) D Acc 102 54 104 58 115 38 128 38 - - 0.17 2.54Janus Henderson All Stocks Credit I Acc 102 45 105 53 114 45 127 46 174 25 0.55 2.74Janus Henderson Instl Lg Datd Crdt I Inc 103 10 106 24 122 5 141 5 206 4 0.55 2.90Janus Henderson Sterling Bond UT I Acc 102 36 106 32 115 37 129 31 158 49 - 2.79JPM Sterling Corporate Bond C Grs Acc 102 35 105 48 116 28 131 25 182 15 0.68 2.38Jupiter Corporate Bond I Acc 101 76 103 75 112 65 124 61 167 35 - 2.18Kames Ethical Corporate Bond B Acc 102 31 104 57 114 43 127 47 164 39 0.58 3.00Kames Investment Grade Bond B Acc 103 8 107 11 117 18 133 16 187 14 0.81 2.69Kames Sterling Corporate Bond B Acc 103 17 105 44 114 50 129 33 169 32 0.58 2.79L&G Fixed Interest Trust I Acc 102 29 105 34 116 25 131 24 181 17 0.34 3.16L&G Managed Monthly Income Trust I Acc 103 16 106 16 118 15 133 13 188 13 0.44 3.27L&G Short Dated Stlg Corp Bd Idx I Acc 101 81 102 81 108 73 - - - - - 2.21L&G Sterling Corporate Bond Index I Acc 102 67 104 73 114 51 126 52 - - - 2.21L&G Sterling Income I Acc 102 26 106 29 114 49 128 39 162 45 - 3.38LF Canlife Corporate Bond C Acc 102 28 106 26 115 33 127 42 178 19 0.81 3.62LF Canlife Short Duration Corp Bd C Acc 101 86 102 82 - - - - - - - 2.02Liontrust Sust Fut Corp Bd 2 Grs Inc 103 12 107 7 119 10 133 14 177 21 0.60 3.50M&G Corporate Bond GBP I Acc 102 34 105 40 114 41 127 45 197 8 0.66 3.04M&G Global Corporate Bond GBP I-H Acc 102 41 105 37 111 68 - - - - 0.77 2.29M&G Short Dated Corp Bd GBP I Inc 101 83 102 80 107 78 112 74 121 57 0.55 1.55M&G Strategic Corporate Bond GBP I Acc 102 23 106 22 114 47 126 51 209 3 0.66 2.85Marlborough Bond Income P Inc 102 37 106 18 116 29 130 30 171 29 - 3.94Morgan Stanley UK Sterling Corp Bd I Acc 102 32 106 33 116 30 131 20 196 9 0.60 2.53Newton Long Corp Bd Exempt 1 Acc 102 25 105 49 120 8 137 8 193 10 0.26 2.97Old Mutual Bond 2 A GBP Acc 102 66 106 25 113 60 123 63 155 50 0.99 3.89Old Mutual Corporate Bond R GBP Acc 103 11 105 38 113 61 129 37 164 38 0.74 2.16Old Mutual Fidelity Mnybldr Inc U2 £ Acc 103 22 106 31 114 52 - - - - - 3.43Old Mutual Invesco Perpt Corp Bd U2 £Acc 102 64 105 50 113 59 - - - - - 2.69PIMCO GIS GlbInvGrdCrdt R GBP Hdg Inc 102 65 105 51 111 69 117 68 - - 0.76 2.96PIMCO GIS UK Corporate Bond Inst Acc 103 21 106 30 119 13 135 10 198 7 0.46 -PIMCO GIS UK Lg Tm Cp Bd Ins £ Acc 104 4 107 8 124 2 147 2 232 1 0.46 -Premier Corporate Bond Monthly Income C 101 80 103 74 107 76 122 64 147 53 1.00 3.20Rathbone Ethical Bond I Inc 104 1 111 1 120 6 140 6 190 11 0.70 4.30RBS Extra Income 1 101 73 104 69 112 67 123 62 163 40 1.04 2.30Royal London Corporate Bond M Acc 103 12 107 9 117 16 135 11 176 23 - 3.85Royal London Corporate Bond Monthly Inc 102 51 107 13 115 32 125 55 154 51 1.04 3.79Royal London Inv Grade SD Credit Inc Z 101 79 103 79 - - - - - - - 2.50Royal London Sterling Credit M Acc 103 15 107 6 117 17 134 12 - - - 3.69Santander Corporate Bond IA 102 58 104 67 114 48 125 54 - - - 3.45Schroder All Maturities Corp Bd Z Acc 102 39 106 23 116 24 130 28 - - 0.46 3.83Schroder Instl Long Dated Corp Bd I 104 3 108 3 125 1 146 3 200 6 0.27 3.93Schroder Sterling Corporate Bond Z Acc 104 2 108 2 119 11 133 15 179 18 0.61 4.13Scottish Widows Corporate Bd G Acc 102 69 104 72 113 63 125 57 - - - 1.97SLI AAA Income Plat 1 Acc 101 88 102 85 108 75 116 71 144 54 - 1.74SLI Corporate Bond Plat 1 Acc 102 40 105 43 114 53 129 32 163 41 - 3.55SLI Ethical Corp Bond Plat 1 Acc 102 44 105 42 115 35 128 41 167 34 - 2.57SLI Investment Grade Corp Bd Plat 1 Acc 102 49 105 39 115 40 127 50 162 44 - 2.96SLI Short Duration Credit Plat 1 Acc 101 75 104 71 109 72 117 70 152 52 - 1.70Smith & Williamson Fxd Interest B 102 72 103 77 110 70 117 67 162 47 - 2.30SVS Brown Shipley Sterling Bond I Acc 101 78 103 78 104 81 118 66 - - 0.77 2.65SVS Church House Invmt Grd Fxd Intr Acc 101 77 103 76 108 74 117 69 169 33 1.05 2.16Threadneedle Navigator Inc Retl Inc GBP 102 61 105 55 114 44 125 56 162 46 1.45 2.05Threadneedle Stlg MLD Corp Bd InsGrsInc£ 103 19 106 27 119 9 136 9 - - - 2.39Threadneedle Stlg SD Corp Bd Ins Inc £ 101 82 102 84 107 77 113 73 - - - 1.60Threadneedle UK Corp Bd Ins Inc 102 27 105 36 116 22 129 34 172 27 0.55 2.93Threadneedle UK Social Bd Z Acc£ 101 74 104 70 113 56 - - - - - 2.56TwentyFour Corporate Bond GBP Acc 103 14 107 10 - - - - - - - 0.97Vanguard UK Inv Grd Bd Idx GBP Acc 102 56 104 61 114 42 128 40 173 26 0.20 2.53Vanguard UK Short-Term IG Bd Idx GBP Acc 101 87 101 87 106 79 - - - - 0.20 1.32Average/Total 102 89 105 88 115 81 128 75 173 57 0.60 2.79
(IA) £ HIGH-YIELDAberdeen Eurpn High Yld Bond I Acc 103 10 106 17 120 6 133 3 - - - 5.79Aberdeen Global High Yield Bond I Acc 102 13 107 11 112 26 121 23 156 16 - 5.15Aviva Investors High Yield Bd 2 GBP Inc 101 31 104 31 116 20 134 2 - - 0.74 4.59AXA Global High Income Z Net Acc 102 19 107 13 114 24 125 16 184 5 0.80 5.30AXA Pan European High Yield Bond Z Acc 102 12 106 19 119 8 132 6 158 15 - 4.40Baillie Gifford High Yield Bond B Inc 103 5 108 6 119 7 133 5 207 1 0.38 3.84Barings Dev and EM HY Bd I GBP H Inc 102 16 106 18 110 30 113 26 153 18 1.25 6.40BNY Mellon Glb ShrtDtd HY Bd GBP W Acc H 102 18 105 28 - - - - - - - 3.76Eaton Vance Intl(IRL) US Hi-Yld Bd I2 £ 101 29 105 25 116 18 128 13 - - 0.82 -F&C Maximum Income Bond C Net Inc 103 9 107 10 117 11 130 10 175 9 - 4.54Fidelity Global High Yield Y Acc 103 8 107 9 122 4 130 12 - - 0.87 5.35GlobalAccess Global Hi Yld Bd M Dis GBP 101 28 104 29 114 25 122 21 - - - 4.95GS Europe High Yld Bd Base Inc EUR 103 4 110 1 130 1 - - - - 1.35 3.17Hermes Global High Yld Crdt F GBP Acc H 103 6 108 7 118 10 - - - - 0.82 -Investec Monthly High Income I Acc GBP 102 22 105 24 118 9 125 15 175 8 0.75 5.72IP High Yield Z Acc 104 3 109 3 116 14 132 7 205 2 - 5.63JPM Global High Yield Bond C Grs Acc 102 20 106 15 114 22 123 20 170 12 0.73 5.41Kames High Yield Bond B Acc 102 24 105 23 112 27 123 18 193 4 0.81 4.76L&G High Income Trust I Acc 104 2 109 4 123 3 131 9 169 13 0.42 5.64M&G Global Fltng Rt Hi Yld GBP I-H Acc 101 34 103 33 111 28 - - - - 0.84 3.32M&G Global High Yield Bond GBP I Acc 102 14 107 14 117 12 128 14 176 7 0.81 3.98Marlborough High Yield Fixed Int P Inc 102 11 107 8 121 5 133 4 172 11 - 4.97Neuberger Berman HY Bd GBP A Acc 101 33 104 32 111 29 119 24 - - 1.40 -Neuberger Berman Shrt Dur HY Bd £InsAccH 100 35 103 34 107 32 115 25 - - 0.80 -Newton Global High Yield Bond Int W Acc 101 30 105 26 116 17 122 22 166 14 - 4.96Old Mutual Threadneedle HY Bd U2 GBP Acc 102 17 107 12 116 15 - - - - - 5.01PIMCO GIS Global Hi Yld Bd R Inc GBP H 101 26 105 22 114 23 123 19 - - 0.80 4.72PIMCO GIS US High Yld Bd R Inc GBP H 102 23 106 20 115 21 123 17 - - 0.80 5.22
FUND 6 MONTHS 1 YEAR 3 YEARS 5 YEARS 10 YEARS TER YIELD£ £ £ £ £ % %
Royal London Global High Yield Bd M Inc 101 27 104 30 116 19 - - - - - 5.07Royal London Shrt Dur Glbl HY Bd M Inc 101 32 102 35 108 31 - - - - - 5.62Schroder High Yld Opportunities Z Acc 104 1 110 2 129 2 146 1 202 3 0.82 6.11Scottish Widows High Income Bd Acc 102 25 105 27 107 33 113 27 154 17 1.63 5.31SLI Higher Income Plat 1 Acc 102 21 106 21 117 13 132 8 173 10 - 3.69T. Rowe Price Global High Inc Bd Qdh GBP 103 7 108 5 - - - - - - 0.77 5.76Threadneedle HY Bd Z Inc GBP 102 15 106 16 116 16 130 11 182 6 - 4.77Average/Total 102 35 106 35 116 33 127 27 176 18 0.88 4.93
(IA) £ STRATEGIC BONDAberdeen Sterling Opps Corp Bd I Acc 102 44 105 43 113 45 120 45 - - - 2.70Aberdeen Strategic Bd I Acc 103 21 107 22 114 30 125 31 - - - 3.03Aberdeen World Opportunistic Bond I Acc 102 48 105 42 109 58 - - - - - 3.08Allianz Strategic Bond C Inc 100 82 101 79 106 68 118 49 154 29 0.91 1.28Architas MM Strategic Bond A Acc 102 57 105 41 112 46 119 48 149 31 1.07 2.86Artemis High Income I Inc 104 7 109 9 120 7 144 3 189 6 0.69 5.38Artemis Strategic Bond I Quarterly Acc 103 19 108 19 119 9 133 12 179 10 0.58 3.81Aviva Investors Higher Inc Pls 2 GBP Inc 101 62 105 51 115 21 132 13 175 15 0.62 4.11Aviva Investors Managed Hi Inc 2 GBP Inc 101 71 105 49 114 29 128 22 176 14 0.63 4.37Aviva Investors Strategic Bd 2 GBP Inc 101 74 103 63 112 49 126 29 - - 0.73 3.18AXA Framlington Managed Income Z GBP Acc 103 12 108 18 120 6 143 6 - - - 3.56AXA Sterling Strategic Bond Z Net 101 63 102 74 113 42 122 39 138 36 0.51 1.76Baillie Gifford Corporate Bond B Inc 103 11 108 16 118 10 134 9 195 3 0.55 3.62Baillie Gifford Sterling Agg Bd C Acc 102 39 104 62 - - - - - - - 2.11Baillie Gifford Stlg Agg Pls Bd C Acc 103 10 106 32 - - - - - - - 2.49Barclays Sterling Bond R Acc GBP 102 47 103 71 114 31 124 34 - - - 2.11BlackRock Fixed Inc Global Opps D Acc 101 64 103 67 107 65 109 63 163 23 - 1.90BlackRock Sterling Strategic Bd D £ Acc 103 20 107 27 - - - - - - - 2.26BNY Mellon Global Oppc Bd GBP I Acc H 100 81 103 68 99 74 - - - - 0.78 3.64City Financial Divers Fxd Intr R Acc 97 86 99 84 105 70 - - - - - 6.17Close Select Fixed Income X Inc 103 22 108 20 - - - - - - - 4.31EdenTree Amity Sterling Bond B 104 5 109 11 115 16 129 21 - - 0.78 4.51F&C Extra Income Bond C Net Inc 102 29 106 29 114 24 129 20 164 21 - 3.70F&C Institutional Aggt Fxd Intr 3 £ Acc 102 43 103 66 114 34 126 30 - - - 1.98F&C Strategic Bond Fd C Net Inc 100 84 100 83 104 71 109 62 145 33 - 1.38Fidelity Extra Income Net Y 102 28 107 26 115 17 130 16 186 7 0.78 3.61Fidelity Strategic Bond Net Y 101 59 104 52 109 59 121 42 182 8 0.68 2.70GAM Star Credit Opps (GBP) Instl GBP Acc 106 2 114 2 132 2 167 1 - - 1.14 -GS Stlg Broad Fxd Inc Plus R Acc GBP 102 33 102 75 116 15 130 17 179 11 0.34 -HC Kleinwort Hambros Fixed Income A Acc 101 78 101 80 106 67 111 60 - - 1.12 2.11Hermes Multi Strategy Credit F GBP Acc H 101 72 104 60 114 28 - - - - 0.79 -HL Multi-Manager Strategic Bond A Acc 101 58 105 45 112 50 122 40 - - 1.27 2.70HSBC Global High Income Bond C Acc 102 41 - - - - - - - - - -Insight Infl-Lnkd Corp Bd Inst W Acc 102 35 106 34 114 25 - - - - - 2.40IP Monthly Income Plus Z Acc 102 32 108 14 116 14 134 10 190 5 - 4.49IP Tactical Bond Z Acc 101 79 103 64 107 63 118 51 - - - 2.32Janus Henderson Fxd Intr MthInc I Inc 103 15 110 7 120 8 137 7 163 22 0.78 5.05Janus Henderson Preference & Bond I Acc 102 30 108 15 117 11 131 14 172 17 0.68 4.57Janus Henderson Strategic Bond I Inc 102 55 106 35 113 40 126 26 180 9 0.68 4.17JPM Global Bond Opportunities C Grs Acc 102 36 106 40 - - - - - - - 2.90Jupiter Strategic Bond I Acc 101 69 104 54 114 36 126 27 - - 0.73 4.10Kames Strategic Bond B Acc 102 25 106 38 110 55 118 50 165 20 - 2.37L&G Dynamic Bond Trust I Acc 103 8 104 55 104 72 113 58 195 4 0.64 6.33Legg Mason IF BW Glbl Inc Optr X Inc 101 61 105 46 113 39 120 43 - - 1.10 3.64Legg Mason IF WA Retirement Inc Bd X Inc 101 73 103 65 110 56 110 61 128 38 - 3.29Legg Mason WA Mcr OppBd X GBPH Acc 103 23 113 5 122 5 - - - - 1.25 -LF IM Bond A Inc 101 70 101 81 106 69 116 53 - - 1.54 1.83Loomis Sayles Strategic Inc H-N/DG GBP 102 49 108 17 115 19 - - - - - 4.23M&G Optimal Income GBP I Acc 102 38 106 37 113 38 128 23 215 2 0.91 2.31M&G UK Inflation Lnkd Corp Bd GBP I Acc 101 76 102 77 106 66 111 59 - - 0.66 0.31Man GLG Strategic Bond Profl Acc C 103 16 110 6 109 61 123 35 - - 0.83 4.07Marks & Spencer High Income Acc 102 50 104 59 113 43 119 47 149 32 1.00 3.01MI TwentyFour AM Dynamic Bond I Acc 103 13 109 10 117 13 135 8 - - 1.10 4.67Muzinich Global Tact Crdt HGBP Acc A 101 75 103 70 110 54 - - - - 1.21 -NatWest High Yield NAV 101 66 104 57 114 32 130 18 178 12 - 3.02Newton Global Dynamic Bd Inc Inst W Inc 100 80 103 72 - - - - - - - 3.30NFU Mutual Gilt & Corp Bond C 102 51 102 76 113 37 125 32 168 18 - 3.03Old Mutual Bond 1 A GBP Inc 103 9 109 12 115 23 131 15 158 25 1.08 4.75Old Mutual Fidelity Strat Bd U2 GBP Acc 102 56 104 56 111 52 - - - - - 2.54Old Mutual Monthly Income Bd R GBP Acc 102 26 106 30 109 57 120 44 139 35 0.85 4.22Old Mutual Voyager Strat Bd R GBP Inc 102 54 105 44 109 60 115 57 157 27 - 3.47PIMCO GIS Divers Inc Dur Hdg Inst£HdgAcc 102 31 107 24 115 20 117 52 - - 0.69 -PIMCO GIS Diversified Inc R Inc USD 99 85 99 85 136 1 144 5 255 1 0.87 3.83PIMCO GIS Income R Inc GBP H 102 46 106 39 115 22 127 25 - - 0.80 3.87PIMCO GIS UK GBP Low Duration Inst Acc 100 83 100 82 103 73 105 64 136 37 0.46 -PIMCO Select UK Income Bond R GBP Inc 101 65 102 73 107 64 115 56 - - - 4.40Rathbone Strategic Bond Instl Inc 102 27 106 28 115 18 126 28 - - 1.28 3.36RBS High Yield 1 101 66 104 57 114 32 130 19 178 13 1.05 3.02Royal London Ethical Bond M Acc 103 17 107 25 117 12 134 11 143 34 - 3.70Royal London Global Bd Opp Z GBP 104 6 110 8 - - - - - - - 5.54Royal London GMAP Cnsrv M GBP Acc 102 52 103 69 - - - - - - - 1.63Royal London Short Dur Crdt M GBP Inc 102 42 105 48 112 48 - - - - - 3.73Royal London Sterl Extra Yld Bd A 105 3 114 3 126 4 148 2 174 16 0.88 5.64Sanlam Strategic Bond P GBP Acc 105 4 114 4 129 3 144 4 - - 0.44 -Santander Strategic Bond IA 102 24 106 31 114 27 124 33 - - - 4.39Sarasin Sterling Bond I Acc 102 40 104 61 114 35 123 37 167 19 0.86 3.59Schroder Strategic Bond Z Acc 103 14 107 21 113 44 123 38 - - - 2.95Schroder Strategic Credit Z GBP Acc 101 60 105 50 113 41 119 46 156 28 - 4.59Scottish Widows Strategic Income A Acc 101 68 105 47 114 26 127 24 158 26 1.38 3.13SLI Strategic Bond Plat 1 Acc 102 37 106 36 111 51 123 36 - - - 2.86Threadneedle Strategic Bond Z Inc 102 52 104 53 112 47 121 41 160 24 - 3.56Tideway GBP Credit A GBP Acc 103 18 108 13 - - - - - - - -Tideway GBP Hybrid Cptl A GBP Acc 107 1 117 1 - - - - - - - -Virgin Income Trust 101 77 102 78 109 62 116 55 149 30 1.00 1.20Waverton Sterling Bond A GBP 102 34 107 23 111 53 116 54 - - 1.06 4.56Zurich Horizon Mthly+Income Z Inc 102 45 106 33 - - - - - - - 4.07Average/Total 102 86 106 85 113 74 125 64 169 38 0.86 3.39
FUND 6 MONTHS 1 YEAR 3 YEARS 5 YEARS 10 YEARS TER YIELD FUND 6 MONTHS 1 YEAR 3 YEARS 5 YEARS 10 YEARS TER YIELD £ £ £ £ £ % % £ £ £ £ £ % %
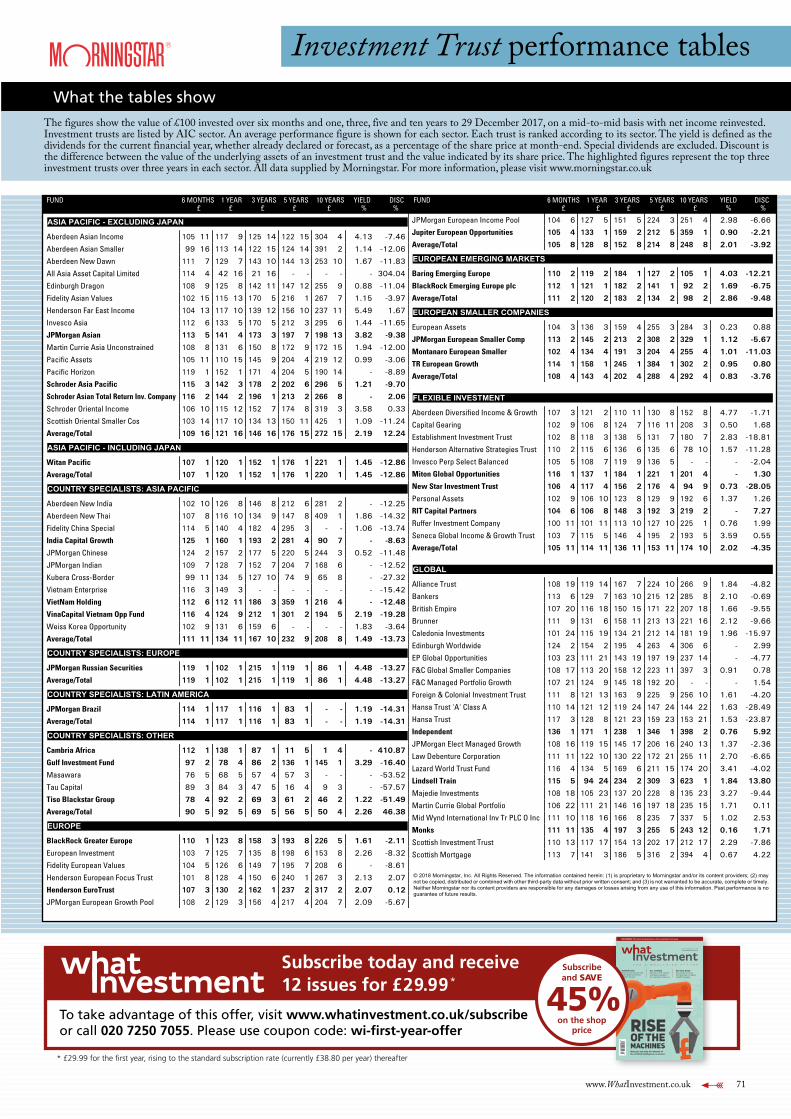
www.WhatInvestment.co.uk 71
Investment Trust performance tablesWhat the tables show
The figures show the value of £100 invested over six months and one, three, five and ten years to 29 December 2017, on a mid-to-mid basis with net income reinvested. Investment trusts are listed by AIC sector. An average performance figure is shown for each sector. Each trust is ranked according to its sector. The yield is defined as the dividends for the current financial year, whether already declared or forecast, as a percentage of the share price at month-end. Special dividends are excluded. Discount is the difference between the value of the underlying assets of an investment trust and the value indicated by its share price. The highlighted figures represent the top three investment trusts over three years in each sector. All data supplied by Morningstar. For more information, please visit www.morningstar.co.uk
FUND 6 MONTHS 1 YEAR 3 YEARS 5 YEARS 10 YEARS YIELD DISC£ £ £ £ £ % %
ASIA PACIFIC - EXCLUDING JAPAN
Aberdeen Asian Income 105 11 117 9 125 14 122 15 304 4 4.13 -7.46
Aberdeen Asian Smaller 99 16 113 14 122 15 124 14 391 2 1.14 -12.06
Aberdeen New Dawn 111 7 129 7 143 10 144 13 253 10 1.67 -11.83
All Asia Asset Capital Limited 114 4 42 16 21 16 - - - - - 304.04
Edinburgh Dragon 108 9 125 8 142 11 147 12 255 9 0.88 -11.04
Fidelity Asian Values 102 15 115 13 170 5 216 1 267 7 1.15 -3.97
Henderson Far East Income 104 13 117 10 139 12 156 10 237 11 5.49 1.67
Invesco Asia 112 6 133 5 170 5 212 3 295 6 1.44 -11.65
JPMorgan Asian 113 5 141 4 173 3 197 7 198 13 3.82 -9.38
Martin Currie Asia Unconstrained 108 8 131 6 150 8 172 9 172 15 1.94 -12.00
Pacific Assets 105 11 110 15 145 9 204 4 219 12 0.99 -3.06
Pacific Horizon 119 1 152 1 171 4 204 5 190 14 - -8.89
Schroder Asia Pacific 115 3 142 3 178 2 202 6 296 5 1.21 -9.70
Schroder Asian Total Return Inv. Company 116 2 144 2 196 1 213 2 266 8 - 2.06
Schroder Oriental Income 106 10 115 12 152 7 174 8 319 3 3.58 0.33
Scottish Oriental Smaller Cos 103 14 117 10 134 13 150 11 425 1 1.09 -11.24
Average/Total 109 16 121 16 146 16 176 15 272 15 2.19 12.24
ASIA PACIFIC - INCLUDING JAPAN
Witan Pacific 107 1 120 1 152 1 176 1 221 1 1.45 -12.86
Average/Total 107 1 120 1 152 1 176 1 220 1 1.45 -12.86
COUNTRY SPECIALISTS: ASIA PACIFIC
Aberdeen New India 102 10 126 8 146 8 212 6 281 2 - -12.25
Aberdeen New Thai 107 8 116 10 134 9 147 8 409 1 1.86 -14.32
Fidelity China Special 114 5 140 4 182 4 295 3 - - 1.06 -13.74
India Capital Growth 125 1 160 1 193 2 281 4 90 7 - -8.63
JPMorgan Chinese 124 2 157 2 177 5 220 5 244 3 0.52 -11.48
JPMorgan Indian 109 7 128 7 152 7 204 7 168 6 - -12.52
Kubera Cross-Border 99 11 134 5 127 10 74 9 65 8 - -27.32
Vietnam Enterprise 116 3 149 3 - - - - - - - -15.42
VietNam Holding 112 6 112 11 186 3 359 1 216 4 - -12.48
VinaCapital Vietnam Opp Fund 116 4 124 9 212 1 301 2 194 5 2.19 -19.28
Weiss Korea Opportunity 102 9 131 6 159 6 - - - - 1.83 -3.64
Average/Total 111 11 134 11 167 10 232 9 208 8 1.49 -13.73
COUNTRY SPECIALISTS: EUROPE
JPMorgan Russian Securities 119 1 102 1 215 1 119 1 86 1 4.48 -13.27
Average/Total 119 1 102 1 215 1 119 1 86 1 4.48 -13.27
COUNTRY SPECIALISTS: LATIN AMERICA
JPMorgan Brazil 114 1 117 1 116 1 83 1 - - 1.19 -14.31
Average/Total 114 1 117 1 116 1 83 1 - - 1.19 -14.31
COUNTRY SPECIALISTS: OTHER
Cambria Africa 112 1 138 1 87 1 11 5 1 4 - 410.87
Gulf Investment Fund 97 2 78 4 86 2 136 1 145 1 3.29 -16.40
Masawara 76 5 68 5 57 4 57 3 - - - -53.52
Tau Capital 89 3 84 3 47 5 16 4 9 3 - -57.57
Tiso Blackstar Group 78 4 92 2 69 3 61 2 46 2 1.22 -51.49
Average/Total 90 5 92 5 69 5 56 5 50 4 2.26 46.38
EUROPE
BlackRock Greater Europe 110 1 123 8 158 3 193 8 226 5 1.61 -2.11
European Investment 103 7 125 7 135 8 198 6 153 8 2.26 -8.32
Fidelity European Values 104 5 126 6 149 7 195 7 208 6 - -8.61
Henderson European Focus Trust 101 8 128 4 150 6 240 1 267 3 2.13 2.07
Henderson EuroTrust 107 3 130 2 162 1 237 2 317 2 2.07 0.12
JPMorgan European Growth Pool 108 2 129 3 156 4 217 4 204 7 2.09 -5.67
FUND 6 MONTHS 1 YEAR 3 YEARS 5 YEARS 10 YEARS YIELD DISC£ £ £ £ £ % %
JPMorgan European Income Pool 104 6 127 5 151 5 224 3 251 4 2.98 -6.66
Jupiter European Opportunities 105 4 133 1 159 2 212 5 359 1 0.90 -2.21
Average/Total 105 8 128 8 152 8 214 8 248 8 2.01 -3.92
EUROPEAN EMERGING MARKETS
Baring Emerging Europe 110 2 119 2 184 1 127 2 105 1 4.03 -12.21
BlackRock Emerging Europe plc 112 1 121 1 182 2 141 1 92 2 1.69 -6.75
Average/Total 111 2 120 2 183 2 134 2 98 2 2.86 -9.48
EUROPEAN SMALLER COMPANIES
European Assets 104 3 136 3 159 4 255 3 284 3 0.23 0.88
JPMorgan European Smaller Comp 113 2 145 2 213 2 308 2 329 1 1.12 -5.67
Montanaro European Smaller 102 4 134 4 191 3 204 4 255 4 1.01 -11.03
TR European Growth 114 1 158 1 245 1 384 1 302 2 0.95 0.80
Average/Total 108 4 143 4 202 4 288 4 292 4 0.83 -3.76
FLEXIBLE INVESTMENT
Aberdeen Diversified Income & Growth 107 3 121 2 110 11 130 8 152 8 4.77 -1.71
Capital Gearing 102 9 106 8 124 7 116 11 208 3 0.50 1.68
Establishment Investment Trust 102 8 118 3 138 5 131 7 180 7 2.83 -18.81
Henderson Alternative Strategies Trust 110 2 115 6 136 6 135 6 78 10 1.57 -11.28
Invesco Perp Select Balanced 105 5 108 7 119 9 136 5 - - - -2.04
Miton Global Opportunities 116 1 137 1 184 1 221 1 201 4 - 1.30
New Star Investment Trust 106 4 117 4 156 2 176 4 94 9 0.73 -28.05
Personal Assets 102 9 106 10 123 8 129 9 192 6 1.37 1.26
RIT Capital Partners 104 6 106 8 148 3 192 3 219 2 - 7.27
Ruffer Investment Company 100 11 101 11 113 10 127 10 225 1 0.76 1.99
Seneca Global Income & Growth Trust 103 7 115 5 146 4 195 2 193 5 3.59 0.55
Average/Total 105 11 114 11 136 11 153 11 174 10 2.02 -4.35
GLOBAL
Alliance Trust 108 19 119 14 167 7 224 10 266 9 1.84 -4.82
Bankers 113 6 129 7 163 10 215 12 285 8 2.10 -0.69
British Empire 107 20 116 18 150 15 171 22 207 18 1.66 -9.55
Brunner 111 9 131 6 158 11 213 13 221 16 2.12 -9.66
Caledonia Investments 101 24 115 19 134 21 212 14 181 19 1.96 -15.97
Edinburgh Worldwide 124 2 154 2 195 4 263 4 306 6 - 2.99
EP Global Opportunities 103 23 111 21 143 19 197 19 237 14 - -4.77
F&C Global Smaller Companies 108 17 113 20 158 12 223 11 397 3 0.91 0.78
F&C Managed Portfolio Growth 107 21 124 9 145 18 192 20 - - - 1.54
Foreign & Colonial Investment Trust 111 8 121 13 163 9 225 9 256 10 1.61 -4.20
Hansa Trust 'A' Class A 110 14 121 12 119 24 147 24 144 22 1.63 -28.49
Hansa Trust 117 3 128 8 121 23 159 23 153 21 1.53 -23.87
Independent 136 1 171 1 238 1 346 1 398 2 0.76 5.92
JPMorgan Elect Managed Growth 108 16 119 15 145 17 206 16 240 13 1.37 -2.36
Law Debenture Corporation 111 11 122 10 130 22 172 21 255 11 2.70 -6.65
Lazard World Trust Fund 116 4 134 5 169 6 211 15 174 20 3.41 -4.02
Lindsell Train 115 5 94 24 234 2 309 3 623 1 1.84 13.80
Majedie Investments 108 18 105 23 137 20 228 8 135 23 3.27 -9.44
Martin Currie Global Portfolio 106 22 111 21 146 16 197 18 235 15 1.71 0.11
Mid Wynd International Inv Tr PLC O Inc 111 10 118 16 166 8 235 7 337 5 1.02 2.53
Monks 111 11 135 4 197 3 255 5 243 12 0.16 1.71
Scottish Investment Trust 110 13 117 17 154 13 202 17 212 17 2.29 -7.86
Scottish Mortgage 113 7 141 3 186 5 316 2 394 4 0.67 4.22
© 2018 Morningstar, Inc. All Rights Reserved. The information contained herein: (1) is proprietary to Morningstar and/or its content providers; (2) maynot be copied, distributed or combined with other third-party data without prior written consent; and (3) is not warranted to be accurate, complete or timely.Neither Morningstar nor its content providers are responsible for any damages or losses arising from any use of this information. Past performance is noguarantee of future results.
FUND 6 MONTHS 1 YEAR 3 YEARS 5 YEARS 10 YEARS YIELD DISC FUND 6 MONTHS 1 YEAR 3 YEARS 5 YEARS 10 YEARS YIELD DISC £ £ £ £ £ % % £ £ £ £ £ % %
12
9770263953115
Issue 417 December 2017 £4.50
www.whatinvestment.co.uk
WINNING BIGFind out who has won this year’s What Investment Readers’ Awards
ALL CHANGEWe look at VCT and EIS investments ahead of the regulatory shake-up
BEYOND ROBO How to benefit from the next wave of digital wealth managers
INCLUDING: The latest developments in the investment trust space
Subscribe and SAVE
45%on the shop
price
Subscribe today and receive 12 issues for £29.99*
To take advantage of this offer, visit www.whatinvestment.co.uk/subscribe or call 020 7250 7055. Please use coupon code: wi-first-year-offer
* £29.99 for the first year, rising to the standard subscription rate (currently £38.80 per year) thereafter
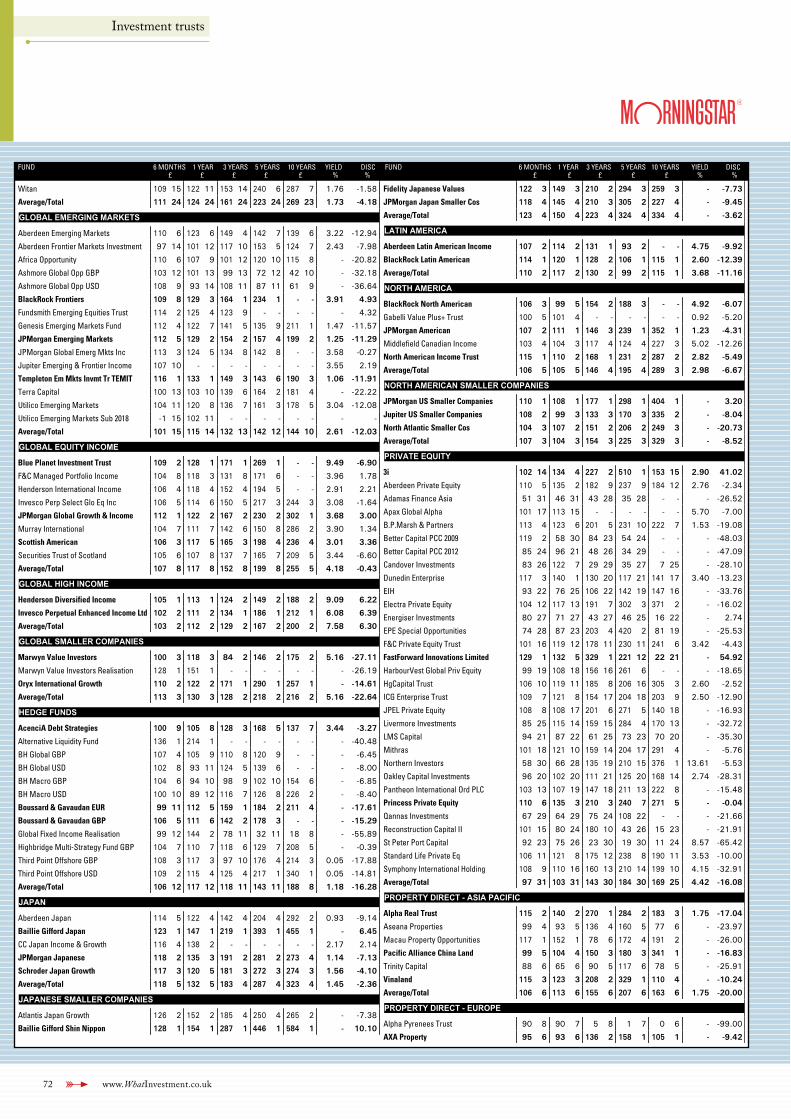
Investment trusts
72 www.WhatInvestment.co.uk
FUND 6 MONTHS 1 YEAR 3 YEARS 5 YEARS 10 YEARS YIELD DISC£ £ £ £ £ % %
Witan 109 15 122 11 153 14 240 6 287 7 1.76 -1.58
Average/Total 111 24 124 24 161 24 223 24 269 23 1.73 -4.18
GLOBAL EMERGING MARKETS
Aberdeen Emerging Markets 110 6 123 6 149 4 142 7 139 6 3.22 -12.94
Aberdeen Frontier Markets Investment 97 14 101 12 117 10 153 5 124 7 2.43 -7.98
Africa Opportunity 110 6 107 9 101 12 120 10 115 8 - -20.82
Ashmore Global Opp GBP 103 12 101 13 99 13 72 12 42 10 - -32.18
Ashmore Global Opp USD 108 9 93 14 108 11 87 11 61 9 - -36.64
BlackRock Frontiers 109 8 129 3 164 1 234 1 - - 3.91 4.93
Fundsmith Emerging Equities Trust 114 2 125 4 123 9 - - - - - 4.32
Genesis Emerging Markets Fund 112 4 122 7 141 5 135 9 211 1 1.47 -11.57
JPMorgan Emerging Markets 112 5 129 2 154 2 157 4 199 2 1.25 -11.29
JPMorgan Global Emerg Mkts Inc 113 3 124 5 134 8 142 8 - - 3.58 -0.27
Jupiter Emerging & Frontier Income 107 10 - - - - - - - - 3.55 2.19
Templeton Em Mkts Invmt Tr TEMIT 116 1 133 1 149 3 143 6 190 3 1.06 -11.91
Terra Capital 100 13 103 10 139 6 164 2 181 4 - -22.22
Utilico Emerging Markets 104 11 120 8 136 7 161 3 178 5 3.04 -12.08
Utilico Emerging Markets Sub 2018 -1 15 102 11 - - - - - - - -
Average/Total 101 15 115 14 132 13 142 12 144 10 2.61 -12.03
GLOBAL EQUITY INCOME
Blue Planet Investment Trust 109 2 128 1 171 1 269 1 - - 9.49 -6.90
F&C Managed Portfolio Income 104 8 118 3 131 8 171 6 - - 3.96 1.78
Henderson International Income 106 4 118 4 152 4 194 5 - - 2.91 2.21
Invesco Perp Select Glo Eq Inc 106 5 114 6 150 5 217 3 244 3 3.08 -1.64
JPMorgan Global Growth & Income 112 1 122 2 167 2 230 2 302 1 3.68 3.00
Murray International 104 7 111 7 142 6 150 8 286 2 3.90 1.34
Scottish American 106 3 117 5 165 3 198 4 236 4 3.01 3.36
Securities Trust of Scotland 105 6 107 8 137 7 165 7 209 5 3.44 -6.60
Average/Total 107 8 117 8 152 8 199 8 255 5 4.18 -0.43
GLOBAL HIGH INCOME
Henderson Diversified Income 105 1 113 1 124 2 149 2 188 2 9.09 6.22
Invesco Perpetual Enhanced Income Ltd 102 2 111 2 134 1 186 1 212 1 6.08 6.39
Average/Total 103 2 112 2 129 2 167 2 200 2 7.58 6.30
GLOBAL SMALLER COMPANIES
Marwyn Value Investors 100 3 118 3 84 2 146 2 175 2 5.16 -27.11
Marwyn Value Investors Realisation 128 1 151 1 - - - - - - - -26.19
Oryx International Growth 110 2 122 2 171 1 290 1 257 1 - -14.61
Average/Total 113 3 130 3 128 2 218 2 216 2 5.16 -22.64
HEDGE FUNDS
AcenciA Debt Strategies 100 9 105 8 128 3 168 5 137 7 3.44 -3.27
Alternative Liquidity Fund 136 1 214 1 - - - - - - - -40.48
BH Global GBP 107 4 105 9 110 8 120 9 - - - -6.45
BH Global USD 102 8 93 11 124 5 139 6 - - - -8.00
BH Macro GBP 104 6 94 10 98 9 102 10 154 6 - -6.85
BH Macro USD 100 10 89 12 116 7 126 8 226 2 - -8.40
Boussard & Gavaudan EUR 99 11 112 5 159 1 184 2 211 4 - -17.61
Boussard & Gavaudan GBP 106 5 111 6 142 2 178 3 - - - -15.29
Global Fixed Income Realisation 99 12 144 2 78 11 32 11 18 8 - -55.89
Highbridge Multi-Strategy Fund GBP 104 7 110 7 118 6 129 7 208 5 - -0.39
Third Point Offshore GBP 108 3 117 3 97 10 176 4 214 3 0.05 -17.88
Third Point Offshore USD 109 2 115 4 125 4 217 1 340 1 0.05 -14.81
Average/Total 106 12 117 12 118 11 143 11 188 8 1.18 -16.28
JAPAN
Aberdeen Japan 114 5 122 4 142 4 204 4 292 2 0.93 -9.14
Baillie Gifford Japan 123 1 147 1 219 1 393 1 455 1 - 6.45
CC Japan Income & Growth 116 4 138 2 - - - - - - 2.17 2.14
JPMorgan Japanese 118 2 135 3 191 2 281 2 273 4 1.14 -7.13
Schroder Japan Growth 117 3 120 5 181 3 272 3 274 3 1.56 -4.10
Average/Total 118 5 132 5 183 4 287 4 323 4 1.45 -2.36
JAPANESE SMALLER COMPANIES
Atlantis Japan Growth 126 2 152 2 185 4 250 4 265 2 - -7.38
Baillie Gifford Shin Nippon 128 1 154 1 287 1 446 1 584 1 - 10.10
FUND 6 MONTHS 1 YEAR 3 YEARS 5 YEARS 10 YEARS YIELD DISC£ £ £ £ £ % %
Fidelity Japanese Values 122 3 149 3 210 2 294 3 259 3 - -7.73
JPMorgan Japan Smaller Cos 118 4 145 4 210 3 305 2 227 4 - -9.45
Average/Total 123 4 150 4 223 4 324 4 334 4 - -3.62
LATIN AMERICA
Aberdeen Latin American Income 107 2 114 2 131 1 93 2 - - 4.75 -9.92
BlackRock Latin American 114 1 120 1 128 2 106 1 115 1 2.60 -12.39
Average/Total 110 2 117 2 130 2 99 2 115 1 3.68 -11.16
NORTH AMERICA
BlackRock North American 106 3 99 5 154 2 188 3 - - 4.92 -6.07
Gabelli Value Plus+ Trust 100 5 101 4 - - - - - - 0.92 -5.20
JPMorgan American 107 2 111 1 146 3 239 1 352 1 1.23 -4.31
Middlefield Canadian Income 103 4 104 3 117 4 124 4 227 3 5.02 -12.26
North American Income Trust 115 1 110 2 168 1 231 2 287 2 2.82 -5.49
Average/Total 106 5 105 5 146 4 195 4 289 3 2.98 -6.67
NORTH AMERICAN SMALLER COMPANIES
JPMorgan US Smaller Companies 110 1 108 1 177 1 298 1 404 1 - 3.20
Jupiter US Smaller Companies 108 2 99 3 133 3 170 3 335 2 - -8.04
North Atlantic Smaller Cos 104 3 107 2 151 2 206 2 249 3 - -20.73
Average/Total 107 3 104 3 154 3 225 3 329 3 - -8.52
PRIVATE EQUITY
3i 102 14 134 4 227 2 510 1 153 15 2.90 41.02
Aberdeen Private Equity 110 5 135 2 182 9 237 9 184 12 2.76 -2.34
Adamas Finance Asia 51 31 46 31 43 28 35 28 - - - -26.52
Apax Global Alpha 101 17 113 15 - - - - - - 5.70 -7.00
B.P.Marsh & Partners 113 4 123 6 201 5 231 10 222 7 1.53 -19.08
Better Capital PCC 2009 119 2 58 30 84 23 54 24 - - - -48.03
Better Capital PCC 2012 85 24 96 21 48 26 34 29 - - - -47.09
Candover Investments 83 26 122 7 29 29 35 27 7 25 - -28.10
Dunedin Enterprise 117 3 140 1 130 20 117 21 141 17 3.40 -13.23
EIH 93 22 76 25 106 22 142 19 147 16 - -33.76
Electra Private Equity 104 12 117 13 191 7 302 3 371 2 - -16.02
Energiser Investments 80 27 71 27 43 27 46 25 16 22 - 2.74
EPE Special Opportunities 74 28 87 23 203 4 420 2 81 19 - -25.53
F&C Private Equity Trust 101 16 119 12 178 11 230 11 241 6 3.42 -4.43
FastForward Innovations Limited 129 1 132 5 329 1 221 12 22 21 - 54.92
HarbourVest Global Priv Equity 99 19 108 18 156 16 261 6 - - - -18.65
HgCapital Trust 106 10 119 11 185 8 206 16 305 3 2.60 -2.52
ICG Enterprise Trust 109 7 121 8 154 17 204 18 203 9 2.50 -12.90
JPEL Private Equity 108 8 108 17 201 6 271 5 140 18 - -16.93
Livermore Investments 85 25 115 14 159 15 284 4 170 13 - -32.72
LMS Capital 94 21 87 22 61 25 73 23 70 20 - -35.30
Mithras 101 18 121 10 159 14 204 17 291 4 - -5.76
Northern Investors 58 30 66 28 135 19 210 15 376 1 13.61 -5.53
Oakley Capital Investments 96 20 102 20 111 21 125 20 168 14 2.74 -28.31
Pantheon International Ord PLC 103 13 107 19 147 18 211 13 222 8 - -15.48
Princess Private Equity 110 6 135 3 210 3 240 7 271 5 - -0.04
Qannas Investments 67 29 64 29 75 24 108 22 - - - -21.66
Reconstruction Capital II 101 15 80 24 180 10 43 26 15 23 - -21.91
St Peter Port Capital 92 23 75 26 23 30 19 30 11 24 8.57 -65.42
Standard Life Private Eq 106 11 121 8 175 12 238 8 190 11 3.53 -10.00
Symphony International Holding 108 9 110 16 160 13 210 14 199 10 4.15 -32.91
Average/Total 97 31 103 31 143 30 184 30 169 25 4.42 -16.08
PROPERTY DIRECT - ASIA PACIFIC
Alpha Real Trust 115 2 140 2 270 1 284 2 183 3 1.75 -17.04
Aseana Properties 99 4 93 5 136 4 160 5 77 6 - -23.97
Macau Property Opportunities 117 1 152 1 78 6 172 4 191 2 - -26.00
Pacific Alliance China Land 99 5 104 4 150 3 180 3 341 1 - -16.83
Trinity Capital 88 6 65 6 90 5 117 6 78 5 - -25.91
Vinaland 115 3 123 3 208 2 329 1 110 4 - -10.24
Average/Total 106 6 113 6 155 6 207 6 163 6 1.75 -20.00
PROPERTY DIRECT - EUROPE
Alpha Pyrenees Trust 90 8 90 7 5 8 1 7 0 6 - -99.00
AXA Property 95 6 93 6 136 2 158 1 105 1 - -9.42
FUND 6 MONTHS 1 YEAR 3 YEARS 5 YEARS 10 YEARS YIELD DISC FUND 6 MONTHS 1 YEAR 3 YEARS 5 YEARS 10 YEARS YIELD DISC £ £ £ £ £ % % £ £ £ £ £ % %
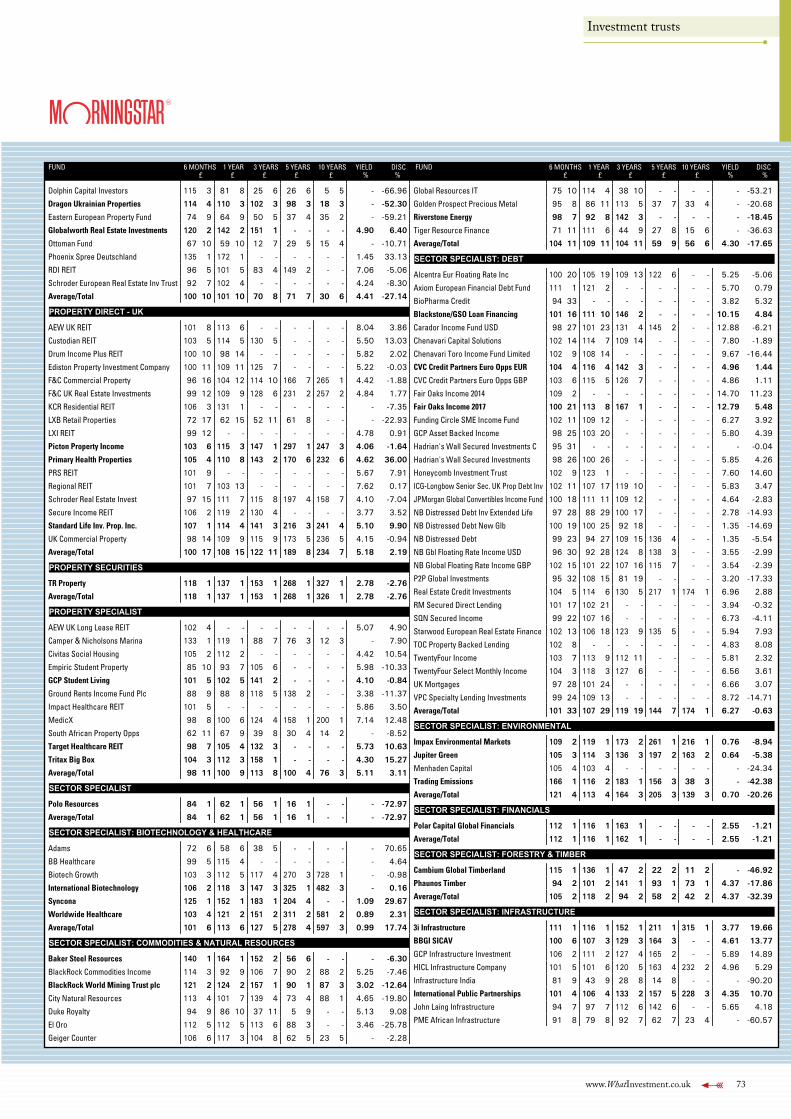
Investment trusts
www.WhatInvestment.co.uk 73
FUND 6 MONTHS 1 YEAR 3 YEARS 5 YEARS 10 YEARS YIELD DISC£ £ £ £ £ % %
Dolphin Capital Investors 115 3 81 8 25 6 26 6 5 5 - -66.96
Dragon Ukrainian Properties 114 4 110 3 102 3 98 3 18 3 - -52.30
Eastern European Property Fund 74 9 64 9 50 5 37 4 35 2 - -59.21
Globalworth Real Estate Investments 120 2 142 2 151 1 - - - - 4.90 6.40
Ottoman Fund 67 10 59 10 12 7 29 5 15 4 - -10.71
Phoenix Spree Deutschland 135 1 172 1 - - - - - - 1.45 33.13
RDI REIT 96 5 101 5 83 4 149 2 - - 7.06 -5.06
Schroder European Real Estate Inv Trust 92 7 102 4 - - - - - - 4.24 -8.30
Average/Total 100 10 101 10 70 8 71 7 30 6 4.41 -27.14
PROPERTY DIRECT - UK
AEW UK REIT 101 8 113 6 - - - - - - 8.04 3.86
Custodian REIT 103 5 114 5 130 5 - - - - 5.50 13.03
Drum Income Plus REIT 100 10 98 14 - - - - - - 5.82 2.02
Ediston Property Investment Company 100 11 109 11 125 7 - - - - 5.22 -0.03
F&C Commercial Property 96 16 104 12 114 10 166 7 265 1 4.42 -1.88
F&C UK Real Estate Investments 99 12 109 9 128 6 231 2 257 2 4.84 1.77
KCR Residential REIT 106 3 131 1 - - - - - - - -7.35
LXB Retail Properties 72 17 62 15 52 11 61 8 - - - -22.93
LXI REIT 99 12 - - - - - - - - 4.78 0.91
Picton Property Income 103 6 115 3 147 1 297 1 247 3 4.06 -1.64
Primary Health Properties 105 4 110 8 143 2 170 6 232 6 4.62 36.00
PRS REIT 101 9 - - - - - - - - 5.67 7.91
Regional REIT 101 7 103 13 - - - - - - 7.62 0.17
Schroder Real Estate Invest 97 15 111 7 115 8 197 4 158 7 4.10 -7.04
Secure Income REIT 106 2 119 2 130 4 - - - - 3.77 3.52
Standard Life Inv. Prop. Inc. 107 1 114 4 141 3 216 3 241 4 5.10 9.90
UK Commercial Property 98 14 109 9 115 9 173 5 236 5 4.15 -0.94
Average/Total 100 17 108 15 122 11 189 8 234 7 5.18 2.19
PROPERTY SECURITIES
TR Property 118 1 137 1 153 1 268 1 327 1 2.78 -2.76
Average/Total 118 1 137 1 153 1 268 1 326 1 2.78 -2.76
PROPERTY SPECIALIST
AEW UK Long Lease REIT 102 4 - - - - - - - - 5.07 4.90
Camper & Nicholsons Marina 133 1 119 1 88 7 76 3 12 3 - 7.90
Civitas Social Housing 105 2 112 2 - - - - - - 4.42 10.54
Empiric Student Property 85 10 93 7 105 6 - - - - 5.98 -10.33
GCP Student Living 101 5 102 5 141 2 - - - - 4.10 -0.84
Ground Rents Income Fund Plc 88 9 88 8 118 5 138 2 - - 3.38 -11.37
Impact Healthcare REIT 101 5 - - - - - - - - 5.86 3.50
MedicX 98 8 100 6 124 4 158 1 200 1 7.14 12.48
South African Property Opps 62 11 67 9 39 8 30 4 14 2 - -8.52
Target Healthcare REIT 98 7 105 4 132 3 - - - - 5.73 10.63
Tritax Big Box 104 3 112 3 158 1 - - - - 4.30 15.27
Average/Total 98 11 100 9 113 8 100 4 76 3 5.11 3.11
SECTOR SPECIALIST
Polo Resources 84 1 62 1 56 1 16 1 - - - -72.97
Average/Total 84 1 62 1 56 1 16 1 - - - -72.97
SECTOR SPECIALIST: BIOTECHNOLOGY & HEALTHCARE
Adams 72 6 58 6 38 5 - - - - - 70.65
BB Healthcare 99 5 115 4 - - - - - - - 4.64
Biotech Growth 103 3 112 5 117 4 270 3 728 1 - -0.98
International Biotechnology 106 2 118 3 147 3 325 1 482 3 - 0.16
Syncona 125 1 152 1 183 1 204 4 - - 1.09 29.67
Worldwide Healthcare 103 4 121 2 151 2 311 2 581 2 0.89 2.31
Average/Total 101 6 113 6 127 5 278 4 597 3 0.99 17.74
SECTOR SPECIALIST: COMMODITIES & NATURAL RESOURCES
Baker Steel Resources 140 1 164 1 152 2 56 6 - - - -6.30
BlackRock Commodities Income 114 3 92 9 106 7 90 2 88 2 5.25 -7.46
BlackRock World Mining Trust plc 121 2 124 2 157 1 90 1 87 3 3.02 -12.64
City Natural Resources 113 4 101 7 139 4 73 4 88 1 4.65 -19.80
Duke Royalty 94 9 86 10 37 11 5 9 - - 5.13 9.08
El Oro 112 5 112 5 113 6 88 3 - - 3.46 -25.78
Geiger Counter 106 6 117 3 104 8 62 5 23 5 - -2.28
FUND 6 MONTHS 1 YEAR 3 YEARS 5 YEARS 10 YEARS YIELD DISC£ £ £ £ £ % %
Global Resources IT 75 10 114 4 38 10 - - - - - -53.21
Golden Prospect Precious Metal 95 8 86 11 113 5 37 7 33 4 - -20.68
Riverstone Energy 98 7 92 8 142 3 - - - - - -18.45
Tiger Resource Finance 71 11 111 6 44 9 27 8 15 6 - -36.63
Average/Total 104 11 109 11 104 11 59 9 56 6 4.30 -17.65
SECTOR SPECIALIST: DEBT
Alcentra Eur Floating Rate Inc 100 20 105 19 109 13 122 6 - - 5.25 -5.06
Axiom European Financial Debt Fund 111 1 121 2 - - - - - - 5.70 0.79
BioPharma Credit 94 33 - - - - - - - - 3.82 5.32
Blackstone/GSO Loan Financing 101 16 111 10 146 2 - - - - 10.15 4.84
Carador Income Fund USD 98 27 101 23 131 4 145 2 - - 12.88 -6.21
Chenavari Capital Solutions 102 14 114 7 109 14 - - - - 7.80 -1.89
Chenavari Toro Income Fund Limited 102 9 108 14 - - - - - - 9.67 -16.44
CVC Credit Partners Euro Opps EUR 104 4 116 4 142 3 - - - - 4.96 1.44
CVC Credit Partners Euro Opps GBP 103 6 115 5 126 7 - - - - 4.86 1.11
Fair Oaks Income 2014 109 2 - - - - - - - - 14.70 11.23
Fair Oaks Income 2017 100 21 113 8 167 1 - - - - 12.79 5.48
Funding Circle SME Income Fund 102 11 109 12 - - - - - - 6.27 3.92
GCP Asset Backed Income 98 25 103 20 - - - - - - 5.80 4.39
Hadrian's Wall Secured Investments C 95 31 - - - - - - - - - -0.04
Hadrian's Wall Secured Investments 98 26 100 26 - - - - - - 5.85 4.26
Honeycomb Investment Trust 102 9 123 1 - - - - - - 7.60 14.60
ICG-Longbow Senior Sec. UK Prop Debt Inv 102 11 107 17 119 10 - - - - 5.83 3.47
JPMorgan Global Convertibles Income Fund 100 18 111 11 109 12 - - - - 4.64 -2.83
NB Distressed Debt Inv Extended Life 97 28 88 29 100 17 - - - - 2.78 -14.93
NB Distressed Debt New Glb 100 19 100 25 92 18 - - - - 1.35 -14.69
NB Distressed Debt 99 23 94 27 109 15 136 4 - - 1.35 -5.54
NB Gbl Floating Rate Income USD 96 30 92 28 124 8 138 3 - - 3.55 -2.99
NB Global Floating Rate Income GBP 102 15 101 22 107 16 115 7 - - 3.54 -2.39
P2P Global Investments 95 32 108 15 81 19 - - - - 3.20 -17.33
Real Estate Credit Investments 104 5 114 6 130 5 217 1 174 1 6.96 2.88
RM Secured Direct Lending 101 17 102 21 - - - - - - 3.94 -0.32
SQN Secured Income 99 22 107 16 - - - - - - 6.73 -4.11
Starwood European Real Estate Finance 102 13 106 18 123 9 135 5 - - 5.94 7.93
TOC Property Backed Lending 102 8 - - - - - - - - 4.83 8.08
TwentyFour Income 103 7 113 9 112 11 - - - - 5.81 2.32
TwentyFour Select Monthly Income 104 3 118 3 127 6 - - - - 6.56 3.61
UK Mortgages 97 28 101 24 - - - - - - 6.66 3.07
VPC Specialty Lending Investments 99 24 109 13 - - - - - - 8.72 -14.71
Average/Total 101 33 107 29 119 19 144 7 174 1 6.27 -0.63
SECTOR SPECIALIST: ENVIRONMENTAL
Impax Environmental Markets 109 2 119 1 173 2 261 1 216 1 0.76 -8.94
Jupiter Green 105 3 114 3 136 3 197 2 163 2 0.64 -5.38
Menhaden Capital 105 4 103 4 - - - - - - - -24.34
Trading Emissions 166 1 116 2 183 1 156 3 38 3 - -42.38
Average/Total 121 4 113 4 164 3 205 3 139 3 0.70 -20.26
SECTOR SPECIALIST: FINANCIALS
Polar Capital Global Financials 112 1 116 1 163 1 - - - - 2.55 -1.21
Average/Total 112 1 116 1 162 1 - - - - 2.55 -1.21
SECTOR SPECIALIST: FORESTRY & TIMBER
Cambium Global Timberland 115 1 136 1 47 2 22 2 11 2 - -46.92
Phaunos Timber 94 2 101 2 141 1 93 1 73 1 4.37 -17.86
Average/Total 105 2 118 2 94 2 58 2 42 2 4.37 -32.39
SECTOR SPECIALIST: INFRASTRUCTURE
3i Infrastructure 111 1 116 1 152 1 211 1 315 1 3.77 19.66
BBGI SICAV 100 6 107 3 129 3 164 3 - - 4.61 13.77
GCP Infrastructure Investment 106 2 111 2 127 4 165 2 - - 5.89 14.89
HICL Infrastructure Company 101 5 101 6 120 5 163 4 232 2 4.96 5.29
Infrastructure India 81 9 43 9 28 8 14 8 - - - -90.20
International Public Partnerships 101 4 106 4 133 2 157 5 228 3 4.35 10.70
John Laing Infrastructure 94 7 97 7 112 6 142 6 - - 5.65 4.18
PME African Infrastructure 91 8 79 8 92 7 62 7 23 4 - -60.57
FUND 6 MONTHS 1 YEAR 3 YEARS 5 YEARS 10 YEARS YIELD DISC FUND 6 MONTHS 1 YEAR 3 YEARS 5 YEARS 10 YEARS YIELD DISC £ £ £ £ £ % % £ £ £ £ £ % %
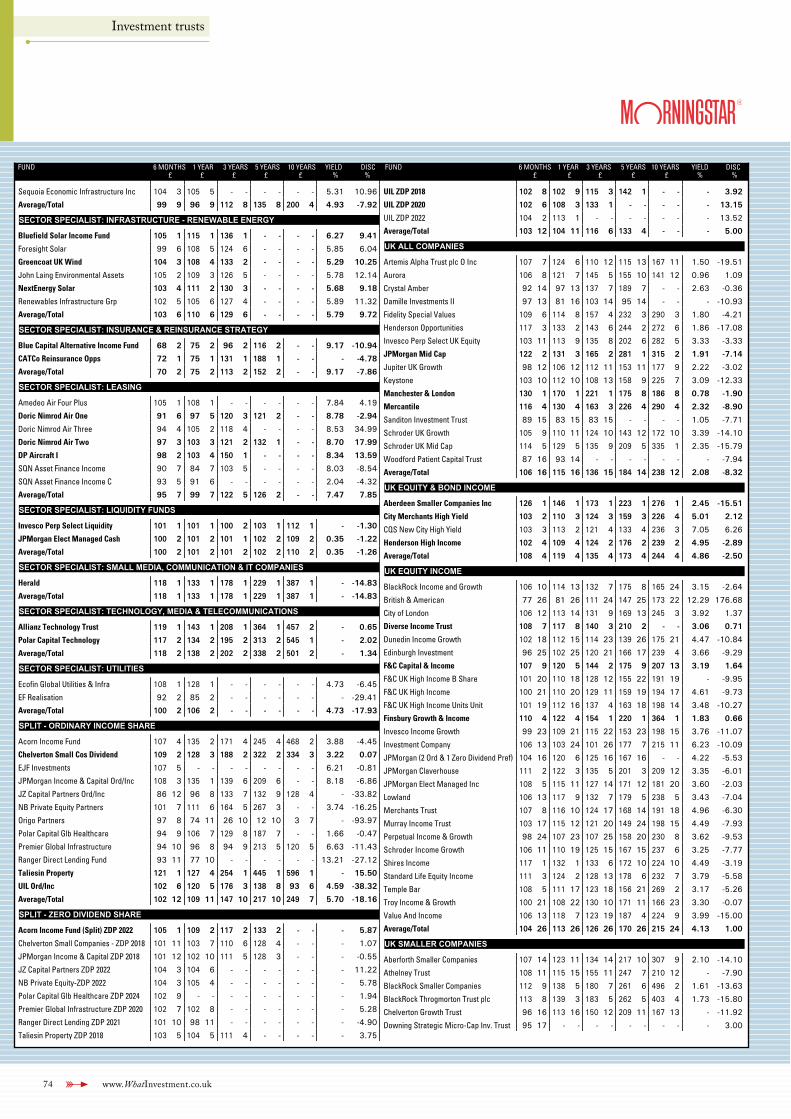
Investment trusts
74 www.WhatInvestment.co.uk
FUND 6 MONTHS 1 YEAR 3 YEARS 5 YEARS 10 YEARS YIELD DISC£ £ £ £ £ % %
Sequoia Economic Infrastructure Inc 104 3 105 5 - - - - - - 5.31 10.96
Average/Total 99 9 96 9 112 8 135 8 200 4 4.93 -7.92
SECTOR SPECIALIST: INFRASTRUCTURE - RENEWABLE ENERGY
Bluefield Solar Income Fund 105 1 115 1 136 1 - - - - 6.27 9.41
Foresight Solar 99 6 108 5 124 6 - - - - 5.85 6.04
Greencoat UK Wind 104 3 108 4 133 2 - - - - 5.29 10.25
John Laing Environmental Assets 105 2 109 3 126 5 - - - - 5.78 12.14
NextEnergy Solar 103 4 111 2 130 3 - - - - 5.68 9.18
Renewables Infrastructure Grp 102 5 105 6 127 4 - - - - 5.89 11.32
Average/Total 103 6 110 6 129 6 - - - - 5.79 9.72
SECTOR SPECIALIST: INSURANCE & REINSURANCE STRATEGY
Blue Capital Alternative Income Fund 68 2 75 2 96 2 116 2 - - 9.17 -10.94
CATCo Reinsurance Opps 72 1 75 1 131 1 188 1 - - - -4.78
Average/Total 70 2 75 2 113 2 152 2 - - 9.17 -7.86
SECTOR SPECIALIST: LEASING
Amedeo Air Four Plus 105 1 108 1 - - - - - - 7.84 4.19
Doric Nimrod Air One 91 6 97 5 120 3 121 2 - - 8.78 -2.94
Doric Nimrod Air Three 94 4 105 2 118 4 - - - - 8.53 34.99
Doric Nimrod Air Two 97 3 103 3 121 2 132 1 - - 8.70 17.99
DP Aircraft I 98 2 103 4 150 1 - - - - 8.34 13.59
SQN Asset Finance Income 90 7 84 7 103 5 - - - - 8.03 -8.54
SQN Asset Finance Income C 93 5 91 6 - - - - - - 2.04 -4.32
Average/Total 95 7 99 7 122 5 126 2 - - 7.47 7.85
SECTOR SPECIALIST: LIQUIDITY FUNDS
Invesco Perp Select Liquidity 101 1 101 1 100 2 103 1 112 1 - -1.30
JPMorgan Elect Managed Cash 100 2 101 2 101 1 102 2 109 2 0.35 -1.22
Average/Total 100 2 101 2 101 2 102 2 110 2 0.35 -1.26
SECTOR SPECIALIST: SMALL MEDIA, COMMUNICATION & IT COMPANIES
Herald 118 1 133 1 178 1 229 1 387 1 - -14.83
Average/Total 118 1 133 1 178 1 229 1 387 1 - -14.83
SECTOR SPECIALIST: TECHNOLOGY, MEDIA & TELECOMMUNICATIONS
Allianz Technology Trust 119 1 143 1 208 1 364 1 457 2 - 0.65
Polar Capital Technology 117 2 134 2 195 2 313 2 545 1 - 2.02
Average/Total 118 2 138 2 202 2 338 2 501 2 - 1.34
SECTOR SPECIALIST: UTILITIES
Ecofin Global Utilities & Infra 108 1 128 1 - - - - - - 4.73 -6.45
EF Realisation 92 2 85 2 - - - - - - - -29.41
Average/Total 100 2 106 2 - - - - - - 4.73 -17.93
SPLIT - ORDINARY INCOME SHARE
Acorn Income Fund 107 4 135 2 171 4 245 4 468 2 3.88 -4.45
Chelverton Small Cos Dividend 109 2 128 3 188 2 322 2 334 3 3.22 0.07
EJF Investments 107 5 - - - - - - - - 6.21 -0.81
JPMorgan Income & Capital Ord/Inc 108 3 135 1 139 6 209 6 - - 8.18 -6.86
JZ Capital Partners Ord/Inc 86 12 96 8 133 7 132 9 128 4 - -33.82
NB Private Equity Partners 101 7 111 6 164 5 267 3 - - 3.74 -16.25
Origo Partners 97 8 74 11 26 10 12 10 3 7 - -93.97
Polar Capital Glb Healthcare 94 9 106 7 129 8 187 7 - - 1.66 -0.47
Premier Global Infrastructure 94 10 96 8 94 9 213 5 120 5 6.63 -11.43
Ranger Direct Lending Fund 93 11 77 10 - - - - - - 13.21 -27.12
Taliesin Property 121 1 127 4 254 1 445 1 596 1 - 15.50
UIL Ord/Inc 102 6 120 5 176 3 138 8 93 6 4.59 -38.32
Average/Total 102 12 109 11 147 10 217 10 249 7 5.70 -18.16
SPLIT - ZERO DIVIDEND SHARE
Acorn Income Fund (Split) ZDP 2022 105 1 109 2 117 2 133 2 - - - 5.87
Chelverton Small Companies - ZDP 2018 101 11 103 7 110 6 128 4 - - - 1.07
JPMorgan Income & Capital ZDP 2018 101 12 102 10 111 5 128 3 - - - -0.55
JZ Capital Partners ZDP 2022 104 3 104 6 - - - - - - - 11.22
NB Private Equity-ZDP 2022 104 3 105 4 - - - - - - - 5.78
Polar Capital Glb Healthcare ZDP 2024 102 9 - - - - - - - - - 1.94
Premier Global Infrastructure ZDP 2020 102 7 102 8 - - - - - - - 5.28
Ranger Direct Lending ZDP 2021 101 10 98 11 - - - - - - - -4.90
Taliesin Property ZDP 2018 103 5 104 5 111 4 - - - - - 3.75
FUND 6 MONTHS 1 YEAR 3 YEARS 5 YEARS 10 YEARS YIELD DISC£ £ £ £ £ % %
UIL ZDP 2018 102 8 102 9 115 3 142 1 - - - 3.92
UIL ZDP 2020 102 6 108 3 133 1 - - - - - 13.15
UIL ZDP 2022 104 2 113 1 - - - - - - - 13.52
Average/Total 103 12 104 11 116 6 133 4 - - - 5.00
UK ALL COMPANIES
Artemis Alpha Trust plc O Inc 107 7 124 6 110 12 115 13 167 11 1.50 -19.51
Aurora 106 8 121 7 145 5 155 10 141 12 0.96 1.09
Crystal Amber 92 14 97 13 137 7 189 7 - - 2.63 -0.36
Damille Investments II 97 13 81 16 103 14 95 14 - - - -10.93
Fidelity Special Values 109 6 114 8 157 4 232 3 290 3 1.80 -4.21
Henderson Opportunities 117 3 133 2 143 6 244 2 272 6 1.86 -17.08
Invesco Perp Select UK Equity 103 11 113 9 135 8 202 6 282 5 3.33 -3.33
JPMorgan Mid Cap 122 2 131 3 165 2 281 1 315 2 1.91 -7.14
Jupiter UK Growth 98 12 106 12 112 11 153 11 177 9 2.22 -3.02
Keystone 103 10 112 10 108 13 158 9 225 7 3.09 -12.33
Manchester & London 130 1 170 1 221 1 175 8 186 8 0.78 -1.90
Mercantile 116 4 130 4 163 3 226 4 290 4 2.32 -8.90
Sanditon Investment Trust 89 15 83 15 83 15 - - - - 1.05 -7.71
Schroder UK Growth 105 9 110 11 124 10 143 12 172 10 3.39 -14.10
Schroder UK Mid Cap 114 5 129 5 135 9 209 5 335 1 2.35 -15.79
Woodford Patient Capital Trust 87 16 93 14 - - - - - - - -7.94
Average/Total 106 16 115 16 136 15 184 14 238 12 2.08 -8.32
UK EQUITY & BOND INCOME
Aberdeen Smaller Companies Inc 126 1 146 1 173 1 223 1 276 1 2.45 -15.51
City Merchants High Yield 103 2 110 3 124 3 159 3 226 4 5.01 2.12
CQS New City High Yield 103 3 113 2 121 4 133 4 236 3 7.05 6.26
Henderson High Income 102 4 109 4 124 2 176 2 239 2 4.95 -2.89
Average/Total 108 4 119 4 135 4 173 4 244 4 4.86 -2.50
UK EQUITY INCOME
BlackRock Income and Growth 106 10 114 13 132 7 175 8 165 24 3.15 -2.64
British & American 77 26 81 26 111 24 147 25 173 22 12.29 176.68
City of London 106 12 113 14 131 9 169 13 245 3 3.92 1.37
Diverse Income Trust 108 7 117 8 140 3 210 2 - - 3.06 0.71
Dunedin Income Growth 102 18 112 15 114 23 139 26 175 21 4.47 -10.84
Edinburgh Investment 96 25 102 25 120 21 166 17 239 4 3.66 -9.29
F&C Capital & Income 107 9 120 5 144 2 175 9 207 13 3.19 1.64
F&C UK High Income B Share 101 20 110 18 128 12 155 22 191 19 - -9.95
F&C UK High Income 100 21 110 20 129 11 159 19 194 17 4.61 -9.73
F&C UK High Income Units Unit 101 19 112 16 137 4 163 18 198 14 3.48 -10.27
Finsbury Growth & Income 110 4 122 4 154 1 220 1 364 1 1.83 0.66
Invesco Income Growth 99 23 109 21 115 22 153 23 198 15 3.76 -11.07
Investment Company 106 13 103 24 101 26 177 7 215 11 6.23 -10.09
JPMorgan (2 Ord & 1 Zero Dividend Pref) 104 16 120 6 125 16 167 16 - - 4.22 -5.53
JPMorgan Claverhouse 111 2 122 3 135 5 201 3 209 12 3.35 -6.01
JPMorgan Elect Managed Inc 108 5 115 11 127 14 171 12 181 20 3.60 -2.03
Lowland 106 13 117 9 132 7 179 5 238 5 3.43 -7.04
Merchants Trust 107 8 116 10 124 17 168 14 191 18 4.96 -6.30
Murray Income Trust 103 17 115 12 121 20 149 24 198 15 4.49 -7.93
Perpetual Income & Growth 98 24 107 23 107 25 158 20 230 8 3.62 -9.53
Schroder Income Growth 106 11 110 19 125 15 167 15 237 6 3.25 -7.77
Shires Income 117 1 132 1 133 6 172 10 224 10 4.49 -3.19
Standard Life Equity Income 111 3 124 2 128 13 178 6 232 7 3.79 -5.58
Temple Bar 108 5 111 17 123 18 156 21 269 2 3.17 -5.26
Troy Income & Growth 100 21 108 22 130 10 171 11 166 23 3.30 -0.07
Value And Income 106 13 118 7 123 19 187 4 224 9 3.99 -15.00
Average/Total 104 26 113 26 126 26 170 26 215 24 4.13 1.00
UK SMALLER COMPANIES
Aberforth Smaller Companies 107 14 123 11 134 14 217 10 307 9 2.10 -14.10
Athelney Trust 108 11 115 15 155 11 247 7 210 12 - -7.90
BlackRock Smaller Companies 112 9 138 5 180 7 261 6 496 2 1.61 -13.63
BlackRock Throgmorton Trust plc 113 8 139 3 183 5 262 5 403 4 1.73 -15.80
Chelverton Growth Trust 96 16 113 16 150 12 209 11 167 13 - -11.92
Downing Strategic Micro-Cap Inv. Trust 95 17 - - - - - - - - - 3.00
FUND 6 MONTHS 1 YEAR 3 YEARS 5 YEARS 10 YEARS YIELD DISC FUND 6 MONTHS 1 YEAR 3 YEARS 5 YEARS 10 YEARS YIELD DISC £ £ £ £ £ % % £ £ £ £ £ % %
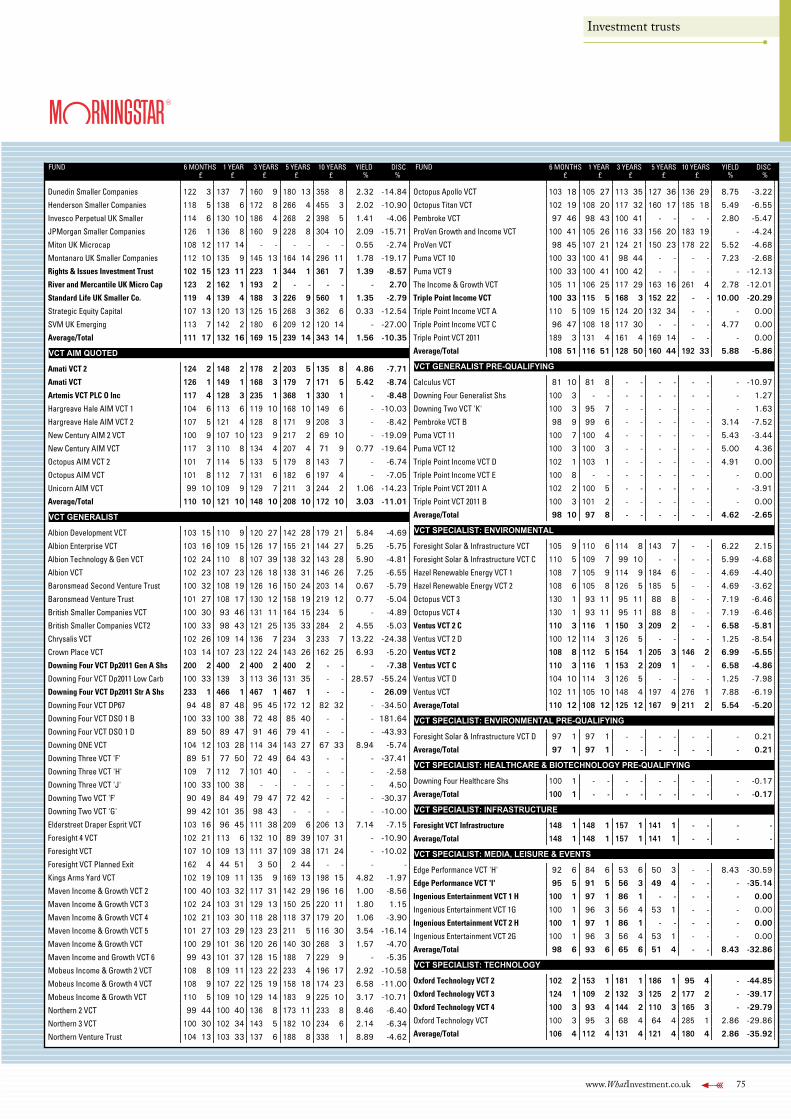
Investment trusts
www.WhatInvestment.co.uk 75
FUND 6 MONTHS 1 YEAR 3 YEARS 5 YEARS 10 YEARS YIELD DISC£ £ £ £ £ % %
Dunedin Smaller Companies 122 3 137 7 160 9 180 13 358 8 2.32 -14.84
Henderson Smaller Companies 118 5 138 6 172 8 266 4 455 3 2.02 -10.90
Invesco Perpetual UK Smaller 114 6 130 10 186 4 268 2 398 5 1.41 -4.06
JPMorgan Smaller Companies 126 1 136 8 160 9 228 8 304 10 2.09 -15.71
Miton UK Microcap 108 12 117 14 - - - - - - 0.55 -2.74
Montanaro UK Smaller Companies 112 10 135 9 145 13 164 14 296 11 1.78 -19.17
Rights & Issues Investment Trust 102 15 123 11 223 1 344 1 361 7 1.39 -8.57
River and Mercantile UK Micro Cap 123 2 162 1 193 2 - - - - - 2.70
Standard Life UK Smaller Co. 119 4 139 4 188 3 226 9 560 1 1.35 -2.79
Strategic Equity Capital 107 13 120 13 125 15 268 3 362 6 0.33 -12.54
SVM UK Emerging 113 7 142 2 180 6 209 12 120 14 - -27.00
Average/Total 111 17 132 16 169 15 239 14 343 14 1.56 -10.35
VCT AIM QUOTED
Amati VCT 2 124 2 148 2 178 2 203 5 135 8 4.86 -7.71
Amati VCT 126 1 149 1 168 3 179 7 171 5 5.42 -8.74
Artemis VCT PLC O Inc 117 4 128 3 235 1 368 1 330 1 - -8.48
Hargreave Hale AIM VCT 1 104 6 113 6 119 10 168 10 149 6 - -10.03
Hargreave Hale AIM VCT 2 107 5 121 4 128 8 171 9 208 3 - -8.42
New Century AIM 2 VCT 100 9 107 10 123 9 217 2 69 10 - -19.09
New Century AIM VCT 117 3 110 8 134 4 207 4 71 9 0.77 -19.64
Octopus AIM VCT 2 101 7 114 5 133 5 179 8 143 7 - -6.74
Octopus AIM VCT 101 8 112 7 131 6 182 6 197 4 - -7.05
Unicorn AIM VCT 99 10 109 9 129 7 211 3 244 2 1.06 -14.23
Average/Total 110 10 121 10 148 10 208 10 172 10 3.03 -11.01
VCT GENERALIST
Albion Development VCT 103 15 110 9 120 27 142 28 179 21 5.84 -4.69
Albion Enterprise VCT 103 16 109 15 126 17 155 21 144 27 5.25 -5.75
Albion Technology & Gen VCT 102 24 110 8 107 39 138 32 143 28 5.90 -4.81
Albion VCT 102 23 107 23 126 18 138 31 146 26 7.25 -6.55
Baronsmead Second Venture Trust 100 32 108 19 126 16 150 24 203 14 0.67 -5.79
Baronsmead Venture Trust 101 27 108 17 130 12 158 19 219 12 0.77 -5.04
British Smaller Companies VCT 100 30 93 46 131 11 164 15 234 5 - -4.89
British Smaller Companies VCT2 100 33 98 43 121 25 135 33 284 2 4.55 -5.03
Chrysalis VCT 102 26 109 14 136 7 234 3 233 7 13.22 -24.38
Crown Place VCT 103 14 107 23 122 24 143 26 162 25 6.93 -5.20
Downing Four VCT Dp2011 Gen A Shs 200 2 400 2 400 2 400 2 - - - -7.38
Downing Four VCT Dp2011 Low Carb 100 33 139 3 113 36 131 35 - - 28.57 -55.24
Downing Four VCT Dp2011 Str A Shs 233 1 466 1 467 1 467 1 - - - 26.09
Downing Four VCT DP67 94 48 87 48 95 45 172 12 82 32 - -34.50
Downing Four VCT DSO 1 B 100 33 100 38 72 48 85 40 - - - 181.64
Downing Four VCT DSO 1 D 89 50 89 47 91 46 79 41 - - - -43.93
Downing ONE VCT 104 12 103 28 114 34 143 27 67 33 8.94 -5.74
Downing Three VCT 'F' 89 51 77 50 72 49 64 43 - - - -37.41
Downing Three VCT 'H' 109 7 112 7 101 40 - - - - - -2.58
Downing Three VCT 'J' 100 33 100 38 - - - - - - - 4.50
Downing Two VCT 'F' 90 49 84 49 79 47 72 42 - - - -30.37
Downing Two VCT 'G' 99 42 101 35 98 43 - - - - - -10.00
Elderstreet Draper Esprit VCT 103 16 96 45 111 38 209 6 206 13 7.14 -7.15
Foresight 4 VCT 102 21 113 6 132 10 89 39 107 31 - -10.90
Foresight VCT 107 10 109 13 111 37 109 38 171 24 - -10.02
Foresight VCT Planned Exit 162 4 44 51 3 50 2 44 - - - -
Kings Arms Yard VCT 102 19 109 11 135 9 169 13 198 15 4.82 -1.97
Maven Income & Growth VCT 2 100 40 103 32 117 31 142 29 196 16 1.00 -8.56
Maven Income & Growth VCT 3 102 24 103 31 129 13 150 25 220 11 1.80 1.15
Maven Income & Growth VCT 4 102 21 103 30 118 28 118 37 179 20 1.06 -3.90
Maven Income & Growth VCT 5 101 27 103 29 123 23 211 5 116 30 3.54 -16.14
Maven Income & Growth VCT 100 29 101 36 120 26 140 30 268 3 1.57 -4.70
Maven Income and Growth VCT 6 99 43 101 37 128 15 188 7 229 9 - -5.35
Mobeus Income & Growth 2 VCT 108 8 109 11 123 22 233 4 196 17 2.92 -10.58
Mobeus Income & Growth 4 VCT 108 9 107 22 125 19 158 18 174 23 6.58 -11.00
Mobeus Income & Growth VCT 110 5 109 10 129 14 183 9 225 10 3.17 -10.71
Northern 2 VCT 99 44 100 40 136 8 173 11 233 8 8.46 -6.40
Northern 3 VCT 100 30 102 34 143 5 182 10 234 6 2.14 -6.34
Northern Venture Trust 104 13 103 33 137 6 188 8 338 1 8.89 -4.62
FUND 6 MONTHS 1 YEAR 3 YEARS 5 YEARS 10 YEARS YIELD DISC£ £ £ £ £ % %
Octopus Apollo VCT 103 18 105 27 113 35 127 36 136 29 8.75 -3.22
Octopus Titan VCT 102 19 108 20 117 32 160 17 185 18 5.49 -6.55
Pembroke VCT 97 46 98 43 100 41 - - - - 2.80 -5.47
ProVen Growth and Income VCT 100 41 105 26 116 33 156 20 183 19 - -4.24
ProVen VCT 98 45 107 21 124 21 150 23 178 22 5.52 -4.68
Puma VCT 10 100 33 100 41 98 44 - - - - 7.23 -2.68
Puma VCT 9 100 33 100 41 100 42 - - - - - -12.13
The Income & Growth VCT 105 11 106 25 117 29 163 16 261 4 2.78 -12.01
Triple Point Income VCT 100 33 115 5 168 3 152 22 - - 10.00 -20.29
Triple Point Income VCT A 110 5 109 15 124 20 132 34 - - - 0.00
Triple Point Income VCT C 96 47 108 18 117 30 - - - - 4.77 0.00
Triple Point VCT 2011 189 3 131 4 161 4 169 14 - - - 0.00
Average/Total 108 51 116 51 128 50 160 44 192 33 5.88 -5.86
VCT GENERALIST PRE-QUALIFYING
Calculus VCT 81 10 81 8 - - - - - - - -10.97
Downing Four Generalist Shs 100 3 - - - - - - - - - 1.27
Downing Two VCT 'K' 100 3 95 7 - - - - - - - 1.63
Pembroke VCT B 98 9 99 6 - - - - - - 3.14 -7.52
Puma VCT 11 100 7 100 4 - - - - - - 5.43 -3.44
Puma VCT 12 100 3 100 3 - - - - - - 5.00 4.36
Triple Point Income VCT D 102 1 103 1 - - - - - - 4.91 0.00
Triple Point Income VCT E 100 8 - - - - - - - - - 0.00
Triple Point VCT 2011 A 102 2 100 5 - - - - - - - -3.91
Triple Point VCT 2011 B 100 3 101 2 - - - - - - - 0.00
Average/Total 98 10 97 8 - - - - - - 4.62 -2.65
VCT SPECIALIST: ENVIRONMENTAL
Foresight Solar & Infrastructure VCT 105 9 110 6 114 8 143 7 - - 6.22 2.15
Foresight Solar & Infrastructure VCT C 110 5 109 7 99 10 - - - - 5.99 -4.68
Hazel Renewable Energy VCT 1 108 7 105 9 114 9 184 6 - - 4.69 -4.40
Hazel Renewable Energy VCT 2 108 6 105 8 126 5 185 5 - - 4.69 -3.62
Octopus VCT 3 130 1 93 11 95 11 88 8 - - 7.19 -6.46
Octopus VCT 4 130 1 93 11 95 11 88 8 - - 7.19 -6.46
Ventus VCT 2 C 110 3 116 1 150 3 209 2 - - 6.58 -5.81
Ventus VCT 2 D 100 12 114 3 126 5 - - - - 1.25 -8.54
Ventus VCT 2 108 8 112 5 154 1 205 3 146 2 6.99 -5.55
Ventus VCT C 110 3 116 1 153 2 209 1 - - 6.58 -4.86
Ventus VCT D 104 10 114 3 126 5 - - - - 1.25 -7.98
Ventus VCT 102 11 105 10 148 4 197 4 276 1 7.88 -6.19
Average/Total 110 12 108 12 125 12 167 9 211 2 5.54 -5.20
VCT SPECIALIST: ENVIRONMENTAL PRE-QUALIFYING
Foresight Solar & Infrastructure VCT D 97 1 97 1 - - - - - - - 0.21
Average/Total 97 1 97 1 - - - - - - - 0.21
VCT SPECIALIST: HEALTHCARE & BIOTECHNOLOGY PRE-QUALIFYING
Downing Four Healthcare Shs 100 1 - - - - - - - - - -0.17
Average/Total 100 1 - - - - - - - - - -0.17
VCT SPECIALIST: INFRASTRUCTURE
Foresight VCT Infrastructure 148 1 148 1 157 1 141 1 - - - -
Average/Total 148 1 148 1 157 1 141 1 - - - -
VCT SPECIALIST: MEDIA, LEISURE & EVENTS
Edge Performance VCT 'H' 92 6 84 6 53 6 50 3 - - 8.43 -30.59
Edge Performance VCT 'I' 95 5 91 5 56 3 49 4 - - - -35.14
Ingenious Entertainment VCT 1 H 100 1 97 1 86 1 - - - - - 0.00
Ingenious Entertainment VCT 1G 100 1 96 3 56 4 53 1 - - - 0.00
Ingenious Entertainment VCT 2 H 100 1 97 1 86 1 - - - - - 0.00
Ingenious Entertainment VCT 2G 100 1 96 3 56 4 53 1 - - - 0.00
Average/Total 98 6 93 6 65 6 51 4 - - 8.43 -32.86
VCT SPECIALIST: TECHNOLOGY
Oxford Technology VCT 2 102 2 153 1 181 1 186 1 95 4 - -44.85
Oxford Technology VCT 3 124 1 109 2 132 3 125 2 177 2 - -39.17
Oxford Technology VCT 4 100 3 93 4 144 2 110 3 165 3 - -29.79
Oxford Technology VCT 100 3 95 3 68 4 64 4 285 1 2.86 -29.86
Average/Total 106 4 112 4 131 4 121 4 180 4 2.86 -35.92
FUND 6 MONTHS 1 YEAR 3 YEARS 5 YEARS 10 YEARS YIELD DISC FUND 6 MONTHS 1 YEAR 3 YEARS 5 YEARS 10 YEARS YIELD DISC £ £ £ £ £ % % £ £ £ £ £ % %
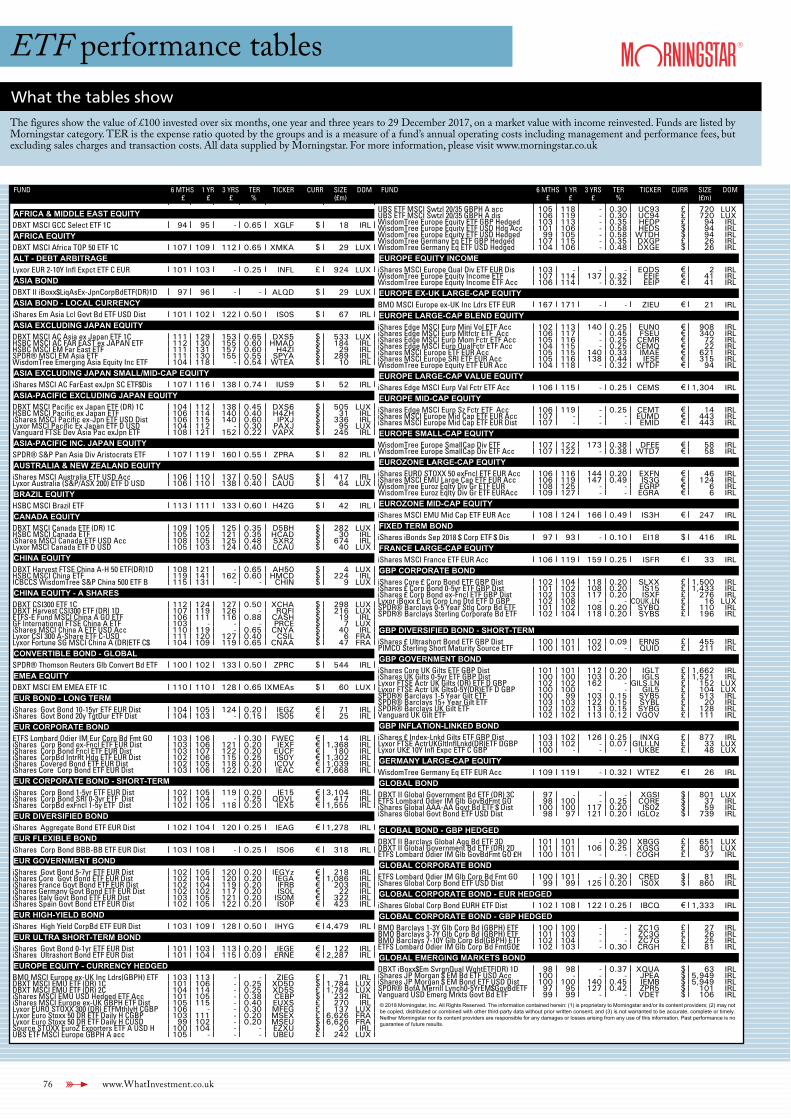
76 www.WhatInvestment.co.uk
ETF performance tablesWhat the tables show
The figures show the value of £100 invested over six months, one year and three years to 29 December 2017, on a market value with income reinvested. Funds are listed by Morningstar category. TER is the expense ratio quoted by the groups and is a measure of a fund’s annual operating costs including management and performance fees, but excluding sales charges and transaction costs. All data supplied by Morningstar. For more information, please visit www.morningstar.co.uk
FUND 6 MTHS 1 YR 3 YRS TER TICKER CURR SIZE DOM£ £ £ % (£m)
AFRICA & MIDDLE EAST EQUITYDBXT MSCI GCC Select ETF 1C 94 95 - 0.65 XGLF $ 18 IRLAFRICA EQUITYDBXT MSCI Africa TOP 50 ETF 1C 107 109 112 0.65 XMKA $ 29 LUXALT - DEBT ARBITRAGELyxor EUR 2-10Y Infl Expct ETF C EUR 101 103 - 0.25 INFL £ 924 LUXASIA BONDDBXT II iBoxx$LiqAsEx-JpnCorpBdETF(DR)1D 97 96 - - ALQD $ 29 LUXASIA BOND - LOCAL CURRENCYiShares Em Asia Lcl Govt Bd ETF USD Dist 101 102 122 0.50 IS0S $ 67 IRLASIA EXCLUDING JAPAN EQUITYDBXT MSCI AC Asia ex Japan ETF 1C 111 129 153 0.65 DXS5 $ 533 LUXHSBC MSCI AC FAR EAST ex JAPAN ETF 112 130 155 0.60 HMAD $ 184 IRLHSBC MSCI EM Far East ETF 111 131 157 0.60 H4ZI $ 29 IRLSPDR® MSCI EM Asia ETF 111 130 155 0.55 SPYA $ 289 IRLWisdomTree Emerging Asia Equity Inc ETF 104 118 - 0.54 WTEA $ 10 IRLASIA EXCLUDING JAPAN SMALL/MID-CAP EQUITYiShares MSCI AC FarEast exJpn SC ETF$Dis 107 116 138 0.74 IUS9 $ 52 IRLASIA-PACIFIC EXCLUDING JAPAN EQUITYDBXT MSCI Pacific ex Japan ETF (DR) 1C 104 112 138 0.45 DXS6 $ 505 LUXHSBC MSCI Pacific ex Japan ETF 106 114 140 0.40 H4ZH $ 31 IRLiShares MSCI Pacific ex-Jpn ETF USD Dist 106 115 140 0.60 IPXJ $ 336 IRLLyxor MSCI Pacific Ex Japan ETF D USD 104 112 - 0.30 PAXJ $ 95 LUXVanguard FTSE Dev Asia Pac exJpn ETF 108 121 152 0.22 VAPX $ 245 IRLASIA-PACIFIC INC. JAPAN EQUITYSPDR® S&P Pan Asia Div Aristocrats ETF 107 119 160 0.55 ZPRA $ 82 IRLAUSTRALIA & NEW ZEALAND EQUITYiShares MSCI Australia ETF USD Acc 106 110 137 0.50 SAUS $ 417 IRLLyxor Australia (S&P/ASX 200) ETF D USD 106 110 138 0.40 LAUU $ 64 LUXBRAZIL EQUITYHSBC MSCI Brazil ETF 113 111 133 0.60 H4ZG $ 42 IRLCANADA EQUITYDBXT MSCI Canada ETF (DR) 1C 109 105 125 0.35 D5BH $ 282 LUXHSBC MSCI Canada ETF 105 102 121 0.35 HCAD $ 30 IRLiShares MSCI Canada ETF USD Acc 108 105 125 0.48 SXR2 $ 674 IRLLyxor MSCI Canada ETF D USD 105 103 124 0.40 LCAU $ 40 LUXCHINA EQUITYDBXT Harvest FTSE China A-H 50 ETF(DR)1D 108 121 - 0.65 AH50 $ 4 LUXHSBC MSCI China ETF 119 141 162 0.60 HMCD $ 224 IRLICBCCS WisdomTree S&P China 500 ETF B 115 131 - - CHIN $ 9 LUXCHINA EQUITY - A SHARESDBXT CSI300 ETF 1C 112 124 127 0.50 XCHA $ 298 LUXDBXT Harvest CSI300 ETF (DR) 1D 107 119 126 - RQFI $ 216 LUXETFS-E Fund MSCI China A GO ETF 106 111 116 0.88 CASH $ 19 IRLGF International FTSE China A ETF 103 - - - PRCE $ 7 LUXiShares MSCI China A ETF USD Acc 110 119 - 0.65 CNYA $ 40 IRLLyxor CSI 300 A-Share ETF C-USD 111 120 127 0.40 CSIL $ 6 FRALyxor Fortune SG MSCI China A (DR)ETF C$ 104 109 119 0.65 CNAA $ 47 FRACONVERTIBLE BOND - GLOBALSPDR® Thomson Reuters Glb Convert Bd ETF 100 102 133 0.50 ZPRC $ 544 IRLEMEA EQUITYDBXT MSCI EM EMEA ETF 1C 110 110 128 0.65 XMEAs $ 60 LUXEUR BOND - LONG TERMiShares Govt Bond 10-15yr ETF EUR Dist 104 105 124 0.20 IEGZ € 71 IRLiShares Govt Bond 20y TgtDur ETF Dist 104 103 - 0.15 IS05 € 25 IRLEUR CORPORATE BONDETFS Lombard Odier IM Eur Corp Bd Fmt GO 103 106 - 0.30 FWEC € 14 IRLiShares Corp Bond ex-Fncl ETF EUR Dist 103 106 121 0.20 IEXF € 1,368 IRLiShares Corp Bond Fncl ETF EUR Dist 103 107 122 0.20 EUCF € 180 IRLiShares CorpBd IntrRt Hdg ETF EUR Dist 102 106 115 0.25 IS0Y € 1,302 IRLiShares Covered Bond ETF EUR Dist 102 105 118 0.20 ICOV € 1,039 IRLiShares Core Corp Bond ETF EUR Dist 103 106 122 0.20 IEAC € 7,668 IRLEUR CORPORATE BOND - SHORT-TERMiShares Corp Bond 1-5yr ETF EUR Dist 102 105 119 0.20 IE15 € 3,104 IRLiShares Corp Bond SRI 0-3yr ETF Dist 101 104 - 0.25 QDVL € 417 IRLiShares CorpBd exFncl 1-5y ETF Dist 102 105 118 0.20 IEX5 € 1,555 IRLEUR DIVERSIFIED BONDiShares Aggregate Bond ETF EUR Dist 102 104 120 0.25 IEAG € 1,278 IRLEUR FLEXIBLE BONDiShares Corp Bond BBB-BB ETF EUR Dist 103 108 - 0.25 IS06 € 318 IRLEUR GOVERNMENT BONDiShares Govt Bond 5-7yr ETF EUR Dist 102 105 120 0.20 IEGYz € 218 IRLiShares Core Govt Bond ETF EUR Dist 102 104 120 0.20 IEGA € 1,086 IRLiShares France Govt Bond ETF EUR Dist 102 104 119 0.20 IFRB € 203 IRLiShares Germany Govt Bond ETF EUR Dist 102 102 117 0.20 IS0L € 22 IRLiShares Italy Govt Bond ETF EUR Dist 103 105 121 0.20 IS0M € 322 IRLiShares Spain Govt Bond ETF EUR Dist 102 105 122 0.20 IS0P € 423 IRLEUR HIGH-YIELD BONDiShares High Yield CorpBd ETF EUR Dist 103 109 128 0.50 IHYG € 4,479 IRLEUR ULTRA SHORT-TERM BONDiShares Govt Bond 0-1yr ETF EUR Dist 101 103 113 0.20 IEGE € 122 IRLiShares Ultrashort Bond ETF EUR Dist 101 104 115 0.09 ERNE € 2,287 IRLEUROPE EQUITY - CURRENCY HEDGEDBMO MSCI Europe ex-UK Inc Ldrs(GBPH) ETF 103 113 - - ZIEG £ 71 IRLDBXT MSCI EMU ETF (DR) 1C 101 106 - 0.25 XD5D $ 1,784 LUXDBXT MSCI EMU ETF (DR) 2C 104 114 - 0.25 XD5S £ 1,784 LUXiShares MSCI EMU USD Hedged ETF Acc 101 105 - 0.38 CEBP $ 232 IRLiShares MSCI Europe ex-UK GBPH ETF Dist 105 115 - 0.40 EUXS £ 270 IRLLyxor EURO STOXX 300 (DR) ETFMthlyH CGBP 106 - - 0.30 MFEG £ 137 LUXLyxor Euro Stoxx 50 DR ETF Daily H CGBP 103 111 - 0.20 MSEX £ 6,626 FRALyxor Euro Stoxx 50 DR ETF Daily H CUSD 99 102 - 0.20 MSEU $ 6,626 FRASource STOXX EuroZ Exporters ETF A USD H 100 104 - - EZXU $ 20 IRLUBS ETF MSCI Europe GBPH A acc 105 - - - UBEU £ 242 LUX
FUND 6 MTHS 1 YR 3 YRS TER TICKER CURR SIZE DOM£ £ £ % (£m)
UBS ETF MSCI Swtzl 20/35 GBPH A acc 105 118 - 0.30 UC93 £ 720 LUXUBS ETF MSCI Swtzl 20/35 GBPH A dis 106 119 - 0.30 UC94 £ 720 LUXWisdomTree Europe Equity ETF GBP Hedged 103 113 - 0.35 HEDP £ 94 IRLWisdomTree Europe Equity ETF USD Hdg Acc 101 106 - 0.58 HEDS $ 94 IRLWisdomTree Europe Equity ETF USD Hedged 99 105 - 0.58 WTDH $ 94 IRLWisdomTree Germany Eq ETF GBP Hedged 107 115 - 0.35 DXGP £ 26 IRLWisdomTree Germany Eq ETF USD Hedged 104 106 - 0.48 DXGE $ 26 IRLEUROPE EQUITY INCOMEiShares MSCI Europe Qual Div ETF EUR Dis 103 - - - EQDS € 2 IRLWisdomTree Europe Equity Income ETF 107 114 137 0.32 EEIE € 41 IRLWisdomTree Europe Equity Income ETF Acc 106 114 - 0.32 EEIP € 41 IRLEUROPE EX-UK LARGE-CAP EQUITYBMO MSCI Europe ex-UK Inc Ldrs ETF EUR 167 171 - - ZIEU € 21 IRLEUROPE LARGE-CAP BLEND EQUITYiShares Edge MSCI Eurp Mini Vol ETF Acc 102 113 140 0.25 EUN0 € 908 IRLiShares Edge MSCI Eurp Mltfctr ETF Acc 106 117 - 0.45 FSEU € 340 IRLiShares Edge MSCI Eurp Mom Fctr ETF Acc 105 116 - 0.25 CEMR € 72 IRLiShares Edge MSCI Eurp QualFctr ETF Acc 104 115 - 0.25 CEMQ € 22 IRLiShares MSCI Europe ETF EUR Acc 105 115 140 0.33 IMAE € 621 IRLiShares MSCI Europe SRI ETF EUR Acc 105 116 138 0.44 IESE € 315 IRLWisdomTree Europe Equity ETF EUR Acc 104 118 - 0.32 WTDF € 94 IRLEUROPE LARGE-CAP VALUE EQUITYiShares Edge MSCI Eurp Val Fctr ETF Acc 106 115 - 0.25 CEMS € 1,304 IRLEUROPE MID-CAP EQUITYiShares Edge MSCI Eurp Sz Fctr ETF Acc 106 119 - 0.25 CEMT € 14 IRLiShares MSCI Europe Mid Cap ETF EUR Acc 107 - - - EUMD € 443 IRLiShares MSCI Europe Mid Cap ETF EUR Dist 107 - - - EMID € 443 IRLEUROPE SMALL-CAP EQUITYWisdomTree Europe SmallCap Div ETF 107 122 173 0.38 DFEE € 58 IRLWisdomTree Europe SmallCap Div ETF Acc 107 122 - 0.38 WTD7 € 58 IRLEUROZONE LARGE-CAP EQUITYiShares EURO STOXX 50 exFncl ETF EUR Acc 106 116 144 0.20 EXFN € 46 IRLiShares MSCI EMU Large Cap ETF EUR Acc 106 119 147 0.49 IS3G € 124 IRLWisdomTree Euroz Eqlty Div Gr ETF EUR 108 125 - - EGRP € 6 IRLWisdomTree Euroz Eqlty Div Gr ETF EURAcc 109 127 - - EGRA € 6 IRLEUROZONE MID-CAP EQUITYiShares MSCI EMU Mid Cap ETF EUR Acc 108 124 166 0.49 IS3H € 247 IRLFIXED TERM BONDiShares iBonds Sep 2018 $ Corp ETF $ Dis 97 93 - 0.10 EI18 $ 416 IRLFRANCE LARGE-CAP EQUITYiShares MSCI France ETF EUR Acc 106 119 159 0.25 ISFR € 33 IRLGBP CORPORATE BONDiShares Core £ Corp Bond ETF GBP Dist 102 104 118 0.20 SLXX £ 1,500 IRLiShares £ Corp Bond 0-5yr ETF GBP Dist 101 102 108 0.20 IS15 £ 1,433 IRLiShares £ Corp Bond ex-Fncl ETF GBP Dist 102 103 117 0.20 ISXF £ 276 IRLLyxor iBoxx £ Liq Corp Lng Dtd ETF D GBP 102 108 - - COUK.LN £ 16 LUXSPDR® Barclays 0-5 Year Stlg Corp Bd ETF 101 102 108 0.20 SYBQ £ 110 IRLSPDR® Barclays Sterling Corporate Bd ETF 102 104 118 0.20 SYBS £ 196 IRL
GBP DIVERSIFIED BOND - SHORT-TERMiShares £ Ultrashort Bond ETF GBP Dist 100 101 102 0.09 ERNS £ 455 IRLPIMCO Sterling Short Maturity Source ETF 100 101 102 - QUID £ 211 IRLGBP GOVERNMENT BONDiShares Core UK Gilts ETF GBP Dist 101 101 112 0.20 IGLT £ 1,662 IRLiShares UK Gilts 0-5yr ETF GBP Dist 100 100 103 0.20 IGLS £ 1,521 IRLLyxor FTSE Actr UK Gilts (DR) ETF D GBP 102 102 162 - GILS.LN £ 152 LUXLyxor FTSE Actr UK Glts0-5Y(DR)ETF D GBP 100 100 - - GIL5 £ 104 LUXSPDR® Barclays 1-5 Year Gilt ETF 100 99 103 0.15 SYB5 £ 513 IRLSPDR® Barclays 15+ Year Gilt ETF 103 103 122 0.15 SYBL £ 20 IRLSPDR® Barclays UK Gilt ETF 102 102 113 0.15 SYBG £ 128 IRLVanguard UK Gilt ETF 102 102 113 0.12 VGOV £ 111 IRLGBP INFLATION-LINKED BONDiShares £ Index-Lnkd Gilts ETF GBP Dist 103 102 126 0.25 INXG £ 877 IRLLyxor FTSE ActrUKGltInflLnkd(DR)ETF DGBP 103 102 - 0.07 GILI.LN £ 33 LUXLyxor UK£ 10Y Infl Expc ETF C GBP 100 - - - UKBE £ 48 LUXGERMANY LARGE-CAP EQUITYWisdomTree Germany Eq ETF EUR Acc 109 119 - 0.32 WTEZ € 26 IRLGLOBAL BONDDBXT II Global Government Bd ETF (DR) 3C 97 - - - XGSI $ 801 LUXETFS Lombard Odier IM Glb GovBdFmt GO 98 100 - 0.25 CORE $ 37 IRLiShares Global AAA-AA Govt Bd ETF $ Dist 100 100 117 0.20 IS0Z $ 59 IRLiShares Global Govt Bond ETF USD Dist 98 97 121 0.20 IGLOz $ 739 IRL
GLOBAL BOND - GBP HEDGEDDBXT II Barclays Global Agg Bd ETF 3D 101 101 - 0.30 XBGG £ 651 LUXDBXT II Global Government Bd ETF (DR) 2D 101 101 106 0.25 XGSG £ 801 LUXETFS Lombard Odier IM Glb GovBdFmt GO £H 100 101 - - COGH £ 37 IRLGLOBAL CORPORATE BONDETFS Lombard Odier IM Glb Corp Bd Fmt GO 100 101 - 0.30 CRED $ 81 IRLiShares Global Corp Bond ETF USD Dist 99 99 125 0.20 IS0X $ 860 IRLGLOBAL CORPORATE BOND - EUR HEDGEDiShares Global Corp Bond EURH ETF Dist 102 108 122 0.25 IBCQ € 1,333 IRLGLOBAL CORPORATE BOND - GBP HEDGEDBMO Barclays 1-3Y Glb Corp Bd (GBPH) ETF 100 100 - - ZC1G £ 27 IRLBMO Barclays 3-7Y Glb Corp Bd (GBPH) ETF 101 103 - - ZC3G £ 26 IRLBMO Barclays 7-10Y Glb Corp Bd(GBPH) ETF 102 104 - - ZC7G £ 25 IRLETFS Lombard Odier IM Glb Corp Bd FmtGO£ 102 103 - 0.30 CRGH £ 81 IRLGLOBAL EMERGING MARKETS BONDDBXT iBoxx$Em SvrgnQual WghtETF(DR) 1D 98 98 - 0.37 XQUA $ 63 IRLiShares JP Morgan $ EM Bd ETF USD Acc 100 - - - JPEA $ 5,949 IRLiShares JP Morgan $ EM Bond ETF USD Dist 100 100 140 0.45 IEMB $ 5,949 IRLSPDR® BofA Merrill Lynch0-5YrEM$GovBdETF 97 95 127 0.42 ZPR5 $ 101 IRLVanguard USD Emerg Mrkts Govt Bd ETF 99 99 - - VDET $ 106 IRL© 2018 Morningstar, Inc. All Rights Reserved. The information contained herein: (1) is proprietary to Morningstar and/or its content providers; (2) may notbe copied, distributed or combined with other third-party data without prior written consent; and (3) is not warranted to be accurate, complete or timely.Neither Morningstar nor its content providers are responsible for any damages or losses arising from any use of this information. Past performance is noguarantee of future results.
FUND 6 MTHS 1 YR 3 YRS TER TICKER CURR SIZE DOM FUND 6 MTHS 1 YR 3 YRS TER TICKER CURR SIZE DOM £ £ £ % (£m) £ £ £ % (£m)
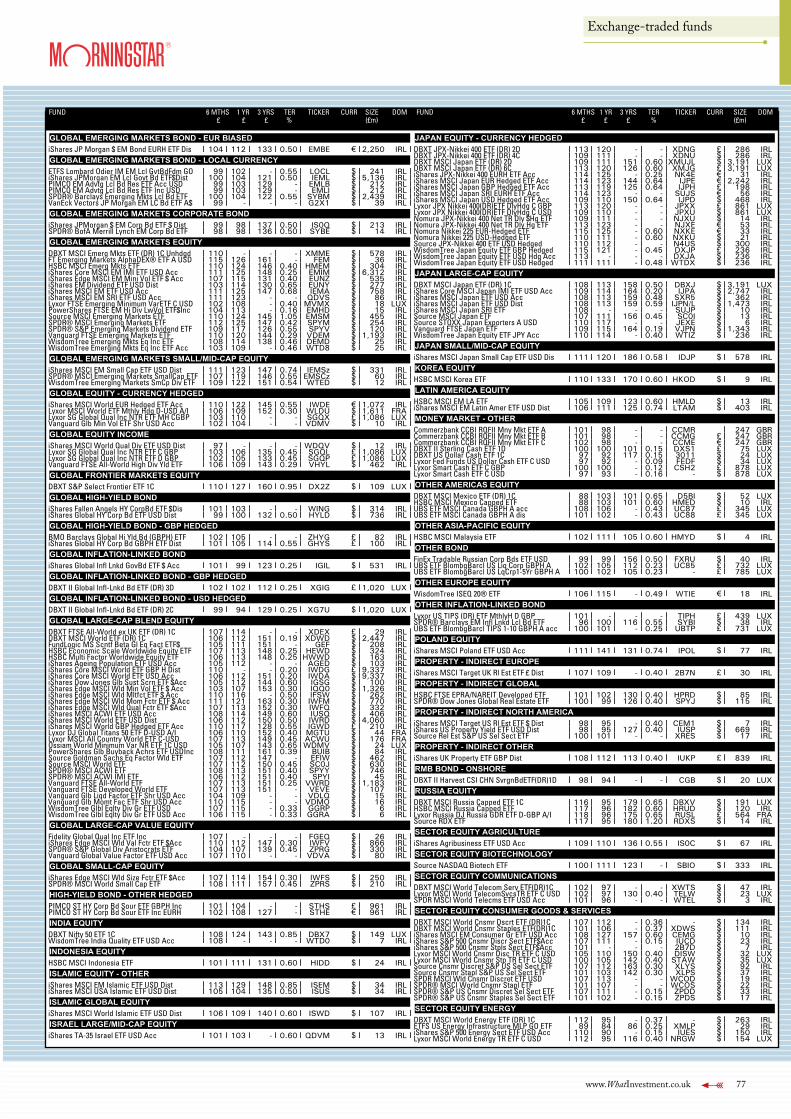
Exchange-traded funds
www.WhatInvestment.co.uk 77
FUND 6 MTHS 1 YR 3 YRS TER TICKER CURR SIZE DOM£ £ £ % (£m)
GLOBAL EMERGING MARKETS BOND - EUR BIASEDiShares JP Morgan $ EM Bond EURH ETF Dis 104 112 133 0.50 EMBE € 2,250 IRLGLOBAL EMERGING MARKETS BOND - LOCAL CURRENCYETFS Lombard Odier IM EM Lcl GvtBdFdm GO 99 102 - 0.55 LOCL $ 241 IRLiShares JPMorgan EM Lcl Govt Bd ETF$Dist 100 104 121 0.50 IEML $ 5,136 IRLPIMCO EM Advtg Lcl Bd Res ETF Acc USD 99 103 129 - EMLB $ 212 IRLPIMCO EM Advtg Lcl Bd Res ETF Inc USD 99 103 129 - EMLI $ 212 IRLSPDR® Barclays Emerging Mkts Lcl Bd ETF 100 104 122 0.55 SYBM $ 2,439 IRLVanEck Vectors JP Morgan EM LC Bd ETF A$ 99 - - - G2X1 $ 39 IRLGLOBAL EMERGING MARKETS CORPORATE BONDiShares JPMorgan $ EM Corp Bd ETF $ Dist 99 98 137 0.50 IS0Q $ 213 IRLSPDR® BofA Merrill Lynch EM Corp Bd ETF 98 98 136 0.50 SYBE $ 14 IRLGLOBAL EMERGING MARKETS EQUITYDBXT MSCI Emerg Mkts ETF (DR) 1C Unhdgd 110 - - - XMME $ 578 IRLFT Emerging Markets AlphaDEX® ETF A USD 115 126 161 - FEM $ 36 IRLHSBC MSCI Emerg Mkts ETF 110 124 146 0.40 HMEM $ 304 IRLiShares Core MSCI EM IMI ETF USD Acc 111 125 148 0.25 EMIM $ 6,312 IRLiShares Edge MSCI EM Mini Vol ETF $ Acc 107 115 131 0.40 EUNZ $ 535 IRLiShares EM Dividend ETF USD Dist 103 114 130 0.65 EUNY $ 277 IRLiShares MSCI EM ETF USD Acc 111 125 147 0.68 IEMA $ 758 IRLiShares MSCI EM SRI ETF USD Acc 111 123 - - QDVS $ 86 IRLLyxor FTSE Emerging Minimum VarETF C USD 102 108 - 0.40 MVMX $ 18 LUXPowerShares FTSE EM Hi Div LwVol ETF$Inc 104 113 - 0.16 EMHD $ 15 IRLSource MSCI Emerging Markets ETF 110 124 145 1.05 EMSM $ 455 IRLSPDR® MSCI Emerging Markets ETF 112 125 147 0.42 SPYM $ 254 IRLSPDR® S&P Emerging Markets Dividend ETF 109 117 126 0.55 SPYV $ 120 IRLVanguard FTSE Emerging Markets ETF 110 120 144 0.29 VDEM $ 1,193 IRLWisdomTree Emerging Mkts Eq Inc ETF 108 114 138 0.46 DEMD $ 25 IRLWisdomTree Emerging Mkts Eq Inc ETF Acc 103 109 - 0.46 WTD8 $ 25 IRLGLOBAL EMERGING MARKETS SMALL/MID-CAP EQUITYiShares MSCI EM Small Cap ETF USD Dist 111 123 147 0.74 IEMSz $ 331 IRLSPDR® MSCI Emerging Markets SmallCap ETF 107 119 146 0.55 EMSCz $ 60 IRLWisdomTree Emerging Markets SmCp Div ETF 109 122 151 0.54 WTED $ 12 IRLGLOBAL EQUITY - CURRENCY HEDGEDiShares MSCI World EUR Hedged ETF Acc 110 122 145 0.55 IWDE € 1,072 IRLLyxor MSCI World ETF Mthly Hdg D-USD A/I 106 109 152 0.30 WLDU $ 1,611 FRALyxor SG Global Qual Inc NTR ETF MH CGBP 103 110 - - SGQX £ 1,086 LUXVanguard Glb Min Vol ETF Shr USD Acc 102 104 - - VDMV $ 10 IRLGLOBAL EQUITY INCOMEiShares MSCI World Qual Div ETF USD Dist 97 - - - WDQV $ 12 IRLLyxor SG Global Qual Inc NTR ETF C GBP 103 106 135 0.45 SGQL £ 1,086 LUXLyxor SG Global Qual Inc NTR ETF D GBP 102 105 133 0.45 SGQP £ 1,086 LUXVanguard FTSE All-World High Div Yld ETF 106 109 143 0.29 VHYL $ 462 IRLGLOBAL FRONTIER MARKETS EQUITYDBXT S&P Select Frontier ETF 1C 110 127 160 0.95 DX2Z $ 109 LUXGLOBAL HIGH-YIELD BONDiShares Fallen Angels HY CorpBd ETF $Dis 101 103 - - WING $ 314 IRLiShares Global HY Corp Bd ETF USD Dist 99 100 132 0.50 HYLD $ 736 IRLGLOBAL HIGH-YIELD BOND - GBP HEDGEDBMO Barclays Global Hi Yld Bd (GBPH) ETF 102 105 - - ZHYG £ 82 IRLiShares Global HY Corp Bd GBPH ETF Dist 101 105 114 0.55 GHYS £ 100 IRLGLOBAL INFLATION-LINKED BONDiShares Global Infl Lnkd GovBd ETF $ Acc 101 99 123 0.25 IGIL $ 531 IRLGLOBAL INFLATION-LINKED BOND - GBP HEDGEDDBXT II Global Infl-Lnkd Bd ETF (DR) 3D 102 102 112 0.25 XGIG £ 1,020 LUXGLOBAL INFLATION-LINKED BOND - USD HEDGEDDBXT II Global Infl-Lnkd Bd ETF (DR) 2C 99 94 129 0.25 XG7U $ 1,020 LUXGLOBAL LARGE-CAP BLEND EQUITYDBXT FTSE All-World ex UK ETF (DR) 1C 107 114 - - XDEX £ 29 IRLDBXT MSCI World ETF (DR) 1C 106 112 151 0.19 XDWD $ 2,447 IRLFundLogic MS Scntf Beta Gl Eq Fact ETF$ 105 111 151 - GEF $ 208 IRLHSBC Economic Scale Worldwide Equity ETF 107 113 148 0.25 HEWD $ 324 IRLHSBC Multi Factor Worldwide Equity ETF 106 113 148 0.25 HWWD $ 163 IRLiShares Ageing Population ETF USD Acc 105 112 - - AGED $ 103 IRLiShares Core MSCI World ETF GBP H Dist 110 - - 0.20 IWDG £ 9,337 IRLiShares Core MSCI World ETF USD Acc 106 112 151 0.20 IWDA $ 9,337 IRLiShares Dow Jones Glb Sust Scrn ETF $Acc 105 112 144 0.60 IGSG $ 100 IRLiShares Edge MSCI Wld Min Vol ETF $ Acc 103 107 153 0.30 IQQ0 $ 1,326 IRLiShares Edge MSCI Wld Mltfct ETF $ Acc 110 116 - 0.50 IFSW $ 262 IRLiShares Edge MSCI Wld Mom Fctr ETF $ Acc 111 121 163 0.30 IWFM $ 770 IRLiShares Edge MSCI Wld Qual Fctr ETF $Acc 107 113 152 0.30 IWFQ $ 332 IRLiShares MSCI ACWI ETF USD Acc 108 114 149 0.60 IUSQ $ 406 IRLiShares MSCI World ETF USD Dist 106 112 150 0.50 IWRD $ 4,060 IRLiShares MSCI World GBP Hedged ETF Acc 110 117 128 0.55 IGWD £ 210 IRLLyxor DJ Global Titans 50 ETF D-USD A/I 106 110 152 0.40 MGTU $ 44 FRALyxor MSCI All Country World ETF C-USD 107 113 149 0.45 ACWU $ 176 FRAOssiam World Minimum Var NR ETF 1C USD 105 107 143 0.65 WDMV $ 24 LUXPowerShares Glb Buyback Achrs ETF USDInc 108 111 161 0.39 BUIB $ 84 IRLSource Goldman Sachs Eq Factor Wld ETF 107 112 147 - EFIW $ 462 IRLSource MSCI World ETF 107 112 150 0.45 SC0J $ 630 IRLSPDR® MSCI ACWI ETF 108 113 151 0.40 SPYY $ 746 IRLSPDR® MSCI ACWI IMI ETF 106 112 151 0.40 SPYI $ 45 IRLVanguard FTSE All-World ETF 107 113 151 0.25 VWRD $ 1,183 IRLVanguard FTSE Developed World ETF 107 113 151 - VEVE $ 107 IRLVanguard Glb Liqd Factor ETF Shr USD Acc 104 109 - - VDLQ $ 15 IRLVanguard Glb Momt Fac ETF Shr USD Acc 110 115 - - VDMO $ 16 IRLWisdomTree Glbl Eqlty Div Gr ETF USD 107 115 - 0.33 GGRP $ 6 IRLWisdomTree Glbl Eqlty Div Gr ETF USD Acc 106 115 - 0.33 GGRA $ 6 IRLGLOBAL LARGE-CAP VALUE EQUITYFidelity Global Qual Inc ETF Inc 107 - - - FGEQ $ 26 IRLiShares Edge MSCI Wld Val Fctr ETF $Acc 110 112 147 0.30 IWFV $ 866 IRLSPDR® S&P Global Div Aristocrats ETF 104 107 139 0.45 ZPRG $ 330 IRLVanguard Global Value Factor ETF USD Acc 107 110 - - VDVA $ 80 IRLGLOBAL SMALL-CAP EQUITYiShares Edge MSCI Wld Size Fctr ETF $Acc 107 114 154 0.30 IWFS $ 250 IRLSPDR® MSCI World Small Cap ETF 108 111 157 0.45 ZPRS $ 210 IRLHIGH-YIELD BOND - OTHER HEDGEDPIMCO ST HY Corp Bd Sour ETF GBPH Inc 101 104 - - STHS £ 961 IRLPIMCO ST HY Corp Bd Sour ETF Inc EURH 102 108 127 - STHE € 961 IRLINDIA EQUITYDBXT Nifty 50 ETF 1C 108 124 143 0.85 DBX7 $ 149 LUXWisdomTree India Quality ETF USD Acc 108 - - - WTD0 $ 7 IRLINDONESIA EQUITYHSBC MSCI Indonesia ETF 101 111 131 0.60 HIDD $ 24 IRLISLAMIC EQUITY - OTHERiShares MSCI EM Islamic ETF USD Dist 113 129 148 0.85 ISEM $ 34 IRLiShares MSCI USA Islamic ETF USD Dist 105 104 135 0.50 ISUS $ 34 IRLISLAMIC GLOBAL EQUITYiShares MSCI World Islamic ETF USD Dist 106 109 140 0.60 ISWD $ 107 IRLISRAEL LARGE/MID-CAP EQUITYiShares TA-35 Israel ETF USD Acc 101 103 - 0.60 QDVM $ 13 IRL
FUND 6 MTHS 1 YR 3 YRS TER TICKER CURR SIZE DOM£ £ £ % (£m)
JAPAN EQUITY - CURRENCY HEDGEDDBXT JPX-Nikkei 400 ETF (DR) 2D 113 120 - - XDNG £ 286 IRLDBXT JPX-Nikkei 400 ETF (DR) 4C 109 111 - - XDNU $ 286 IRLDBXT MSCI Japan ETF (DR) 2D 109 111 151 0.60 XMUJL $ 3,191 LUXDBXT MSCI Japan ETF (DR) 6C 113 120 126 0.60 XMJG £ 3,191 LUXiShares JPX-Nikkei 400 EURH ETF Acc 114 125 - 0.25 NK4E € 31 IRLiShares MSCI Japan EUR Hedged ETF Acc 114 123 144 0.64 IJPE € 2,242 IRLiShares MSCI Japan GBP Hedged ETF Acc 113 119 125 0.64 IJPH £ 198 IRLiShares MSCI Japan SRI EURH ETF Acc 114 123 - - SUJS € 56 IRLiShares MSCI Japan USD Hedged ETF Acc 109 110 150 0.64 IJPD $ 468 IRLLyxor JPX Nikkei 400(DR)ETF DlyHdg C GBP 113 120 - - JPXX £ 861 LUXLyxor JPX Nikkei 400(DR)ETF DlyHdg C USD 109 110 - - JPXU $ 861 LUXNomura JPX-Nikkei 400 Net TR Dly $Hg ETF 109 111 - - NJXU $ 14 IRLNomura JPX-Nikkei 400 Net TR Dly Hg ETF 113 123 - - NJXE € 53 IRLNomura Nikkei 225 EUR-Hedged ETF 115 125 - 0.60 NXKE € 33 IRLNomura Nikkei 225 USD-Hedged ETF 110 111 - 0.60 NXKU $ 21 IRLSource JPX-Nikkei 400 ETF USD Hedged 110 112 - - N4US $ 300 IRLWisdomTree Japan Equity ETF GBP Hedged 115 121 - 0.45 DXJP £ 236 IRLWisdomTree Japan Equity ETF USD Hdg Acc 113 - - - DXJA $ 236 IRLWisdomTree Japan Equity ETF USD Hedged 111 111 - 0.48 WTDX $ 236 IRLJAPAN LARGE-CAP EQUITYDBXT MSCI Japan ETF (DR) 1C 108 113 158 0.50 DBXJ $ 3,191 LUXiShares Core MSCI Japan IMI ETF USD Acc 109 114 164 0.20 IJPA $ 2,747 IRLiShares MSCI Japan ETF USD Acc 108 113 159 0.48 SXR5 $ 362 IRLiShares MSCI Japan ETF USD Dist 108 113 159 0.59 IJPN/L $ 1,473 IRLiShares MSCI Japan SRI ETF 108 - - - SUJP $ 10 IRLSource MSCI Japan ETF 107 111 156 0.45 SC0I $ 13 IRLSource STOXX Japan Exporters A USD 110 117 - - JEXE $ 6 IRLVanguard FTSE Japan ETF 109 115 164 0.19 VJPN $ 1,343 IRLWisdomTree Japan Equity ETF JPY Acc 110 114 - 0.40 WTIZ $ 236 IRLJAPAN SMALL/MID-CAP EQUITYiShares MSCI Japan Small Cap ETF USD Dis 111 120 186 0.58 IDJP $ 578 IRLKOREA EQUITYHSBC MSCI Korea ETF 110 133 170 0.60 HKOD $ 9 IRLLATIN AMERICA EQUITYHSBC MSCI EM LA ETF 105 109 123 0.60 HMLD $ 13 IRLiShares MSCI EM Latin Amer ETF USD Dist 106 111 125 0.74 LTAM $ 403 IRLMONEY MARKET - OTHERCommerzbank CCBI RQFII Mny Mkt ETF A 101 98 - - CCMR 247 GBRCommerzbank CCBI RQFII Mny Mkt ETF B 101 98 - - CCMG £ 247 GBRCommerzbank CCBI RQFII Mny Mkt ETF C 102 98 - - CCME € 247 GBRDBXT II Sterling Cash ETF 1D 100 100 101 0.15 DXS1 £ 75 LUXDBXT US Dollar Cash ETF 1C 97 92 117 0.15 3011 $ 24 LUXLyxor Fed Funds US Dollar Cash ETF C USD 97 92 - 0.09 FEDF $ 34 LUXLyxor Smart Cash ETF C GBP 100 100 - 0.12 CSH2 £ 878 LUXLyxor Smart Cash ETF C USD 97 93 - 0.16 - $ 878 LUXOTHER AMERICAS EQUITYDBXT MSCI Mexico ETF (DR) 1C 88 103 101 0.65 D5BI $ 52 LUXHSBC MSCI Mexico Capped ETF 88 103 101 0.60 HMED $ 10 IRLUBS ETF MSCI Canada GBPH A acc 108 106 - 0.43 UC87 £ 345 LUXUBS ETF MSCI Canada GBPH A dis 101 102 - 0.43 UC88 £ 345 LUXOTHER ASIA-PACIFIC EQUITYHSBC MSCI Malaysia ETF 102 111 105 0.60 HMYD $ 4 IRLOTHER BONDFinEx Tradable Russian Corp Bds ETF USD 99 99 156 0.50 FXRU $ 40 IRLUBS ETF BlombgBarcl US Liq Corp GBPH A 102 105 112 0.23 UC85 £ 732 LUXUBS ETF BlombgBarcl US LqCrp1-5Yr GBPH A 100 102 105 0.23 - £ 785 LUXOTHER EUROPE EQUITYWisdomTree ISEQ 20® ETF 106 115 - 0.49 WTIE € 18 IRLOTHER INFLATION-LINKED BONDLyxor US TIPS (DR) ETF MthlyH D GBP 101 - - - TIPH £ 439 LUXSPDR® Barclays EM Infl Lnkd Lcl Bd ETF 96 100 116 0.55 SYBI $ 38 IRLUBS ETF BlombgBarcl TIPS 1-10 GBPH A acc 100 101 - 0.25 UBTP £ 731 LUXPOLAND EQUITYiShares MSCI Poland ETF USD Acc 111 141 131 0.74 IPOL $ 77 IRLPROPERTY - INDIRECT EUROPEiShares MSCI Target UK Rl Est ETF £ Dist 107 109 - 0.40 2B7N £ 30 IRLPROPERTY - INDIRECT GLOBALHSBC FTSE EPRA/NAREIT Developed ETF 101 102 130 0.40 HPRD $ 85 IRLSPDR® Dow Jones Global Real Estate ETF 100 99 126 0.40 SPYJ $ 115 IRLPROPERTY - INDIRECT NORTH AMERICAiShares MSCI Target US Rl Est ETF $ Dist 98 95 - 0.40 CEM1 $ 7 IRLiShares US Property Yield ETF USD Dist 98 95 127 0.40 IUSP $ 669 IRLSource Rel Est S&P US Sel Sect ETF 100 101 - - XRES $ 17 IRLPROPERTY - INDIRECT OTHERiShares UK Property ETF GBP Dist 108 112 113 0.40 IUKP £ 839 IRLRMB BOND - ONSHOREDBXT II Harvest CSI CHN SvrgnBdETF(DR)1D 98 94 - - CGB $ 20 LUXRUSSIA EQUITYDBXT MSCI Russia Capped ETF 1C 116 95 179 0.65 DBXV $ 191 LUXHSBC MSCI Russia Capped ETF 117 96 182 0.60 HRUD $ 120 IRLLyxor Russia DJ Russia GDR ETF D-GBP A/I 118 96 175 0.65 RUSL £ 564 FRASource RDX ETF 117 95 180 1.20 RDXS $ 14 IRLSECTOR EQUITY AGRICULTUREiShares Agribusiness ETF USD Acc 109 110 136 0.55 IS0C $ 67 IRLSECTOR EQUITY BIOTECHNOLOGYSource NASDAQ Biotech ETF 100 111 123 - SBIO $ 333 IRLSECTOR EQUITY COMMUNICATIONSDBXT MSCI World Telecom Serv ETF(DR)1C 102 97 - - XWTS $ 47 IRLLyxor MSCI World TelecomSvcsTR ETF C USD 102 97 130 0.40 TELW $ 23 LUXSPDR MSCI World Telecms ETF USD Acc 101 96 - - WTEL $ 3 IRLSECTOR EQUITY CONSUMER GOODS & SERVICESDBXT MSCI World Cnsmr Dscrt ETF (DR)1C 107 112 - 0.36 - $ 134 IRLDBXT MSCI World Cnsmr Staples ETF(DR)1C 101 106 - 0.37 XDWS $ 111 IRLiShares MSCI EM Consumer Gr ETF USD Acc 108 127 157 0.60 CEMG $ 10 IRLiShares S&P 500 Cnsmr Discr Sect ETF$Acc 107 111 - 0.15 IUCD $ 23 IRLiShares S&P 500 Cnsmr Stpls Sect ETF$Acc 101 - - - 2B7D $ 7 IRLLyxor MSCI World Cnsmr Disc TR ETF C USD 105 110 150 0.40 DISW $ 32 LUXLyxor MSCI World Cnsmr Stp TR ETF C USD 100 105 142 0.40 STAW $ 35 LUXSource Cnsmr Discret S&P US Sel Sect ETF 107 112 163 0.30 XLYS $ 92 IRLSource Cnsmr Stapl S&P US Sel Sect ETF 101 103 142 0.30 XLPS $ 37 IRLSPDR MSCI Wld Cnsmr Discret ETF USD 107 113 - - WCOD $ 19 IRLSPDR® MSCI World Cnsmr Stapl ETF 101 107 - - WCOS $ 22 IRLSPDR® S&P US Cnsmr Discret Sel Sect ETF 107 111 - 0.15 ZPDD $ 33 IRLSPDR® S&P US Cnsmr Staples Sel Sect ETF 101 102 - 0.15 ZPDS $ 17 IRLSECTOR EQUITY ENERGYDBXT MSCI World Energy ETF (DR) 1C 112 95 - 0.37 - $ 263 IRLETFS US Energy Infrastructure MLP GO ETF 89 84 86 0.25 XMLP $ 29 IRLiShares S&P 500 Energy Sect ETF USD Acc 110 90 - 0.15 IUES $ 150 IRLLyxor MSCI World Energy TR ETF C USD 112 95 116 0.40 NRGW $ 154 LUX
FUND 6 MTHS 1 YR 3 YRS TER TICKER CURR SIZE DOM FUND 6 MTHS 1 YR 3 YRS TER TICKER CURR SIZE DOM £ £ £ % (£m) £ £ £ % (£m)
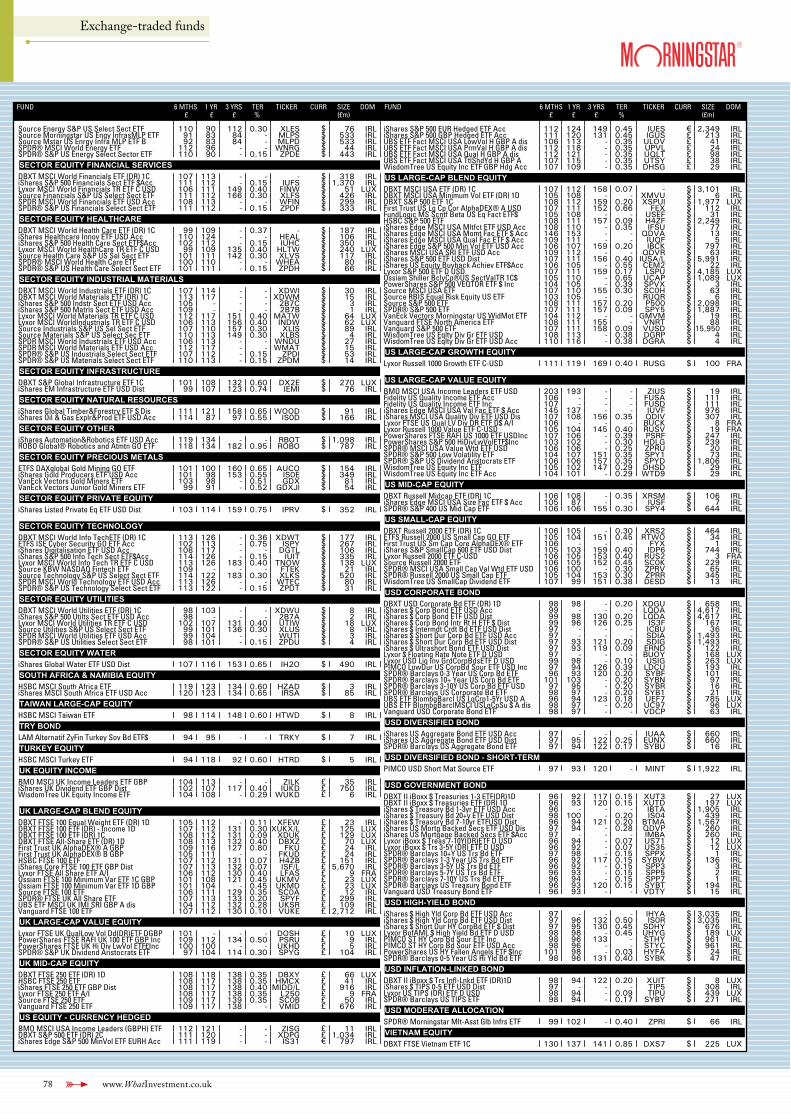
78 www.WhatInvestment.co.uk
Exchange-traded funds
FUND 6 MTHS 1 YR 3 YRS TER TICKER CURR SIZE DOM£ £ £ % (£m)
Source Energy S&P US Select Sect ETF 110 90 112 0.30 XLES $ 76 IRLSource Morningstar US Engy InfrasMLP ETF 91 83 84 - MLPS $ 533 IRLSource Mstar US Enrgy Infra MLP ETF B 92 83 84 - MLPD $ 533 IRLSPDR® MSCI World Energy ETF 112 96 - - WNRG $ 44 IRLSPDR® S&P US Energy Select Sector ETF 110 90 - 0.15 ZPDE $ 443 IRLSECTOR EQUITY FINANCIAL SERVICESDBXT MSCI World Financials ETF (DR) 1C 107 113 - - - $ 318 IRLiShares S&P 500 Financials Sect ETF $Acc 111 112 - 0.15 IUFS $ 1,370 IRLLyxor MSCI World Financials TR ETF C USD 106 111 149 0.40 FINW $ 51 LUXSource Financials S&P US Select Sect ETF 111 112 166 0.30 XLFS $ 426 IRLSPDR MSCI World Financials ETF USD Acc 108 113 - - WFIN $ 299 IRLSPDR® S&P US Financials Select Sect ETF 111 112 - 0.15 ZPDF $ 333 IRLSECTOR EQUITY HEALTHCAREDBXT MSCI World Health Care ETF (DR) 1C 99 109 - 0.37 - $ 187 IRLiShares Healthcare Innov ETF USD Acc 110 124 - - HEAL $ 106 IRLiShares S&P 500 Health Care Sect ETF$Acc 102 112 - 0.15 IUHC $ 350 IRLLyxor MSCI World HealthCare TR ETF C USD 99 109 135 0.40 HLTW $ 240 LUXSource Health Care S&P US Sel Sect ETF 101 111 142 0.30 XLVS $ 117 IRLSPDR® MSCI World Health Care ETF 100 110 - - WHEA $ 80 IRLSPDR® S&P US Health Care Select Sect ETF 101 111 - 0.15 ZPDH $ 66 IRLSECTOR EQUITY INDUSTRIAL MATERIALSDBXT MSCI World Industrials ETF (DR) 1C 107 114 - - XDWI $ 30 IRLDBXT MSCI World Materials ETF (DR) 1C 113 117 - - XDWM $ 15 IRLiShares S&P 500 Indstr Sect ETF USD Acc 105 - - - 2B7C $ 3 IRLiShares S&P 500 Matrls Sect ETF USD Acc 109 - - - 2B7B $ 1 IRLLyxor MSCI World Materials TR ETF C USD 112 117 151 0.40 MATW $ 64 LUXLyxor MSCI WorldIndustrials TR ETF C USD 106 113 156 0.40 INDW $ 62 LUXSource Industrials S&P US Sel Sect ETF 107 110 157 0.30 XLIS $ 89 IRLSource Materials S&P US Select Sec ETF 110 113 149 0.30 XLBS $ 4 IRLSPDR MSCI World Industrials ETF USD Acc 106 113 - - WNDU $ 27 IRLSPDR MSCI World Materials ETF USD Acc 112 117 - - WMAT $ 15 IRLSPDR® S&P US Industrials Select Sect ETF 107 112 - 0.15 ZPDI $ 53 IRLSPDR® S&P US Materials Select Sect ETF 110 113 - 0.15 ZPDM $ 14 IRLSECTOR EQUITY INFRASTRUCTUREDBXT S&P Global Infrastructure ETF 1C 101 108 132 0.60 DX2E $ 270 LUXiShares EM Infrastructure ETF USD Dist 99 107 123 0.74 IEMI $ 76 IRLSECTOR EQUITY NATURAL RESOURCESiShares Global Timber&Forestry ETF $ Dis 111 121 158 0.65 WOOD $ 91 IRLiShares Oil & Gas Explr&Prod ETF USD Acc 114 87 97 0.55 IS0D $ 166 IRLSECTOR EQUITY OTHERiShares Automation&Robotics ETF USD Acc 119 134 - - RBOT $ 1,098 IRLROBO Global® Robotics and Atmtn GO ETF 118 134 182 0.95 ROBO $ 787 IRLSECTOR EQUITY PRECIOUS METALSETFS DAXglobal Gold Mining GO ETF 101 100 160 0.65 AUCO $ 154 IRLiShares Gold Producers ETF USD Acc 101 98 153 0.55 IS0E $ 349 IRLVanEck Vectors Gold Miners ETF 103 98 - 0.51 GDX $ 81 IRLVanEck Vectors Junior Gold Miners ETF 99 91 - 0.52 GDXJl $ 54 IRLSECTOR EQUITY PRIVATE EQUITYiShares Listed Private Eq ETF USD Dist 103 114 159 0.75 IPRV $ 352 IRL
SECTOR EQUITY TECHNOLOGYDBXT MSCI World Info TechETF (DR) 1C 113 126 - 0.36 XDWT $ 177 IRLETFS ISE Cyber Security GO ETF Acc 102 113 - 0.75 ISPY $ 267 IRLiShares Digitalisation ETF USD Acc 108 117 - - DGTL $ 106 IRLiShares S&P 500 Info Tech Sect ETF$Acc 114 126 - 0.15 IUIT $ 335 IRLLyxor MSCI World Info Tech TR ETF C USD 113 126 183 0.40 TNOW $ 138 LUXSource KBW NASDAQ Fintech ETF 109 - - - FTEK $ 21 IRLSource Technology S&P US Select Sect ETF 114 122 183 0.30 XLKS $ 520 IRLSPDR MSCI World Technology ETF USD Acc 113 126 - - WTEC $ 80 IRLSPDR® S&P US Technology Select Sect ETF 113 122 - 0.15 ZPDT $ 31 IRLSECTOR EQUITY UTILITIESDBXT MSCI World Utilities ETF (DR) 1C 98 103 - - XDWU $ 8 IRLiShares S&P 500 Utilts Sect ETF USD Acc 98 - - - 2B7A $ 2 IRLLyxor MSCI World Utilities TR ETF C USD 102 107 131 0.40 UTIW $ 18 LUXSource Utilities S&P US Select Sect ETF 99 101 136 0.30 XLUS $ 8 IRLSPDR MSCI World Utilities ETF USD Acc 99 104 - - WUTI $ 3 IRLSPDR® S&P US Utilities Select Sect ETF 98 101 - 0.15 ZPDU $ 4 IRLSECTOR EQUITY WATERiShares Global Water ETF USD Dist 107 116 153 0.65 IH2O $ 490 IRLSOUTH AFRICA & NAMIBIA EQUITYHSBC MSCI South Africa ETF 119 123 134 0.60 HZAD $ 3 IRLiShares MSCI South Africa ETF USD Acc 120 123 134 0.65 IRSA $ 85 IRLTAIWAN LARGE-CAP EQUITYHSBC MSCI Taiwan ETF 98 114 148 0.60 HTWD $ 8 IRLTRY BONDLAM Alternatif ZyFin Turkey Sov Bd ETF$ 94 95 - - TRKY $ 7 IRLTURKEY EQUITYHSBC MSCI Turkey ETF 94 118 92 0.60 HTRD $ 5 IRLUK EQUITY INCOMEBMO MSCI UK Income Leaders ETF GBP 104 113 - - ZILK £ 35 IRLiShares UK Dividend ETF GBP Dist 102 107 117 0.40 IUKD £ 750 IRLWisdomTree UK Equity Income ETF 104 108 - 0.29 WUKD £ 6 IRL
UK LARGE-CAP BLEND EQUITYDBXT FTSE 100 Equal Weight ETF (DR) 1D 105 112 - 0.11 XFEW £ 23 IRLDBXT FTSE 100 ETF (DR) - Income 1D 107 112 131 0.30 XUKX/L £ 125 LUXDBXT FTSE 100 ETF (DR) 1C 108 112 131 0.09 XDUK £ 129 LUXDBXT FTSE All-Share ETF (DR) 1D 108 113 132 0.40 DBXZ £ 70 LUXFirst Trust UK AlphaDEX® A GBP 109 116 127 0.80 FKU £ 24 IRLFirst Trust UK AlphaDEX® B GBP 105 111 - - FKUD £ 24 IRLHSBC FTSE 100 ETF 107 112 131 0.07 H4ZB £ 151 IRLiShares Core FTSE 100 ETF GBP Dist 107 113 132 0.07 ISF/L £ 5,670 IRLLyxor FTSE All Share ETF A/I 106 112 130 0.40 LFAS £ 9 FRAOssiam FTSE 100 Minimum Var ETF 1C GBP 101 108 121 0.45 UKMV £ 23 LUXOssiam FTSE 100 Minimum Var ETF 1D GBP 101 104 - 0.45 UKMD £ 23 LUXSource FTSE 100 ETF 106 111 129 0.35 SC0A £ 12 IRLSPDR® FTSE UK All Share ETF 107 113 133 0.20 SPYF £ 299 IRLUBS ETF MSCI UK IMI SRI GBP A dis 104 112 132 0.28 UKSR £ 109 IRLVanguard FTSE 100 ETF 107 112 130 0.10 VUKE £ 2,712 IRLUK LARGE-CAP VALUE EQUITYLyxor FTSE UK QualLow Vol Dd(DR)ETF DGBP 101 - - - DOSH £ 10 LUXPowerShares FTSE RAFI UK 100 ETF GBP Inc 109 112 134 0.50 PSRU £ 9 IRLPowerShares FTSE UK Hi Div LwVol ETF£Inc 100 100 - - UKHD £ 5 IRLSPDR® S&P UK Dividend Aristocrats ETF 97 104 114 0.30 SPYG £ 104 IRLUK MID-CAP EQUITYDBXT FTSE 250 ETF (DR) 1D 108 118 138 0.35 DBXY £ 66 LUXHSBC FTSE 250 ETF 108 117 138 0.35 HMCX £ 41 IRLiShares FTSE 250 ETF GBP Dist 108 117 138 0.40 MIDD/L £ 916 IRLLyxor FTSE 250 ETF A/I 108 117 138 0.35 L250 £ 9 FRASource FTSE 250 ETF 109 117 139 0.35 SC0B £ 50 IRLVanguard FTSE 250 ETF 109 117 138 - VMID £ 676 IRLUS EQUITY - CURRENCY HEDGEDBMO MSCI USA Income Leaders (GBPH) ETF 112 121 - - ZISG £ 11 IRLDBXT S&P 500 ETF (DR) 2C 111 120 - - XDPG £ 1,034 IRLiShares Edge S&P 500 MinVol ETF EURH Acc 111 119 - - IS31 € 797 IRL
FUND 6 MTHS 1 YR 3 YRS TER TICKER CURR SIZE DOM£ £ £ % (£m)
iShares S&P 500 EUR Hedged ETF Acc 112 124 149 0.45 IUES € 2,349 IRLiShares S&P 500 GBP Hedged ETF Acc 111 120 131 0.45 IGUS £ 213 IRLUBS ETF Fact MSCI USA LowVol H GBP A dis 106 113 - 0.35 ULOV £ 41 IRLUBS ETF Fact MSCI USA PrmVal H GBP A dis 112 118 - 0.35 UPVL £ 24 IRLUBS ETF Fact MSCI USA Qual H GBP A dis 112 121 - 0.35 UQLT £ 98 IRLUBS ETF Fact MSCI USA TtlShdYd H GBP A 107 115 - 0.35 UTSY £ 38 IRLWisdomTree US Equity Inc ETF GBP Hdg Acc 107 109 - 0.35 DHSG £ 29 IRLUS LARGE-CAP BLEND EQUITYDBXT MSCI USA ETF (DR) 1C 107 112 158 0.07 - $ 3,101 IRLDBXT MSCI USA Minimum Vol ETF (DR) 1D 105 108 - - XMVU $ 6 IRLDBXT S&P 500 ETF 1C 108 112 159 0.20 XSPUl $ 1,977 LUXFirst Trust US Lg Cp Cor AlphaDEX® A USD 107 111 152 0.66 FEX $ 112 IRLFundLogic MS Scntf Beta US Eq Fact ETF$ 105 108 - - USEF $ 31 IRLHSBC S&P 500 ETF 108 111 157 0.09 H4ZF $ 2,249 IRLiShares Edge MSCI USA Mltfct ETF USD Acc 108 110 - 0.35 IFSU $ 77 IRLiShares Edge MSCI USA Momt Fac ETF $ Acc 146 153 - - QDVA $ 13 IRLiShares Edge MSCI USA Qual Fac ETF $ Acc 109 111 - - IUQF $ 5 IRLiShares Edge S&P 500 Min Vol ETF USD Acc 106 107 159 0.20 IBCK $ 797 IRLiShares MSCI USA SRI ETF USD Acc 109 112 - - QDVR $ 63 IRLiShares S&P 500 ETF USD Dist 107 111 156 0.40 IUSA/L $ 5,991 IRLiShares US Equity Buyback Achiev ETF$Acc 106 105 - 0.55 CEM2 $ 22 IRLLyxor S&P 500 ETF D USD 107 111 159 0.17 LSPU $ 4,185 LUXOssiam Shiller BclyCp®US SectValTR 1C$ 105 110 - 0.65 UCAP $ 1,089 LUXPowerShares S&P 500 VEQTOR ETF $ Inc 104 105 - 0.39 SPVX $ 3 IRLSource MSCI USA ETF 107 110 155 0.30 SC0H $ 63 IRLSource RBIS Equal Risk Equity US ETF 103 105 - - RUQR $ 6 IRLSource S&P 500 ETF 108 111 157 0.20 P500 $ 2,098 IRLSPDR® S&P 500 ETF 107 111 157 0.09 SPY5 $ 1,887 IRLVanEck Vectors Morningstar US WidMot ETF 104 112 - - GMVM $ 19 IRLVanguard FTSE North America ETF 108 111 155 - VNRT $ 88 IRLVanguard S&P 500 ETF 107 111 158 0.09 VUSD $ 15,950 IRLWisdomTree US Eqlty Div Gr ETF USD 108 113 - 0.38 DGRP $ 4 IRLWisdomTree US Eqlty Div Gr ETF USD Acc 110 116 - 0.38 DGRA $ 4 IRLUS LARGE-CAP GROWTH EQUITYLyxor Russell 1000 Growth ETF C-USD 111 119 169 0.40 RUSG $ 100 FRA
US LARGE-CAP VALUE EQUITYBMO MSCI USA Income Leaders ETF USD 203 193 - - ZIUS $ 19 IRLFidelity US Quality Income ETF Acc 106 - - - FUSA $ 111 IRLFidelity US Quality Income ETF Inc 107 - - - FUSD $ 111 IRLiShares Edge MSCI USA Val Fac ETF $ Acc 145 137 - - IUVF $ 976 IRLiShares MSCI USA Quality Div ETF USD Dis 107 108 156 0.35 QDIV $ 307 IRLLyxor FTSE US Qual LV Div DR ETF D$ A/I 106 - - - BUCK $ 8 FRALyxor Russell 1000 Value ETF C-USD 105 104 145 0.40 RUSV $ 19 FRAPowerShares FTSE RAFI US 1000 ETF USDInc 107 106 - 0.39 PSRF $ 247 IRLPowerShares S&P 500 HiDivLwVolETF$Inc 103 102 - 0.30 HDLG $ 239 IRLSPDR® MSCI USA Value Wtd ETF USD 106 106 - 0.25 ZPRU $ 20 IRLSPDR® S&P 500 Low Volatility ETF 104 107 151 0.35 SPY1 $ 73 IRLSPDR® S&P US Dividend Aristocrats ETF 106 106 157 0.35 SPYD $ 1,806 IRLWisdomTree US Equity Inc ETF 105 102 147 0.29 DHSD $ 29 IRLWisdomTree US Equity Inc ETF Acc 104 101 - 0.29 WTD9 $ 29 IRLUS MID-CAP EQUITYDBXT Russell Midcap ETF (DR) 1C 106 108 - 0.35 XRSM $ 106 IRLiShares Edge MSCI USA Size Fac ETF $ Acc 105 87 - - IUSF $ 7 IRLSPDR® S&P 400 US Mid Cap ETF 106 106 155 0.30 SPY4 $ 644 IRLUS SMALL-CAP EQUITYDBXT Russell 2000 ETF (DR) 1C 106 105 - 0.30 XRS2 $ 464 IRLETFS Russell 2000 US Small Cap GO ETF 105 104 151 0.45 RTWO $ 34 IRLFirst Trust US Sm Cap Core AlphaDEX® ETF 106 - - - FYX $ 1 IRLiShares S&P SmallCap 600 ETF USD Dist 105 103 159 0.40 IDP6 $ 744 IRLLyxor Russell 2000 ETF C-USD 106 105 153 0.40 RUS2 $ 3 FRASource Russell 2000 ETF 106 105 152 0.45 SC0K $ 229 IRLSPDR® MSCI USA Small Cap Val Wtd ETF USD 106 100 - 0.30 ZPRV $ 65 IRLSPDR® Russell 2000 US Small Cap ETF 105 104 153 0.30 ZPRR $ 345 IRLWisdomTree US SmallCap Dividend ETF 107 99 151 0.38 DESD $ 13 IRLUSD CORPORATE BONDDBXT USD Corporate Bd ETF (DR) 1D 98 98 - 0.20 XDGU $ 658 IRLiShares $ Corp Bond ETF USD Acc 99 - - - LQDA $ 4,617 IRLiShares $ Corp Bond ETF USD Dist 99 98 130 0.20 LQDA $ 4,617 IRLiShares $ Corp Bond Intr Rt H ETF $ Dist 99 96 126 0.25 IS3F $ 167 IRLiShares $ Intermdt Crdt Bd ETF USD Dist 97 - - - ICBU $ 36 IRLiShares $ Short Dur Corp Bd ETF USD Acc 97 - - - SDIA $ 1,493 IRLiShares $ Short Dur Corp Bd ETF USD Dist 97 93 121 0.20 SDIG $ 1,493 IRLiShares $ Ultrashort Bond ETF USD Dist 97 93 119 0.09 ERND $ 122 IRLLyxor $ Floating Rate Note ETF D USD 97 - - - BUOY $ 168 LUXLyxor USD Liq Inv GrdCorpBdsETF D USD 99 98 - 0.10 USIG $ 263 LUXPIMCO LowDur US CorpBd Sour ETF USD Inc 97 94 126 0.39 LDCU $ 193 IRLSPDR® Barclays 0-3 Year US Corp Bd ETF 96 93 120 0.20 SYBF $ 101 IRLSPDR® Barclays 10+ Year US Corp Bd ETF 101 103 - 0.20 SYBN $ 97 IRLSPDR® Barclays 3-10Y US Corp Bd ETF USD 97 95 - 0.20 SYBR $ 16 IRLSPDR® Barclays US Corporate Bd ETF 98 97 - 0.20 SYB1 $ 21 IRLUBS ETF BlombgBarcl US LqCrp1-5Yr USD A 96 94 123 0.18 UEF7 $ 785 LUXUBS ETF BlombgBarclMSCI USLqCpSu $ A dis 98 97 - 0.20 UC97 $ 96 LUXVanguard USD Corporate Bond ETF 98 97 - - VDCP $ 63 IRLUSD DIVERSIFIED BONDiShares US Aggregate Bond ETF USD Acc 97 - - - IUAA $ 660 IRLiShares US Aggregate Bond ETF USD Dist 97 95 122 0.25 EUNX $ 660 IRLSPDR® Barclays US Aggregate Bond ETF 97 94 122 0.17 SYBU $ 16 IRLUSD DIVERSIFIED BOND - SHORT-TERMPIMCO USD Short Mat Source ETF 97 93 120 - MINT $ 1,922 IRL
USD GOVERNMENT BONDDBXT II iBoxx $ Treasuries 1-3 ETF(DR)1D 96 92 117 0.15 XUT3 $ 27 LUXDBXT II iBoxx $ Treasuries ETF (DR) 1D 96 93 120 0.15 XUTD $ 197 LUXiShares $ Treasury Bd 1-3yr ETF USD Acc 96 - - - IBTA $ 1,905 IRLiShares $ Treasury Bd 20+y ETF USD Dist 98 100 - 0.20 IS04 $ 439 IRLiShares $ Treasury Bd 7-10yr ETFUSD Dist 96 94 121 0.20 BTMA $ 1,567 IRLiShares US Mortg Backed Secs ETF USD Dis 97 94 - 0.28 QDVP $ 260 IRLiShares US Mortgage Backed Secs ETF $Acc 97 - - - IMBA $ 260 IRLLyxor iBoxx $ Treas 7-10Y(DR)ETF D USD 96 94 - 0.07 US71 $ 12 LUXLyxor iBoxx $ Trs 3-5Y (DR) ETF D USD 96 92 - 0.07 US35 $ 12 LUXSPDR® Barclays 10+Y US Trs Bd ETF 97 98 - 0.15 SPPX $ 1 IRLSPDR® Barclays 1-3 Year US Trs Bd ETF 96 92 117 0.15 SYBW $ 136 IRLSPDR® Barclays 3-5Y US Trs Bd ETF 96 92 - 0.15 SPP3 $ 3 IRLSPDR® Barclays 5-7Y US Trs Bd ETF 96 93 - 0.15 SPP5 $ 2 IRLSPDR® Barclays 7-10Y US Trs Bd ETF 96 94 - 0.15 SPP7 $ 1 IRLSPDR® Barclays US Treasury Bond ETF 96 93 120 0.15 SYBT $ 194 IRLVanguard USD Treasury Bond ETF 96 93 - - VDTY $ 15 IRLUSD HIGH-YIELD BONDiShares $ High Yld Corp Bd ETF USD Acc 97 - - - IHYA $ 3,035 IRLiShares $ High Yld Corp Bd ETF USD Dist 97 96 132 0.50 IS0R $ 3,035 IRLiShares $ Short Dur HY CorpBd ETF $ Dist 97 95 130 0.45 SDHY $ 676 IRLLyxor BofAML $ High Yield Bd ETF D USD 98 98 - 0.45 UHYG $ 189 LUXPIMCO ST HY Corp Bd Sour ETF Inc 98 96 133 - STHY $ 961 IRLPIMCO ST HY Corp Bd Sour ETF USD Acc 98 96 - - STYC $ 961 IRLPowerShares US HY Fallen Angels ETF $Inc 101 98 - 0.03 HYFA $ 24 IRLSPDR® Barclays 0-5 Year US Hi Yld Bd ETF 98 96 131 0.40 SYBK $ 47 IRLUSD INFLATION-LINKED BONDDBXT II iBoxx $ Trs Infl-Lnkd ETF (DR)1D 98 94 122 0.20 XUIT $ 8 LUXiShares $ TIPS 0-5 ETF USD Dist 97 - - - TIP5 $ 308 IRLLyxor US TIPS (DR) ETF D USD 98 94 - 0.09 TIPU $ 439 LUXSPDR® Barclays US TIPS ETF 98 94 - 0.17 SYBY $ 271 IRLUSD MODERATE ALLOCATIONSPDR® Morningstar Mlt-Asst Glb Infrs ETF 99 102 - 0.40 ZPRI $ 66 IRLVIETNAM EQUITYDBXT FTSE Vietnam ETF 1C 130 137 141 0.85 DXS7 $ 225 LUX
FUND 6 MTHS 1 YR 3 YRS TER TICKER CURR SIZE DOM FUND 6 MTHS 1 YR 3 YRS TER TICKER CURR SIZE DOM £ £ £ % (£m) £ £ £ % (£m)

www.WhatInvestment.co.uk 79
Platform perspectives
In my end-of-year round-up last month, I talked a little about MiFID II, and how you may well have been asked to
provide more investor information – mainly National Insurance numbers and suchlike – to your platform or platforms of choice. What I didn’t mention for fear of boring you out of your festive good humour was MiFID II’s evil twin, PRIIPS.
PRIIPS stands for Packaged Retail and Insurance-based Investment Products, and is a Europe-wide regulation about disclosure. Many investments that don’t get caught by MiFID get caught by PRIIPS, and some get caught by both. The differences and similarities between the two regulatory regimes are crushingly dull and detailed, but the upshot is that if you are investing in something caught by the MiFID regime you should be getting a KIID (Key Investor Information Document) and if it’s something caught by PRIIPS you should be getting a KID (Key Information Document) – all the difference in the world, then.
KIDs and KIIDs are actually good news for investors. Mainly it’s these documents that will allow you to see inside costs more clearly, including transaction costs, especially for retail investment funds.
Caught on the hopWhat is less good news is that all these new forms of disclosure and documentation needed to be ready for when we all came back, pasty, hungover and wheezing, from our Hogmanay exertions. Quite a few investment managers, particularly of offshore funds, weren’t ready – and don’t look like they’ll be ready any time soon. As a result, you can expect to see platforms protecting their own backs and suspending trading in these funds pending the production of something that looks like a KID or a KIID. We’ve already seen Hargreaves Lansdown and Bestinvest take steps; others will follow suit.
If you find yourself caught, and unable to deal in a particular fund, this is probably why.
With any luck, managers will catch up with themselves soon and the problem will go away. Failing that, if you’re buying in, you’ll need to find an alternative – which may not be daft anyway given it’s hardly beyond the wit of man, or even fund manager, to come up with a three-page pre-sale document.
In 2018 you’ll see lots of little wrinkles like this as the industry gets used to its new rules and regulations. Most of it you won’t care about, but you should absolutely pay attention to cost disclosure, both for the investments you hold and the place you hold them in (and the cost of advice if you use the services of an IFA). I bang on about cost a lot in this column – mainly because it’s one of the few objective ways we can measure platforms. I don’t think heightened awareness of cost will necessarily get many of you to switch, but it may help you understand the dynamics of why you get charged what you do, and that in turn may help you optimise the way you deal and so get a better deal.
Market refreshOutside of regulation, I’m also hoping to see a few interesting developments that will freshen up the market and give us lots of new toys to play with. Here are a few that may or may not make it across the line:• Tighter integration with cash – HL has
been promising this for a while with its cash hub, and that will be powerful indeed when it gets to market. But beyond this we will see the banks offering more coherent experiences if you hold investments and cash with them (this is what Barclays was trying to do with its Smart Investor service before it hit big launch issues). PSD2 (the revised Payment Services Directive) will open up data flows and allow cash money to be seen as an asset.
• Modelling tools – advisers get tons of cool tools to play with on their platforms, but you don’t get much of anything. Look for platforms starting to offer versions of the kit IFAs use every day – portfolio management, tax optimisers, cash flow planning, goal-based tracking, etc.
• Income tools – generally speaking, pension income through platforms is pretty ordinary; again, advisers have better toys to play with. Some direct platforms are excellent in allowing you to construct income in different ways once you reach ‘that time of life’; others much less so. We think offering a really compelling experience – rather than just a wide investment range and a decent price – will be a battleground this year.
Maybe we’ll get all of that, maybe we won’t. Perhaps all we’ll get is compliance with new regulations (and don’t forget the GDPR data protection stuff ). The good news is that, whatever happens, you have a fantastic range of ways to invest at your fingertips these days, and as the 30 or more providers all compete, the pace of change should intensify. u
Mark Polson is the founder of price comparison website The Lang Cat
‘Whatever happens, you have a
fantastic range of ways to invest
at your fingertips these days’
All changeMark Polson Iooks at the events that are set to shape the platform scene over the coming year
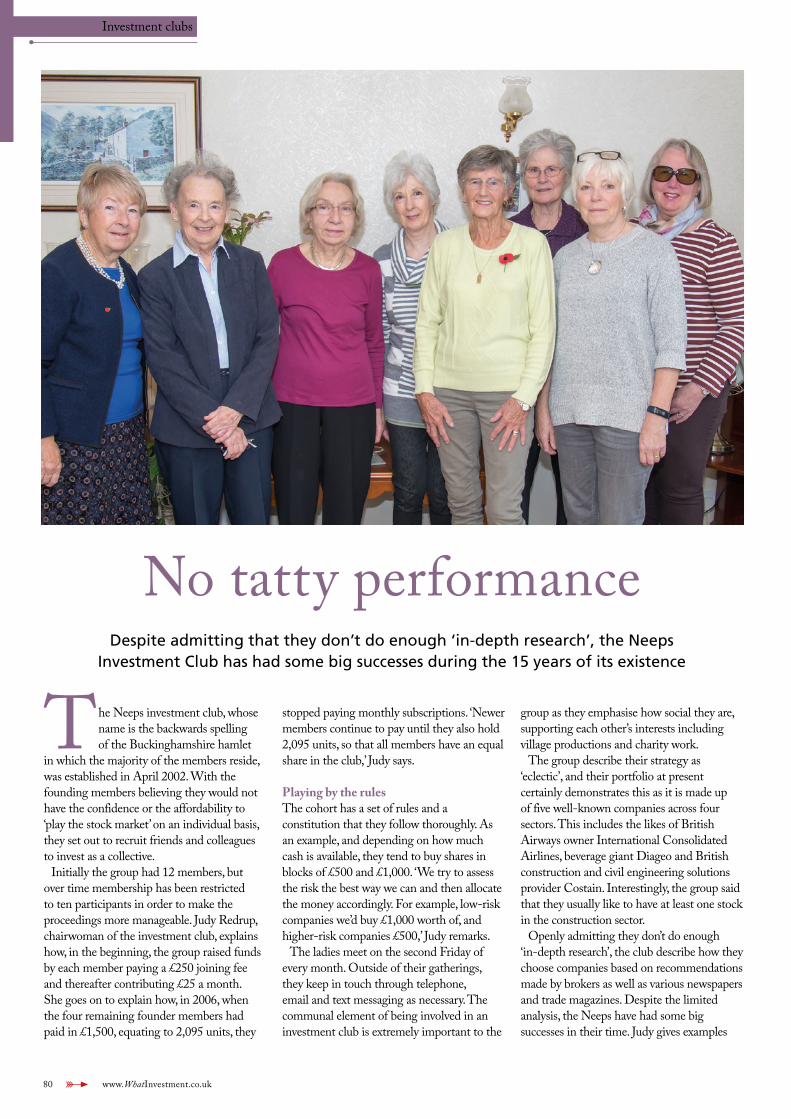
80 www.WhatInvestment.co.uk
No tatty performanceDespite admitting that they don’t do enough ‘in-depth research’, the Neeps
Investment Club has had some big successes during the 15 years of its existence
The Neeps investment club, whose name is the backwards spelling of the Buckinghamshire hamlet
in which the majority of the members reside, was established in April 2002. With the founding members believing they would not have the confidence or the affordability to ‘play the stock market’ on an individual basis, they set out to recruit friends and colleagues to invest as a collective.
Initially the group had 12 members, but over time membership has been restricted to ten participants in order to make the proceedings more manageable. Judy Redrup, chairwoman of the investment club, explains how, in the beginning, the group raised funds by each member paying a £250 joining fee and thereafter contributing £25 a month. She goes on to explain how, in 2006, when the four remaining founder members had paid in £1,500, equating to 2,095 units, they
stopped paying monthly subscriptions. ‘Newer members continue to pay until they also hold 2,095 units, so that all members have an equal share in the club,’ Judy says.
Playing by the rulesThe cohort has a set of rules and a constitution that they follow thoroughly. As an example, and depending on how much cash is available, they tend to buy shares in blocks of £500 and £1,000. ‘We try to assess the risk the best way we can and then allocate the money accordingly. For example, low-risk companies we’d buy £1,000 worth of, and higher-risk companies £500,’ Judy remarks.
The ladies meet on the second Friday of every month. Outside of their gatherings, they keep in touch through telephone, email and text messaging as necessary. The communal element of being involved in an investment club is extremely important to the
group as they emphasise how social they are, supporting each other’s interests including village productions and charity work.
The group describe their strategy as ‘eclectic’, and their portfolio at present certainly demonstrates this as it is made up of five well-known companies across four sectors. This includes the likes of British Airways owner International Consolidated Airlines, beverage giant Diageo and British construction and civil engineering solutions provider Costain. Interestingly, the group said that they usually like to have at least one stock in the construction sector.
Openly admitting they don’t do enough ‘in-depth research’, the club describe how they choose companies based on recommendations made by brokers as well as various newspapers and trade magazines. Despite the limited analysis, the Neeps have had some big successes in their time. Judy gives examples
Investment clubs
www.WhatInvestment.co.uk 81
The Share Centre’s view
The group appear to have a very social setup given that they all take turns in hosting the monthly meetings at each other’s houses and providing meals as well as supporting one
another at various life events. The members refer to themselves as being relatively novice, and it’s encouraging that they took the decision to share the load of investing by doing it as a collective rather than attempting it on an individual basis.
Saying this, however, the group are perhaps unknowingly acting very professionally with regard to the arrangement of the club. For example, they have a set of rules and a constitution to follow, which surprisingly not every club does. Furthermore, it is pleasing that they have clear guidelines as to when to sell stocks and a process whereby larger amounts of capital are allocated to lower-risk companies and lower amounts to the riskier investments. This approach is sensible
for the Neeps members in particular because of the size and objective of the club.
Judy acknowledges that the group don’t carry out a lot of in-depth research. While I appreciate that the club are primarily investing for fun, I would suggest that they could take their involvement as an opportunity to develop their skills – without jumping in at the deep end. For example, the group could start by increasing the number of outlets used to conduct their research.
Another approach that investment clubs commonly find useful is individuals specialising in certain sectors or regions and subsequently presenting investment opportunities at the regular meetings. This way, members become knowledgeable in a particular area and can then share their findings and possible investment opportunities with the other members. Indeed, the group already have a foundation to build on in this regard as they express a preference for investing in the construction sector.
I am pleased to see that the club use stop-losses. We encourage this for investment clubs as it gives the group more control over their holdings given the irregularity of their meetings and subsequent decisions. For a comparatively small portfolio, I would say they are quite active and keen to take profits should they materialise. Their strategy is clearly to focus on the shorter term, which isn’t a bad thing for an investment club as it keeps participants’ interest high.
The group have a high concentration towards big blue-chips, and they may want to consider looking for some smaller mid-cap growth ideas which could be better suited to a shorter-term portfolio. Perhaps they could do some research into the mining sector, as this is an area that many clubs have an interest in because it can be quite volatile and there’s always the chance of new finds.
I’d like to wish the club all the best for 2018 and hope that performance improves, along with their knowledge and continued enjoyment of being part of an investment club.
of how, in 2003, online travel company Lastminute.com made them a 53 per cent profit, while UK food business Rank Hovis boosted their earnings by 29 per cent.
In more recent years, the group describes how Thomas Cook and Petra Diamonds made them 28 per cent and 34 per cent profit respectively. The inclusion of National Grid amongst their current holdings is based on previous profitability. However, Judy recognises that the group is currently down. ‘We’re just holding and waiting for a positive outcome,’ she comments.
Loss protectionWhen it comes to selling shares, the club formerly used a process of monitoring prices and considering selling out if a stock fell by 10 per cent. After realising their value, the group now relies on stop-losses to protect their investments.
With regard to determining when it’s time to take some profit, originally, if a share rose
by 10 per cent then they would watch closely and let it run to 15 per cent and then sell. Judy notes that more recently, however, the club tend to take any profits quite quickly.
The members recognise that agreement on a decision-making procedure and accepting equal responsibility has been fundamental to their existence. Expanding on their experience, Judy suggests that, as they are not professionals and are primarily investing for fun, the group accept that mistakes may sometimes occur, and they are more than happy to learn from these events. ‘Hasty decisions have been costly for us, but we are getting better at doing more research to prevent this from happening,’ Judy says.
The club have come to the conclusion throughout their journey that a good product doesn’t always make a good investment, and would advise new clubs to ‘only invest what you can afford to lose’.
Judy adds, ‘There have been times, primarily after the financial crisis, when we virtually did
no trading but we continued to meet socially, and for many months were just a “luncheon club”. The social element of being part of the investment club is the core to our existence.
‘At the same time, we have all learned a lot over the years, have very much enjoyed following our portfolio and hope for success in the future.’ u
Investment clubs
Graham Spooner is investment research analyst at The Share Centre
The club’s holdings
Holding % of the portfolio
Costain 26.6
Diageo 25.7
National Express 25.3
Internl Consolidated Airlines 13.3
National Grid 9.0
Total 100.0

82 www.WhatInvestment.co.uk
The last word
Gaining a leadWhile professionals may have greater experience and information resources,
Terry Bond sets out a number of areas where private investors can have the edge
A pioneer of the investment club movement, Terry Bond has been a private investor for three decades. He is a member of the London-based Mashed Pesetas club.
With the new year hardly started I’ve already had my first altercation with an
investor who had the temerity to disagree with me. The scene was a very traditional village pub in Oxfordshire, the time was early evening, and the gathering comprised a group of locals who were contemplating the merits and otherwise of forming an investment club. My mate Mark had dragged me into the conversation by introducing me as a world expert on the subject.
I can never resist the opportunity to explain the pleasures and pitfalls of investment clubs, and I was well into my stride when I was rudely interrupted by one of the listeners. He was a burly fellow with a loud voice who went by the name of ‘Big Mac’.
‘Excuse me,’ he said. ‘I hope you don’t mind me saying this, but you are talking rubbish. Dangerous rubbish.’
There was a short silence. My polite upbringing, coupled with the fact that Big Mac was about five stone heavier than me, meant I resisted any physical retort and merely said, ‘Pray explain yourself.’
Leave it to the professionals‘I’m a private investor,’ said Big Mac. ‘I’ve got hundreds of thousands of pounds in the market. And I wouldn’t dream of trying to pick which shares to buy.
‘My stockbroker in London has about 150 employees whose livelihoods depend on making sure my portfolios are profitable. These people are experts – professionals who travel into the City every weekday – and they are in constant touch with what is happening in stock markets around the world. They know what to buy and when. They have instant access to the latest information, and they balance my positions to minimise my risk.
‘What makes you think a group of part-time amateurs meeting once a month for a couple of hours in the local pub can do better than my stockbrokers?’
In reflection, I must admit that Big Mac’s argument has merit, but at the time I could not be so gracious. It was the way he spoke, in a sneering and dismissive way, that got up my nose, so I set about putting him in his place.
The main purpose of an investment club, I explained, is for the members to learn about investing in stocks and shares. The objective is to take the mystery out of the process by actively participating in trading and building a portfolio, as well as benefiting from the experience and knowledge of friends whose opinion you respect.
I emphasised that a club should never be relied upon as a source of regular income, and that monthly subscriptions should always be modest – kept to a level that all members can easily afford. The elements of camaraderie and fun are much more important than profits or losses.
And yes, Big Mac, there are some instances where the private investor and investment clubs have an advantage over the Big Brother institutional shareholders.
Churning, which in this instance means excess buying and selling of a client’s account
to earn commissions, is illegal and unethical but it certainly goes on. It is a proven fact that buying for the long term is the best motivation for acquiring a share.
The small investor and investment clubs are fleet of foot. That means they can buy and sell without affecting the market price, whereas large investors have outside influences to consider.
Clubs also have the benefit of matching their investments to the expertise of their members. Collectively, a club is a font of specialist knowledge.
Out of touchWhisper it quietly, but in my opinion the City of London is a very insular place, and in the financial sector the populace waste a lot of time examining each other’s navels and consequently lose touch with the real world. This provides an opportunity for the private investor to look for those basic indicators that will inevitably affect the bottom line. Wander around shopping centres and assess for yourself which stores are doing well; read the local newspapers and see which companies are recruiting and which are laying off staff.
Please don’t get the impression that I think stockbrokers don’t do a good job. I have a discretionary stockbroker for the major part of my savings, which means he makes all the decisions on my portfolios without any reference to me. He does a magnificent job and I am eternally grateful to him and his staff.
However, I do retain a minor proportion of my savings (less than 10 per cent) for my personal and investment club activities. I use the services of an execution-only broker who is nothing more than an order taker and charges peanuts per transaction.
So, who performed best in percentage terms for me in 2017, the discretionary broker or yours truly? He did of course, by a country mile. He always does, but I still keep trying. I do it because it’s fun, it keeps the old brain active and I learn something new every day. u

If your business is looking for investment or you are considering reversing into a cash shell, Cash Shells Directory 2017 will help by revealing:
n The number of cash shells listed on AIM, NEX and the Main Marketn The cash held by each shelln Details on shells trading at a premium/discount to net assetsn A list of active shell company advisers and directorsn Contact details for every single cash shell
Now in its 14th edition, this annual studyprovides an overview of all shell companieson AIM, NEX and the Main Market
£365 +VATTo order the directory, please visit:https://tinyurl.com/shells17
Cash Shells Directory 2017
OUTNOW!

POGBA
3.51£
SHARE PRICE
DYBALA
SHARE PRICE4.38£ MESSI
SHARE PRICE
7.44£
Tuesday
6th February
LIMITED TICKETS
AVAILABLE
Terms & Conditions Apply. Deposit required.Prices quoted are representative examples.
FOR TICKET INFORMATION VISIT:WWW.FOOTBALLINDEX.CO.UK
T H E F O O T B A L L S T O C K M A R K E T
LEARN HOW TO BE A
SUCCESSFUL
FOOTBALL TRADER WITH
LEX VAN DAMPRESENTER OF THE BBC SERIES: MILLION DOLLAR TRADERS
Related Documents