Columbia River Inter-Tribal Fish Commission 729 NE Oregon, Suite 200 503.238.0667 Portland, OR 97232 www.critfc.org CRITFC TECHNICAL REPORT 11-11 Jeffrey K. Fryer, Jacinda Mainord, John Whiteaker, and Denise Kelsey October 07, 2011 Upstream Migration Timing of Columbia Basin Chinook, Sockeye Salmon and Steelhead in 2009

Welcome message from author
This document is posted to help you gain knowledge. Please leave a comment to let me know what you think about it! Share it to your friends and learn new things together.
Transcript

Co
lum
bia
Riv
er
Inte
r-Tr
iba
l F
ish
Co
mm
issi
on
72
9 N
E O
reg
on
, S
uit
e 2
00
50
3.2
38
.06
67
Po
rtla
nd
, O
R 9
72
32
ww
w.c
ritf
c.o
rg
C R I T F CT E C H N I C A L R E P O R T 1 1 - 1 1
Jeffrey K. Fryer, Jacinda Mainord, John Whiteaker,and Denise Kelsey
October 07, 2011
Upstream Migration Timing of Columbia Basin Chinook, Sockeye Salmon and Steelhead in 2009

Upstream Migration Timing of Columbia Basin Chinook Sockeye Salmon and
Steelhead in 2009
Columbia River Inter-Tribal Fish Commission Technical Report for
BPA Project 2008-503-00
Jeffrey K. Fryer Jacinda Mainord John Whiteaker Denise Kelsey
October 7, 2011
turn
Typewritten Text
turn
Typewritten Text
turn
Typewritten Text
turn
Typewritten Text
,
i
ABSTRACT
In 2009 we sampled sockeye and Chinook salmon as well as steelhead at
the Bonneville Dam Adult Fish Facility. Fish were measured for length and
scales collected for later analysis for age and the fish were tagged with Passive
Integrated Transponder (PIT). These fish were tracked upstream as they passed
through sites with PIT tag antennas, including fish ladders at dams, juvenile
bypasses, hatcheries, weirs as well as in-stream antennas. Approximately one
third of the steelhead and Chinook were tagged with a 20mm PIT tag (model
TX1420SST), the remainder, as well as all sockeye, were tagged with a standard
12.5 mm tag (model TX1411SST). Total numbers of fish tracked upstream were
925 spring Chinook, 907 summer Chinook, and 1109 fall Chinook salmon, 2474
steelhead, and 807 sockeye salmon.
There was no significant difference (α=0.05) in the percentage of 12.5 and
20.0 mm tagged fish detected at any upstream locations for Chinook or
steelhead, thus data from fish with the two tag types were pooled for subsequent
analyses.
One ocean age fish were predominate among spring Chinook. This may
have resulted from 2009 Adult Fish Facility trap operations which biased our
sample by preferentially trapping the smaller, one-ocean fish (analysis based on
data from Chinook tagged as juveniles). There were insufficient numbers of
previously PIT tagged fish to detect any other biases in our Chinook sampling, or
for sockeye or steelhead, if they existed.
Chinook travel times between mainstem dams ranged between 20-40
km/day. Spring Chinook that passed McNary Dam were primarily bound for the
Snake River, while summer Chinook were primarily bound for upstream of Priest
Rapids Dam.
Most spring Chinook salmon that traveled upstream of McNary Dam were
last detected in the Snake River, most summer Chinook were last detected in the
Columbia River upstream of Priest Rapids Dam, and the majority of fall Chinook
did not pass upstream of McNary Dam. Escapement estimates for the entire
Chinook run derived from PIT tag detections result in estimates differing from
those estimated by visual counts by -7.4% to +12.4% at mainstem dams.
ii
One-winter ocean aged steelhead predominated at most detection sites.
Steelhead classified as B-run (being over 78 cm fork length) were
overwhelmingly last detected in the Snake River. Based on the data reported,
the percentage of steelhead classified as B-run at Bonneville Dam peaked in
September at nearly 60% of the run, while the estimated weekly number of B-run
steelhead passing Bonneville Dam peaked in August at nearly 8000 fish. A total
of 101 PIT tagged steelhead tracked in 2009 were detected moving downstream
(mostly in juvenile bypasses) after February, 2010, presumably in an attempt to
return to the ocean after spawning.
The estimated stock composition of sockeye salmon passing Bonneville
Dam was 82.6% Okanagan, 15.1% Wenatchee, and 2.3% Snake. Upstream
survival of sockeye salmon steadily declined as the migration progressed;
Bonneville-Rock Island survival declined from as much as 90% for sockeye
salmon passing Bonneville Dam during June to less than 80% during July.
The mean travel time of sockeye salmon between Bonneville and Rock
Island dams was 12.7 days, indicating a mean travel speed of 38.2 km per day.
Fish passing Bonneville Dam later in the migration traveled upstream faster than
those earlier in the migration.

iii
ACKNOWLEDGMENTS
Bonneville field sampling was supervised by John Whiteaker and assisted
by Bobby Begay of the Columbia River Inter-Tribal Fish Commission (CRITFC).
The following individuals also assisted in this project: Rick Golden of the
Bonneville Power Authority, Ryan Branstetter, David Graves, Doug Hatch,
Marianne McClure, Shawn Narum, Rishi Sharma, Winfred Perez, Melissa
Edwards, and Marc Whitman of CRITFC; Ben Hausmann, Tammy Mackey, and
Jon Rerecich of the US Army Corps of Engineers; Steven Lee of the University of
Idaho; David Marvin of the Pacific States Marine Fisheries Commission.
This report summarizes research funded by the Columbia Basin Fish
Accords.

iv
TABLE OF CONTENTS
ABSTRACT ........................................................................................................ i
ACKNOWLEDGMENTS ................................................................................... iii
TABLE OF CONTENTS ................................................................................... iv
LIST OF TABLES ............................................................................................. vi
LIST OF FIGURES ............................................................................................ x
INTRODUCTION ............................................................................................... 1
METHODS ......................................................................................................... 2 Sampling .................................................................................................... 2
Analysis of Impacts of the Center Divider in 2009 ..................................... 3 Age Analysis .............................................................................................. 4
Escapement ............................................................................................... 4 Site Detection Efficiencies ......................................................................... 4 Comparison of Tag Types .......................................................................... 5
Migration Timing and Passage Time.......................................................... 5 Upstream Age and Length-at-Age Composition Estimates ........................ 6
Night Passage ........................................................................................... 6 Fallback ..................................................................................................... 6
RESULTS-CHINOOK ........................................................................................ 8 Trap Biases ................................................................................................ 8
Sample Size ............................................................................................. 10 Distribution of Sample .............................................................................. 11 Effectiveness of 20.0 mm Tags ................................................................ 13
Detection Numbers .................................................................................. 14 Age Analysis ............................................................................................ 14 Mainstem Dam Recoveries, Mortality, and Escapement Estimates ......... 15 Migration Timing and Passage Time........................................................ 20
Upstream Age and Length-at-Age Composition ...................................... 22 Fallback ................................................................................................... 27 Night Passage ......................................................................................... 28
RESULTS-STEELHEAD ................................................................................. 29 Sample Size ............................................................................................. 29 Distribution of sample .............................................................................. 30 Effectiveness of 20 mm Tags ................................................................... 30
Detection Numbers .................................................................................. 31 Age Analysis ............................................................................................ 31 Mainstem Dam Recoveries, Mortality, and Escapement Estimates ......... 31

v
Migration Timing and Passage Time........................................................ 34
Upstream Age and Length-at-Age Composition ...................................... 35 B-Run Analyses ....................................................................................... 37
Kelt analyses ........................................................................................... 38 Fallback ................................................................................................... 41 Night Passage ......................................................................................... 42
RESULTS-SOCKEYE ..................................................................................... 43 Sample Size ............................................................................................. 43
Distribution of sample .............................................................................. 44 Upstream Detections, Mortality, and Escapement ................................... 44 Stock Composition, Migration Timing and Passage Time ........................ 47 Fallback ................................................................................................... 49
DISCUSSION................................................................................................... 50
REFERENCES ................................................................................................ 55
APPENDIX ...................................................................................................... 56

vi
LIST OF TABLES Table 1. Percentage of jacks among previously PIT tagged Chinook salmon
passing the entrance of the Bonneville Dam fish trap on the near and far sides of the trap when the trap is in operation and the results of a test for the difference in independent proportions by statistical week in 2009. ................ 8
Table 2. Percentage of jacks among previously PIT tagged Chinook salmon passing the entrance of the Bonneville Dam fish trap on the near and far sides of the trap when the trap is not in operation and the results of a test for the difference in independent proportions by statistical week in 2009. .......... 9
Table 3. Percentage of previously PIT tagged Chinook that are jacks passing Bonneville Dam by ladder during all hours. ................................................. 10
Table 4. Number of Chinook salmon PIT tagged at Bonneville Dam and tracked, by date and statistical week in 2009. ........................................................... 10
Table 5. Total number and percentage of 12.5 and 20 mm PIT tagged Chinook salmon passing upstream sites and the p-value for a t-test comparing the two proportions in 2009 (minimum n=30). .................................................... 13
Table 6. Percentage of spring, summer, and fall Chinook salmon tracked from Bonneville Dam detected at upstream dams and the percentage lost due to tributary escapement or mortality between dams in 2009. ........................... 15
Table 7. Percentage of Chinook salmon passing a dam undetected that were subsequently detected at an upstream dam in 2009. .................................. 18
Table 8. 2009 Chinook salmon escapement by run at Columbia Basin mainstem dams upstream of Bonneville Dam estimated from both PIT tag recoveries and dam counts and the differences between the two estimates. ................ 18
Table 9. Estimated 2009 Chinook salmon escapement, as estimated using PIT tag detections, to Tumwater, Three Mile, Prosser, and Roza dams and the South Fork Salmon Weir. ............................................................................. 19
Table 10. Chinook salmon travel rates between mainstem dams as estimated by PIT tag detections in 2009. .......................................................................... 20
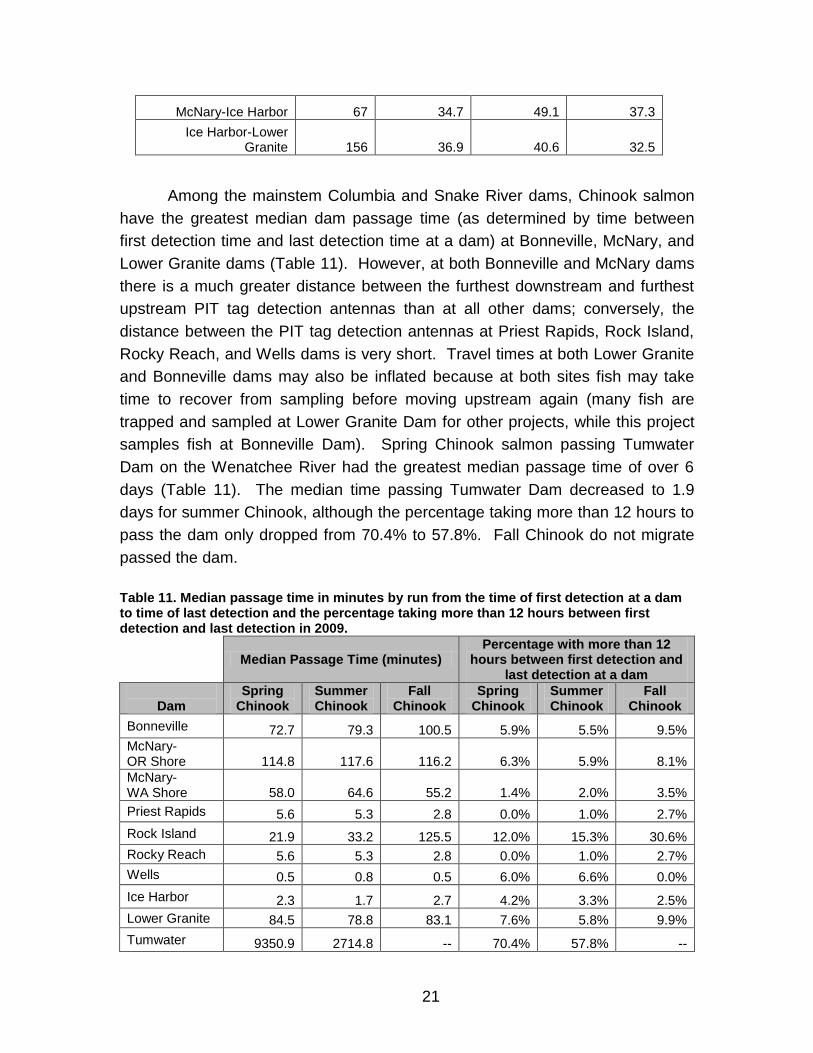
Table 11. Median passage time in minutes by run from the time of first detection at a dam to time of last detection and the percentage taking more than 12 hours between first detection and last detection in 2009. ............................ 21

vii
Table 12. Age composition estimates (%) as estimated by PIT tag detections at mainstem dams of fish aged using scale pattern analysis at Bonneville Dam, for spring, summer, and fall Chinook salmon in 2009. No effort was made to adjust for Bonneville Dam trap biases. ........................................................ 22
Table 13. Spring Chinook salmon length-at-age composition, as estimated by PIT tag detections of fish aged using scale pattern analysis that passed Bonneville Dam prior to between April 1 and May 31, at Columbia Basin dams upstream of McNary Dam in 2009. .................................................... 25
Table 14. Summer Chinook salmon length-at-age composition, as estimated by PIT tag detections of fish aged using scale pattern analysis that passed Bonneville Dam June 1-July 31, 2009, at Columbia Basin dams upstream of McNary Dam in 2009. .................................................................................. 26
Table 15. Chinook salmon length-at-age composition, as estimated by PIT tag detections of fish aged using scale pattern analysis that passed Bonneville, for fall Chinook salmon at Columbia Basin dams upstream of McNary Dam in 2009. ........................................................................................................ 27
Table 16. Estimated Chinook salmon fallback and reascension at mainstem Columbia River dams in 2009 as estimated by PIT tags. ............................ 27
Table 17. Estimated Chinook salmon night passage (2000-0400) in 2009 at mainstem Columbia River dams as estimated by PIT tags. ......................... 28
Table 18. Number of steelhead PIT tagged at Bonneville Dam and tracked by date and statistical week in 2009. No sampling occurred during Statistical Week 32 due to water temperatures above 22.2 C (72.0 F) shutting down the Bonneville Dam Adult Fish Facility. ........................................................ 29
Table 19. Total number and percentage of 12.5 and 20 mm PIT tagged steelhead passing upstream sites and the p-value for a t-test comparing the tag type proportions in 2009 (minimum n=30). .......................................................... 31
Table 20. Percentage of Steelhead tracked from Bonneville Dam and detected at upstream dams and the percentage “lost” between sequential dams in 2009. ..................................................................................................................... 32
Table 21. Percentage of steelhead passing a dam undetected that were subsequently detected at an upstream dam in 2009 (12 mm & 20 mm tags pooled). ........................................................................................................ 34
Table 22. Steelhead travel rate between mainstem dams as estimated by PIT tag detections in 2009. ....................................................................................... 34

viii
Table 23. Steelhead median passage times from time of first detection at a dam to time of last detection and the percentage taking more than 12 hours between first detection and last detection in 2009. ...................................... 35
Table 24. Age composition estimates (%) as estimated by PIT tag detections of steelhead aged using scale patterns at Bonneville Dam, for steelhead at Priest Rapids, Rock Island, Rocky Reach, Wells, Tumwater, Ice Harbor, and Lower Granite dams in 2009. ....................................................................... 36
Table 25. Steelhead length-at-age composition, as estimated by PIT tag detections of fish aged using scale pattern analysis that passed Bonneville Dam, at Columbia Basin dams upstream of McNary Dam in 2009. ............. 37
Table 26. PIT tagged steelhead tracked in 2009 last detected moving downstream listed by last downstream detection site. ................................. 39
Table 27. Season by season activities of several steelhead tagged in 2009 and later labeled as kelts when they began migrating downstream and upstream presumably to and from the ocean. ............................................................. 40
Table 28. Estimated steelhead fallback/reascension. ......................................... 42
Table 29. Estimated steelhead night passage (2000-0400) in 2009 at Columbia Basin dams with a minimum of 15 detections as estimated by PIT tags. ..... 42
Table 30. Number of PIT tagged sockeye salmon tagged at Bonneville Dam and tracked, by date and statistical week in 2009............................................... 43
Table 31. Percentage of PIT tagged fish by tag type not detected at dam detection sites as estimated from upstream detections in 2009 with comparison data for 2006-2008. .................................................................. 44
Table 32. Percentage of PIT tagged sockeye salmon detected at upstream dams subsequent to tagging, estimated escapement from both PIT tags and visual means, and the difference between the PIT tag and visual escapement estimate in 2009. ......................................................................................... 45
Table 33. Age composition (%) of Columbia Basin sockeye salmon stocks at Bonneville Dam as well as by PIT tags detected at upstream locations. ..... 46
Table 34. Sockeye salmon survival through selected reaches, by statistical week as estimated by PIT tag detections in 2009. ................................................ 47
Table 35. Weekly and composite sockeye salmon stock composition at Bonneville Dam as estimated by PIT tags in 2009. ...................................... 47
ix
Table 36. Median sockeye salmon migration time and travel rates between mainstem dams as estimated by PIT tag detections in 2009. ...................... 48
Table 37. Median sockeye salmon migration time in days between dam pairs by statistical week that they passed Bonneville Dam. The F-statistic for a linear regression between migration time and statistical week, and mean migration time by stock as estimated using PIT tags in 2009. ..................................... 48
Table 38. Sockeye salmon median travel time passing dams and the percentage of sockeye salmon taking greater than 12 hours to pass in 2009. ............... 49
Table 39. Estimated sockeye salmon fallback at mainstem Columbia River dams in 2009 as estimated by PIT tag detections. ................................................ 49
Table A1. Probability of detection at PIT tag detectors by weir at mainstem
Columbia Basin fish ladders, and the overall probability of detection, for Chinook salmon in 2009 ........................................................................... 56
Table A2. Probability of detection at PIT tag detectors by weir at mainstem
Columbia Basin fish ladders, and the overall probability of detection, for sockeye salmon in 2009 ........................................................................... 58
Table A3. List of PTAGIS interrogation sites (three letter code, name, and
description) ............................................................................................... 59

x
LIST OF FIGURES
Figure 1. Picket leads with center divider that diverts fish into Bonneville Adult Fish Facility. ................................................................................................... 2
Figure 2. Proportion of the spring Chinook sample size and run size by statistical week at Bonneville Dam in 2009. ................................................................. 12
Figure 3. Proportion of the summer Chinook sample size and run size by statistical week at Bonneville Dam in 2009. ................................................. 12
Figure 4. Proportion of the fall Chinook sample size and run size by statistical week at Bonneville Dam in 2009. ................................................................. 13
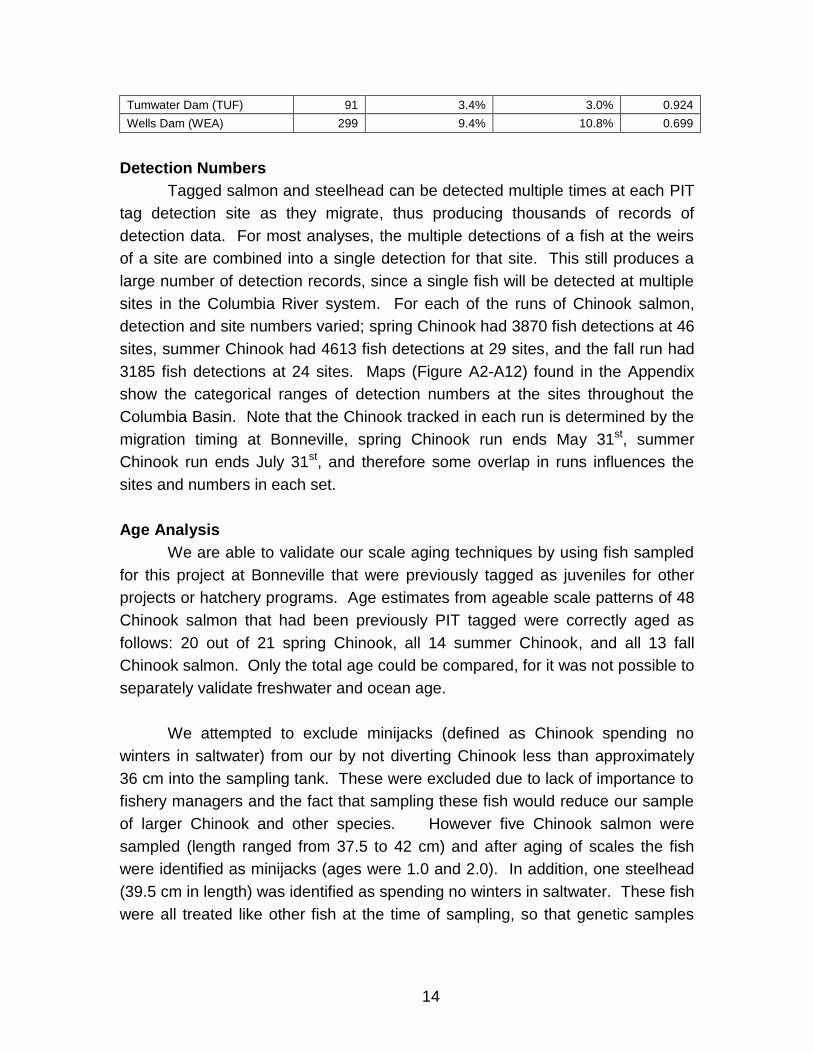
Figure 5. Distribution of final detection site by statistical week for Chinook salmon that were PIT tagged at Bonneville Dam in 2009. ........................................ 16
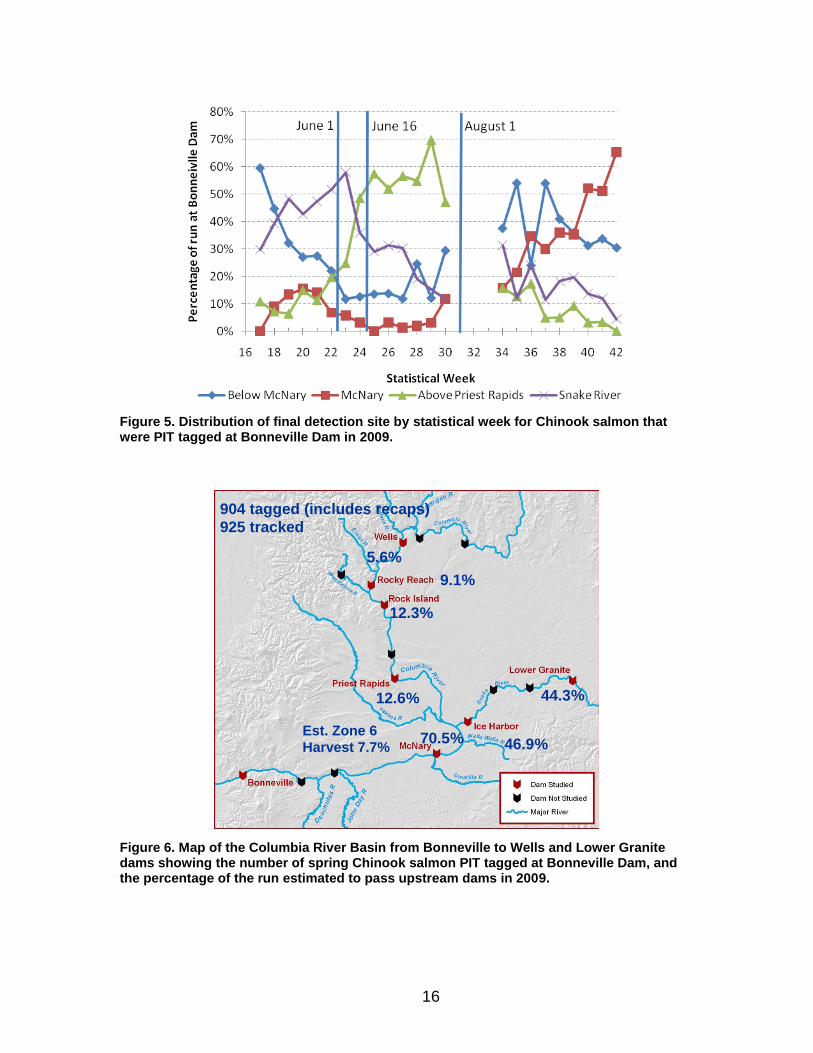
Figure 6. Map of the Columbia River Basin from Bonneville to Wells and Lower Granite dams showing the number of spring Chinook salmon PIT tagged at Bonneville Dam, and the percentage of the run estimated to pass upstream dams in 2009. .............................................................................................. 16
Figure 7. Map of the Columbia River Basin from Bonneville to Wells and Lower Granite dams showing the number of summer Chinook salmon PIT tagged at Bonneville Dam, and the percentage of the run estimated to pass upstream dams in 2009. .............................................................................. 17
Figure 8. Map of the Columbia River Basin from Bonneville to Wells and Lower Granite dams showing the number of fall Chinook salmon PIT tagged at Bonneville Dam, and the percentage of the run estimated to pass upstream dams in 2009. .............................................................................................. 17
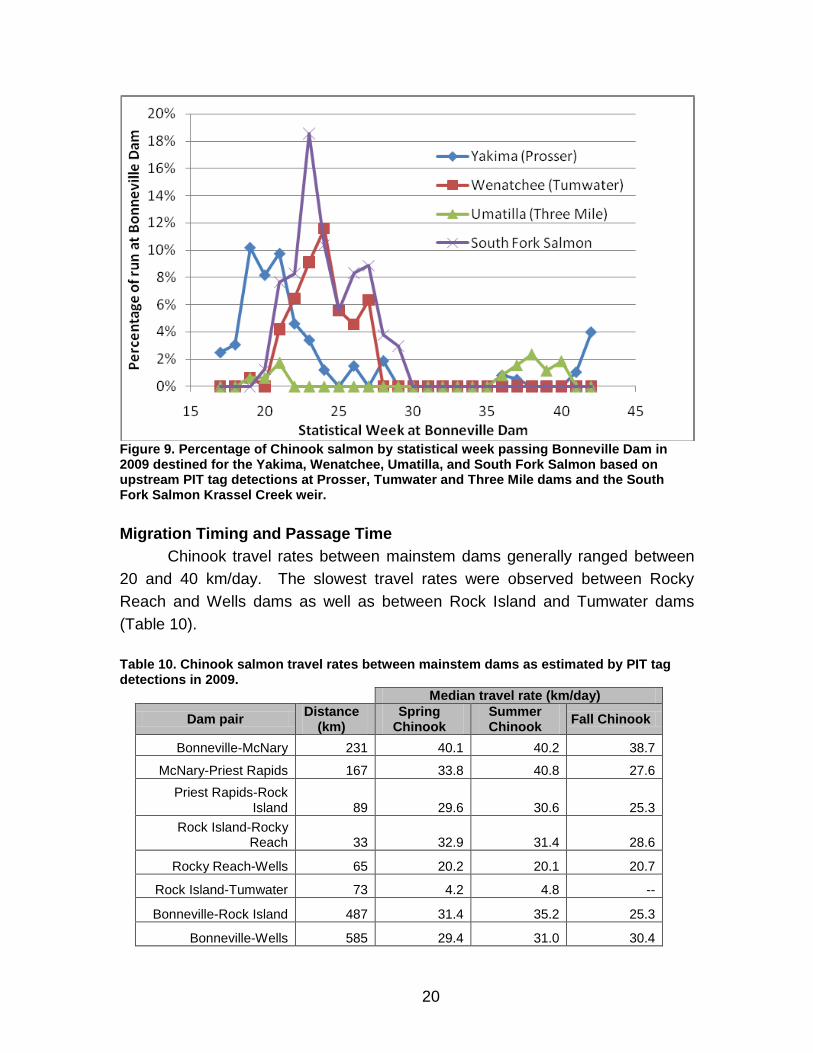
Figure 9. Percentage of Chinook salmon by statistical week passing Bonneville Dam in 2009 destined for the Yakima, Wenatchee, Umatilla, and South Fork Salmon based on upstream PIT tag detections at Prosser, Tumwater and Three Mile dams and the South Fork Salmon Krassel Creek weir. .............. 20
Figure 10. Spring Chinook age composition at Columbia and Snake river dams estimated using PIT tagged Chinook tracked by this project passing Bonneville Dam between April 1 and May 31, 2009. No effort was made to adjust for biases resulting from 2009 trap operations. ................................. 23

xi
Figure 11. Summer Chinook age composition at Columbia and Snake river dams estimated using PIT tagged Chinook tracked by this project passing Bonneville Dam between June 1 and July 31, 2009. No effort was made to adjust for biases resulting from 2009 trap operations. ................................. 24
Figure 12. Fall Chinook age composition at Columbia and Snake River dams estimated using PIT tagged Chinook tracked by this project passing between August 1 and October 31, 2009. No effort was made to adjust for biases resulting from 2009 trap operations. ............................................................ 24
Figure 13. Proportion of the steelhead sample size and run by statistical week at Bonneville Dam in 2009. .............................................................................. 30
Figure 14. Map of the Columbia River Basin from Bonneville to Wells and Lower Granite dams showing the number of steelhead PIT tagged at Bonneville Dam, and the percentage of the run estimated to pass upstream dams in 2009. ............................................................................................................ 32
Figure 15. Distribution of final upstream detection site by statistical week for steelhead PIT tagged at Bonneville Dam in 2009. ....................................... 33
Figure 16. Distribution of final detection site by statistical week for steelhead PIT tagged at Bonneville Dam in 2009. .............................................................. 33
Figure 17. Steelhead age composition at Columbia Basin dams upstream of McNary Day estimated using PIT tags in 2009. ........................................... 36
Figure 18. Percentage of B-run steelhead and estimated B-run size passing Bonneville Dam by statistical week in 2009. ................................................ 38
Figure 19. Final detection site for steelhead PIT tagged at Bonneville Dam in 2009 by length group. .................................................................................. 38
Figure 20. Percentage and number of steelhead designated as kelt (based on 2010 detections) passing Bonneville Dam by statistical week in 2009. ....... 41
Figure 21. Proportion of the sockeye salmon sample size and run size by statistical week at Bonneville Dam in 2009. ................................................. 44
Figure 22. Map of the Columbia River Basin from Bonneville to Wells and Lower Granite dams showing the number of fish PIT tagged at Bonneville Dam, and the percentage of the run estimated to pass McNary, Priest Rapids, Rock Island, Rocky Reach, Wells, Ice Harbor, Lower Granite, and Tumwater dams in 2009. ............................................................................. 45

xii
Figure A1. Map of Columbia River interrogation sites that detected Chinook and sockeye salmon, and steelhead in 2009. Table A3 in the Appendix lists the PTAGIS sites full name and the three-letter codes on this map ............... 63
Figure A2. Map of Lower Columbia River detections sites and number of spring
Chinook detected. Table A3 in the Appendix lists the PTAGIS sites full name and the three-letter codes on this map. Spring Chinook is defined as fish passing Bonneville Dam from January 1 to June 1 ....................... 64
Figure A3. Map of Upper Columbia River detections sites and number of spring
Chinook detected. Table A3 in the Appendix lists the PTAGIS sites full name and the three-letter codes on this map. Spring Chinook is defined as fish passing Bonneville Dam from January 1 to June 1 ....................... 65
Figure A4. Map of Lower Snake River detections sites and number of spring
Chinook detected. Table A3 in the Appendix lists the PTAGIS sites full name and the three-letter codes on this map. Spring Chinook is defined as fish passing Bonneville Dam from January 1 to June 1 ....................... 66
Figure A5. Map of Salmon River detections sites and number of spring Chinook
detected. Table A3 in the Appendix lists the PTAGIS sites full name and the three-letter codes on this map. Spring Chinook is defined as fish passing Bonneville Dam from January 1 to June 1 .................................. 67
Figure A6. Map of Lower Columbia River detections sites and number of summer
Chinook detected. Table A3 in the Appendix lists the PTAGIS sites full name and the three-letter codes on this map. Summer Chinook is defined as fish passing Bonneville Dam from June 1 to August 1 ........................ 68
Figure A7. Map of Upper Columbia River detections sites and number of summer
Chinook detected. Table A3 in the Appendix lists the PTAGIS sites full name and the three-letter codes on this map. Summer Chinook is defined as fish passing Bonneville Dam from June 1 to August 1 ........................ 69
Figure A8. Map of Lower Snake River detections sites and number of summer
Chinook detected. Table A3 in the Appendix lists the PTAGIS sites full name and the three-letter codes on this map. Summer Chinook is defined as fish passing Bonneville Dam from June 1 to August 1 ........................ 70
Figure A9. Map of Salmon River detections sites and number of summer Chinook
detected. Table A3 in the Appendix lists the PTAGIS sites full name and the three-letter codes on this map. Summer Chinook is defined as fish passing Bonneville Dam from June 1 to August 1 .................................... 71
Figure A10. Map of Lower Columbia River detections sites and number of fall
Chinook detected. Table A3 in the Appendix lists the PTAGIS sites full
xiii
name and the three-letter codes on this map. Fall Chinook is defined as fish passing Bonneville Dam from August 1 to end of year ...................... 72
Figure A11. Map of Upper Columbia River detections sites and number of fall
Chinook detected. Table A3 in the Appendix lists the PTAGIS sites full name and the three-letter codes on this map. Fall Chinook is defined as fish passing Bonneville Dam from August 1 to end of year ...................... 73
Figure A12. Map of Lower Snake River detections sites and number of fall
Chinook detected. Table A3 in the Appendix lists the PTAGIS sites full name and the three-letter codes on this map. Fall Chinook is defined as fish passing Bonneville Dam from August 1 to end of year ...................... 74
Figure A13. Map of Lower Columbia River detections sites and number of
steelhead detected. Table A3 in the Appendix lists the PTAGIS sites full name and the three-letter codes on this map ........................................... 75
Figure A14. Map of Upper Columbia River detections sites and number of
steelhead detected. Table A3 in the Appendix lists the PTAGIS sites full name and the three-letter codes on this map ........................................... 76
Figure A15. Map of Lower Snake River detections sites and number of steelhead
detected. Table A3 in the Appendix lists the PTAGIS sites full name and the three-letter codes on this map ............................................................ 77
Figure A16. Map of Salmon River detections sites and number of steelhead detected. Table A3 in the Appendix lists the PTAGIS sites full name and the three-letter codes on this map ............................................................ 78

1
INTRODUCTION
Since 1985, the Columbia River Inter-Tribal Fish Commission (CRITFC)
has, using Pacific Salmon Commission (PSC) funding, sampled Chinook and
sockeye salmon at Bonneville Dam to determine age, length-at-age, and, in the
case of sockeye salmon (Kelsey et. al 2011), stock identification (Fryer 2009). In
2004, CRITFC took over a similar long-running steelhead sampling program at
Bonneville Dam from Oregon Department of Fish and Wildlife (Whiteaker and
Fryer 2008). The development and maturation of two new technologies, Passive
Integrated Transponder (PIT) tags and genetic stock identification (GSI), have
provided an opportunity to greatly expand the information obtained from our
stock monitoring program at Bonneville Dam. PIT tag readers are now installed
in fish ladders at most mainstem Columbia and Snake River dams, as well as at
dams and weirs on many of the Columbia Basin tributaries. By PIT tagging fish
that we sample at Bonneville Dam, we can track tagged fish upstream providing
valuable information on migration timing and survival rates. PIT tags can provide
much of the same information as radio tags, but at minimal expense. With the
reduced cost greater numbers of fish can be tagged, thus increasing the sample
size and the small tag reduces the impact on the tagged fish. Unlike radio tags,
PIT tagged fish information is readily available to all managers and researchers
on a real-time basis through the PTAGIS system. The information obtained by
PIT tags can be further expanded by identifying the origin of the fish using GSI.
Using these two technologies it becomes possible, to determine migration timing,
stray rates, and upstream survival on a stock-specific basis for Chinook and
sockeye salmon and steelhead.
Almost all PIT tagging presently completed in the Columbia Basin is
conducted on juvenile salmonids, either at hatcheries, tributary smolt traps, or
juvenile bypasses at dams. These efforts predominantly study the effects of the
downstream juvenile migration, but rarely tag a sufficient number of juveniles to
assess survival of returning adults as they pass Bonneville Dam and migrate to
the spawning grounds. There are also many salmon stocks in the Columbia
Basin for which PIT tagging is not used as a tool, thus it is difficult to answer
questions on upstream migration timing, straying, and survival for those stocks.
Because the our project randomly samples adult salmon and steelhead passing
the dam, this study will likely tag salmonid stocks that have not previously been
tagged and monitored.
2
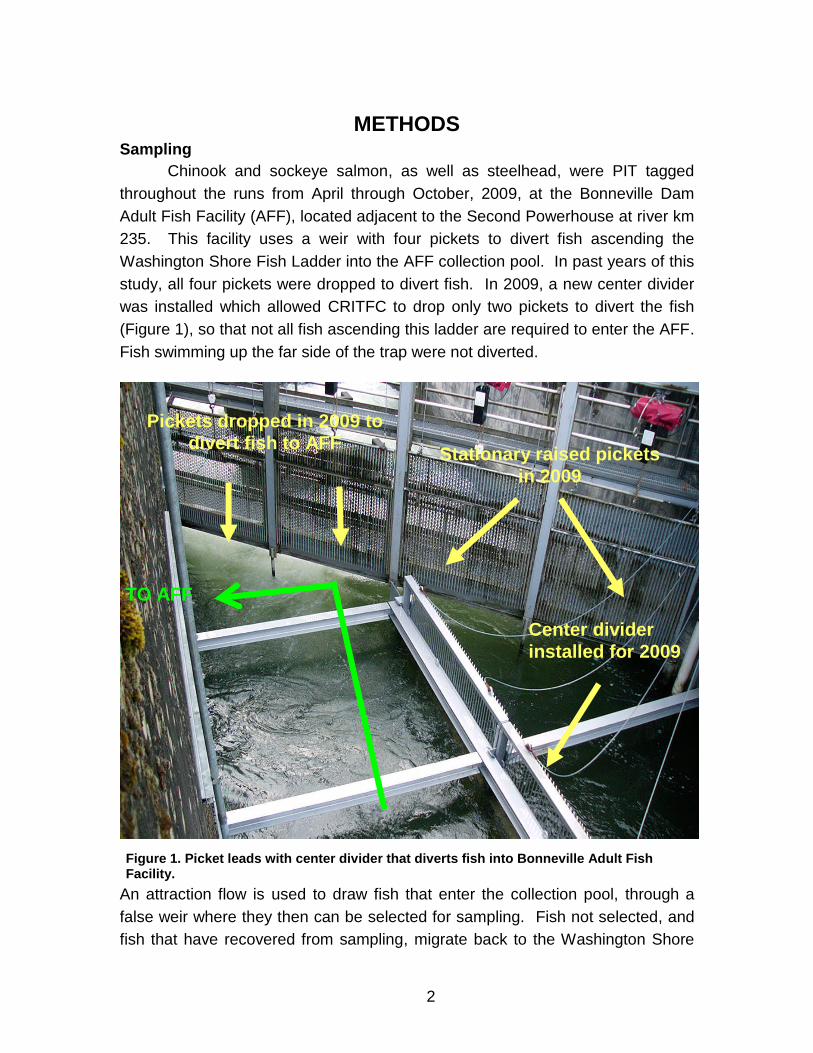
METHODS Sampling
Chinook and sockeye salmon, as well as steelhead, were PIT tagged
throughout the runs from April through October, 2009, at the Bonneville Dam
Adult Fish Facility (AFF), located adjacent to the Second Powerhouse at river km
235. This facility uses a weir with four pickets to divert fish ascending the
Washington Shore Fish Ladder into the AFF collection pool. In past years of this
study, all four pickets were dropped to divert fish. In 2009, a new center divider
was installed which allowed CRITFC to drop only two pickets to divert the fish
(Figure 1), so that not all fish ascending this ladder are required to enter the AFF.
Fish swimming up the far side of the trap were not diverted.
An attraction flow is used to draw fish that enter the collection pool, through a
false weir where they then can be selected for sampling. Fish not selected, and
fish that have recovered from sampling, migrate back to the Washington Shore
Figure 1. Picket leads with center divider that diverts fish into Bonneville Adult Fish Facility.
Stationary raised pickets
in 2009
Center divider
installed for 2009
Pickets dropped in 2009 to divert fish to AFF
TO AFF

3
Fish Ladder above the pickets.
Salmon and steelhead selected for sampling were examined for tags, fin
clips, wounds, and condition. They were measured for length, and tissue and six
scales (four scales for sockeye) collected for later genetic and age analysis
(Kelsey et. al 2011). Fish were scanned for PIT tags. If no tags were detected,
standard techniques were used to inject PIT tags through a needle that
penetrates the fish between the posterior tip of the pectoral fin and the anterior
point of the pelvic girdle (CBFWA 1999). Tagged fish were then scanned for the
PIT tag code, which was recorded if detected. If no tag was detected, no effort
was made to re-tag the fish. Data on each PIT tagged fish was uploaded to
www.ptagis.org. In 2009 a new 20.0 mm PIT tag (model TX1420SST) was
tested for effectiveness compared to the standard 12.5 mm tag (model
TX1411SST). The 20.0 mm tag was placed in one of every three steelhead and
Chinook sampled, while the remaining two-thirds, along with all sockeye salmon
received the 12.5 mm tags. Post-season, we examined weekly sample sizes to
determine how far they deviated from weekly run sizes.
As tagged salmon and steelhead continued their migration they were
detected by PIT tag receivers located in the adult fish ladders at major Columbia
Basin mainstem dams (Bonneville, McNary, Priest Rapids, Rock Island, Rocky
Reach, and Wells dams on the Columbia River; Ice Harbor, and Lower Granite
dams on the Snake River) as well as in numerous tributaries and hatcheries in
the Columbia Basin (Appendix Table A3 and Figure A1). Many of the receivers
automatically upload (real-time) PIT tag detection data to www.ptagis.org, which
is then accessible to registered users of the site.
Analysis of Impacts of the Center Divider in 2009
Several analyses were added after trapping commenced and it was
observed that the numbers of fish sampled were less than expected, and that the
percentage of smaller one-ocean jack Chinook salmon was less than expected.
To investigate this phenomenon, we looked at the distribution of previously PIT
tagged Chinook salmon (which were tagged as juveniles on, or prior to, their
downstream migration) that used the Washington shore fish ladder. A statistical
test comparing proportions in independent samples (Snedecor and Cochrane
1980) was used to compare the percentage of previously PIT tagged Chinook
that were jacks (defined as one-ocean fish) passing on the AFF side of the ladder
(subject to trapping) and the non-AFF side of the ladder (not subject to trapping)
4
during trapping hours. There was insufficient data to look at other age classes or
other species (steelhead and sockeye). We also looked at the percentage of
previously PIT tagged fish, which were jacks, using other ladders that were not
subject to trapping both during trapping and non-trapping hours to look at
potential ladder biases. .
Age Analysis
Visual assessment of scale patterns was used to determine age
composition through techniques developed for the Bonneville Stock Sampling
project (Whiteaker and Fryer 2008). The origin and age of Chinook and
steelhead previously PIT tagged in other projects and sampled in this project
could be determined through PTAGIS and the tag code, thus providing a
validation of age since release. Very few sockeye salmon are tagged as
juveniles making it difficult to sample sufficient fish to validate ages for this
species.
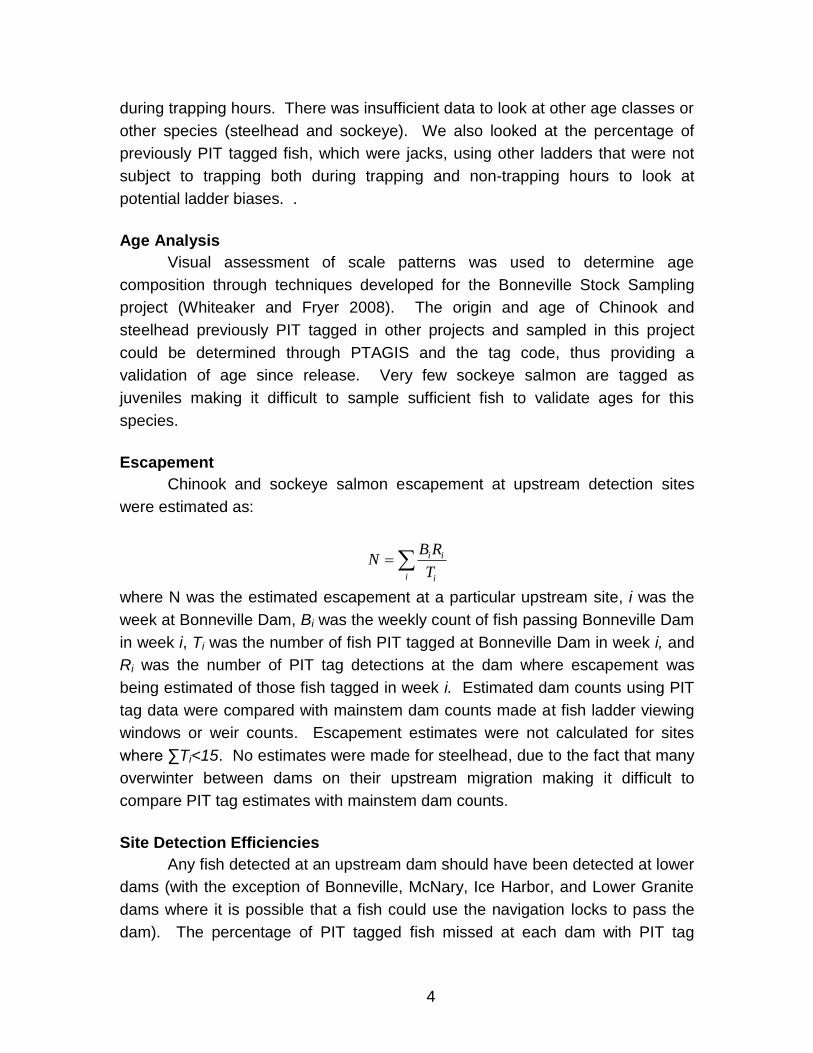
Escapement
Chinook and sockeye salmon escapement at upstream detection sites
were estimated as:
i i
ii
T
RBN
where N was the estimated escapement at a particular upstream site, i was the
week at Bonneville Dam, Bi was the weekly count of fish passing Bonneville Dam
in week i, Ti was the number of fish PIT tagged at Bonneville Dam in week i, and
Ri was the number of PIT tag detections at the dam where escapement was
being estimated of those fish tagged in week i. Estimated dam counts using PIT
tag data were compared with mainstem dam counts made at fish ladder viewing
windows or weir counts. Escapement estimates were not calculated for sites
where ∑Ti<15. No estimates were made for steelhead, due to the fact that many
overwinter between dams on their upstream migration making it difficult to
compare PIT tag estimates with mainstem dam counts.
Site Detection Efficiencies
Any fish detected at an upstream dam should have been detected at lower
dams (with the exception of Bonneville, McNary, Ice Harbor, and Lower Granite
dams where it is possible that a fish could use the navigation locks to pass the
dam). The percentage of PIT tagged fish missed at each dam with PIT tag

5
detection arrays was calculated; for example, the percentage missed at Rocky
Reach Dam was calculated as:
md
m
RR
RP
where Rm was the number of fish missed at Rocky Reach Dam but detected
upstream at Wells Dam and Rd was the number of fish detected passing Rocky
Reach Dam.
PIT tag detection antennas in fish ladders are always placed in at least
two locations in relatively close proximity. PIT tag interrogation maps (available
at www.ptagis.org) indicate that these antennas are placed at vertical slots,
weirs, or pools. To simplify the nomenclature, these locations will all
subsequently be referred to as weirs.
If a fish is detected at one detection weir in a given fish ladder, it should
also be detected at the rest of the weirs with PIT tag detection in that same
ladder. This allows a probability of detection at the individual weirs in a ladder to
be calculated by comparing it with other weirs in that same ladder. Detection
probabilities were calculated as:
i
i
T
NPi )1(1
where Ni is the number of fish detected at a given weir and T is the total number
of fish detected by any weir at that ladder. This data was tabulated and is
presented in the Appendix, Tables A1 and A2.
Also calculated was the percentage of fish using each ladder at the dams
with multiple ladders with detection capabilities.
Comparison of Tag Types
A statistical test comparing the proportions of independent samples (Snedecor
and Cochrane, 1980) was used to evaluate whether similar proportions of
Chinook salmon tagged with the two tag types was observed at mainstem dams
and weirs with PIT tag detection.
Migration Timing and Passage Time
Run timing was estimated using the date and time of detection between
detection sites. Migration rates were calculated between sites as the time

6
between the last detection at the first site and the first detection at the upper site.
The amount of time required to pass each dam was estimated as the difference
between the first detection time at a dam and the last detection time at the same
dam.
Upstream Age and Length-at-Age Composition Estimates
The age composition at upstream locations was calculated as:
k
kkjj WAT *,
where Tj was the estimate for age group j at a particular location, A,j,k was the
percentage of fish for age group j in week k at Bonneville Dam (such that
j
kjA 1, ) and Wk was the percentage of the run that passed Bonneville Dam in
week k. Night Passage
Fish counting at Columbia Basin dams is not consistent between dams.
Fish at Bonneville and McNary dams are counted live by observers stationed at
fish ladder viewing windows from 0400 to 2000 Pacific Standard Time, while fish
at Priest Rapids, Rock Island, Rocky Reach and Wells dams are all counted 24
hours per day from recorded video. Tributary dam passage is estimated using
24 hour recorded video and/or counts at adult fish traps.
Night passage rates (where night is defined as 2000 to 0400 PST) were
calculated based on the last time fish were detected in a fish ladder for all dams
passed. This last time detected at a ladder was used as an approximation for
passage time at the counting window, as the uppermost weir is closest to the fish
counting window at nearly all ladders. (For maps of site configeration for
mainstem dams see http://www.ptagis.org).
Fallback
Three methods were used to determine fallback, which is defined as a fish
that ascends a fish ladder into the reservoir above the dam, then “falls back” to
the downstream side of the dam either over the spillway, or through the
navigation locks, juvenile bypass systems, or turbines. The first was if an adult
salmon or steelhead was detected in the juvenile bypass system. However, on
the Columbia River, only Bonneville, John Day, McNary, Rocky Reach dams
have juvenile bypass system PIT detection capability while all four dams in the
Snake River have it. Furthermore, there is no detection at any dam for fish falling

7
back over the spillway or through the navigation locks or turbines. Therefore, a
second method of estimating fallback was to look at each dam for fish detected
at an “upper” weir followed by detection at a “lower” weir separated by more than
two hours. At McNary and Bonneville dams, the upper detection weir is at the
fish counting window (which are believed to detect all passing PIT tagged fish),
while the lower weir is defined as lowest PIT tag detector in the fish ladder. At
Priest Rapids, Rock Island, Rocky Reach, and Wells dams, there are only two
weirs with PIT tag detectors in each fish ladder so these were designated as the
upper and lower detection weirs, even if they are not at the top or bottom of the
ladders. At McNary and Bonneville dams, detection histories of fish detected at
multiple ladders were also reviewed (MC1 and MC2 for McNary and BO1 and
BO4 for Bonneville (http://www.ptagis.org for maps of sites)). Finally, a third
method of defining fallback was ascertained by fish that passed an upstream PIT
tag detector at a given dam, then were next observed at a downstream dam.
These methodologies will underestimate fallback as they do not include fish that
fall back over a dam and are not subsequently detected.
Adult steelhead detected at juvenile facilities after February, 2010 were
not considered fallbacks, as they were likely kelts on their way downstream to the
ocean.

8
RESULTS-CHINOOK
Trap Biases
In 9 out of 23 Statistical weeks, the percentage of jacks on the near side of
the center divider, and subject to sampling, was significantly greater than on the
far side, where they were not subject to sampling. Over the entire run, this
difference was highly significant (p<0.001, Table 1). Furthermore, when the trap
was in operation, 26.2% (496 out of 1877) of previously PIT tagged Chinook
passed on the near side compared to 43.8% (2127 out of 4933, Table 2) when
the trap was not in operation. When the trap was not in operation, there was no
significant difference in the distribution of jacks across the fish ladder for any
week (Table 2) which suggests that it is the operation of the trap, combined with
the center divider, which is causing a bias.
Table 1. Percentage of jacks among previously PIT tagged Chinook salmon passing the entrance of the Bonneville Dam fish trap on the near and far sides of the trap when the trap is in operation and the results of a test for the difference in independent proportions by statistical week in 2009.
Pass Far Side (not subject to trapping)
Pass Near Side (subject to trapping)
P-value (significant results are in bold and
underlined) Statistical
Week N Percent Jacks N Percent Jacks
17 15 7% 5 20% 0.389
18 46 9% 14 7% 0.854
19 136 26% 29 34% 0.382
20 128 35% 33 91% 0.000
21 148 34% 53 43% 0.212
22 42 29% 14 14% 0.285
23 55 33% 23 52% 0.107
24 55 44% 16 56% 0.373
25 70 46% 16 81% 0.010
26 57 49% 7 86% 0.067
27 80 49% 18 94% 0.000
28 35 46% 11 82% 0.036
29 7 43% 2 100% 0.151
30 8 25% 1 0% 0.571
31 2 50% 1 100% 0.386
33 15 40% 3 100% 0.058
34 42 40% 11 64% 0.170
35 53 38% 18 61% 0.048
36 81 48% 24 67% 0.111
37 133 45% 76 79% 0.000

9
38 108 49% 59 86% 0.000
39 63 43% 43 81% 0.000
40 2 0% 9 89% 0.011
Cumulative 1381 39% 496 67% 0.000
Table 2. Percentage of jacks among previously PIT tagged Chinook salmon passing the entrance of the Bonneville Dam fish trap on the near and far sides of the trap when the trap is not in operation and the results of a test for the difference in independent proportions by statistical week in 2009.
Pass far side Pass near side P-value (no significant
results) Statistical
Week
N Percent Jacks
N
Percent Jacks
17 37 8% 36 20% 0.317
18 111 16% 111 7% 0.571
19 213 30% 205 34% 0.772
20 388 37% 279 91% 0.457
21 201 26% 121 43% 0.360
22 156 25% 100 14% 0.721
23 114 31% 93 52% 0.794
24 168 39% 102 56% 0.576
25 209 42% 81 81% 0.833
26 91 45% 29 86% 0.983
27 34 47% 14 94% 0.853
28 49 47% 13 82% 0.960
29 36 47% 22 100% 0.837
30 6 17% 5 0% 0.387
31 8 38% 8 100% 1.000
33 5 40% 4 100% 0.764
34 19 21% 18 64% 0.401
35 91 35% 46 61% 0.649
36 251 43% 173 67% 0.918
37 294 45% 354 79% 0.777
38 325 45% 315 86% 0.778
39 257 47% 232 81% 0.975
40 189 48% 134 89% 0.945
Cumulative 2806 38% 2127 39% 0.701
While conducting this analysis, we also looked at the percentage of
previously tagged fish that were returning as jacks at each of the three ladders at
Bonneville Dam (Washington shore, Oregon shore, and Bradford Island), when
the trap was and was not operating (Table 3). Percentages differed greatly;
though the overall weighted percentage of jacks at all ladders (48.2%) was
surprisingly close to what passed through the trap entrance when the trap was in

10
operation (46.1%).
Table 3. Percentage of previously PIT tagged Chinook that are jacks passing Bonneville Dam by ladder during all hours.
Pass through
Trap facility
Washington Shore fish
ladder
Oregon Shore fish
ladder
Bradford Island fish
ladder
All ladders (weighted by abundance)
Trap in operation
71.7% 46.1% 60.4% 56.3% 53.0%
Trap not in operation
38.6% 59.1% 53.2% 46.9%
Overall 40.0% 59.4% 53.9% 48.2%
N 746 7139 4335 1814 14934
There was insufficient data to conduct trap bias analyses for other age groups of
Chinook or for sockeye salmon or steelhead. No effort was made in subsequent
analyses to correct for any of these trap biases.
Sample Size
A total of 611 spring Chinook, 602 summer Chinook, and 751 fall Chinook
salmon were tagged with 12.5 mm PIT tags in 2009. An additional 293 spring,
299 summer, and 353 fall Chinook were tagged with 20 mm PIT tags (Table 4).
No Chinook sampling was conducted during Statistical weeks 31-33 due to high
temperatures. Due to similar detection rates (Effectiveness of 20.0 mm Tags
section), tag types were pooled for subsequent analyses. After adding previously
tagged fish (which were sampled and therefore identified for the tracking study
and included in our sample) and subtracting fish that were not detected after
release (likely a result of the tags being shed), the numbers of Chinook tracked
upstream consisted of 925 spring Chinook, 907 summer Chinook, and 1109 fall
Chinook salmon (Table 4).
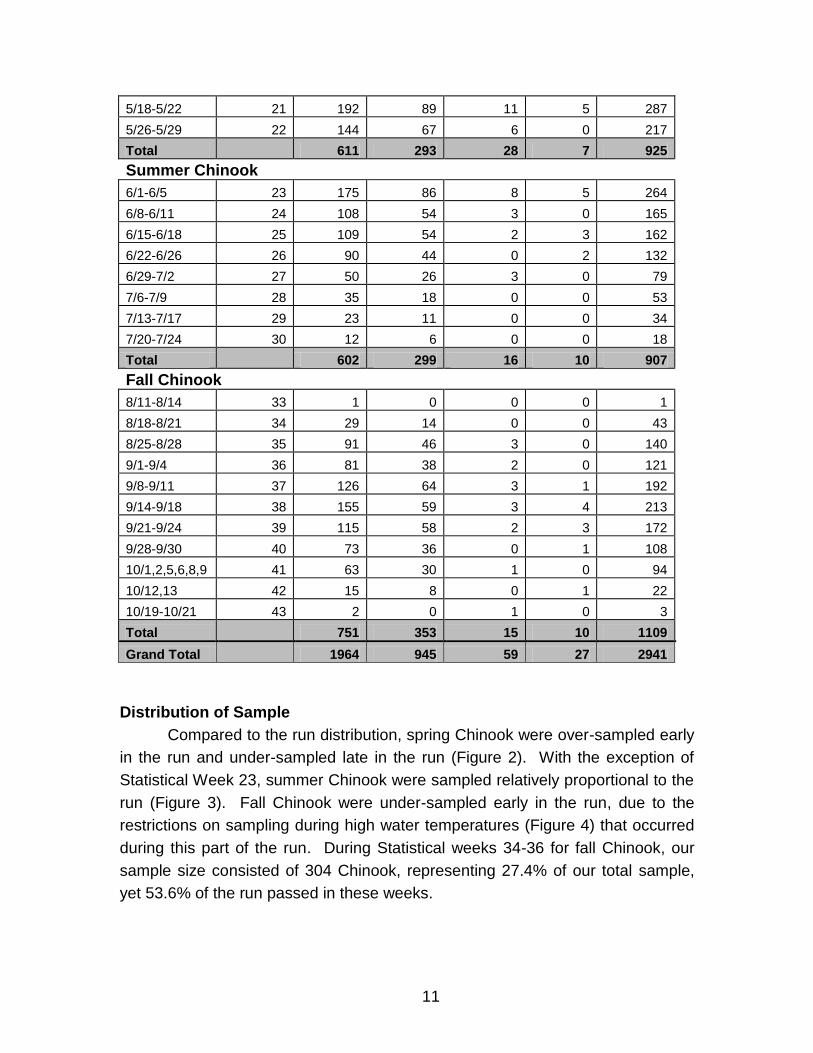
Table 4. Number of Chinook salmon PIT tagged at Bonneville Dam and tracked, by date and statistical week in 2009.
Spring Chinook
Dates Statistical
Week
12.5 mm tagged
(n)
20 mm tagged
(n)
Previously tagged
Probable tag shed
Total Tracked
(including recaps)
4/21,23,24 17 29 12 0 1 40
4/27-4/30,5/1 18 41 23 1 0 65
5/4-5/8 19 102 50 5 0 157
5/11-5/15 20 103 52 5 1 159
11
5/18-5/22 21 192 89 11 5 287
5/26-5/29 22 144 67 6 0 217
Total
611 293 28 7 925
Summer Chinook 6/1-6/5 23 175 86 8 5 264
6/8-6/11 24 108 54 3 0 165
6/15-6/18 25 109 54 2 3 162
6/22-6/26 26 90 44 0 2 132
6/29-7/2 27 50 26 3 0 79
7/6-7/9 28 35 18 0 0 53
7/13-7/17 29 23 11 0 0 34
7/20-7/24 30 12 6 0 0 18
Total
602 299 16 10 907
Fall Chinook
8/11-8/14 33 1 0 0 0 1
8/18-8/21 34 29 14 0 0 43
8/25-8/28 35 91 46 3 0 140
9/1-9/4 36 81 38 2 0 121
9/8-9/11 37 126 64 3 1 192
9/14-9/18 38 155 59 3 4 213
9/21-9/24 39 115 58 2 3 172
9/28-9/30 40 73 36 0 1 108
10/1,2,5,6,8,9 41 63 30 1 0 94
10/12,13 42 15 8 0 1 22
10/19-10/21 43 2 0 1 0 3
Total
751 353 15 10 1109
Grand Total
1964 945 59 27 2941
Distribution of Sample
Compared to the run distribution, spring Chinook were over-sampled early
in the run and under-sampled late in the run (Figure 2). With the exception of
Statistical Week 23, summer Chinook were sampled relatively proportional to the
run (Figure 3). Fall Chinook were under-sampled early in the run, due to the
restrictions on sampling during high water temperatures (Figure 4) that occurred
during this part of the run. During Statistical weeks 34-36 for fall Chinook, our
sample size consisted of 304 Chinook, representing 27.4% of our total sample,
yet 53.6% of the run passed in these weeks.

12
Figure 2. Proportion of the spring Chinook sample size and run size by statistical week at Bonneville Dam in 2009.
Figure 3. Proportion of the summer Chinook sample size and run size by statistical week at Bonneville Dam in 2009.
13
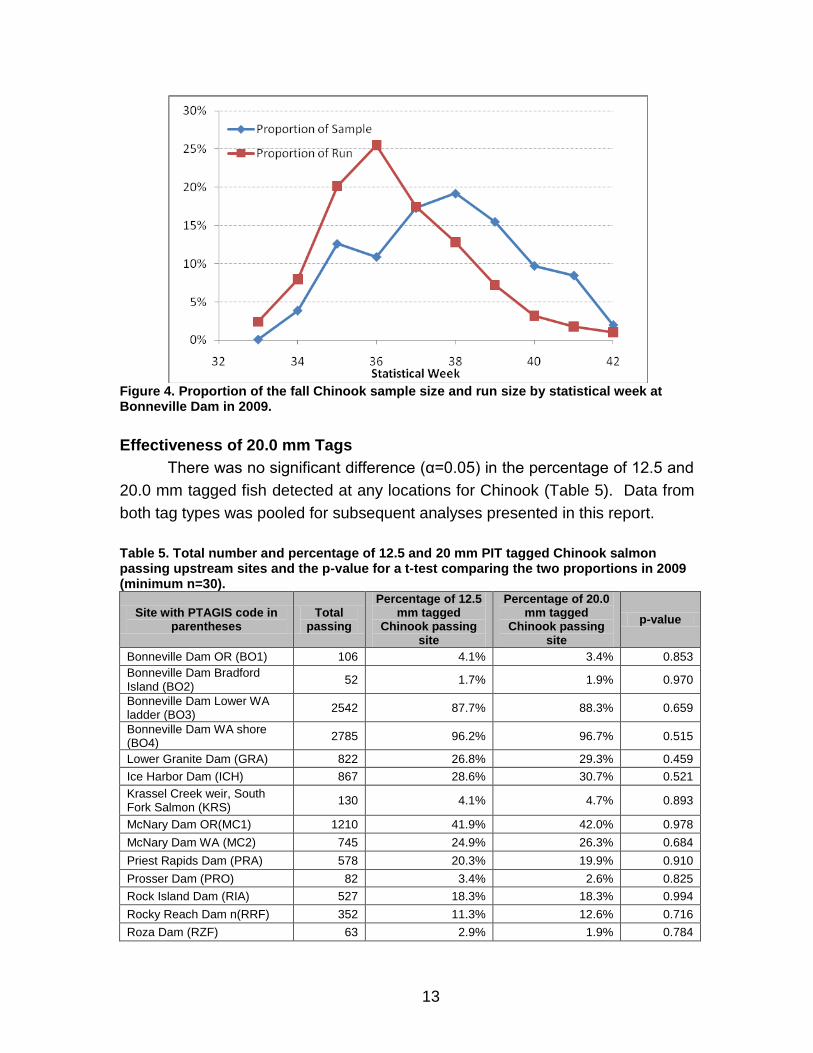
Figure 4. Proportion of the fall Chinook sample size and run size by statistical week at Bonneville Dam in 2009.
Effectiveness of 20.0 mm Tags
There was no significant difference (α=0.05) in the percentage of 12.5 and
20.0 mm tagged fish detected at any locations for Chinook (Table 5). Data from
both tag types was pooled for subsequent analyses presented in this report.
Table 5. Total number and percentage of 12.5 and 20 mm PIT tagged Chinook salmon passing upstream sites and the p-value for a t-test comparing the two proportions in 2009 (minimum n=30).
Site with PTAGIS code in parentheses
Total passing
Percentage of 12.5 mm tagged
Chinook passing site
Percentage of 20.0 mm tagged
Chinook passing site
p-value
Bonneville Dam OR (BO1) 106 4.1% 3.4% 0.853
Bonneville Dam Bradford Island (BO2)
52 1.7% 1.9% 0.970
Bonneville Dam Lower WA ladder (BO3)
2542 87.7% 88.3% 0.659
Bonneville Dam WA shore (BO4)
2785 96.2% 96.7% 0.515
Lower Granite Dam (GRA) 822 26.8% 29.3% 0.459
Ice Harbor Dam (ICH) 867 28.6% 30.7% 0.521
Krassel Creek weir, South Fork Salmon (KRS)
130 4.1% 4.7% 0.893
McNary Dam OR(MC1) 1210 41.9% 42.0% 0.978
McNary Dam WA (MC2) 745 24.9% 26.3% 0.684
Priest Rapids Dam (PRA) 578 20.3% 19.9% 0.910
Prosser Dam (PRO) 82 3.4% 2.6% 0.825
Rock Island Dam (RIA) 527 18.3% 18.3% 0.994
Rocky Reach Dam n(RRF) 352 11.3% 12.6% 0.716
Roza Dam (RZF) 63 2.9% 1.9% 0.784
14
Tumwater Dam (TUF) 91 3.4% 3.0% 0.924
Wells Dam (WEA) 299 9.4% 10.8% 0.699
Detection Numbers
Tagged salmon and steelhead can be detected multiple times at each PIT
tag detection site as they migrate, thus producing thousands of records of
detection data. For most analyses, the multiple detections of a fish at the weirs
of a site are combined into a single detection for that site. This still produces a
large number of detection records, since a single fish will be detected at multiple
sites in the Columbia River system. For each of the runs of Chinook salmon,
detection and site numbers varied; spring Chinook had 3870 fish detections at 46
sites, summer Chinook had 4613 fish detections at 29 sites, and the fall run had
3185 fish detections at 24 sites. Maps (Figure A2-A12) found in the Appendix
show the categorical ranges of detection numbers at the sites throughout the
Columbia Basin. Note that the Chinook tracked in each run is determined by the
migration timing at Bonneville, spring Chinook run ends May 31st, summer
Chinook run ends July 31st, and therefore some overlap in runs influences the
sites and numbers in each set.
Age Analysis
We are able to validate our scale aging techniques by using fish sampled
for this project at Bonneville that were previously tagged as juveniles for other
projects or hatchery programs. Age estimates from ageable scale patterns of 48
Chinook salmon that had been previously PIT tagged were correctly aged as
follows: 20 out of 21 spring Chinook, all 14 summer Chinook, and all 13 fall
Chinook salmon. Only the total age could be compared, for it was not possible to
separately validate freshwater and ocean age.
We attempted to exclude minijacks (defined as Chinook spending no
winters in saltwater) from our by not diverting Chinook less than approximately
36 cm into the sampling tank. These were excluded due to lack of importance to
fishery managers and the fact that sampling these fish would reduce our sample
of larger Chinook and other species. However five Chinook salmon were
sampled (length ranged from 37.5 to 42 cm) and after aging of scales the fish
were identified as minijacks (ages were 1.0 and 2.0). In addition, one steelhead
(39.5 cm in length) was identified as spending no winters in saltwater. These fish
were all treated like other fish at the time of sampling, so that genetic samples

15
were taken and they were tagged with PIT tags and tracked. However the age of
these fish were not used in age composition analysis.
Mainstem Dam Recoveries, Mortality, and Escapement Estimates
Spring Chinook salmon that traveled upstream of McNary Dam were
primarily bound for the Snake River (Table 6, Figures 5 and 6), while summer
Chinook were primarily bound for the Columbia River upstream of Priest Rapids
Dam (Table 6, Figures 5 and 7). Fall Chinook were primarily headed for areas
downstream of Ice Harbor and Priest Rapids dams (Table 6, Figures 5 and 8).
Over the spring/summer portion of the run, the percentage of Chinook salmon
passing Priest Rapids Dam steadily increased, while the percentage of those last
detected downstream of McNary Dam steadily decreased (Figure 5). The
percentage of Chinook that ultimately passed Ice Harbor Dam rose through the
early part of the run before dropping after Statistical Week 24.
Table 6. Percentage of spring, summer, and fall Chinook salmon tracked from Bonneville Dam detected at upstream dams and the percentage lost due to tributary escapement or mortality between dams in 2009.
Spring Chinook Summer Chinook Fall Chinook
Dam Reach Dam
Lost Reach Dam
Lost Reach Dam
Lost
Bonneville 100.0% -- 100.0% -- 100.0% --
McNary 70.5% 29.5% 86.5% 13.5% 61.8% 38.2%
Priest Rapids 12.7% 46.3% 45.4% 5.5% 7.8% 82.4%
Rock Island 12.3% 2.7% 44.6% 1.8% 3.9% 50.7%
Rocky Reach 6.2% 50.0% 32.6% 27.0% 1.7% 55.6%
Wells 5.6% 9.1% 27.6% 15.4% 0.9% 50.0%
Ice Harbor 46.9% 18.9% 38.4% 6.5% 17.2% 68.1%
Lower Granite 44.3% 5.5% 37.0% 3.6% 14.0% 18.8%
16
Figure 5. Distribution of final detection site by statistical week for Chinook salmon that were PIT tagged at Bonneville Dam in 2009.
Figure 6. Map of the Columbia River Basin from Bonneville to Wells and Lower Granite dams showing the number of spring Chinook salmon PIT tagged at Bonneville Dam, and the percentage of the run estimated to pass upstream dams in 2009.
904 tagged (includes recaps)
925 tracked
70.5%
5.6%
44.3% 12.6%
46.9%
9.1%
12.3%
Est. Zone 6
Harvest 7.7%

17
Figure 7. Map of the Columbia River Basin from Bonneville to Wells and Lower Granite dams showing the number of summer Chinook salmon PIT tagged at Bonneville Dam, and the percentage of the run estimated to pass upstream dams in 2009.
Figure 8. Map of the Columbia River Basin from Bonneville to Wells and Lower Granite dams showing the number of fall Chinook salmon PIT tagged at Bonneville Dam, and the percentage of the run estimated to pass upstream dams in 2009.
The percentage of PIT tagged Chinook salmon passing a dam without
detection was generally under 1% (Table 7). Two exceptions were McNary and
901 tagged (includes recaps)
907 recovered
86.5%%
27.6%
37.0% 45.4%
38.4%
32.6%
44.6%
Est. Zone 6
Harvest 24.2%
1104 tagged (includes recaps)
1109 recovered
61.8%
0.9%
14.0% 7.8%
17.2%
1.7%
3.9%%
Est. Zone 6
Harvest 30.5%

18
Ice Harbor dams where navigation locks provide a plausible explanation as to
how fish could pass undetecteda. Rock Island Dam is known to have problems
with detection due to the antenna size and electrical noise (D. Marvin, Pacific
States Marine Fisheries Commission, personal communication). The detection
efficiency of individual weirs within ladders is found in Table A1.
Table 7. Percentage of Chinook salmon passing a dam undetected that were subsequently detected at an upstream dam in 2009.
Dam Spring Chinook Summer Chinook
Fall Chinook
Bonneville 0.2% 0.3% 0.0%
McNary 1.1% 1.9% 1.7%
Priest Rapids 0.0% 1.5% 0.0%
Rock Island 0.9% 2.0% 0.0%
Rocky Reach 0.0% 0.7% 0.0%
Ice Harbor 3.2% 1.5% 0.0%
Escapement estimates for the entire Chinook run derived from PIT tag
detections result in estimates differing from those estimated by visual counts by -
7.4% to +12.4% at mainstem dams (Table 8).
Table 8. 2009 Chinook salmon escapement by run at Columbia Basin mainstem dams upstream of Bonneville Dam estimated from both PIT tag recoveries and dam counts and the differences between the two estimates.
Spring Chinook Salmon Summer Chinook Salmon
Site
Viewing Window Count
PIT Tag estimate
Percent
Difference
Viewing Window Count
PIT Tag estimate
Difference
McNary 113741 115104 1.2% 78319 97607 24.6%
Priest Rapids 83658 76156 -9.0% 33256 38327 15.2%
Rock Island 80731 71152 -11.9% 30849 36870 19.5%
Rocky Reach 16379 18957 15.7% 51534 56293 9.2%
Wells 18637 18241 -2.1% 52022 55199 6.1%
Ice Harbor 7176 8905 24.1% 40192 41787 4.0%
Lower Granite 8174 8032 -1.7% 29525 35057 18.7%
Fall Chinook Salmon All Chinook Salmon
McNary 166445 190403 14.4% 358505 403114 12.4%
a Fish can also pass undetected through navigation locks at Bonneville and Lower Granite dams.

19
Priest Rapids 63435 58171 -8.3% 180349 172654 -4.3%
Rock Island 56453 47536 -15.8% 168033 155558 -7.4%
Rocky Reach 46224 34524 -25.3% 114137 109774 -3.8%
Wells 16760 17159 2.4% 87419 90599 3.6%
Ice Harbor 11980 10595 -11.6% 59348 61286 3.3%
Lower Granite 6327 5642 -10.8% 44026 48731 10.7%
Tributary escapement estimates for five sites with more than 15 detections
are found in Table 9 alongside estimates using visual or trap counts at those
sites. PIT tag estimates of tributary escapement differed from visual or trap
count estimates by a much greater percentage than at mainstem dams (Table 8).
This is likely a result of smaller sample sizes of tagged fish at the tributary sites.
Chinook destined for the Yakima, Wenatchee, and South Fork Salmon
were primarily spring Chinook, while Chinook destined for the Umatilla River
were primarily fall Chinook (Figure 9). Table 9. Estimated 2009 Chinook salmon escapement, as estimated using PIT tag detections, to Tumwater, Three Mile, Prosser, and Roza dams and the South Fork Salmon Weir.
Location and
River
Number of
tag
detections
Escapement
Estimate from trap
or visual counts
Estimated
Escapement using
PIT tags
Difference
(%)
between
estimates
Tumwater Dam,
Wenatchee River 91 9,304 10,165 9.3%
South Fork
Salmon River Weir 96
Minimum estimate:
9,737b 14,966 53.7%
Three Mile Dam,
Umatilla River 18 5,621 4,865 -13.5%
Prosser Dam,
Yakima River 88 12,370 16,466 33.1%
Roza Dam,
Yakima River 53 8,633 11,714 35.7%
b Weir counts are not available during the entire migration, therefore 9,737 is a minimum estimate.
20
Figure 9. Percentage of Chinook salmon by statistical week passing Bonneville Dam in 2009 destined for the Yakima, Wenatchee, Umatilla, and South Fork Salmon based on upstream PIT tag detections at Prosser, Tumwater and Three Mile dams and the South Fork Salmon Krassel Creek weir.
Migration Timing and Passage Time
Chinook travel rates between mainstem dams generally ranged between
20 and 40 km/day. The slowest travel rates were observed between Rocky
Reach and Wells dams as well as between Rock Island and Tumwater dams
(Table 10).
Table 10. Chinook salmon travel rates between mainstem dams as estimated by PIT tag detections in 2009.
Median travel rate (km/day)
Dam pair Distance
(km) Spring
Chinook Summer Chinook
Fall Chinook
Bonneville-McNary 231 40.1 40.2 38.7
McNary-Priest Rapids 167 33.8 40.8 27.6
Priest Rapids-Rock Island 89 29.6 30.6 25.3
Rock Island-Rocky Reach 33 32.9 31.4 28.6
Rocky Reach-Wells 65 20.2 20.1 20.7
Rock Island-Tumwater 73 4.2 4.8 --
Bonneville-Rock Island 487 31.4 35.2 25.3
Bonneville-Wells 585 29.4 31.0 30.4
21
McNary-Ice Harbor 67 34.7 49.1 37.3
Ice Harbor-Lower Granite 156 36.9 40.6 32.5
Among the mainstem Columbia and Snake River dams, Chinook salmon
have the greatest median dam passage time (as determined by time between
first detection time and last detection time at a dam) at Bonneville, McNary, and
Lower Granite dams (Table 11). However, at both Bonneville and McNary dams
there is a much greater distance between the furthest downstream and furthest
upstream PIT tag detection antennas than at all other dams; conversely, the
distance between the PIT tag detection antennas at Priest Rapids, Rock Island,
Rocky Reach, and Wells dams is very short. Travel times at both Lower Granite
and Bonneville dams may also be inflated because at both sites fish may take
time to recover from sampling before moving upstream again (many fish are
trapped and sampled at Lower Granite Dam for other projects, while this project
samples fish at Bonneville Dam). Spring Chinook salmon passing Tumwater
Dam on the Wenatchee River had the greatest median passage time of over 6
days (Table 11). The median time passing Tumwater Dam decreased to 1.9
days for summer Chinook, although the percentage taking more than 12 hours to
pass the dam only dropped from 70.4% to 57.8%. Fall Chinook do not migrate
passed the dam.
Table 11. Median passage time in minutes by run from the time of first detection at a dam to time of last detection and the percentage taking more than 12 hours between first detection and last detection in 2009.
Median Passage Time (minutes)
Percentage with more than 12 hours between first detection and
last detection at a dam
Dam
Spring Chinook
Summer Chinook
Fall Chinook
Spring Chinook
Summer Chinook
Fall Chinook
Bonneville 72.7 79.3 100.5 5.9% 5.5% 9.5%
McNary- OR Shore 114.8 117.6 116.2 6.3% 5.9% 8.1%
McNary- WA Shore 58.0 64.6 55.2 1.4% 2.0% 3.5%
Priest Rapids 5.6 5.3 2.8 0.0% 1.0% 2.7%
Rock Island 21.9 33.2 125.5 12.0% 15.3% 30.6%
Rocky Reach 5.6 5.3 2.8 0.0% 1.0% 2.7%
Wells 0.5 0.8 0.5 6.0% 6.6% 0.0%
Ice Harbor 2.3 1.7 2.7 4.2% 3.3% 2.5%
Lower Granite 84.5 78.8 83.1 7.6% 5.8% 9.9%
Tumwater 9350.9 2714.8 -- 70.4% 57.8% --

22
Upstream Age and Length-at-Age Composition
All upstream age composition estimates are affected by the biased sample
caused by 2009 Bonneville Trap operations which overestimated the percentage
of Age 1.1 spring Chinook salmon (and may have also have had other
undetectable biases) as described earlier in this section (Table 12, Figure 10).
Based on this biased sample, Age 1.1 was the dominate age group passing all
Columbia and Snake river dams in 2009 for the spring run. The age composition
of summer Chinook varied; the principle age component was 1.1 passing
Bonneville, McNary, Ice Harbor, and Lower Granite dams, while Age 0.3 was
observed as the dominant age at Priest Rapids Dam and all other dams
upstream (Table 12, Figure 11). Fall Chinook were primarily Age 0.3 at all
Columbia River dams, but overwhelming jacks (Age 0.1 and 1.1) at Snake River
dams (Table 12, Figure 12). The percentage of subyearling juvenile Chinook life
history types (i.e. Age 0.x summer and fall) passing upstream of Ice Harbor into
the Snake River was much greater than the percentage passing upstream of
Priest Rapids Dam into the mid-Columbia River (Table 12, Figures 11 and 12).
Mean length-at-age composition estimates at these sites are given in Tables 13-
15.
Table 12. Age composition estimates (%) as estimated by PIT tag detections at mainstem dams of fish aged using scale pattern analysis at Bonneville Dam, for spring, summer, and fall Chinook salmon in 2009. No effort was made to adjust for Bonneville Dam trap biases.
Brood Year and Age Class Run and
Site 2007 2006 2005 2004 2003
Spring 0.1 0.2 1.1 0.3 1.2 0.4 1.3 0.5 1.4
Bonneville
48.7% 1.2% 40.9% 1.4% 7.8% 0.0% 0.0%
McNary 0.0% 0.0% 52.8% 0.6% 39.9% 0.7% 6.0% 0.0% 0.0%
Priest Rapids 0.0% 0.0% 66.0% 1.5% 22.9% 3.1% 6.5% 0.0% 0.0%
Rock Island 0.0% 0.0% 64.8% 1.5% 23.6% 3.1% 7.1% 0.0% 0.0%
Rocky Reach 0.0% 0.0% 83.1% 2.1% 1.8% 1.7% 4.6% 0.0% 0.0%
Wells 0.0% 0.0% 83.2% 2.4% 1.8% 2.0% 3.9% 0.0% 0.0%
Ice Harbor 0.0% 0.0% 49.4% 0.3% 44.1% 0.0% 6.1% 0.0% 0.0%
Lower Granite 0.0% 0.0% 49.5% 0.3% 44.5% 0.0% 5.7% 0.0% 0.0%
Summer
Bonneville 0.9% 2.3% 35.3% 17.0% 17.5% 7.8% 17.9% 0.2% 1.2%
McNary 1.1% 2.4% 34.9% 16.8% 16.6% 8.7% 18.0% 0.2% 1.5%
Priest Rapids 1.3% 2.9% 16.5% 27.5% 10.2% 16.6% 22.2% 0.3% 2.3%

23
Rock Island 1.3% 2.9% 16.3% 27.6% 10.3% 16.5% 22.1% 0.3% 2.4%
Rocky Reach 1.5% 2.9% 15.5% 29.0% 9.2% 11.3% 27.4% 0.3% 2.3%
Wells 1.2% 2.9% 16.2% 30.4% 7.0% 10.7% 27.9% 0.4% 2.8%
Ice Harbor 0.6% 0.7% 67.6% 0.0% 21.1% 0.6% 9.4% 0.0% 0.0%
Lower Granite 0.6% 0.7% 67.6% 0.0% 21.1% 0.6% 9.4% 0.0% 0.0%
Fall
Bonneville 12.8% 11.4% 7.7% 53.8% 2.8% 10.2% 1.3% 0.1% 0.0%
McNary 16.9% 11.5% 10.3% 48.1% 2.4% 9.4% 1.3% 0.0% 0.0%
Priest Rapids 11.5% 12.9% 4.8% 59.7% 0.0% 7.2% 3.9% 0.0% 0.0%
Rock Island 0.0% 13.5% 8.2% 73.9% 0.0% 4.4% 0.0% 0.0% 0.0%
Rocky Reach 0.0% 15.5% 20.6% 64.0% 0.0% 0.0% 0.0% 0.0% 0.0%
Wells 0.0% 22.2% 11.4% 66.4% 0.0% 0.0% 0.0% 0.0% 0.0%
Ice Harbor 35.8% 6.9% 27.2% 22.6% 5.9% 0.7% 1.0% 0.0% 0.0%
Lower Granite 41.9% 7.1% 19.6% 23.4% 6.8% 0.0% 1.2% 0.0% 0.0%
Figure 10. Spring Chinook age composition at Columbia and Snake river dams estimated using PIT tagged Chinook tracked by this project passing Bonneville Dam between April 1 and May 31, 2009. No effort was made to adjust for biases resulting from 2009 trap operations.

24
Figure 11. Summer Chinook age composition at Columbia and Snake river dams estimated using PIT tagged Chinook tracked by this project passing Bonneville Dam between June 1 and July 31, 2009. No effort was made to adjust for biases resulting from 2009 trap operations.
Figure 12. Fall Chinook age composition at Columbia and Snake River dams estimated using PIT tagged Chinook tracked by this project passing between August 1 and October 31, 2009. No effort was made to adjust for biases resulting from 2009 trap operations.

25
Table 13. Spring Chinook salmon length-at-age composition, as estimated by PIT tag detections of fish aged using scale pattern analysis that passed Bonneville Dam prior to between April 1 and May 31, at Columbia Basin dams upstream of McNary Dam in 2009.
Dam Statistic Brood Year and Age Class
2006 2005 2004
1.1 1.2 0.3 1.3 0.4
Priest Rapids
52.5 76.4 81.8 85.6 90.1
s 3.2 4.7 5.4 4.4 4.7
n 51 18 6 17 9
Rock Island
52.5 76.5 81.8 85.6 90
s 3.3 4.8 5.4 4.4 4.7
n 50 17 6 17 9
Rocky Reach
52.2 61 82.4 84.9 87.5
s 2.7 5.8 3.9 2.1
n 29 1 5 11 4
Wells
52.3 61 82.4 83.7 87.5
s 2.7 7.8 3.7 2.1
n 28 1 5 8 4
Tumwater
52.3 77.5 85 90.2
s 4.5 1.9 6.4 4.3
n 7 4 3 4
Ice Harbor
51.8 74.8 78 87
s 5.5 9.4 5.6 6
n 168 168 3 31
Lower Granite
51.6 74.8 78 86.6
s 5.5 9.5 5.6 6
n 160 161 3 29

26
Table 14. Summer Chinook salmon length-at-age composition, as estimated by PIT tag detections of fish aged using scale pattern analysis that passed Bonneville Dam June 1-July 31, 2009, at Columbia Basin dams upstream of McNary Dam in 2009.
Dam Statistic
Brood Year and Age Class
2007 2006 2005 2004 2003
0.1 0.2 1.1 0.3 1.2 0.4 1.3 0.5 1.4
Priest Rapids
41.9 65.5 52.4 82.5 72.8 91.8 86.6 88 91
s 4.2 7.1 9.5 6.3 7.8 6 5.6 4.5
n 5 11 59 98 34 60 83 1 7
Rock Island
41.9 65.5 52.2 82.6 72.8 91.8 86.6 88 91
s 4.2 7.1 9.6 6.3 7.8 6 5.6 4.5
n 5 11 57 97 34 59 81 1 7
Rocky Reach
41.9 66.8 53.4 82.6 70.7 90.5 86.5 88 91
s 4.2 7.2 6.9 6.4 7.4 6.1 5.6 5.5
n 5 9 43 73 23 26 75 1 5
Wells
40.5 68.8 53.4 82.2 70.2 89.7 86.9 88 91
s 3.5 5.3 7.1 6.3 7.3 6 5.7 5.5
n 3 7 37 65 16 22 63 1 5
Tum-water
60 48.5 83.4 75 92 84.1
s 14.9 4.9 6.8 6.1 1.4
n 1 14 14 5 16 4
Ice Harbor
56 70.8 56.1 78.2 92.2 85.6
s 7 7.5 4.2 7.9 7.6
n 1 3 161 100 3 32
Lower Granite
56 70.8 55.9 78.2 92.2 85.8
s 7 7.6 4.2 7.9 4.6
n 1 3 155 97 3 31

27
Table 15. Chinook salmon length-at-age composition, as estimated by PIT tag detections of fish aged using scale pattern analysis that passed Bonneville, for fall Chinook salmon at Columbia Basin dams upstream of McNary Dam in 2009.
Dam Statistic
Brood Year and Age Class
2007 2006 2005 2004
0.1 0.2 1.1 0.3 1.2 0.4 1.3
Priest Rapids
49.5 65.3 55.5 81.4 92.2 77.8
s 3.2 6 8.3 5.4 6.1 5.3
n 8 11 4 40 4 2
Rock Island
67 57 82 98
s 2.9 9.5 3.7
n 5 3 25 1
Rocky Reach
67.7 57 82.1
s 3.3 9.5 3.1
n 3 3 9
Wells
69.8 67 82.2
s 3.9 1.8
n 2 1 4
Tumwater
s
n
Ice Harbor
47.4 67.6 58.5 80.7 73.2 90 81
s 3.6 4 4.3 7.3 5.9
n 63 9 36 21 6 2 1
Lower Granite
47.5 67.7 58.2 79.6 75.3 81
s 3.6 4.3 3.3 6.6 3.4
n 61 8 23 19 5 1
Fallback
Estimated fallback-reascension rates based on Chinook salmon
reascending fish ladders ranged from 0% to 11.4% (Table 16). These rates likely
underestimate the true fallback rates as they do not include any fish that
ascended a dam, fell back, and then were not subsequently detected.
Table 16. Estimated Chinook salmon fallback and reascension at mainstem Columbia River dams in 2009 as estimated by PIT tags.
Dam Spring Chinook (%) Summer Chinook (%) Fall Chinook (%)
McNary 2.0 1.4 2.8
Priest Rapids 0.0 1.3 2.7
Rock Island 0.7 4.7 11.4
Rocky Reach 0.0 6.3 0.0
Wells 8.0 7.0 0.0
Tumwater 4.7 5.7 na
Ice Harbor 0.0 11.1 3.2
28
Lower Granite 0.0 8.3 8.1
Mean 1.9 5.7 3.5
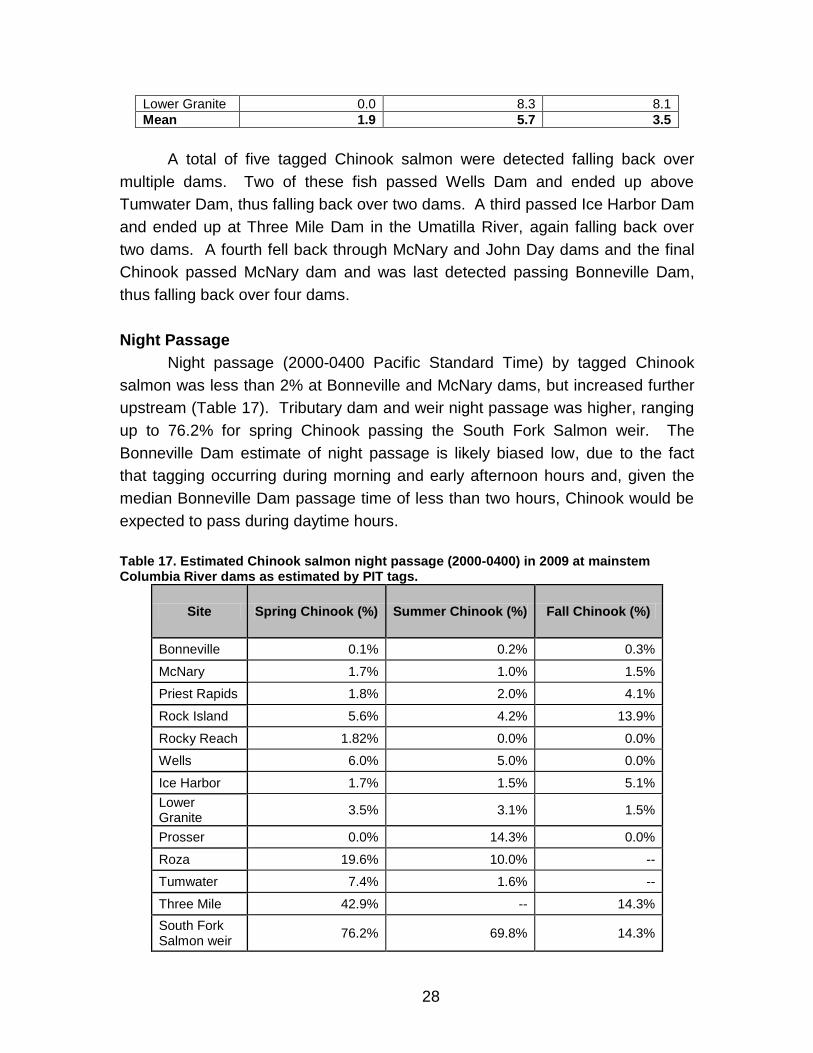
A total of five tagged Chinook salmon were detected falling back over
multiple dams. Two of these fish passed Wells Dam and ended up above
Tumwater Dam, thus falling back over two dams. A third passed Ice Harbor Dam
and ended up at Three Mile Dam in the Umatilla River, again falling back over
two dams. A fourth fell back through McNary and John Day dams and the final
Chinook passed McNary dam and was last detected passing Bonneville Dam,
thus falling back over four dams.
Night Passage
Night passage (2000-0400 Pacific Standard Time) by tagged Chinook
salmon was less than 2% at Bonneville and McNary dams, but increased further
upstream (Table 17). Tributary dam and weir night passage was higher, ranging
up to 76.2% for spring Chinook passing the South Fork Salmon weir. The
Bonneville Dam estimate of night passage is likely biased low, due to the fact
that tagging occurring during morning and early afternoon hours and, given the
median Bonneville Dam passage time of less than two hours, Chinook would be
expected to pass during daytime hours.
Table 17. Estimated Chinook salmon night passage (2000-0400) in 2009 at mainstem Columbia River dams as estimated by PIT tags.
Site Spring Chinook (%) Summer Chinook (%) Fall Chinook (%)
Bonneville 0.1% 0.2% 0.3%
McNary 1.7% 1.0% 1.5%
Priest Rapids 1.8% 2.0% 4.1%
Rock Island 5.6% 4.2% 13.9%
Rocky Reach 1.82% 0.0% 0.0%
Wells 6.0% 5.0% 0.0%
Ice Harbor 1.7% 1.5% 5.1%
Lower Granite
3.5% 3.1% 1.5%
Prosser 0.0% 14.3% 0.0%
Roza 19.6% 10.0% --
Tumwater 7.4% 1.6% --
Three Mile 42.9% -- 14.3%
South Fork Salmon weir
76.2% 69.8% 14.3%

29
RESULTS-STEELHEAD
Sample Size
A total of 1614 steelhead were tagged with 12.5 mm PIT tags in 2009. An
additional 794 steelhead were tagged with 20 mm PIT tags. After adding
previously tagged fish (which were sampled and therefore identified for the
tracking study and included in our sample) and subtracting fish that were not
detected after release (likely a result of the tags being shed), the numbers of
steelhead tracked upstream consisted of 2474 steelhead, 1641 with 12.5mm tags
and 790 with 20 mm tags (Table 18).
Table 18. Number of steelhead PIT tagged at Bonneville Dam and tracked by date and statistical week in 2009. No sampling occurred during Statistical Week 32 due to water temperatures above 22.2 C (72.0 F) shutting down the Bonneville Dam Adult Fish Facility.
Dates
Po
ole
d S
tati
sti
cal
Wee
k
12.5
mm
tag
ged
(n)
20 m
m t
ag
ged
(n
)
Pre
vio
usly
tag
ged
12.5
m
m N
ot
Dete
cte
d P
as
sin
g
Bo
nn
eville
20 m
m N
ot
Dete
cte
d P
as
sin
g
Bo
nn
eville
12.5
mm
tra
cked
20 m
m t
rack
ed
To
tal T
rac
ked
4/21,23,24,27-30,5/1,4-8 19 17 10 2 2 1 17 9 26
5/11-5/15 20 12 5 0 0 0 12 5 17
5/18-5/22 21 7 4 0 0 0 7 4 11
5/26-5/29 22 12 7 0 1 0 11 7 18
6/1-6/5 23 25 11 1 1 0 25 11 36
6/8-6/11 24 18 9 1 1 0 18 9 27
6/15-6/18 25 11 5 0 0 0 11 5 16
6/22-6/26 26 37 17 3 3 0 37 17 54
6/29-7/2 27 39 20 1 1 1 39 19 58
7/6-7/9 28 83 42 1 1 0 83 42 125
7/13-7/17 29 203 100 4 8 2 199 98 297
7/20-7/24 30 224 111 3 3 0 224 111 335
7/27-7/28 31 68 33 2 3 0 67 33 100
8/11-8/14 33 129 60 8 9 0 128 60 188
8/18-8/21 34 126 62 3 5 1 124 61 185
8/25-8/28 35 87 41 4 4 0 87 41 128
9/1-9/4 36 44 22 0 0 0 44 22 66
9/8-9/11 37 60 28 4 4 0 60 28 90
9/14-9/18 38 130 50 1 1 0 130 50 180
9/21-9/24 39 81 40 0 0 0 81 40 121

30
9/28-9/30 40 107 53 0 0 0 107 53 160
10/1,2,5,6, 8,9 41 82 42 0 0 0 82 42 124
10/12,13 42 30 15 1 3 0 28 15 43
10/19-10/21 43 19 8 0 1 1 18 7 25
Total
1651 795 39 51 6 1639 789 2428
Distribution of sample
Compared to the run distribution, steelhead were over-sampled early in
the run and under-sampled during the peak of the run (Figure 13). No sampling
was conducted during Statistical Week 32, a week in which 3.6% of the
steelhead run passed, due to water temperatures above 22.2C (72.0 F) closing
the Bonneville Dam Adult Fish Facility. During three weeks that the run quickly
jumps to its’ peak (Statistical weeks 32-34), our sample size consisted of 380
steelhead (15.4% of our total sample) during which 45.3% of the run passed
Bonneville Dam. During Statistical weeks 31-36 when 70.7% of the run passed
Bonneville Dam, our sample consisted of 677 steelhead (27.4% of our sample).
Figure 13. Proportion of the steelhead sample size and run by statistical week at Bonneville Dam in 2009.
Effectiveness of 20 mm Tags
There was no significant difference (α=0.05) in the percentage of 12.5 and
20.0 mm tagged steelhead detected at any upstream locations for steelhead
(Table 19). Data from both tag types was pooled for subsequent analyses
presented in this report.

31
Table 19. Total number and percentage of 12.5 and 20 mm PIT tagged steelhead passing upstream sites and the p-value for a t-test comparing the tag type proportions in 2009 (minimum n=30).
PTAGIS Site
Location Total
Passing
% of 12.5 mm Tagged
Steelhead Passing
% of 20.0 mm Tagged
Steelhead Passing
P-Value
BO1 Bonneville Dam 129 5.0% 5.9% 0.819
BO2 Bonneville Dam 72 3.0% 2.8% 0.951
BO3 Bonneville Dam 2033 82.2% 84.9% 0.128
BO4 Bonneville Dam 2309 95.0% 93.1% 0.058
GRA Lower Granite Dam 1037 43.3% 40.6% 0.416
ICH Ice Harbor Dam 1211 50.0% 48.5% 0.625
MC1 McNary Dam 1211 50.1% 48.2% 0.543
MC2 McNary Dam 385 16.1% 14.9% 0.771
PRA Priest Rapids Dam 157 6.8% 5.5% 0.762
PRO Prosser Dam 36 1.2% 2.0% 0.843
RIA Rock Island Dam 131 5.8% 4.4% 0.749
RRF Rocky Reach Dam 109 4.7% 3.9% 0.849
WEA Wells Dam 91 4.0% 3.1% 0.847 Table A3 in the Appendix lists the PTAGIS sites full name and the three-letter codes.
Detection Numbers
Like Chinook salmon, steelhead can be detected multiple times at each
PIT tag detection site as they migrate, and some of them can be detected for
multiple years as repeat spawners (see the Kelt section). For the 2431 steelhead
tracked in 2009, there were 9752 fish detections at 66 sites. Maps (Figure A13-
A16) found in the Appendix show the categorical ranges of detection numbers at
the sites throughout the Columbia Basin.
Age Analysis
We are able to validate our scale aging techniques by using fish sampled
for this project at Bonneville that were previously tagged as juveniles for other
projects or hatchery programs. Age estimates from ageable scale patterns for 31
out of 33 steelhead that had been previously PIT tagged were correctly aged.
Only the total age could be compared for it was not possible to separately
validate freshwater and ocean age.
Mainstem Dam Recoveries, Mortality, and Escapement Estimates
Data on tag detections was last downloaded from www.ptagis.org on July
13, 2011. An estimated 51.8% of the steelhead run passed Ice Harbor Dam
(Table 20, Figure 14). The proportion of steelhead bound for the Snake River
steadily increased as the run progressed (Figures 15 and 16).

32
Table 20. Percentage of Steelhead tracked from Bonneville Dam and detected at upstream dams and the percentage “lost” between sequential dams in 2009.
Dam Dam Reached Lost
Bonneville 100.0% --
McNary 66.1% 33.9%
Priest Rapids 6.5% 90.2%
Rock Island 5.5% 15.9%
Rocky Reach 4.5% 16.7%
Wells 3.8% 16.4%
Ice Harbor 51.8% 21.7%
Lower Granite 45.5% 12.2%
2443 tagged (includes recaps)
2431 tracked
66.1%
3.8%
45.5% 6.5%
51.8%
4.5%
5.5%
Est. Zone 6
Harvest %6.3
Figure 14. Map of the Columbia River Basin from Bonneville to Wells and Lower Granite dams showing the number of steelhead PIT tagged at Bonneville Dam, and the percentage of the run estimated to pass upstream dams in 2009.
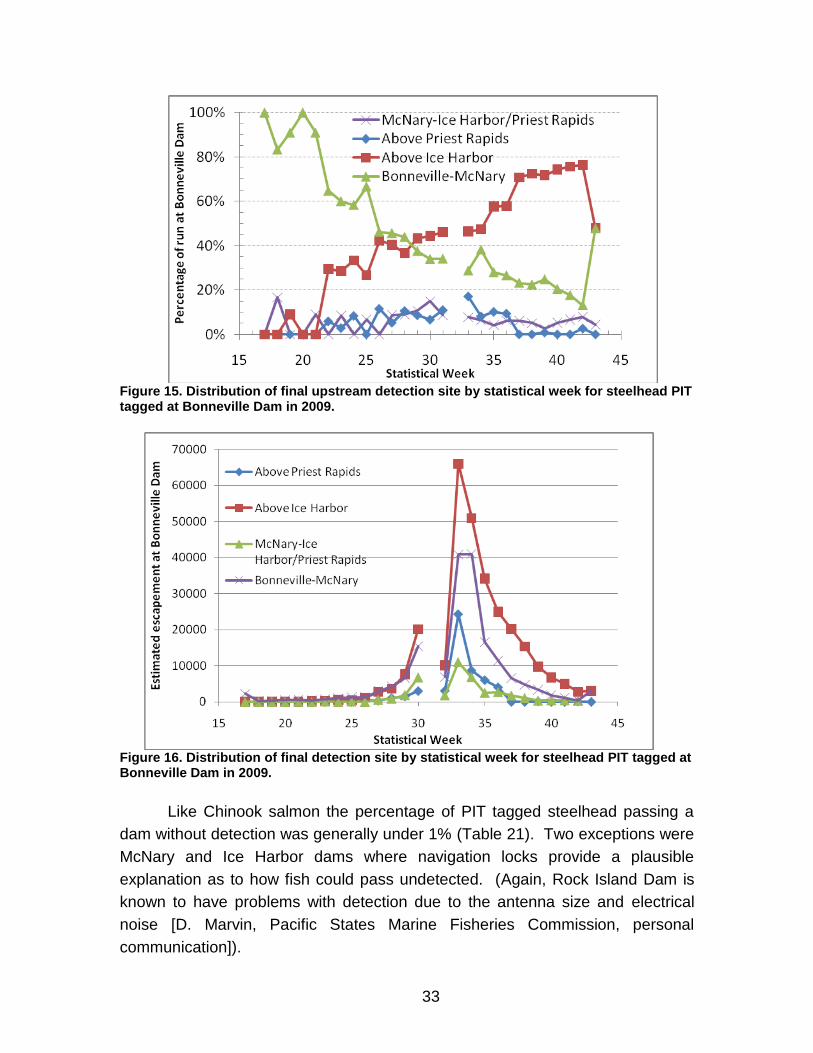
33
Figure 15. Distribution of final upstream detection site by statistical week for steelhead PIT tagged at Bonneville Dam in 2009.
Figure 16. Distribution of final detection site by statistical week for steelhead PIT tagged at Bonneville Dam in 2009.
Like Chinook salmon the percentage of PIT tagged steelhead passing a
dam without detection was generally under 1% (Table 21). Two exceptions were
McNary and Ice Harbor dams where navigation locks provide a plausible
explanation as to how fish could pass undetected. (Again, Rock Island Dam is
known to have problems with detection due to the antenna size and electrical
noise [D. Marvin, Pacific States Marine Fisheries Commission, personal
communication]).

34
Table 21. Percentage of steelhead passing a dam undetected that were subsequently detected at an upstream dam in 2009 (12 mm & 20 mm tags pooled).
Dam 20.0 mm tags 12.5 mm tags Combined
Bonneville 0.25% 0.12% 0.16%
McNary 0.59% 0.82% 0.74%
Priest Rapids 0.00% 0.00% 0.00%
Rock Island 0.00% 1.02% 0.76%
Rocky Reach 0.00% 0.00% 0.00%
Ice Harbor 1.00% 0.47% 0.64%
Migration Timing and Passage Time
The fastest median travel rate between dams, as measured in kilometers
per day, was between McNary and Priest Rapids Dam (27.6 km per day), while
the slowest was 2.8 km/day between Rock Island and Tumwater dams (Table
22).
Table 22. Steelhead travel rate between mainstem dams as estimated by PIT tag detections in 2009.
Steelhead
Dam pair Distance (km) Median travel rate
(km/day)
Bonneville-McNary 231 15.5
McNary-Priest Rapids
167 27.6
Priest Rapids-Rock Island
89 22.6
Rock Island-Rocky Reach
33 17.1
Rocky Reach-Wells 65 19.6
Rock Island-Tumwater
73 2.8
Bonneville-Rock Island
487 21.3
Bonneville-Wells 585 17.6
McNary-Ice Harbor 67 27.3
Ice Harbor-Lower Granite
156 22.5

35
Median steelhead passage times (Table 23) at the mainstem dams, as
measured from first to last detection within the ladders, were generally less than
that for Chinook salmon (Table 11). Bonneville, McNary, and Lower Granite
dams had the greatest median passage time among mainstem Columbia Basin
dams. However, at both Bonneville and McNary dams there is a much greater
distance between the furthest downstream and furthest upstream PIT tag
detection antennas than at all other dams; conversely, the distance between the
PIT tag detection antennas at Priest Rapids, Rock Island, Rocky Reach, and
Wells dams is very short. Travel times at both Lower Granite and Bonneville
dams may also be inflated, because at both sites, fish may take time to recover
from sampling before moving upstream again (many fish are trapped and
sampled at Lower Granite Dam for other projects, while this project samples fish
at Bonneville Dam).
Table 23. Steelhead median passage times from time of first detection at a dam to time of last detection and the percentage taking more than 12 hours between first detection and last detection in 2009.
Dam
Median Passage Time (minutes)
Percentage with more than 12 hours between first detection
and last detection at a dam
Bonneville 76.8 8.5%
McNary- OR Shore
98.5 7.5%
McNary- WA Shore
60.7 7.0%
Priest Rapids 4.4 2.7%
Rock Island 28.0 4.0%
Rocky Reach 6.2 1.9%
Wells 0.7 2.2%
Ice Harbor 3.9 3.5%
Lower Granite 83.4 11.4%
Tumwater 3.9 3.5%
Upstream Age and Length-at-Age Composition
As was previously noted, Bonneville trap operations resulted in a biased
Chinook sample that affected Chinook age composition. It is unknown whether
there were similar biases affecting steelhead age composition. The percentage
of Age 1.1 steelhead passing upstream dams ranged from 42.2% at Lower
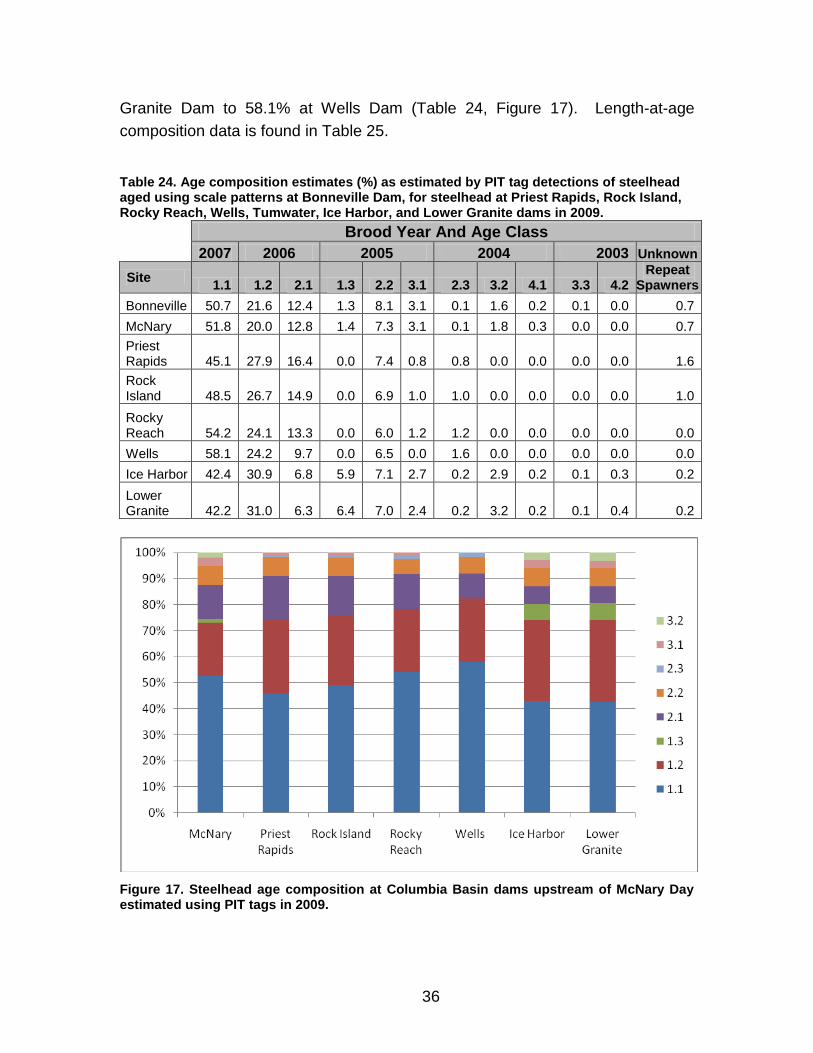
36
Granite Dam to 58.1% at Wells Dam (Table 24, Figure 17). Length-at-age
composition data is found in Table 25.
Table 24. Age composition estimates (%) as estimated by PIT tag detections of steelhead aged using scale patterns at Bonneville Dam, for steelhead at Priest Rapids, Rock Island, Rocky Reach, Wells, Tumwater, Ice Harbor, and Lower Granite dams in 2009.
Brood Year And Age Class
2007 2006 2005 2004 2003 Unknown
Site 1.1 1.2 2.1 1.3 2.2 3.1 2.3 3.2 4.1 3.3 4.2
Repeat Spawners
Bonneville 50.7 21.6 12.4 1.3 8.1 3.1 0.1 1.6 0.2 0.1 0.0 0.7
McNary 51.8 20.0 12.8 1.4 7.3 3.1 0.1 1.8 0.3 0.0 0.0 0.7
Priest Rapids 45.1 27.9 16.4 0.0 7.4 0.8 0.8 0.0 0.0 0.0 0.0 1.6
Rock Island 48.5 26.7 14.9 0.0 6.9 1.0 1.0 0.0 0.0 0.0 0.0 1.0
Rocky Reach 54.2 24.1 13.3 0.0 6.0 1.2 1.2 0.0 0.0 0.0 0.0 0.0
Wells 58.1 24.2 9.7 0.0 6.5 0.0 1.6 0.0 0.0 0.0 0.0 0.0
Ice Harbor 42.4 30.9 6.8 5.9 7.1 2.7 0.2 2.9 0.2 0.1 0.3 0.2
Lower Granite 42.2 31.0 6.3 6.4 7.0 2.4 0.2 3.2 0.2 0.1 0.4 0.2
Figure 17. Steelhead age composition at Columbia Basin dams upstream of McNary Day estimated using PIT tags in 2009.
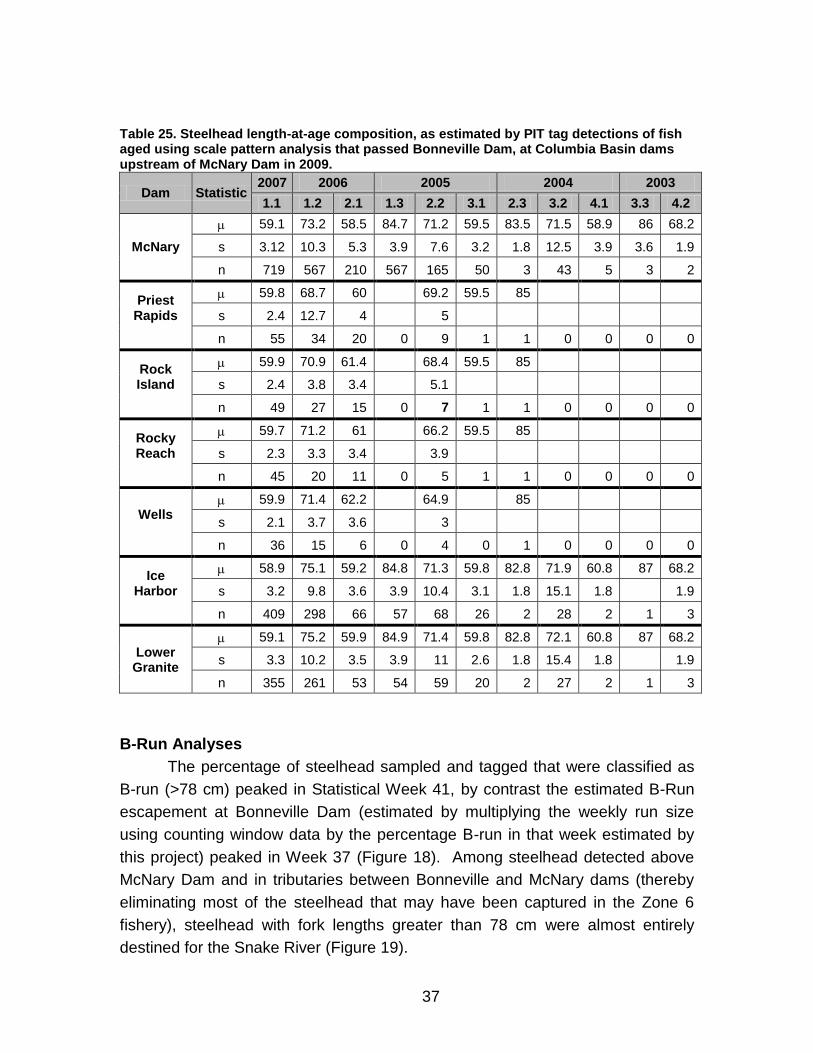
37
Table 25. Steelhead length-at-age composition, as estimated by PIT tag detections of fish aged using scale pattern analysis that passed Bonneville Dam, at Columbia Basin dams upstream of McNary Dam in 2009.
Dam Statistic 2007 2006 2005 2004 2003
1.1 1.2 2.1 1.3 2.2 3.1 2.3 3.2 4.1 3.3 4.2
McNary
59.1 73.2 58.5 84.7 71.2 59.5 83.5 71.5 58.9 86 68.2
s 3.12 10.3 5.3 3.9 7.6 3.2 1.8 12.5 3.9 3.6 1.9
n 719 567 210 567 165 50 3 43 5 3 2
Priest Rapids
59.8 68.7 60 69.2 59.5 85
s 2.4 12.7 4 5
n 55 34 20 0 9 1 1 0 0 0 0
Rock Island
59.9 70.9 61.4 68.4 59.5 85
s 2.4 3.8 3.4 5.1
n 49 27 15 0 7 1 1 0 0 0 0
Rocky Reach
59.7 71.2 61 66.2 59.5 85
s 2.3 3.3 3.4 3.9
n 45 20 11 0 5 1 1 0 0 0 0
Wells
59.9 71.4 62.2 64.9 85
s 2.1 3.7 3.6 3
n 36 15 6 0 4 0 1 0 0 0 0
Ice Harbor
58.9 75.1 59.2 84.8 71.3 59.8 82.8 71.9 60.8 87 68.2
s 3.2 9.8 3.6 3.9 10.4 3.1 1.8 15.1 1.8 1.9
n 409 298 66 57 68 26 2 28 2 1 3
Lower Granite
59.1 75.2 59.9 84.9 71.4 59.8 82.8 72.1 60.8 87 68.2
s 3.3 10.2 3.5 3.9 11 2.6 1.8 15.4 1.8 1.9
n 355 261 53 54 59 20 2 27 2 1 3
B-Run Analyses
The percentage of steelhead sampled and tagged that were classified as
B-run (>78 cm) peaked in Statistical Week 41, by contrast the estimated B-Run
escapement at Bonneville Dam (estimated by multiplying the weekly run size
using counting window data by the percentage B-run in that week estimated by
this project) peaked in Week 37 (Figure 18). Among steelhead detected above
McNary Dam and in tributaries between Bonneville and McNary dams (thereby
eliminating most of the steelhead that may have been captured in the Zone 6
fishery), steelhead with fork lengths greater than 78 cm were almost entirely
destined for the Snake River (Figure 19).
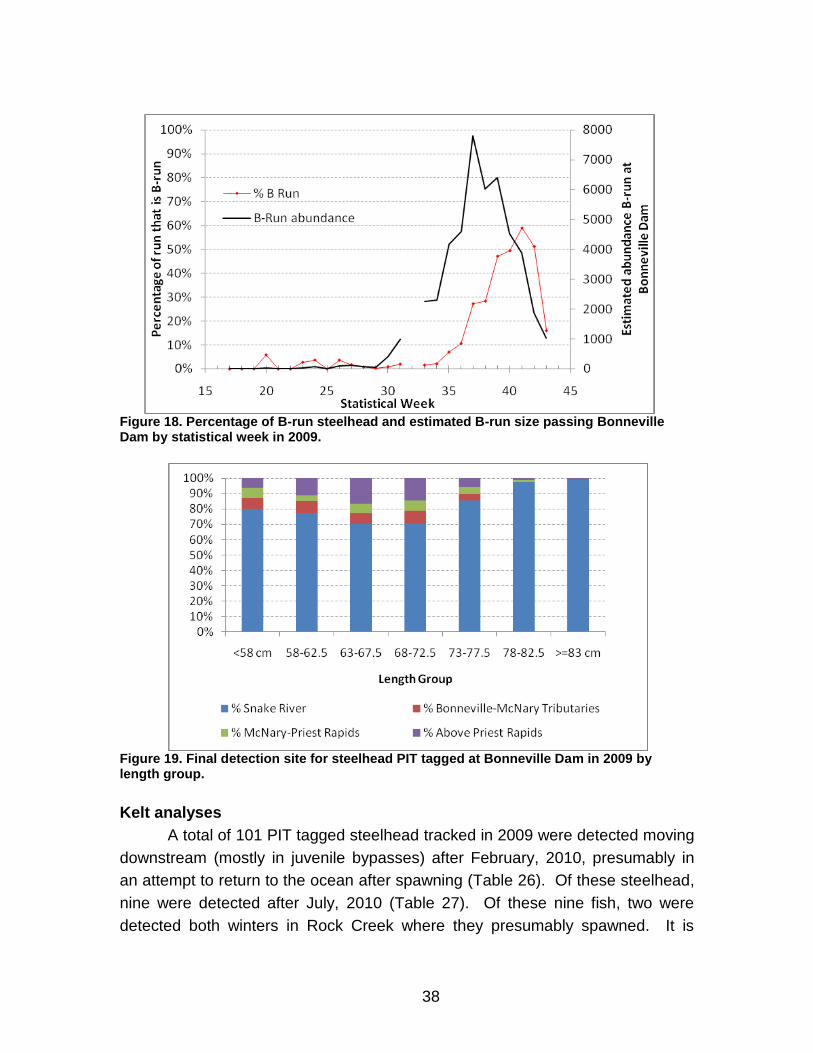
38
Figure 18. Percentage of B-run steelhead and estimated B-run size passing Bonneville Dam by statistical week in 2009.
Figure 19. Final detection site for steelhead PIT tagged at Bonneville Dam in 2009 by length group.
Kelt analyses
A total of 101 PIT tagged steelhead tracked in 2009 were detected moving
downstream (mostly in juvenile bypasses) after February, 2010, presumably in
an attempt to return to the ocean after spawning (Table 26). Of these steelhead,
nine were detected after July, 2010 (Table 27). Of these nine fish, two were
detected both winters in Rock Creek where they presumably spawned. It is

39
interesting to note that four of the six steelhead detected moving downstream
through Bonneville Dam in the spring of 2010 were detected in the Bonneville
Corner Collector April 14 and 15. One of these six steelhead spent 36 hours in
the Bonneville juvenile bypass (B2J). The 101 steelhead we designated as kelt
formed a relatively consistent percentage of the run (between 3 and 7% in 14
statistical weeks) on a weekly basis at Bonneville Dam on their 2009 upstream
migration (Figure 20).
Table 26. PIT tagged steelhead tracked in 2009 last detected moving downstream listed by last downstream detection site.
Last site Number
Bonneville Corner Collector 61
Bonneville Juvenile Bypass 7
Rocky Reach Juvenile Bypass 7
Little Goose Juvenile Bypass 6
Lower Monumental Juvenile Bypass 4
McNary Dam Juvenile Bypass 4
Lower Granite Juvenile Bypass 3
John Day Juvenile Bypass 3
Lower Washington Shore McNary Dam ladder, likely moving downstream.
1
Estuary trawl 1

40
Table 27. Season by season activities of several steelhead tagged in 2009 and later labeled as kelts when they began migrating downstream and upstream presumably to and from the ocean.
Tag NumberLast Summer Detection
After Tagging 2009Fall 2009 Winter 2009/10 Spring 2010 Summer 2010 Fall 2010 Winter 2010/11 Spring 2011 Summer 2011 Comments
Rock Creek Lower -
March 5th
Bonneville Dam Corner
Collector - April 14th.
Bonneville Oregon Shore
Ladder - October 19th
Bonneville Washington
Shore Ladder - October 21st
3D9.1C2D0A2039 McNary - September 7thRock Creek two sites -
February 6th to 27th.
Bonneville Dam Corner
Collector - April 14th.
Bonneville Oregon Shore
Ladder - August 21stMcNary - September 21st
Rock Creek Lower -
February 6th into March
Rock Creek two sites -
From February to March
22nd
Tracked to Rock Creek for spawning in two
consecutive years.
3D9.1C2D07DAB8Bonneville Washington
Shore Ladder - June 8th
Bonneville Dam Corner
Collector - April 14th.
Bonneville Washington
Shore Ladder - July 29th
Bonneville Dam Corner
Collector - April 18th.
Unknown spawning location, but tracked two
different years leaving in the spring for the
ocean.
3D9.1C2D077D0DLower Granite - September
27th
Bonneville Dam Corner
Collector - May 5th.
Bonneville Oregon Shore
Ladder - August 27th
Lower Granite - September
17th
3D9.1C2D070406 McNary - July 17th Ice Harbor - November 4thBonneville Washington
Shore Ladder - July 12th
3D9.1C2D0A1E39Bonneville Washington
Shore Ladder - July 21st
Threemile Dam Umatilla R -
May 17th
Bonneville Washington
Shore Ladder - July 1st
Bonneville Washington
Shore Ladder - July 14th
Ice Harbor - August 14th
3D9.1C2D2C8D5APriest Rapids Dam - August
13th
Prosser Dam - November
4thProsser Dam - October 14th
Female steelhead collected at Prosser Dam for
reconditioning and released in October 2010 for
spawning.
Key - - - Upstream Downstream Spawning
Tracked to Rock Creek for spawning in two
consecutive years and is headed out to the ocean
again.
3D9.1C2D2CA56ABonneville Washington
Shore Ladder - August 19th
John Day Juvenile -
November 27th
Rock Creek Lower -
January 22nd to February
24th
Bonneville Oregon Shore
Ladder - August 21st
Rock Creek Lower -
December 21st to February
22nd
Bonneville Dam Corner
Collector - April 7th.
3D9.1C2D0B162EBonneville Washington
Shore Ladder - August 11th
Bonneville Dam Corner
Collector - April 15th.
Bonneville Oregon Shore
Ladder - September 10th
3D9.1C2D08326A Ice Harbor - July 26thLower Monumental
Juvenile - Oct 12th
Bonneville Juvenile - April
26th to 28th
Spent 36 hours in Bonneville Juvenile Bypass,
moving up and down passed the detection coils .
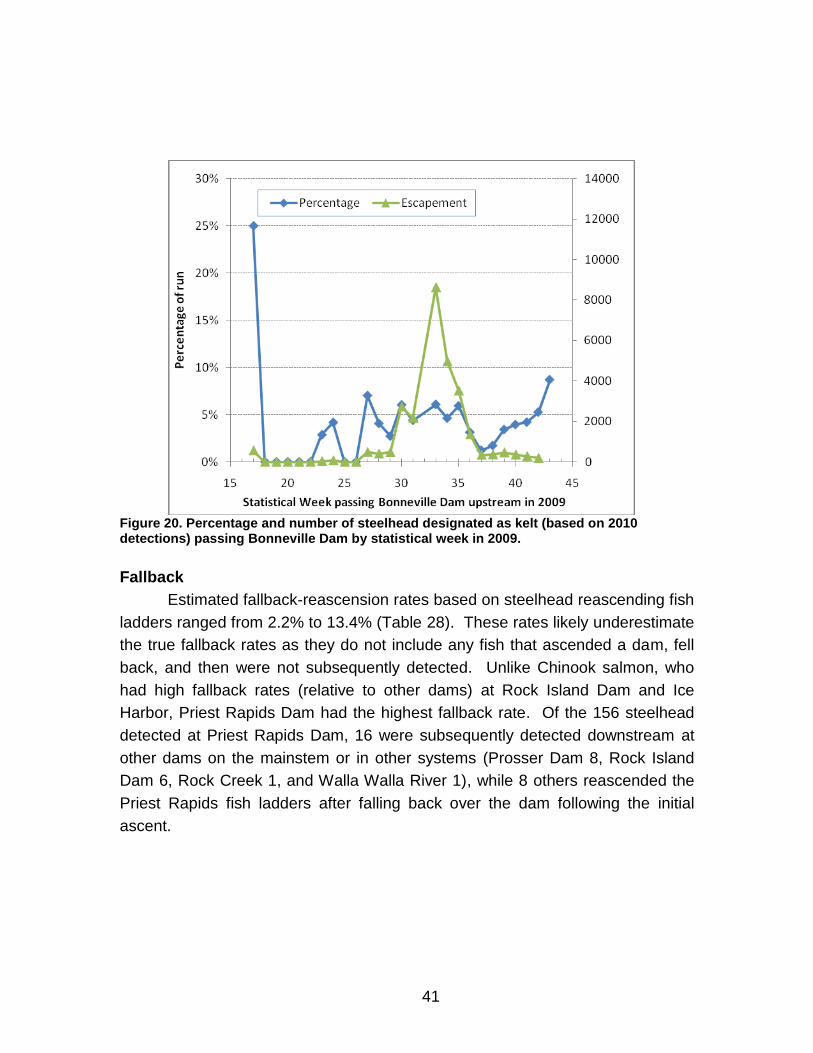
41
Figure 20. Percentage and number of steelhead designated as kelt (based on 2010 detections) passing Bonneville Dam by statistical week in 2009.
Fallback
Estimated fallback-reascension rates based on steelhead reascending fish
ladders ranged from 2.2% to 13.4% (Table 28). These rates likely underestimate
the true fallback rates as they do not include any fish that ascended a dam, fell
back, and then were not subsequently detected. Unlike Chinook salmon, who
had high fallback rates (relative to other dams) at Rock Island Dam and Ice
Harbor, Priest Rapids Dam had the highest fallback rate. Of the 156 steelhead
detected at Priest Rapids Dam, 16 were subsequently detected downstream at
other dams on the mainstem or in other systems (Prosser Dam 8, Rock Island
Dam 6, Rock Creek 1, and Walla Walla River 1), while 8 others reascended the
Priest Rapids fish ladders after falling back over the dam following the initial
ascent.
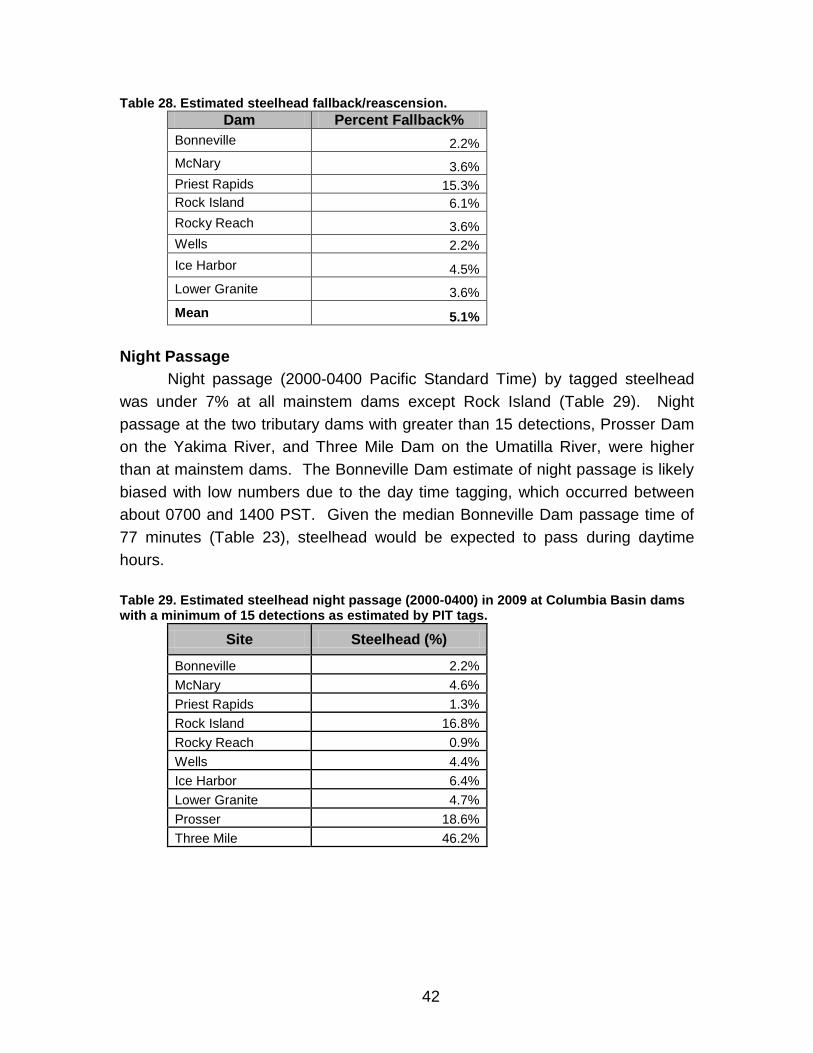
42
Table 28. Estimated steelhead fallback/reascension.
Dam Percent Fallback%
Bonneville 2.2%
McNary 3.6%
Priest Rapids 15.3%
Rock Island 6.1%
Rocky Reach 3.6%
Wells 2.2%
Ice Harbor 4.5%
Lower Granite 3.6%
Mean 5.1%
Night Passage
Night passage (2000-0400 Pacific Standard Time) by tagged steelhead
was under 7% at all mainstem dams except Rock Island (Table 29). Night
passage at the two tributary dams with greater than 15 detections, Prosser Dam
on the Yakima River, and Three Mile Dam on the Umatilla River, were higher
than at mainstem dams. The Bonneville Dam estimate of night passage is likely
biased with low numbers due to the day time tagging, which occurred between
about 0700 and 1400 PST. Given the median Bonneville Dam passage time of
77 minutes (Table 23), steelhead would be expected to pass during daytime
hours.
Table 29. Estimated steelhead night passage (2000-0400) in 2009 at Columbia Basin dams with a minimum of 15 detections as estimated by PIT tags.
Site Steelhead (%)
Bonneville 2.2%
McNary 4.6%
Priest Rapids 1.3%
Rock Island 16.8%
Rocky Reach 0.9%
Wells 4.4%
Ice Harbor 6.4%
Lower Granite 4.7%
Prosser 18.6%
Three Mile 46.2%

43
RESULTS-SOCKEYEc
Sample Size
A total of 850 sockeye salmon were sampled between June 3 and July 9,
2009. Sampling was halted when PIT tag detections at Ice Harbor and Lower
Granite dams indicated we had exceeded our permitted sample size of three
ESA-listed Snake River sockeye salmon. Less than 3% of the sockeye run
passed Bonneville Dam subsequent to the termination of sampling. Of the 850
fish sampled, a total of 838 sockeye salmon were released with working PIT tags
(Table 30). The remaining 12 fish were either not PIT tagged, or were PIT
tagged but the tags were not detected when scanned. An additional 31 fish were
never detected after release. These fish may have shed their tags, had defective
tags, died, or passed downstream undetected through antennas that do not
detect sockeye salmon well (Table A2). It is less likely that sockeye salmon pass
upstream undetected as they must swim through antennas at fish counting
windows, but data from 2006-2009 indicates it does happen (Table 31),
particularly at dams with navigation locks that fish can pass through (Bonneville,
McNary, Ice Harbor, and Lower Granite). PIT tag detection data were
downloaded from www.ptagis.org on November 23, 2009.
Table 30. Number of PIT tagged sockeye salmon tagged at Bonneville Dam and tracked, by date and statistical week in 2009.
Sampling Dates
Statistical Week
Sampled (n)
Number Tagged
Number Tracked
6/1,2,3,4,5 23 10 10 10
6/8,9,10,11, 24 75 75 74
6/15,16,17,18 25 200 199 196
6/22,23,24,25,26 26 275 271 259
6/29,30,7/1,2 27 196 190 178
7/6,7,8,9 28 94 93 90
Total 850 838 807
c The information presented in this section of the report is a summary of Fryer et al. 2010.

44
Table 31. Percentage of PIT tagged fish by tag type not detected at dam detection sites as estimated from upstream detections in 2009 with comparison data for 2006-2008.
Dam
2009
2008 (12.5mm tags
only)
2007
2006
Mean
Bonneville* 0.6% 0.4% 2.1% 0.2% 0.8%
McNary* 5.0% 10.1% 6.5% 3.1% 6.2%
Priest Rapids
0.3% 0.3% 0.8% 0.0% 0.4%
Rock Island
2.6% 6.9% 6.8% 1.3% 4.4%
Rocky Reach
0.0% 0.2% 0.7% 12.3% 3.3%
Ice Harbor*
a
20.0% 0.0% 10.0%
Mean 3.0% 3.4% 3.4% 3.3% *Navigation locks at these dams permit adult sockeye to bypass weirs equipped with pit-tag detectors.
aOnly five sockeye salmon PIT tagged by this project passed Ice Harbor Dam.
Distribution of sample
The weekly distribution of our sockeye salmon sample size was relatively
similar to that of the sockeye run as a whole (Figure 21).
Figure 21. Proportion of the sockeye salmon sample size and run size by statistical week at Bonneville Dam in 2009.
Upstream Detections, Mortality, and Escapement
Most of the tagged sockeye salmon that were not detected at Rock Island
Dam (the last dam that both Wenatchee and Okanagan sockeye stocks pass)
failed to reach McNary Dam (Table 32, Figure 22). This reach of river is where

45
the Zone 6 tribal fishery occurs, which was estimated to harvest of 10,374
sockeye salmon in 2009 (Table A2) and accounts for 41.8% of these missing
fish.
Table 32. Percentage of PIT tagged sockeye salmon detected at upstream dams subsequent to tagging, estimated escapement from both PIT tags and visual means, and the difference between the PIT tag and visual escapement estimate in 2009.
Dam Estimated
percentage reaching dam
Estimated escapement using
PIT tag data
Visual Dam count
Difference between PIT tag
and visual estimate
Bonneville 100.0 -- 177823 --
McNary 85.7 152395 121672 25.3%
Priest Rapids 82.1 145977 153466 -4.9%
Rock Island 80.2 142551 162830 -12.5%
Rocky Reach 67.1 119307 133106 -10.4%
Wells 65.2 115943 134937 -14.1%
Tumwater 12.2 21732 16076 35.2%
Ice Harbor 1.8 3131 867 261.1%
Lower Granite 1.8 3131 1219 156.8%
838 tagged
807 recovered
82.1%
80.2%
67.1%
65.2%
12.2%%
85.7%
1.8%
1.8%
Estimated Zone 6
Harvest 5.9%
Figure 22. Map of the Columbia River Basin from Bonneville to Wells and Lower Granite dams showing the number of fish PIT tagged at Bonneville Dam, and the percentage of the run estimated to pass McNary, Priest Rapids, Rock Island, Rocky Reach, Wells, Ice Harbor, Lower Granite, and Tumwater dams in 2009.

46
A total of 5 PIT tagged sockeye salmon were detected on the Okanagan
spawning ground, by Okanagan Nation Alliance staff using hand-held scanners,
out of approximately 2430 checked as part of brood stock collection and
spawning ground survey activities.
The predominant age class for the mixed stock at Bonneville Dam as well
as that at upstream locations was Age 1.2 (Table 33).
Table 33. Age composition (%) of Columbia Basin sockeye salmon stocks at Bonneville Dam as well as by PIT tags detected at upstream locations.
Age
Stock and Location Sample Size 1.1 1.2 2.1 1.3 2.2 2.3
Mixed stock at Bonneville Dam 818 10.7 78.7 1.1 5.8 3.6 0.1
Wenatchee stock at Tumwater Dam 87 0.8 75.9 22.5 1.0
Okanogan stock at Wells Damd 504 12.5 79.2 1.0 2.6 4.6
Snake River at Ice Harbor dam 12 26.3 73.7
Using detections of fish PIT tagged by this project to estimate sockeye
numbers passing dams resulted in greater variation from visual fish counts at
those same dams than in previous years. For instance, in 2008 estimates from
this project were within 6.4% of the visual count at Priest Rapids, Rock Island,
Rocky Reach, and Wells dams, whereas in 2009, these estimates differed by up
to 16.1%. At McNary, Ice Harbor, and Lower Granite dams, it is possible for fish
to use navigation locks to bypass fish ladders, thus avoiding both PIT tag and
visual detection. At all of these dams, PIT tag estimates exceeded visual
estimates of abundance; however, the magnitude of this difference was far
greater than the percentage of sockeye estimated to have missed tag detection
at these dams (Table 31).
The 2009 results were similar to 2006-2008 results where there were
significant linear relationships between survival within specific river segments
and the statistical week in which the fish were tagged; fish tagged later in the
migration exhibited a lower survival rate (Table 34). In 2009, there was a
significant linear relationship between statistical week tagged at Bonneville Dam
and survival from Bonneville to Priest Rapids (p=0.02), but not with survival
between Rocky Reach and Wells dams (p=0.11).
d Wells Dam age composition estimates are corrected from those found in Fryer et al. (2009).

47
Table 34. Sockeye salmon survival through selected reaches, by statistical week as estimated by PIT tag detections in 2009.
Statistical Week at Bonneville
Dam
Bonneville to McNary
Bonneville to Priest Rapids
Bonneville to Rock Island
Rocky Reach to Wells
23 90.0% 90.0% 90.0% 100.0%
24 91.8% 90.4% 89.0% 98.4%
25 89.5% 88.4% 87.4% 100.0%
26 83.7% 79.3% 77.6% 95.2%
27 84.3% 79.1% 76.2% 96.6%
28 83.7% 80.2% 76.7% 96.8%
Composite 85.7% 82.1% 80.2% 97.0%
Stock Composition, Migration Timing and Passage Time
The percentage of Wenatchee stock sockeye salmon was higher during
the middle of the run when compared to the beginning and end with no significant
linear relationship between weekly stock composition and statistical week
(p=0.21, Table 8). The overall stock composition estimate was 15.1%
Wenatchee, 82.6% Okanagan, and 2.3% Snake River. The Wenatchee/
Okanagan split was similar to that estimated using Rocky Reach Dam counts but
varied greatly from that estimated using Tumwater Dam counts (Table 35).
Sockeye salmon travel quickly upstream with a median migration time
between Bonneville and Rock Island Dam of 12.7 days (Table 36). Sockeye
salmon passing Bonneville Dam later in the migration, traveled upstream faster
than those earlier in the migration. There is a significant (=0.05) linear
relationship between statistical week passing Bonneville Dam and passage time
from Bonneville Dam to McNary, Rock Island, Rocky Reach, and Wells dams.
The median difference in migration time from Bonneville Dam to all upstream
mainstem dams was one day or less between the two major stocks (Okanagan
and Wenatchee, Table 37). There were insufficient numbers of Snake River
sockeye to conduct this analysis. Table 35. Weekly and composite sockeye salmon stock composition at Bonneville Dam as estimated by PIT tags in 2009.
Statistical Week (and Dates)
Run Size PIT Tag sample
size
Percent Wenatchee
Percent Okanagan
Percent Snake River
23 (On or before June 6) 968 9 0.0% 100.0% 0.0%
24 (June 7-13) 8007 64 1.6% 98.4% 0.0%
25 (June 14-20) 42515 163 16.0% 84.0% 0.0%
26 (June 21-27) 64451 194 22.2% 74.7% 3.1%
27 (June 28-July 4) 46675 134 8.2% 88.1% 3.7%
28 (On or after July 5) 10954 62 11.3% 87.1% 1.6%
Composite 213564 9 15.1% 82.6% 2.3%

48
Visual Fish Counts at dams (using difference between Rock Island and Rocky Reach to estimate proportion Wenatchee)
17.8 79.9
Visual Fish Counts at dams (Tumwater count to estimate the proportion Wenatchee)
9.6 88.1
Table 36. Median sockeye salmon migration time and travel rates between mainstem dams as estimated by PIT tag detections in 2009.
Dam Pair Distance
(km) Median Time
(days)
Median Travel Rate
(km/day)
Bonneville-McNary 231 5.1 45.2
McNary-Priest Rapids 167 4.0 41.4
Priest Rapids-Rock Island 89 3.1 28.7
Rock Island-Rocky Reach 33 1.1 29.1
Rocky Reach-Wells 65 2.2 29.6
Rock Island-Tumwater 73 11.2 6.5
Bonneville-Rock Island 487 12.7 38.2
Bonneville-Tumwater 560 26.0 21.6
Bonneville-Wells 585 16.2 36.2
Table 37. Median sockeye salmon migration time in days between dam pairs by statistical week that they passed Bonneville Dam. The F-statistic for a linear regression between migration time and statistical week, and mean migration time by stock as estimated using PIT tags in 2009.
Statistical Week at
Bonneville Dam
Bonnevill
e-
McN
ary
Bonnevill
e-
Priest R
apid
s
Bonnevill
e-
Rock Is
land
Bonnevill
e-
Rocky R
each
Bonnevill
e-
Tum
wate
r
Bonnevill
e-
Wells
McN
ary
-Rock
Isla
nd
Rock Is
land-
Rocky R
each
Rocky R
each-
Wells
23 5.9 10.3 14.6 15.4 – 17.2 8.9 1.2 2.6
24 5.2 10.0 14.8 17.0 37.6 19.3 9.2 1.8 2.8
25 5.1 9.8 13.9 14.9 28.5 17.2 8.4 1.2 2.2
26 5.2 9.4 12.7 13.6 25.0 15.9 7.1 1.1 2.1
27 5.0 8.8 11.7 12.8 22.2 15.2 6.7 1.1 2.1
28 4.8 8.8 11.6 12.4 21.8 14.5 6.4 1.0 2.1
P-value 0.03 <0.01 <0.01 0.01 0.01 0.03 <0.01 0.08 0.10
Stock
Okanagan 5.1 9.2 12.7 13.9 23.8 16.2 7.1 1.1 2.2
Wenatchee 5.1 9.8 13.7 13.0 26.0 15.6 8.0 1.1 2.8
Snake River 5.3 – – – – – – – – Unknown* 5.2 9.1 12.9 11.9 – 13.5 8.0 0.9 2.1
*Unknown stock sockeye salmon are those that passed Bonneville but were not detected at Tumwater, Rocky Reach or Wells, or Ice Harbor or Lower Granite dams.
The median time passing a dam (defined as time difference between first
detection and last detection) was five minutes or less at all dams except for
Bonneville, Lower Granite, and Tumwater dams (Table 38). At Bonneville Dam,
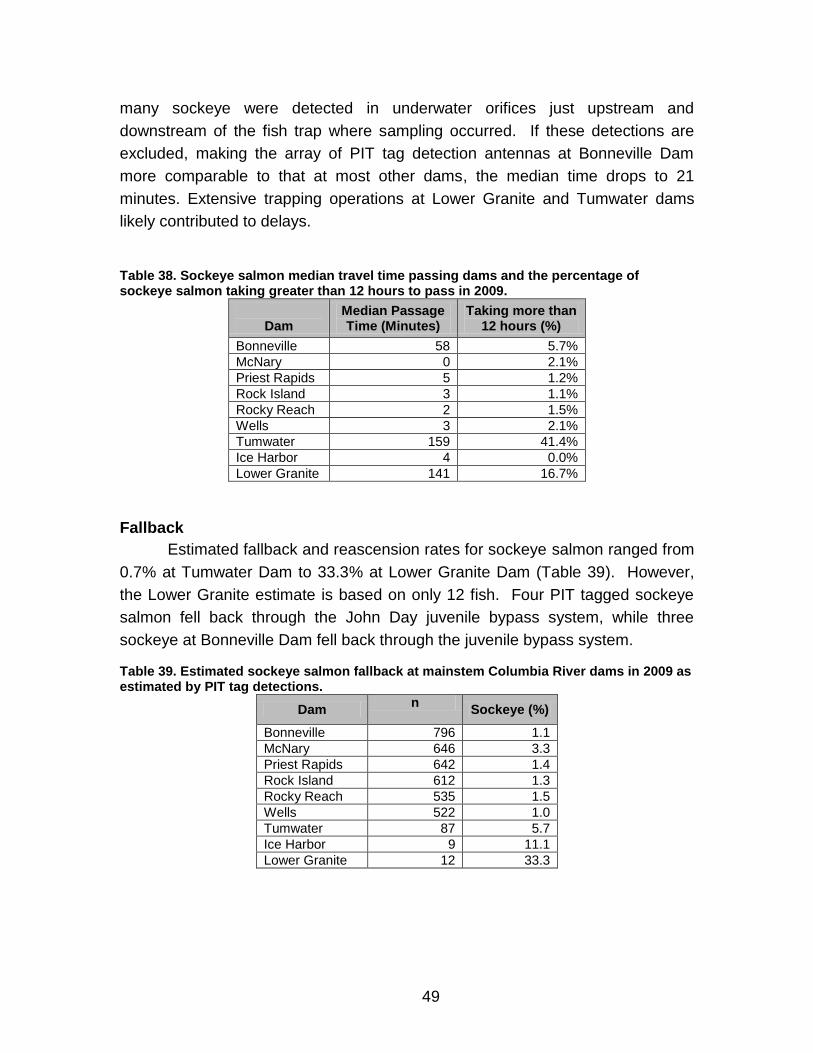
49
many sockeye were detected in underwater orifices just upstream and
downstream of the fish trap where sampling occurred. If these detections are
excluded, making the array of PIT tag detection antennas at Bonneville Dam
more comparable to that at most other dams, the median time drops to 21
minutes. Extensive trapping operations at Lower Granite and Tumwater dams
likely contributed to delays.
Table 38. Sockeye salmon median travel time passing dams and the percentage of sockeye salmon taking greater than 12 hours to pass in 2009.
Dam
Median Passage Time (Minutes)
Taking more than 12 hours (%)
Bonneville 58 5.7%
McNary 0 2.1%
Priest Rapids 5 1.2%
Rock Island 3 1.1%
Rocky Reach 2 1.5%
Wells 3 2.1%
Tumwater 159 41.4%
Ice Harbor 4 0.0%
Lower Granite 141 16.7%
Fallback
Estimated fallback and reascension rates for sockeye salmon ranged from
0.7% at Tumwater Dam to 33.3% at Lower Granite Dam (Table 39). However,
the Lower Granite estimate is based on only 12 fish. Four PIT tagged sockeye
salmon fell back through the John Day juvenile bypass system, while three
sockeye at Bonneville Dam fell back through the juvenile bypass system.
Table 39. Estimated sockeye salmon fallback at mainstem Columbia River dams in 2009 as estimated by PIT tag detections.
Dam n
Sockeye (%)
Bonneville 796 1.1
McNary 646 3.3
Priest Rapids 642 1.4
Rock Island 612 1.3
Rocky Reach 535 1.5
Wells 522 1.0
Tumwater 87 5.7
Ice Harbor 9 11.1
Lower Granite 12 33.3

50
DISCUSSION
This study sampled and PIT tagged over 7000 salmonids at Bonneville
Dam in 2009 and then tracked these fish upstream to estimate parameters such
as upstream escapement, age composition, length composition, and migration
rates at mainstem dams and other tributary interrogation sites. PIT tags provide
an easier, much cheaper, and less intrusive method of monitoring the upstream
migration of fish than radio tags used in past studies. However, PIT tags do not
always provide the same amount of data as can be collected in a radio tag study.
For example, PIT tag detection is not installed at all mainstem dams, nor is it
present in many tributaries. It is far less expensive, and often more feasible, to
add a radio tag receiver at a desired site, than a PIT tag antenna. New detection
sites for PIT tags are continually being added into the system, particularly in
tributaries, making PIT tag data more useful, but also much more complex to
analyze.
This study compared the performance of 12.5 and 20.0 mm tags
implanted in steelhead and Chinook salmon and found no significant difference in
the percentage of each tag-type group of fish detected at upstream sites. The
similar performance of these tags differed from 2008 when we compared 8.5 mm
tags with 12.5 mm tags and found that that sockeye and Chinook salmon tagged
with 8.5 mm PIT tags were significantly less likely to be detected at numerous
sites upstream than those fish tagged with 12.5 mm tags (Fryer et al. 2010).
This study was adversely affected by the trap configuration imposed in
2009 that biased our sample by causing us to sample a higher percentage of
smaller one-ocean Chinook (jacks) than were present in the general fish
population migrating in the ladder at the time of sampling. It is unknown why a
higher percentage of jack Chinook chose the trap side of the divider. Whatever
the reason, the bias adversely affects our age composition estimates for Chinook
salmon. This type of analysis for trap bias requires a sufficient number of
previously PIT tagged fish (from other studies) to determine if a bias exists.
While sufficient numbers existed for Chinook, the sample of previously tagged
sockeye and steelhead was too small to make any comparisons for these two
species. Furthermore, there are also insufficient previously PIT tagged fish of
any species to determine whether there were any stock composition or other
biases.
51
The discovery of biases imposed by the trap configuration in 2009 resulted
in an investigation and analysis of other potential biases imposed on the fish by
dam configuration or operations. Fish passing Bonneville Dam may enter any
one of four ladder entrances plus use the navigation locks. However, only fish
using the Washington Shore ladder entrance can be trapped by the Adult Fish
Facility and sampled. If any of the other three ladder entrances are attracting fish
of different stocks, age, or length then this would be another source of bias.
Also, we typically only trap and sample four to six hours daily during weekday
mornings and early afternoon, suggesting another possible source of bias, if fish
stock, sizes, or ages migrate at different times of the day or night. An analysis of
the percentage of jacks passing through the different ladder entrances during
hours of trapping and hours of not trapping, found that the percentage of jacks
varied from 38.6% for those entering the Washington Shore ladder entrance
during non-trapping hours to 60.4% at the Oregon Shore ladder during trapping
hours. Given this variability, it was surprising that as a whole the percentage of
PIT tagged Chinook passing Bonneville Dam that were jacks (48.2%) was close
to the percentage of jacks passing through the Washington Shore ladder during
hours the trap was in operation (46.1%). This suggests that, if we had been
allowed to trap the entire ladder, rather than half the ladder, our estimated jack
composition would have been within 2.1 percentage points (or 4.6%) of that for
the entire population of previously tagged Chinook salmon passing Bonneville
Dam. In future years, we will continue to look for possible biases in trapping, and
if warranted, we may alter sampling hours and days in an effort to reduce
sampling biases. Sampling other fish ladders at Bonneville Dam to reduce
biases between ladders or Washington Shore versus Oregon shore is not
feasible.
Steelhead were detected at a higher rate than Chinook or sockeye salmon
as they passed mainstem Columbia and Snake river dams. For all the mainstem
dams the highest percentage of missed steelhead at a dam was 0.8% at Rock
Island Dam, compared to 3.2% for spring Chinook passing Ice Harbor Dam, and
5.0% for sockeye salmon passing McNary Dam. Undetected passage was more
likely at dams with navigation locks which fish can use, avoiding PIT tag arrays in
ladders.
For both Chinook salmon and steelhead, there are management concerns
regarding the timing of run components. One question of interest to fish

52
managers is the definition of a summer Chinook salmon. Traditionally, spring
Chinook salmon were defined as those migrating past Bonneville Dam through
May 31, with summer Chinook salmon passing from June 1 through July 31, and
fall Chinook salmon defined as passing on or after August 1. Dates of defining a
Chinook run at upstream dams were lagged to take into account passage times
from Bonneville Dam to the dam in question. However, in 2005, for management
purposes the spring-summer differentiation at Bonneville Dam was moved from
June 1 to June 16 (though visual counts are typically reported using the old
cutoff). Managers moved this date because radio tagging studies suggested that
many of the Chinook salmon migrating in early June are from the Snake River
(many spring/summer Chinook in the Snake River Basin are listed as
endangered under ESA), while Chinook migrating in late June are mid-Columbia
summers. Tag detection data from this project showed that in 2009 the
percentage of Snake River origin Chinook salmon was about 39% for the week of
April 26 (Week 1 of sampling), peaking at 57.9% the week of May 31 (Week 23
and previous spring Chinook cut off), and staying above 30% through the week
of June 28 (Week 27). The portion of the Chinook run heading above Priest
Rapids Dam was 48% or over from the week of June 7 through the week of July
19 (Weeks 24-30).
Escapement estimates using PIT tag data for mainstem dam passage
varied from the traditional methods (i.e. visual counts) and ranged from -7.4% to
+12.4% for Chinook salmon and from -7.2% to 31.9% for sockeye salmon (Lower
Granite and Ice Harbor PIT tag sample sizes were too small for a comparison of
sockeye run sizes.) Many factors can cause these discrepancies including
inaccuracies of visual or video counts, fallback/reascension rates, tagging
effects, and a biased sampled of fish being PIT tagged. Tagging additional
adults, as well as better detection in terminal areas, would likely improve the
precision and accuracy of stock specific escapement and survival estimates.
In 2009, when water temperatures exceeded 70.0 F (21.1 C) as measured
at Bonneville Dam, sampling (which includes trap set up) at the Adult Fish
Facility was restricted to four mornings per week from 6 AM to 10 AM. Fish
typically take 1.0 to 1.5 hours to reach the sampling tank after the trap is set up,
which allows for 2.5 to 3 hours of actual sampling to collect data and tag both
steelhead and fall Chinook salmon. These restrictions continue until water
temperatures drop below 69.5º F (20.8 C). If temperatures reach 22.2 C (72.0º

53
F) or above sampling is not allowed. In 2009, CRITFC was shut down during
Statistical Week 32 and under restricted sampling hours for Statistical weeks 31,
33, 34, and the start of Week 35. Relatively small numbers of Chinook passed
Bonneville Dam during these weeks until temperatures started dropping in
Statistical Week 34. During Statistical weeks 34-36, our sample size consisted of
304 Chinook, representing 27.4% of our total fall Chinook sample, but was 53.6%
of the run. Our steelhead sample was even less representative. As described
earlier, during Statistical weeks 31-36 and the restricted sampling schedule,
70.7% of the steelhead run passed Bonneville Dam; only 27.4% (Figure 13) of
our sample (totaling 677 fish) was collected. We do weight composite samples
by weekly run size (Cochrane 1977), thus reducing potential biases. However,
having such a large portion of the run represented by such a small portion of the
sample increases the variance and thus decreases the reliability of results.
As in 2008, delays were observed for both sockeye and Chinook salmon
in passing Tumwater Dam. The median delay for Chinook was 2.33 days
(compared to less than 2 hours at other dams), while for sockeye salmon it was
154 minutes (compared to five minutes or less at all dams other than Lower
Granite and Bonneville). Fryer et al. (2010) estimated that 20.4% of sockeye
salmon reaching the Tumwater Dam fish ladder in 2009 did not pass over the
dam. Chinook salmon may have a similar story as 11 out of the 76 Chinook
detected in Tumwater Dam fish ladders were last detected at the lower antenna,
therefore it is assumed that they did not pass the dam. These delays and fish
failing to ascend Tumwater Dam are likely due, at least in part, to a 24-hour
operation of the fish trap at that site.
In 2008, the median delay for sockeye salmon passing Tumwater Dam
was 4.6 days Tumwater Dam (Fryer 2009). This was may be attributed to the
24-hour operation of the fish trap at Tumwater Dam. Fish were observed
“stacking up” in the fish ladder below the trap (Keely Murdoch, Yakama Nation,
personal communication), and it was evident that there were significant delays.
Fryer (2009) speculated that that “it is possible that some sockeye salmon were
not passing the Tumwater Dam due to the passage delays – 7.6% of those
sockeye salmon detected at Tumwater Dam were last detected at the lower
Tumwater Dam fishway detection site suggesting that these fish turned around
and went downstream and were not detected again”. In 2009, changes in
operation of the fish trap at Tumwater Dam likely resulted in reduced the median
delay from 4.6 days to 159 minutes. However, 41.4% of sockeye in 2009 still took

54
more than 12 hours to pass Tumwater Dam, suggesting that trap-operations may
continue to influence adult fish behavior.
This study estimated fallback rates at dams using PIT tag detections of
individual fish. This likely underestimates fallback rates as a fish that falls back
over a dam and is not subsequently detected would not be included. Data from
two hatcheries located immediately downstream of two mainstem dams indicate
high rates of fallback, at least for the two hatchery stocks. Twenty Chinook
tagged by this study were recovered at Wells Hatchery in 2009. Of these fish, six
ascended the fish ladders at Wells Dam and were detected at the upstream
antenna before presumably falling back over Wells Dam and entering Wells
Hatchery. Similarly, 12 of the 29 Chinook recovered at Lyons Ferry Hatchery fell
back over Little Goose or both Little Goose and Lower Granite dams before
entering the hatchery.

55
REFERENCES
Cochrane, W,G, 1977, Sampling Techniques. John Wiley & Sons, Inc. New York. 428 p.
CBFWA (Columbia Basin Fish and Wildlife Authority PIT Tag Steering Committee. 1999. PIT tag marking procedures manual. CBFWA. Portland. 26 pp.
Fryer, J. K. 2009. Use of PIT tags to determine upstream migratory timing and survival of Columbia Basin sockeye salmon in 2008. Columbia River Inter-Tribal Fish Commission Technical Report 09-03.
Fryer, J.K., J. Mainord, H. Wright, S. Folks, K. Hyatt. 2010. Studies into Factors Limiting the Abundance of Okanagan and Wenatchee Sockeye Salmon. U.S. Dept. of Energy Bonneville Power Administration Report Project #2008-503-00.
Snedecor, G.W. and W. Cochrane. 1980. Statistical Methods. Iowa State University Press, Ames, Iowa.
Whiteaker J., and J.K. Fryer. 2008. Age and length composition of Columbia Basin Chinook and sockeye salmon and steelhead at Bonneville Dam in 2007. Columbia River Inter-Tribal Fish Commission Technical Report.
Kelsey D., J. Mainord, J. Whiteaker, and J.K. Fryer. 2011. Age and length composition of Columbia Basin Chinook and sockeye salmon and steelhead at Bonneville Dam in 2009. Columbia River Inter-Tribal Fish Commission Technical Report.
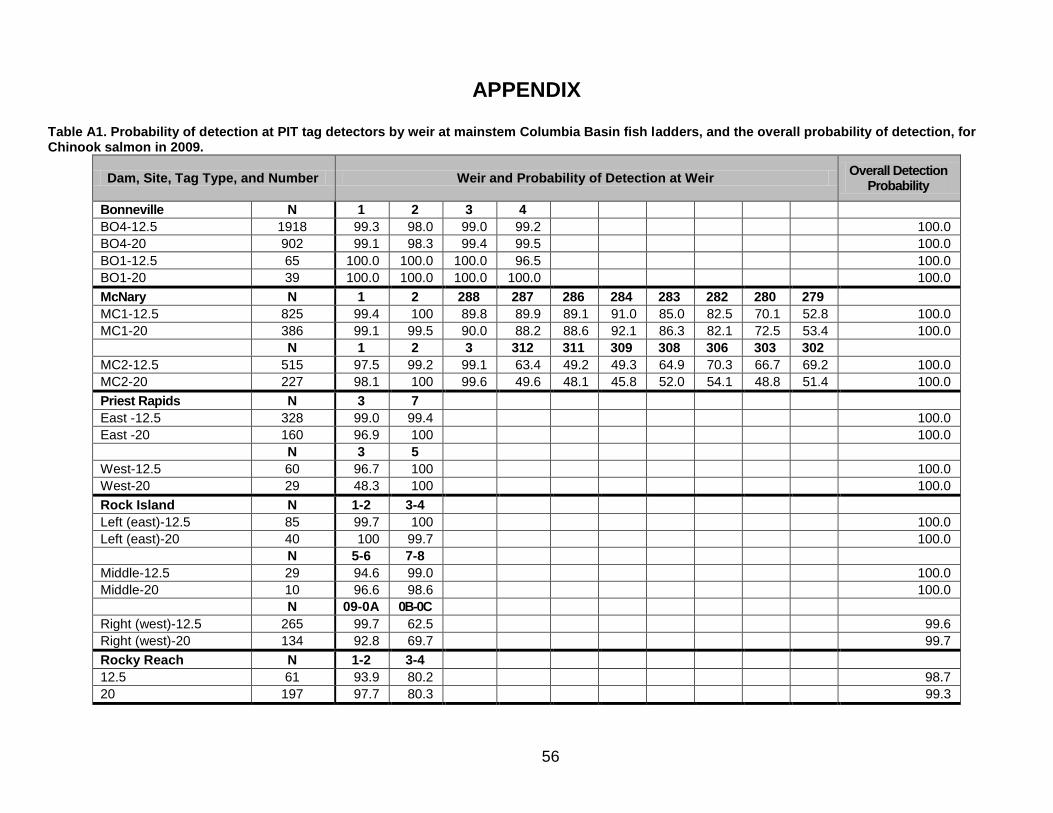
56
APPENDIX Table A1. Probability of detection at PIT tag detectors by weir at mainstem Columbia Basin fish ladders, and the overall probability of detection, for Chinook salmon in 2009.
Dam, Site, Tag Type, and Number Weir and Probability of Detection at Weir Overall Detection
Probability
Bonneville N 1 2 3 4
BO4-12.5 1918 99.3 98.0 99.0 99.2 100.0
BO4-20 902 99.1 98.3 99.4 99.5 100.0
BO1-12.5 65 100.0 100.0 100.0 96.5 100.0
BO1-20 39 100.0 100.0 100.0 100.0 100.0
McNary N 1 2 288 287 286 284 283 282 280 279
MC1-12.5 825 99.4 100 89.8 89.9 89.1 91.0 85.0 82.5 70.1 52.8 100.0
MC1-20 386 99.1 99.5 90.0 88.2 88.6 92.1 86.3 82.1 72.5 53.4 100.0
N 1 2 3 312 311 309 308 306 303 302
MC2-12.5 515 97.5 99.2 99.1 63.4 49.2 49.3 64.9 70.3 66.7 69.2 100.0
MC2-20 227 98.1 100 99.6 49.6 48.1 45.8 52.0 54.1 48.8 51.4 100.0
Priest Rapids N 3 7
East -12.5 328 99.0 99.4 100.0
East -20 160 96.9 100 100.0
N 3 5
West-12.5 60 96.7 100 100.0
West-20 29 48.3 100 100.0
Rock Island N 1-2 3-4
Left (east)-12.5 85 99.7 100 100.0
Left (east)-20 40 100 99.7 100.0
N 5-6 7-8
Middle-12.5 29 94.6 99.0 100.0
Middle-20 10 96.6 98.6 100.0
N 09-0A 0B-0C
Right (west)-12.5 265 99.7 62.5 99.6
Right (west)-20 134 92.8 69.7 99.7
Rocky Reach N 1-2 3-4
12.5 61 93.9 80.2 98.7
20 197 97.7 80.3 99.3

57
Wells N 1-2 3-4
Left (east)-12.5 69 100 100 100.0
Left (east)-20 25 100 100 100.0
N 5-6 7-8
Right (west)-12.5 129 100 100 100.0
Right (west)-20 59 98.3 100 100.0
Ice Harbor N 438 437 436 435
South-12.5 472 95.8 99.4 99.6 99.8 100.0
South-20 205 96.9 98.4 98.4 100 100.0
North-12.5 168 93.4 99.4 98.8 99.4 100.0
North-20 64 96.9 98.4 98.4 100 100.0
Lower Granite N 733 732 731 730
12.5 360 100 99.3 100 100 100.0
20 150 100 100 100 100 100.0
Tumwater N A1 A2
12.5 59 100 100 100.0
20 26 100 100
Right or left is determined by looking downstream at the dams, thus the right bank at Wells would be the west bank.

58
Table A2. Probability of detection at PIT tag detectors by weir at mainstem Columbia Basin fish ladders, and the overall probability of detection, for sockeye salmon in 2009.
Dam, site, and tag type Weir and probability of detection at weir Overall Detection
Probability
Bonneville N 1 2 3 4
BO4 718 99.9 98.6 99.4 99.3 100.0
BO1 82 100.0 100.0 100.0 100.0 100.0
McNary 1 2 288 287 286 284 283 282 280 279
MC1 313 99.0 99.3 9.1 10.4 12.7 12.1 11.1 12.4 14.3 11.4 100.0
1 2 3 312 311 309 308 306 305 303
MC2 333 100.0 100.0 100.0 7.5 6.0 4.5 7.2 5.7 5.4 5.1 100.0
P. Rapids 3 7
East 521 99.6a 99.8 100.0
3 5
West 120 100.0 99.2 100.0
Rock Island 1-2 3-4
Left (east) 149 100.0 99.3 100.0
5-6 7-8
Middle 89 91.0 100.0 100.0
09-0A 0B-0C
Right (west) 379 95.5 83.9 99.3
1-2 3-4
Rocky Reach 535 99.6 100.0 100.0
Wells 1-2 3-4
Left (east) 246 99.6 100 100.0
5-6 7-8
Right (west) 280 100 99.6 100.0
161 162
Tumwater 87 100.0 100.0 100.0
a Fish bypass this weir when the Priest Rapids adult fish trap is in operation.
Right or left is determined by looking downstream at the dams, thus the right bank at Wells would be the west bank.

59
Table A3. List of PTAGIS interrogation sites (three letter code, name, and description). Site Code Site Name Description
AB1 Abernathy Creek, Technology Center Bridge Bridge over Abernathy Creek (WA.) at Abernathy Fish Technology Center (AFTC)
AB2 Abernathy Creek, Farmer's Bridge Private bridge over Abernathy Creek (WA.) at rkm 3, 1.5 km downstream from Abernathy FTC
AB3 Lower Abernathy Creek
The PIT tag interrogation antennas are insta l led in para l lel as a passover array located in the tha lweg of the
floodpla in at Abernathy Creek (WA.) rkm 1. Coverage of the creek i s 100% at baseflow but wi l l decrease during
floods or large freshets .
B1J Bonnevi l le Dam DSM1 Flat Plate Detector Flat Plate Detector in the Bonnevi l le Dam PH1 Downstream Migrant Bypass Channel
B2A Bonnevi l le Dam Adult Fish Faci l i ty Adult Fish Faci l i ty in the WA Shore Fishway at Bonnevi l le Dam; replaced by BO3
B2J Bonnevi l le Dam PH2 Juveni le Bypass System Bonnevi l le Dam PH2 Juveni le Bypass and Sampl ing Faci l i ty
BCC Bonnevi l le Dam PH2 Corner Col lector Bonnevi l le Dam 2nd Powerhouse Corner Col lector Outfa l l Channel
BCP Butcher Creek Accl imation Pond Butcher Creek Accl imation Pond, Wenatchee River Bas in
BGM Burl ingame Divers ion Dam
Burl ingame Divers ion Dam is located on the lower Wal la Wal la River. This s i te cons is ts of detectors in the dam's
fi sh passage faci l i ties , as wel l as in the canal intake.
BO1 Bonnevi l le Dam Bradford Is land Fishway Bradford Is land Adult Fishway at Bonnevi l le Dam
BO2 Bonnevi l le Dam Cascades Is land Fishway Cascades Is land Adult Fishway at Bonnevi l le Dam
BO3 Bonnevi l le Dam WA Shore Fishway & AFF Washington Shore Adult Fishway and AFF at Bonnevi l le Dam; replaces B2A and BWL
BO4 Bonnevi l le Dam WA Shore Vertica l Slots Washington Shore Fishway Vertica l Slots at Bonnevi l le Dam
BSC Big Sheep Creek (Imnaha) ISA at river km 6 In-s tream detectors on Big Sheep Creek (Imnaha River Bas in) at river km 6.
BTC Big Timber Creek,Lemhi River Bas in In-s tream array on Big Timber Creek, Lemhi River Bas in near Leadore, ID.
BVC Beaver Creek In-s tream Array,Methow River Instream arrays on Beaver Creek, Methow River Bas in
BVJ Bonnevi l le Dam DSM1 Subsample Bonnevi l le Dam PH1 Juveni le Bypass (DSM1) sub-sample
BVP Beaver Creek Accl imation Pond Beaver Creek Accl imation Pond, Wenatchee River Bas in
BVX Bonnevi l le Dam PH1 Flat Plate (Experimental ) Flat Plate Detector (experimental ) at Bonnevi l le Dam PH1 DSM; replaced by B1J
BWL Bonnevi l le Dam Washington Shore Fishway Washington Shore Adult Fishway at Bonnevi l le Dam; replaced by BO3
CAC Canyon Creek (Lemhi Bas in) ISA at river km 1 In-s tream detectors on Canyon Creek (Lemhi River Bas in) at river km 1.
CAL Carson NFH Adult Return Ladder Adult Fishway at Carson National Fish Hatchery
CAP Carl ton Acc. Pond Carl ton Accl imation Pond, Methow River Bas in
CCC Carrol l s Channel , Lwr Col Riv Instream detectors in upper Carrol l s Channel , lower Columbia River at rkm 115
CCP Catherine Creek Accl imation Pond Catherine Creek Accl imation Pond
CFJ Clark Flat Accl imation Ponds Clark Flat Accl imation Pond Outfa l l
CHL Lower Chiwawa River
This i s a pass ive in-s tream interrogation system at Chiwawa River rkm 1, located between the Chiwawa smolt trap
and the Chiwawa Accl imation Ponds , cons is ting of a s ingle antenna array spanning the width of the river.
CHN Chal l i s - North Chal l i s Divers ion North (Divers ion 27)
CHP Chiwawa Accl imation Pond Chiwawa Accl imation Pond, Wenatchee River Bas in
CHS Chal l i s - South Chal l i s Divers ion South (Divers ion 29)
CHU Upper Chiwawa River
This i s a pass ive in-s tream interrogation system at Chiwawa River rkm 12, located above the Forest Road 62 bridge
and below Alder Creek, cons is ting of a s ingle antenna array spanning the width of the river.
CIC Cottonwood Is land, Lwr Col Rvr Instream detectors on Cottonwood Is land, lower Columbia River at rkm 112
CLE Cle Elum Dam Interim Spi l lway Bypass The experimental juveni le fi sh bypass flume is located in the second bay of the Cle Elum Dam spi l lway.
CLJ Clearwater River Trap
The Clearwater River Smolt Trap is located 10 ki lometers above the mouth of the Clearwater River. CLJ was
deployed during the Spring migration annual ly between 1989-1998, and has been deployed each spring s ince 2002.
CLP Coulter Creek Accl imation Pond Coulter Creek Accl imation Pond, Wenatchee River Bas in
CR1 Chinook River at Sea Resources Hatchery
This i s an in-s tream interrogation system located near the Sea Resources Hatchery adult fi sh faci l i ty, on the
Chinook River in the Columbia River Estuary near Chinook, Washington.
CR2 Chinook River at HWY 101 Bridge
This i s an in-s tream interrogation system located near the tida l gates at the Hwy. 101 bridge over the Chinook River
in the Columbia River Estuary near Chinook, Washington.
CR3 Chinook River at a Culvert
This i s an in-s tream interrogation system located at a road culvert on the Chinook River in the Columbia River
Estuary near Chinook, Washington.
CRW Chewuch River above Winthrop In-s tream array on the Chewuch River above Winthrop, WA.
DRP Dryden Acc. Pond Dryden Accl imation Pond, Wenatchee River Bas in
DWL Dworshak NFH adult trap Dworshak National Fish Hatchery Adult Trap
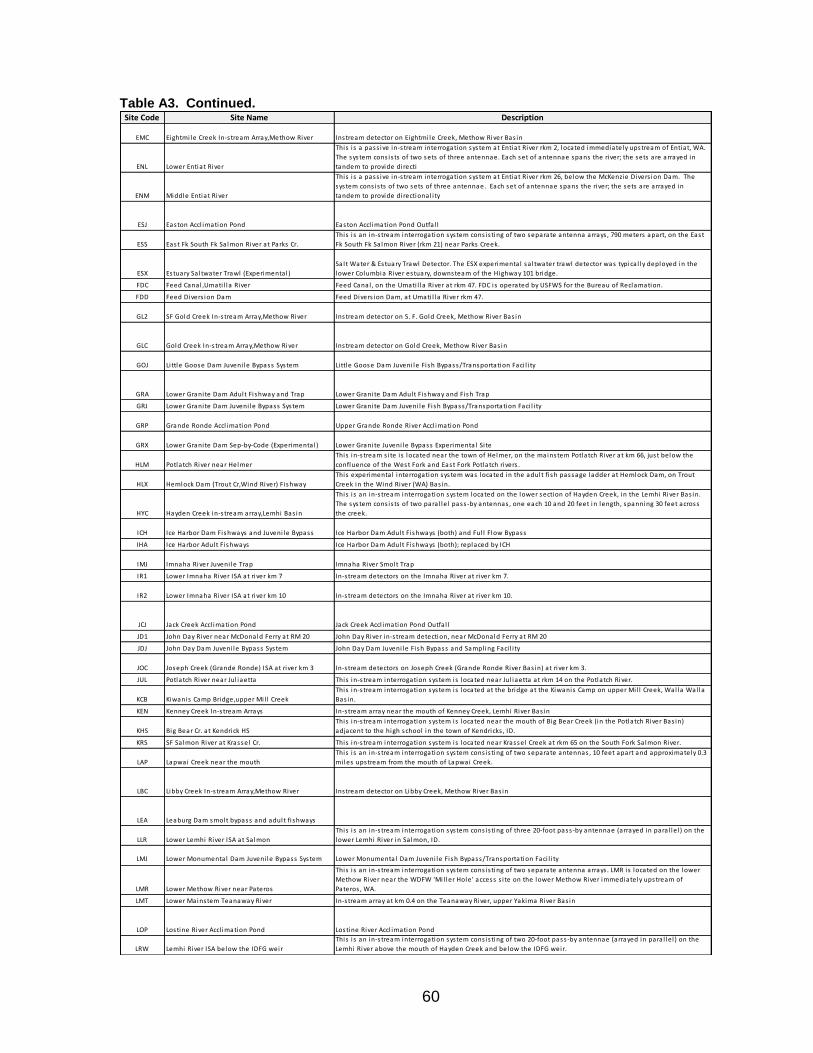
60
Table A3. Continued. Site Code Site Name Description
EMC Eightmi le Creek In-s tream Array,Methow River Instream detector on Eightmi le Creek, Methow River Bas in
ENL Lower Entiat River
This i s a pass ive in-s tream interrogation system at Entiat River rkm 2, located immediately upstream of Entiat, WA.
The system cons is ts of two sets of three antennae. Each set of antennae spans the river; the sets are arrayed in
tandem to provide directi
ENM Middle Entiat River
This i s a pass ive in-s tream interrogation system at Entiat River rkm 26, below the McKenzie Divers ion Dam. The
system cons is ts of two sets of three antennae. Each set of antennae spans the river; the sets are arrayed in
tandem to provide directional i ty
ESJ Easton Accl imation Pond Easton Accl imation Pond Outfa l l
ESS East Fk South Fk Sa lmon River at Parks Cr.
This i s an in-s tream interrogation system cons is ting of two separate antenna arrays , 790 meters apart, on the East
Fk South Fk Sa lmon River (rkm 21) near Parks Creek.
ESX Estuary Sa l twater Trawl (Experimental )
Sa l t Water & Estuary Trawl Detector. The ESX experimental sa l twater trawl detector was typica l ly deployed in the
lower Columbia River estuary, downsteam of the Highway 101 bridge.
FDC Feed Canal ,Umati l la River Feed Canal , on the Umati l la River at rkm 47. FDC is operated by USFWS for the Bureau of Reclamation.
FDD Feed Divers ion Dam Feed Divers ion Dam, at Umati l la River rkm 47.
GL2 SF Gold Creek In-s tream Array,Methow River Instream detector on S. F. Gold Creek, Methow River Bas in
GLC Gold Creek In-s tream Array,Methow River Instream detector on Gold Creek, Methow River Bas in
GOJ Li ttle Goose Dam Juveni le Bypass System Little Goose Dam Juveni le Fish Bypass/Transportation Faci l i ty
GRA Lower Granite Dam Adult Fishway and Trap Lower Granite Dam Adult Fishway and Fish Trap
GRJ Lower Granite Dam Juveni le Bypass System Lower Granite Dam Juveni le Fish Bypass/Transportation Faci l i ty
GRP Grande Ronde Accl imation Pond Upper Grande Ronde River Accl imation Pond
GRX Lower Granite Dam Sep-by-Code (Experimental ) Lower Granite Juveni le Bypass Experimental Si te
HLM Potlatch River near Helmer
This in-s tream s i te i s located near the town of Helmer, on the mainstem Potlatch River at km 66, just below the
confluence of the West Fork and East Fork Potlatch rivers .
HLX Hemlock Dam (Trout Cr,Wind River) Fishway
This experimental interrogation system was located in the adult fi sh passage ladder at Hemlock Dam, on Trout
Creek in the Wind River (WA) Bas in.
HYC Hayden Creek in-s tream array,Lemhi Bas in
This i s an in-s tream interrogation system located on the lower section of Hayden Creek, in the Lemhi River Bas in.
The system cons is ts of two para l lel pass -by antennas , one each 10 and 20 feet in length, spanning 30 feet across
the creek.
ICH Ice Harbor Dam Fishways and Juveni le Bypass Ice Harbor Dam Adult Fishways (both) and Ful l Flow Bypass
IHA Ice Harbor Adult Fishways Ice Harbor Dam Adult Fishways (both); replaced by ICH
IMJ Imnaha River Juveni le Trap Imnaha River Smolt Trap
IR1 Lower Imnaha River ISA at river km 7 In-s tream detectors on the Imnaha River at river km 7.
IR2 Lower Imnaha River ISA at river km 10 In-s tream detectors on the Imnaha River at river km 10.
JCJ Jack Creek Accl imation Pond Jack Creek Accl imation Pond Outfa l l
JD1 John Day River near McDonald Ferry at RM 20 John Day River in-s tream detection, near McDonald Ferry at RM 20
JDJ John Day Dam Juveni le Bypass System John Day Dam Juveni le Fish Bypass and Sampl ing Faci l i ty
JOC Joseph Creek (Grande Ronde) ISA at river km 3 In-s tream detectors on Joseph Creek (Grande Ronde River Bas in) at river km 3.
JUL Potlatch River near Jul iaetta This in-s tream interrogation system is located near Jul iaetta at rkm 14 on the Potlatch River.
KCB Kiwanis Camp Bridge,upper Mi l l Creek
This in-s tream interrogation system is located at the bridge at the Kiwanis Camp on upper Mi l l Creek, Wal la Wal la
Bas in.
KEN Kenney Creek In-s tream Arrays In-s tream array near the mouth of Kenney Creek, Lemhi River Bas in
KHS Big Bear Cr. at Kendrick HS
This in-s tream interrogation system is located near the mouth of Big Bear Creek (in the Potlatch River Bas in)
adjacent to the high school in the town of Kendricks , ID.
KRS SF Sa lmon River at Krassel Cr. This in-s tream interrogation system is located near Krassel Creek at rkm 65 on the South Fork Sa lmon River.
LAP Lapwai Creek near the mouth
This i s an in-s tream interrogation system cons is ting of two separate antennas , 10 feet apart and approximately 0.3
mi les upstream from the mouth of Lapwai Creek.
LBC Libby Creek In-s tream Array,Methow River Instream detector on Libby Creek, Methow River Bas in
LEA Leaburg Dam smolt bypass and adult fi shways
LLR Lower Lemhi River ISA at Sa lmon
This i s an in-s tream interrogation system cons is ting of three 20-foot pass -by antennae (arrayed in para l lel ) on the
lower Lemhi River in Sa lmon, ID.
LMJ Lower Monumental Dam Juveni le Bypass System Lower Monumental Dam Juveni le Fish Bypass/Transportation Faci l i ty
LMR Lower Methow River near Pateros
This i s an in-s tream interrogation system cons is ting of two separate antenna arrays . LMR is located on the lower
Methow River near the WDFW 'Mi l ler Hole' access s i te on the lower Methow River immediately upstream of
Pateros , WA.
LMT Lower Mainstem Teanaway River In-s tream array at km 0.4 on the Teanaway River, upper Yakima River Bas in
LOP Lostine River Accl imation Pond Lostine River Accl imation Pond
LRW Lemhi River ISA below the IDFG weir
This i s an in-s tream interrogation system cons is ting of two 20-foot pass -by antennae (arrayed in para l lel ) on the
Lemhi River above the mouth of Hayden Creek and below the IDFG weir.

61
Table A3: Continued. Site Code Site Name Description
LTR Lower Tucannon River,near the river mouth
This i s an in-s tream interrogation system that has various ly cons is ted of two groups of arrays , about a ki lometer
apart, located near the mouth of the Tucannon River.
LWD Lowden Divers ion Dam
This interrogation system currently cons is ts of a s ingle antenna at the entrance to the fi sh ladder at Lowden
Divers ion Dam. Lowden Dam is located at rkm 51 on the Wal la Wal la River.
LWE Lower Wenatchee River
This i s a pass ive in-s tream interrogation system at Wenatchee River rkm 2, cons is ting of a s ingle antenna array
spanning the width of the river.
LWL Little White Sa lmon NFH adult fi sh ladder
Adult fi sh ladder a l lowing passage from the Li ttle White Sa lmon River into the adult holding ponds at Li ttle White
Sa lmon NFH. Al l fi sh captured in the ponds are sorted and may ei ther be surplused/spawned or returned to the
river via an underground tube.
LWN Little Wenatchee River
This i s a pass ive in-s tream interrogation system at Li ttle Wenatchee River rkm 4, located at the old fi sh weir s i te,
cons is ting of a s ingle antenna array spanning the width of the river.
MAD Mad River,Entiat River Bas in
This i s a pass ive in-s tream interrogation system at Mad River rkm 1, located at Ardenvoir, WA. The system cons is ts
of three sets of two antennae. Each pair of antennae spans the river; the pa irs are arrayed in tandem to provide
directional i ty data.
MC1 McNary Dam Oregon Shore Fishway Oregon Shore Adult Fishway at McNary Dam
MC2 McNary Dam Washington Shore Fishway Washington Shore Adult Fishway at McNary Dam
MCD
Placed at Mi l l Cr Divers ion Dam (StreamNet Data)
in Wal la Wal la River Bas in
This interrogation system includes the fi sh bypass and passage faci l i ties at the (Bennington) Divers ion Dam and
the fi rs t Divis ion Works in the Mi l l Creek Divers ion Project in the Wal la Wal la Bas in.
MCJ McNary Dam Juveni le Bypass System McNary Dam Juveni le Fish Bypass/Transportation Faci l i ty
MCX McNary Dam Juveni le Experimental Si te McNary Dam - Ful l -Flow Bypass (NMFS, 2002); non-ISO coi l s (Chelan Co. PUD, 1996)
MRB Lower Methow River Bas in below Twisp Instream detectors deployed at 10 s i tes in tributaries to the lower Methow River below Twisp, WA.
MRT Methow River array at Twisp In-s tream array on the Methow River at Twisp, WA.
MRW Methow River array at Winthrop In-s tream array on the Methow River at Winthrop, WA.
MSC Methow River Side Channel Array Instream arrays on a s ide channel to the Methow River
MWC Maxwel l Canal ,Umati l la River
Maxwel l Canal i s located at rkm 24 on the Umati l la River. MWC is operated by USFWS for the Bureau of
Reclamation.
MWE Middle Wenatchee River
This i s a pass ive in-s tream interrogation system at Wenatchee River rkm 50 above Tumwater Dam, cons is ting of a
s ingle antenna array floated off the bottom spanning the river.
NAL Lower Nason Creek
This i s an in-s tream interrogation system at Nason Creek rkm 1, located within Lake Wenatchee State Park,
cons is ting of s ix hybrid antennae (3 upstream, 3 downstream) spanning 16.7m across the low-water channel .
NAU Upper Nason Creek
This i s an in-s tream interrogation system at Nason Creek rkm 19 (Wenatchee River Bas in), cons is ting of s ix pass -by
antennae (3 upstream, 3 downstream) spanning 17.6m across the low-water channel .
NBA Nursery Bridge Divers ion Dam Fishways Nursery Bridge Dam Fishways (both), Wal la Wal la River at Mi l ton-Freewater, OR.
OKC Okanagan Channel at VDS-3 Okanagan Channel VDS-3, at Okanogan River km 149 upstream of Osoyoos Lake
OMK Omak Creek Crump Weir Instream detectors at the mouth of Omak Creek.
ORB Oas is Road Bridge,lower Wal la Wal la River Instream detectors at Oas is Road Bridge, lower Wal la Wal la River
PES Peshastin Creek
This i s a pass ive in-s tream interrogation system at rkm 3 on the Peshastin River (Wenatchee River Bas in), located
just below the bridge at Smithson's property. It cons is ts of a s ingle antenna array spanning the width of the river.
PRA Priest Rapids Dam Adult Fishways Priest Rapids Dam Adult Fishways (both)
PRJ Prosser Dam screened Juveni le Divers ion Chandler Canal Divers ion Bypass and Sampl ing Faci l i ty at Prosser Dam
PRO Prosser Dam Fishways and screened Divers ion Adult Fishways (a l l three) and Juveni le Bypass/Sampl ing Faci l i ty at Prosser Dam
RBF Round Butte Dam Fish Transfer Faci l i ty Round Butte Dam Fish Transfer Faci l i ty
RCL Rock Creek (WA) near Yakima Nation Longhouse Instream detection system on Rock Creek (WA) near the YIN Longhouse
RCS Rock Creek (WA) at Squaw Creek Instream detection system on Rock Creek (WA) at Squaw Creek
RCX Rattlesnake Creek Flat Plates (Experimental )
This in-s tream interrogation system is located on Rattlesnake Creek, in the White Sa lmon River Bas in on the Lower
Columbia River above Bonnevi l le Dam.
RFP Rolfing Accl imation Pond Rolfing Accl imation Pond, Wenatchee River Bas in.
RIA Rock Is land Dam Adult Fishways Rock Is land Dam Adult Fishways (a l l three)
ROZ Roza Dam Juveni le Divers ion Roza Dam Smolt Bypass
RPJ Rapid River Hat. Juveni le Vol i tional Release Rapid River Hatchery (IDFG) outfa l l
RRF Rocky Reach Fishway Rocky Reach Dam Adult Fishway
RRJ Rocky Reach Dam Juveni le Bypass System Rocky Reach Dam Juveni le Fish Bypass System
RSB Roosevelt Street Bridge Instream detectors on Mi l l Creek at the Roosevelt St. bridge, Wal la Wal la , WA.
RZF Roza Dam Adult Fishway Adult Fishway at Roza Dam
SAJ Salmon River Trap
The Sa lmon River Smolt Trap is located at rkm 103 on the Sa lmon River. SAJ has been deployed annual ly during the
Spring s ince 1993. PIT tag interrogation data are generated for previous ly-tagged fi sh recaptured at the trap.
SCL Spring Creek NFH Adult Ladder Adult Fishway at Spring Creek National Fish Hatchery

62
Table A3. Continued.
SCP Spring Creek Acc. Pond behind Winthrop NFH Monitored Release at Spring Creek Acc. Pond at Winthrop NFH
SFG SF Sa lmon River near Guard Station Rd. Bridge
This i s an in-s tream interrogation system located at rkm 30 near the lower South Fork Sa lmon River Guard Station
on the South Fork Sa lmon River. It cons is ts of s ix flat plate antennas , spanning 36 meters across the low-water
channel .
SFL Shipherd Fa l l s Ladder
This s i te i s located at Shipherd Fa l l s adult fi sh ladder, on the Wind River near Carson, WA. The PIT tag interrogation
antennas are insta l led in series in the second and third s lots below the adult fi sh trap. Antenna F1 i s upstream of
antenna F2.
SIP Simi lkameen Acc. Pond Simi lkameen Accl imation Pond
SNJ Snake River Trap
The Snake River Smolt Trap is located at River Ki lometer 225 on the Snake River, immediately above the confluence
with the Clearwater River. SNJ has been deployed annual ly during the Spring s ince 1989.
SSJ Sunnys ide Dam Juveni le Divers ion Sunnys ide Dam Smolt Bypass
STL Sawtooth Hatchery Adult Trap Sawtooth Hatchery Adult Trap
STR SF Sa lmon Satel l i te Faci l i ty South Fork Sa lmon Satel l i te Faci l i ty downstream of Knox Bridge
SUJ Sul l ivan Dam Juveni le Bypass System
The Sul l ivan Dam smolt bypass trap i s located in the Sul l ivan Dam powerhouse (operated by PGE) at Wi l lamette
Fa l l s on the Wi l lamette River.
SWT Sweetwater Creek near i ts mouth
In-s tream detectors on Sweetwater Creek, near the confluence with Lapwai Creek. This i s an in-s tream
interrogation system cons is ting of two separate antennas , 10 feet apart and approximately 0.2 mi les upstream
from the mouth of Sweetwater Creek.
TAY Big Creek (Idaho) at Taylor Ranch
In-s tream detectors centered around the bridge at Taylor Ranch, Big Creek, ID. It cons is ts of two MUX arrays ,
spanning Big Creek, above and below the bridge.
TMA Three Mi le Fa l l s Dam Adult Fishway
Three Mi le Fa l l s Dam (Umati l la River) Adult Fishway. This was a modest detection system in the adult ladder on
the east shore at TMF. It cons is ted of one or two DF-2001F transceivers and racket antennas , with the antennae
affixed external ly to the count
TMF Three Mi le Fa l l s Dam Fishway and Divers ion Adult Fishway and Juveni le Bypass/subsampl ing faci l i ty at Three Mi le Fa l l s Dam
TMJ Three Mi le Fa l l s Dam Juveni le Divers ion
Three Mi le Fa l l s Dam (Umati l la River) Juveni le Fish Bypass System. The TMF smolt bypass trap i s located at the
i rrigation divers ion screen on the west shore at TMF.
TRC Trout Creek In-s tream Detection,Wind River
The Trout Creek interrogation system is located at RKM 4 on Trout Creek, in the Wind River (WA.) Bas in above
Hemlock Lake.
TUF Tumwater Dam Adult Fishway Adult Fishway at Tumwater Dam
TWR Lower Twisp River near MSRF Ponds In-s tream detectors on the lower Twisp River adjacent to the Methow Salmon Recovery Foundation Ponds .
TWX Estuary Towed Array (Experimental )
The TWX experimental trawl detector i s typica l ly deployed in the Columbia River estuary, at and above Jones Beach
(rkm 75).
UM1 NF Umati l la River at Forks Campground Bridge
In-s tream detectors on the North Fork Umati l la River at Forks Campground. This s i te i s located at a bridge
approximately 100m above the mouth of the North Fork Umati l la River.
UM2 Umati l la River Array above Imeques Acc. Pond In-stream detectors on the mainstem Umati l la River upstream of Imeques Acc. Pond.
UWE Upper Wenatchee River
This i s a pass ive in-s tream interrogation system at Wenatchee River rkm 86, below the confluence with the
Chiwawa River, cons is ting of a s ingle antenna array spanning the width of the river.
VC1 Val ley Creek,in-river at Stanley,ID This i s an in-s tream interrogation system located on Val ley Creek at Stanley, ID., in the Upper Sa lmon River.
VC2 Val ley Creek,in-river below Stanley,ID This i s an in-s tream interrogation system located on Val ley Creek below Stanley, ID., in the Upper Sa lmon River.
WAJ Wanapum Dam Juveni le (gatewel l dip) Wanapum Dam Smolt Bypass (Gatewel l Dip)
WEA Wel ls Dam Adult Fishways Wel ls Dam Adult Fishways (both)
WFC Wolf Creek In-s tream Array,Chewuck River In-s tream detector on Wolf Creek, Methow River Bas in
WFF Wil lamette Fa l l s Adult Fishway Wil lamette Fa l l s Adult Fishway
WHC Mouth of White Creek,Kl icki tat River Bas in Instream detection system near the mouth of White Creek, Kl icki tat River Bas in
WPJ Wapato Dam Juveni le Divers ion Wapato Dam Smolt Bypass
WSH Adult fi shway at Warm Springs NFH Adult Fishway at Warm Springs NFH
WTL White River,Wenatchee Bas in
This i s a pass ive in-s tream interrogation system at White River rkm 4, located at the old fi sh weir s i te, cons is ting of
a s ingle antenna array spanning the width of the river.
WW1 SF Wal la Wal la River at Harris Park Bridge In-s tream detectors at Harris County Park Bridge, South Fork Wal la Wal la River
WW2 SF Wal la Wal la River at Bear Creek In-s tream detectors at Bear Creek, South Fork Wal la Wal la River
Y1J Yakima River Trap Yakima River Smolt Trap at Van Giesen Bridge
YHC Yel lowhawk Creek
Yel lowhawk Creek in-s tream detection s i te, between Mi l l Creek and Wal la Wal la River. The interrogation system
cons is ts of a two ful l -s tream antenna (A1) located below the Mi l l Creek Divers ion headgate, and a second ful l -
s tream antenna (B1) located near W
ZEN Secesh River near Zena Creek Ranch
This i s an in-s tream interrogation system cons is ting of two separate antenna arrays , 130 meters apart, near the
Zena Creek Ranch.
ZSL Zosel Dam Adult Fishways Adult Fishways at Zosel Dam, Okanogan River below Osoyoos Lake

63
Figure A1. Map of Columbia River interrogation sites that detected Chinook and sockeye salmon, and steelhead in 2009. Table A3 in the Appendix lists the PTAGIS sites full name and the three-letter codes on this map.

64
Figure A2. Map of Lower Columbia River detections sites and number of spring Chinook detected. Table A3 in the Appendix lists the PTAGIS sites full name and the three-letter codes on this map. Spring Chinook is defined as fish passing Bonneville Dam from January 1 to June 1.

65
Figure A3. Map of Upper Columbia River detections sites and number of spring Chinook detected. Table A3 in the Appendix lists the PTAGIS sites full name and the three-letter codes on this map. Spring Chinook is defined as fish passing Bonneville Dam from January 1 to June 1.

66
Figure A4. Map of Lower Snake River detections sites and number of spring Chinook detected. Table A3 in the Appendix lists the PTAGIS sites full name and the three-letter codes on this map. Spring Chinook is defined as fish passing Bonneville Dam from January 1 to June 1.

67
Figure A5. Map of Salmon River detections sites and number of spring Chinook detected. Table A3 in the Appendix lists the PTAGIS sites full name and the three-letter codes on this map. Spring Chinook is defined as fish passing Bonneville Dam from January 1 to June 1.

68
Figure A6. Map of Lower Columbia River detections sites and number of summer Chinook detected. Table A3 in the Appendix lists the PTAGIS sites full name and the three-letter codes on this map. Summer Chinook is defined
as fish passing Bonneville Dam from June 1 to August 1.

69
Figure A7. Map of Upper Columbia River detections sites and number of summer Chinook detected. Table A3 in the Appendix lists the PTAGIS sites full name and the three-letter codes on this map. Summer Chinook is defined as fish passing Bonneville Dam from June 1 to August 1.
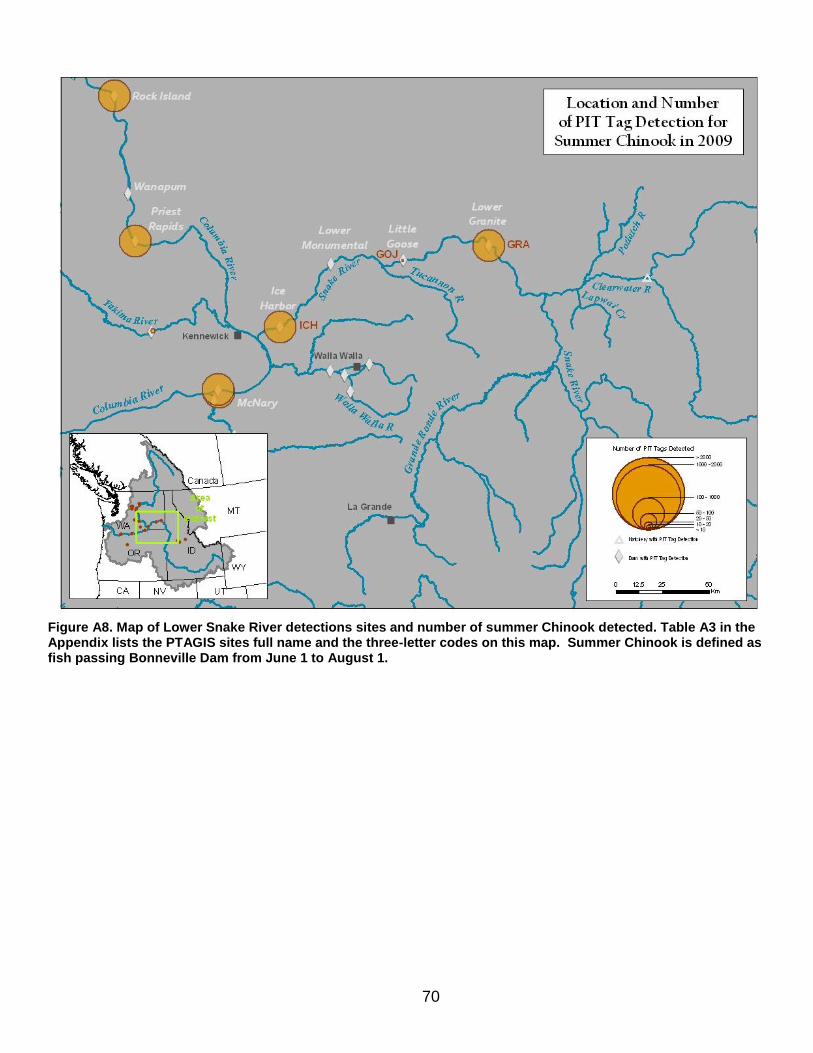
70
Figure A8. Map of Lower Snake River detections sites and number of summer Chinook detected. Table A3 in the Appendix lists the PTAGIS sites full name and the three-letter codes on this map. Summer Chinook is defined as fish passing Bonneville Dam from June 1 to August 1.

71
Figure A9. Map of Salmon River detections sites and number of summer Chinook detected. Table A3 in the Appendix lists the PTAGIS sites full name and the three-letter codes on this map. Summer Chinook is defined as fish passing Bonneville Dam from June 1 to August 1.

72
Figure A10. Map of Lower Columbia River detections sites and number of fall Chinook detected. Table A3 in the Appendix lists the PTAGIS sites full name and the three-letter codes on this map. Fall Chinook is defined as fish passing Bonneville Dam from August 1 to end of year.

73
Figure A11. Map of Upper Columbia River detections sites and number of fall Chinook detected. Table A3 in the Appendix lists the PTAGIS sites full name and the three-letter codes on this map. Fall Chinook is defined as fish passing Bonneville Dam from August 1 to end of year.
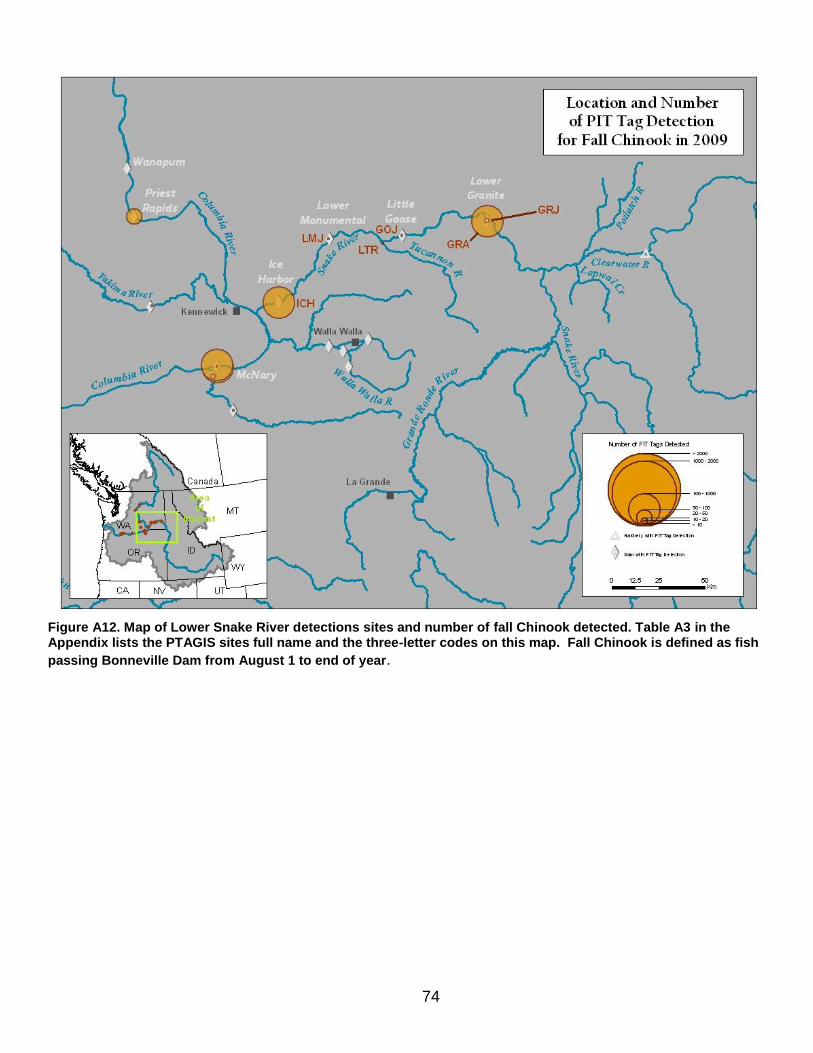
74
Figure A12. Map of Lower Snake River detections sites and number of fall Chinook detected. Table A3 in the Appendix lists the PTAGIS sites full name and the three-letter codes on this map. Fall Chinook is defined as fish
passing Bonneville Dam from August 1 to end of year.

75
Figure A13. Map of Lower Columbia River detections sites and number of steelhead detected. Table A3 in the
Appendix lists the PTAGIS sites full name and the three-letter codes on this map.

76
Figure A14. Map of Upper Columbia River detections sites and number of steelhead detected. Table A3 in the Appendix lists the PTAGIS sites full name and the three-letter codes on this map.
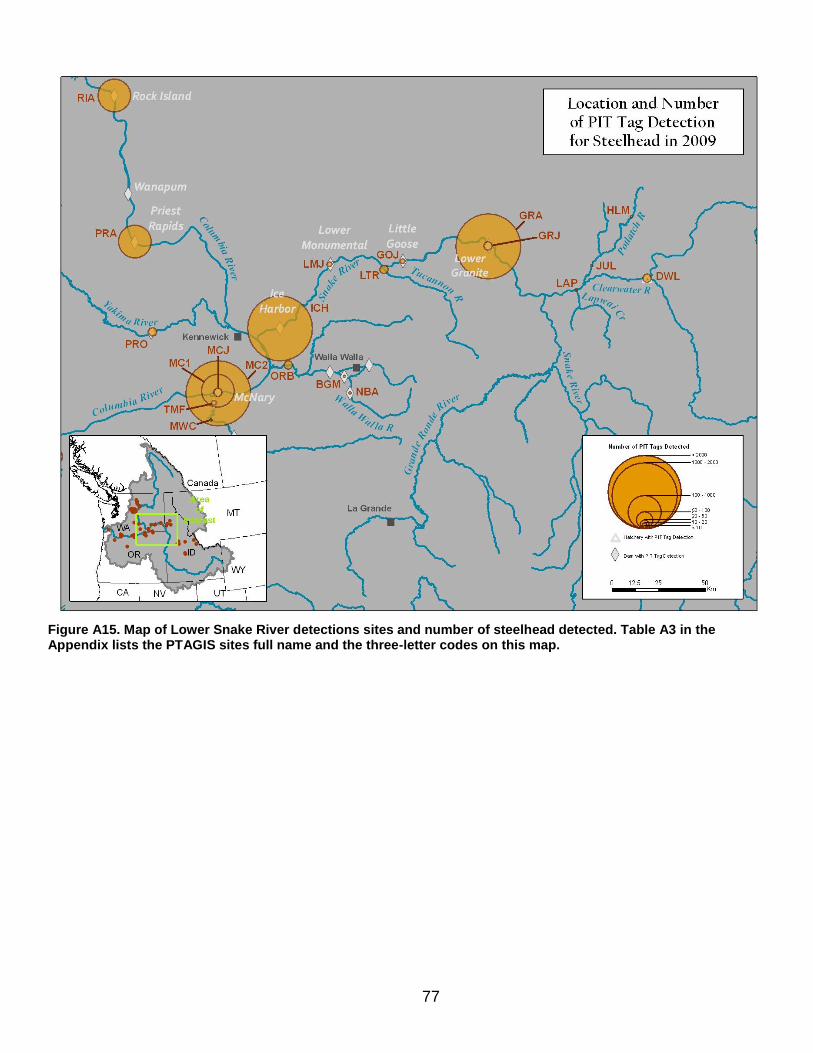
77
Figure A15. Map of Lower Snake River detections sites and number of steelhead detected. Table A3 in the Appendix lists the PTAGIS sites full name and the three-letter codes on this map.

78
Figure A16. Map of Salmon River detections sites and number of steelhead detected. Table A3 in the Appendix lists the PTAGIS sites full name and the three-letter codes on this map.
Related Documents