NANO EXPRESS Open Access Current-voltage characteristics of nanoplatelet- based conductive nanocomposites Amirhossein Biabangard Oskouyi 1 , Uttandaraman Sundararaj 2 and Pierre Mertiny 1* Abstract In this study, a numerical modeling approach was used to investigate the current-voltage behavior of conductive nanoplatelet-based nanocomposites. A three-dimensional continuum Monte Carlo model was employed to randomly disperse the nanoplatelets in a cubic representative volume element. A nonlinear finite element-based model was developed to evaluate the electrical behavior of the nanocomposite for different levels of the applied electric field. Also, the effect of filler loading on nonlinear conductivity behavior of nanocomposites was investigated. The validity of the developed model was verified through qualitative comparison of the simulation results with results obtained from experimental works. Keywords: Nanocomposites; Conductive nanoplatelets; Current-voltage characteristics Background In recent years, the nonlinear electrical conductivity be- havior of nanoparticle-modified polymers has received considerable attention by researchers, and several studies have been carried out to investigate the current-voltage characteristics of conductive nanocomposites. Even though several studies investigated the nonohmic conductivity behavior of insulator polymers filled with conductive spherical and stick-like inclusions [1-5], to the best of the authors' knowledge, all of the research in this field has been limited to experimental works. Experimental research devoted to the electric properties of nanoplatelet-based nanocomposites investigated the electrical conductivity of polymers with exfoliated graphite sheets with sizes varying from a few microns to several hundreds of a mi- cron [6-10], which allows for only limited prediction of the conductivity behavior of nanocomposites with submi- cron size inclusions. These limitations motivated the present authors to con- duct a numerical study to investigate the current-voltage behavior of polymers made electrically conductive through the uniform dispersion of conductive nanoplatelets. Spe- cifically, the nonlinear electrical characteristics of conduct- ive nanoplatelet-based nanocomposites were investigated in the present study. Three-dimensional continuum Monte Carlo modeling was employed to simulate electrically con- ductive nanocomposites. To evaluate the electrical proper- ties, the conductive nanoplatelets were assumed to create resistor networks inside a representative volume element (RVE), which was modeled using a three-dimensional non- linear finite element approach. In this manner, the effect of the voltage level on the nanocomposite electrical behavior such as electrical resistivity was investigated. Methods Monte Carlo modeling Theoretically, a nanocomposite is rendered electrically conductive by inclusions dispersed inside the polymer that form a conductive path through which an electrical current can pass. Such a path is usually termed a percola- tion network. Figure 1 illustrates the conductivity mechan- ism of an insulator polymer made conductive through the formation of a percolation network. In this figure, ele- ments in black, white, and gray color indicate nanoplate- lets that are individually dispersed, belong to an electrically connected cluster, or form a percolation network inside the RVE, respectively. Quantum tunneling of electrons through the insulator matrix is the dominant mechanism in the electric behavior of conductive nanocomposites. Figure 2 illustrates the concept of a tunneling resistor for simulating electron tunneling through an insulator matrix and its role in the formation of a percolation network. * Correspondence: [email protected] 1 University of Alberta, 4-9 Mechanical Engineering Building, Edmonton, Alberta T6G 2G8, Canada Full list of author information is available at the end of the article © 2014 Oskouyi et al.; licensee Springer. This is an Open Access article distributed under the terms of the Creative Commons Attribution License (http://creativecommons.org/licenses/by/4.0), which permits unrestricted use, distribution, and reproduction in any medium, provided the original work is properly credited. Oskouyi et al. Nanoscale Research Letters 2014, 9:369 http://www.nanoscalereslett.com/content/9/1/369

Welcome message from author
This document is posted to help you gain knowledge. Please leave a comment to let me know what you think about it! Share it to your friends and learn new things together.
Transcript
Oskouyi et al. Nanoscale Research Letters 2014, 9:369http://www.nanoscalereslett.com/content/9/1/369
NANO EXPRESS Open Access
Current-voltage characteristics of nanoplatelet-based conductive nanocompositesAmirhossein Biabangard Oskouyi1, Uttandaraman Sundararaj2 and Pierre Mertiny1*
Abstract
In this study, a numerical modeling approach was used to investigate the current-voltage behavior of conductivenanoplatelet-based nanocomposites. A three-dimensional continuum Monte Carlo model was employed torandomly disperse the nanoplatelets in a cubic representative volume element. A nonlinear finite element-basedmodel was developed to evaluate the electrical behavior of the nanocomposite for different levels of the appliedelectric field. Also, the effect of filler loading on nonlinear conductivity behavior of nanocomposites wasinvestigated. The validity of the developed model was verified through qualitative comparison of the simulationresults with results obtained from experimental works.
Keywords: Nanocomposites; Conductive nanoplatelets; Current-voltage characteristics
BackgroundIn recent years, the nonlinear electrical conductivity be-havior of nanoparticle-modified polymers has receivedconsiderable attention by researchers, and several studieshave been carried out to investigate the current-voltagecharacteristics of conductive nanocomposites. Even thoughseveral studies investigated the nonohmic conductivitybehavior of insulator polymers filled with conductivespherical and stick-like inclusions [1-5], to the best of theauthors' knowledge, all of the research in this field hasbeen limited to experimental works. Experimental researchdevoted to the electric properties of nanoplatelet-basednanocomposites investigated the electrical conductivityof polymers with exfoliated graphite sheets with sizesvarying from a few microns to several hundreds of a mi-cron [6-10], which allows for only limited prediction ofthe conductivity behavior of nanocomposites with submi-cron size inclusions.These limitations motivated the present authors to con-
duct a numerical study to investigate the current-voltagebehavior of polymers made electrically conductive throughthe uniform dispersion of conductive nanoplatelets. Spe-cifically, the nonlinear electrical characteristics of conduct-ive nanoplatelet-based nanocomposites were investigated
* Correspondence: [email protected] of Alberta, 4-9 Mechanical Engineering Building, Edmonton,Alberta T6G 2G8, CanadaFull list of author information is available at the end of the article
© 2014 Oskouyi et al.; licensee Springer. This isAttribution License (http://creativecommons.orin any medium, provided the original work is p
in the present study. Three-dimensional continuum MonteCarlo modeling was employed to simulate electrically con-ductive nanocomposites. To evaluate the electrical proper-ties, the conductive nanoplatelets were assumed to createresistor networks inside a representative volume element(RVE), which was modeled using a three-dimensional non-linear finite element approach. In this manner, the effect ofthe voltage level on the nanocomposite electrical behaviorsuch as electrical resistivity was investigated.
MethodsMonte Carlo modelingTheoretically, a nanocomposite is rendered electricallyconductive by inclusions dispersed inside the polymerthat form a conductive path through which an electricalcurrent can pass. Such a path is usually termed a percola-tion network. Figure 1 illustrates the conductivity mechan-ism of an insulator polymer made conductive through theformation of a percolation network. In this figure, ele-ments in black, white, and gray color indicate nanoplate-lets that are individually dispersed, belong to an electricallyconnected cluster, or form a percolation network insidethe RVE, respectively. Quantum tunneling of electronsthrough the insulator matrix is the dominant mechanismin the electric behavior of conductive nanocomposites.Figure 2 illustrates the concept of a tunneling resistor forsimulating electron tunneling through an insulator matrixand its role in the formation of a percolation network.
an Open Access article distributed under the terms of the Creative Commonsg/licenses/by/4.0), which permits unrestricted use, distribution, and reproductionroperly credited.
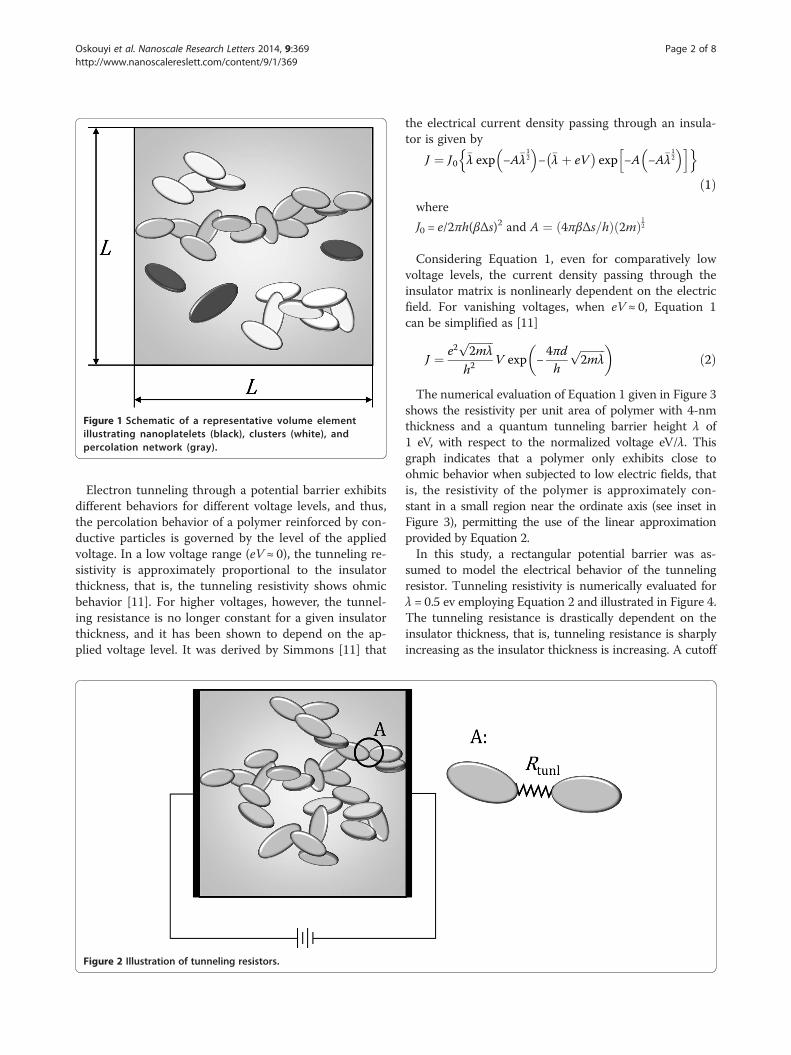
Figure 1 Schematic of a representative volume elementillustrating nanoplatelets (black), clusters (white), andpercolation network (gray).
Oskouyi et al. Nanoscale Research Letters 2014, 9:369 Page 2 of 8http://www.nanoscalereslett.com/content/9/1/369
Electron tunneling through a potential barrier exhibitsdifferent behaviors for different voltage levels, and thus,the percolation behavior of a polymer reinforced by con-ductive particles is governed by the level of the appliedvoltage. In a low voltage range (eV ≈ 0), the tunneling re-sistivity is approximately proportional to the insulatorthickness, that is, the tunneling resistivity shows ohmicbehavior [11]. For higher voltages, however, the tunnel-ing resistance is no longer constant for a given insulatorthickness, and it has been shown to depend on the ap-plied voltage level. It was derived by Simmons [11] that
Figure 2 Illustration of tunneling resistors.
the electrical current density passing through an insula-tor is given by
J ¼ J0 �λ exp −A�λ12
� �− �λ þ eV� �
exp −A −A�λ12
� �h in oð1Þ
where
J0 = e/2πh(βΔs)2 and A ¼ 4πβΔs=hð Þ 2mð Þ12
Considering Equation 1, even for comparatively lowvoltage levels, the current density passing through theinsulator matrix is nonlinearly dependent on the electricfield. For vanishing voltages, when eV ≈ 0, Equation 1can be simplified as [11]
J ¼ e2ffiffiffiffiffiffiffiffiffi2mλ
p
h2V exp −
4πdh
ffiffiffiffiffiffiffiffiffi2mλ
p� �ð2Þ
The numerical evaluation of Equation 1 given in Figure 3shows the resistivity per unit area of polymer with 4-nmthickness and a quantum tunneling barrier height λ of1 eV, with respect to the normalized voltage eV/λ. Thisgraph indicates that a polymer only exhibits close toohmic behavior when subjected to low electric fields, thatis, the resistivity of the polymer is approximately con-stant in a small region near the ordinate axis (see inset inFigure 3), permitting the use of the linear approximationprovided by Equation 2.In this study, a rectangular potential barrier was as-
sumed to model the electrical behavior of the tunnelingresistor. Tunneling resistivity is numerically evaluated forλ = 0.5 ev employing Equation 2 and illustrated in Figure 4.The tunneling resistance is drastically dependent on theinsulator thickness, that is, tunneling resistance is sharplyincreasing as the insulator thickness is increasing. A cutoff

Figure 3 Polymer resistivity per unit area versus normalizedvoltage. The inset shows approximately ohmic behavior for lowelectric fields.
Oskouyi et al. Nanoscale Research Letters 2014, 9:369 Page 3 of 8http://www.nanoscalereslett.com/content/9/1/369
distance can therefore be approximated at which tunnel-ing resistors with length greater than this threshold do notappreciably contribute toward the overall conductivity ofthe nanocomposite. In [12] and [13], the cutoff distancewas assumed to be 1.0 and 1.4 nm, respectively. It is ex-pected that the resistivity of the insulator film is decreas-ing as the electrical field is increasing; so, when dealingwith higher voltage levels, tunneling resistors with lengthgreater than these cutoff distances may play a role in thenanocomposite conductivity. Hence, it was conservativelyassumed in this study that tunneling resistors with lengthless than 4 nm contribute toward the nanocompositeconductivity.In the first step of this work, a three-dimensional con-
tinuum percolation model based on Monte Carlo simu-lation was used to study the percolation behavior ofan insulator matrix reinforced with conductive nanopla-telet fillers. Additional details on this modeling approach
Figure 4 Tunneling resistivity versus insulator thickness.
can be found in an earlier publication [14]. In the simu-lation, circular nanoplatelets are randomly generatedand added to the RVE. The shortest distance betweenadjacent particles is calculated, and particles with dis-tance between them shorter than the cutoff distanceare grouped into clusters. The formation of a clusterconnecting two parallel faces of the RVE is consideredthe formation of a percolation network that allowselectric current to pass through the RVE, rendering itconductive.
Finite element modelingTo study the electrical properties of nanocomposites, inparticular their conductivity behavior, the employedmodeling approach further involved the creation of anonlinear three-dimensional finite element resistor net-work. Considering the excellent conductivity of the con-sidered nanoplatelets (e.g. σ = 108 S/m for graphene), theelectrical potential drop across the nanoplatelets wasneglected. The tunneling resistors were modeled as non-ohmic, which resistivity is governed by Equation 1.Employing appropriate finite element formulations, thegoverning equation of an electrical resistor can be writ-ten as
Iij−Iij
¼ kij −kij
−kij kij
� �V i
V j
ð3Þ
where Iij is the electrical current passing between theith and jth node; kij is the conductance of the resistorbetween nodes i and j; and Vi is the voltage of the ithnode measured with respect to a node connected toground. The system of the nonlinear equations govern-ing the electrical behavior of the nanocomposite was ob-tained by assembling the governing equations for theindividual elements. The resulting nonlinear system ofequations was solved employing an iterative method.
Results and discussionModeling resultsThe developed model was employed to investigate the elec-trical behavior of a polymer with λ = 0.5 ev made conduct-ive through the uniform dispersion of conductive circularnanoplatelets with a diameter of 100 nm. In the simula-tions, the size of the RVE was chosen to be nine times thediameter of the nanodisks, which was ascertained to belarge enough to minimize finite size effects. In an earlierstudy [15], the authors showed that the Monte Carlo simu-lation results are no longer appreciably RVE-size dependentwhen the RVE size is about eight times the sum of 2R + dt,where R and dt are the radius of the nanoplatelets and tun-neling distance, respectively.The graph in Figure 5 depicts the effect of filler loading
on nanocomposite conductivity. As expected, a critical
0.045 0.05 0.055 0.06 0.065 0.07 0.075
10−10
10−9
10−8
10−7
Vf
σ [S
/m]
Figure 5 Conductivity of nanocomposite with respect to filler loading of conductive nanodisks with diameter of 100 nm.
Oskouyi et al. Nanoscale Research Letters 2014, 9:369 Page 4 of 8http://www.nanoscalereslett.com/content/9/1/369
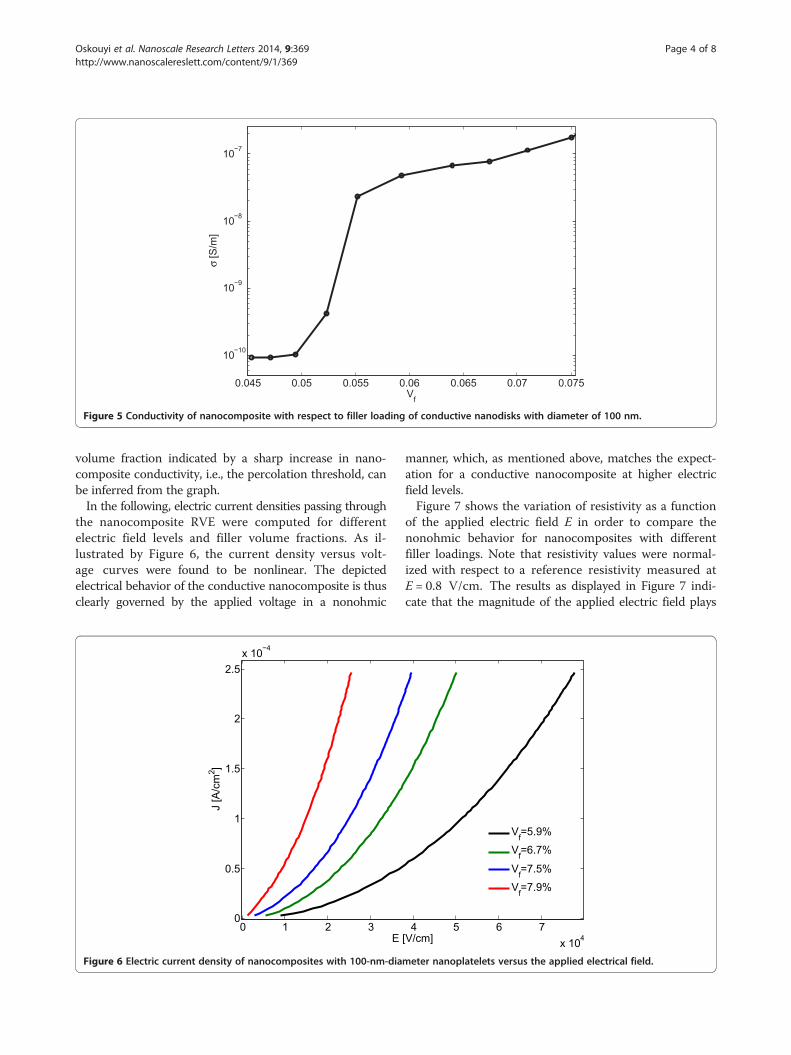
volume fraction indicated by a sharp increase in nano-composite conductivity, i.e., the percolation threshold, canbe inferred from the graph.In the following, electric current densities passing through
the nanocomposite RVE were computed for differentelectric field levels and filler volume fractions. As il-lustrated by Figure 6, the current density versus volt-age curves were found to be nonlinear. The depictedelectrical behavior of the conductive nanocomposite is thusclearly governed by the applied voltage in a nonohmic
0 1 2 30
0.5
1
1.5
2
2.5
x 10−4
E
J [A
/cm
2]
Figure 6 Electric current density of nanocomposites with 100-nm-dia
manner, which, as mentioned above, matches the expect-ation for a conductive nanocomposite at higher electricfield levels.Figure 7 shows the variation of resistivity as a function
of the applied electric field E in order to compare thenonohmic behavior for nanocomposites with differentfiller loadings. Note that resistivity values were normal-ized with respect to a reference resistivity measured atE = 0.8 V/cm. The results as displayed in Figure 7 indi-cate that the magnitude of the applied electric field plays
4 5 6 7
x 104[V/cm]
Vf=5.9%
Vf=6.7%
Vf=7.5%
Vf=7.9%
meter nanoplatelets versus the applied electrical field.

1 1.5 2 2.5 3 3.5 4 4.5 5
x 104
0
0.1
0.2
0.3
0.4
0.5
0.6
0.7
0.8
0.9
1
E [v/cm]
ρ/ρ 0
Vf=5.9%
Vf=6.7%
Vf=7.5%
Vf=7.9%
Figure 7 Normalized resistivity of nanocomposites with 100-nm nanodisks as a function of the applied electrical field.
Oskouyi et al. Nanoscale Research Letters 2014, 9:369 Page 5 of 8http://www.nanoscalereslett.com/content/9/1/369
an important role in the conductivity of nanoplatelet-based nanocomposites. The employed modeling approachpredicts nanocomposite resistivity to be a nonlinear func-tion of the applied voltage. Clearly, the nanocompositesexhibit nonohmic behavior where the resistivity de-creases with increasing voltage. Interestingly, the resultsin Figure 7 also indicate a reduced drop in resistivity anddecreased nonohmic behavior for nanocomposites withhigher filler volume fraction, that is, nanocomposites withhigher filler loadings are less sensitive to the applied elec-tric field level.
0 50 100 150 2000
0.2
0.4
0.6
0.8
1
1.2
E [
ρ/ρ 0
Figure 8 Normalized resistivity data versus applied electrical field fro
Comparison with experimental dataTo corroborate the simulation results, conductive epoxynanocomposite samples were produced by in situpolymerization and their electrical behavior assessedas illustrated by Figure 8. Bisphenol-A epoxy resin andnon-MDA polyamine curing agent (EPON 826 andEPIKURE 9551, by Hexion Specialty Chemicals, Columbus,Ohio, USA) were used for the fabrication of samples thatwere made electrically conductive by dispersing gra-phene nanoplatelets (xGnP-M-25, by XG Sciences, Lansing,Michigan, USA).
250 300 350 400 450
v/cm]
Vf=1%
Vf=1.25%
Vf=1.75%
Vf=2.25%
m experiments with nanographene/epoxy samples.

Figure 9 Resistivity of nanocomposites with 100-nm circularnanoplatelets as a function of electric power.
Oskouyi et al. Nanoscale Research Letters 2014, 9:369 Page 6 of 8http://www.nanoscalereslett.com/content/9/1/369
Graphene nanoplatelets were dispersed in acetone bysonication using a probe sonicater in an ice bath. In thefollowing, epoxy was added to the mixture and sonic-ation was repeated. The solvent was evaporated by heat-ing the mixture on a magnetic stir plate and stirringwith a Teflon-coated magnet. Remaining acetone was re-moved by using a vacuum chamber. The curing agentwas added to the mixture and mixed with a high-speedmechanical shear mixer. The mixture was again degassed
4 4.5 5 5.5−1
−0.9
−0.8
−0.7
−0.6
−0.5
−0.4
−0.3
−0.2
−0.1
V
α
Figure 10 Value of α as a function of filler volume fraction for nanoco
using the vacuum chamber and subsequently poured intoa mold. A 2-h cure cycle was then performed at 120°C.Resulting samples were machined into circular disks with30-mm diameter and 3-mm thickness. The sample volumeresistivities were measured at different applied voltagesemploying a Keithley 6517A electrometer connected to aKeithley test fixture (Keithley Instruments, Cleveland,Ohio, USA).Data in Figure 8 depicting the resistivity behavior of the
epoxy nanocomposite samples was normalized with re-spect to the resistivity measured at an applied voltage of10 V. Samples with 1 and 1.25% graphene volume fractionexhibited high resistivity levels indicating a filler loadingbelow the percolation threshold. For higher graphene vol-ume fractions of 1.75 and 2.25%, measurements indicatedthat percolation was achieved, and resistivity was found todecrease with the increase of the applied electric field.As predicted by the preceding modeling work, sampleresistivity was found to be less sensitive to the ap-plied electrical field for higher filler loadings. Hence,modeling and simulation results are qualitatively in goodagreement, indicating the validity of the assumptionsundertaken for the numerical modeling. However, the datapresented in Figures 7 and 8 also signify that further stud-ies are warranted to establish a quantitative agreementbetween numerical and experimental results.
Characterization of resistivity behaviorGorrasi et al. [5] and Liu et al. [16] showed that the re-sistivity of carbon nanotube-based nanocomposites as a
6 6.5 7 7.5 8
f [%]
mposites with 100-nm circular nanoplatelets.

Oskouyi et al. Nanoscale Research Letters 2014, 9:369 Page 7 of 8http://www.nanoscalereslett.com/content/9/1/369
function of the electric power P = V × I can be describedby an exponential expression:
ρ ¼ r Pα ð4Þ
where α is an index which generally varies between −1and 0. The value of α is indicative of the nonlinearity ofthe current-voltage relationship, i.e., α = 0 correspondsto ohmic behavior, and α decreases with increasing non-linearity of the current-voltage curve; r is a parameterrelating to the resistivity of the nanocomposite when theelectrical power passing through the sample is 1 W [16].Computed nanocomposite resistivities are displayed as
a function of the electric power in the graph in Figure 9.Data obeying Equation 4 appear in the form of straightlines owing to the graph's logarithmic scale. As shown inFigure 9, the slope of the lines decreases as the nonline-arity is decreasing with increasing filler loading. Thevalues of α as a function of filler volume fraction are pro-vided in Figure 10. It is shown that α values are increasingwith rising filler volume fraction. A discontinuity in αvalues can be observed in this graph for filler volume frac-tions of about 5%, which is associated with the percolationvolume fraction. The behavior of data simulated herein isqualitatively congruent with results reported in [5] for car-bon nanotube nanocomposites.
ConclusionsIn this study, the current-voltage behavior of conductivenanoplatelet-based nanocomposites was investigated. Tothis end, a numerical modeling approach was developed.The simulations predicted the resistivity of nanoplatelet-based nanocomposites to be strongly affected by theapplied electric field. The nanocomposites exhibit non-ohmic behavior, that is, resistivity is a nonlinear functionof the applied electric field. Further, nanocomposite re-sistivity was ascertained to decrease with increasing volt-age, while the degree of nonlinear behavior was found todecline with rising filler volume fraction. A good quali-tative agreement was observed between simulationsand experimental data, the latter of which was obtainedemploying measurements on nanographene/epoxy nano-composites. The qualitative agreement between numericaland experimental studies encourages conducting a morecomprehensive study to establish a quantitative agree-ment. The analysis further revealed that nanocompositeresistivity as a function of electrical power can be de-scribed by an exponential relation, where the exponent isa measure of the deviation from nonohmic behavior of theconductive nanocomposite.
Nomenclaturedt, tunneling distancee, electron charge
E, applied electric fieldh, Planck's constantI, electrical currentJ, quantum tunneling current densityk, conductance of tunneling resistorL, dimension of representative volume elementm, electron massP, electric powerr, resistivity parameterR, radius of circular nanoplateletss1, s2, limits of barrier at Fermi levelΔs = s2 − s1V, voltage across insulatorVf, filler volume fractionα, nonlinearity factorβ, correction factorλ, height of barrier for quantum tunneling�λ; mean barrier height for quantum tunnelingρ, electrical resistivityσ, electrical conductivity
Competing interestsThe authors declare that they have no competing interests.
Authors' contributionAll authors made equally valuable contributions to this paper. All authorsread and approved the final manuscript.
AcknowledgementsThis research work was supported by the following organizations: AlbertaInnovates-Technology Futures, ROSEN Swiss AG, and Syncrude Canada Ltd.
Author details1University of Alberta, 4-9 Mechanical Engineering Building, Edmonton,Alberta T6G 2G8, Canada. 2Department of Chemical and PetroleumEngineering, University of Calgary, Alberta T2N 1 N4, Canada.
Received: 1 April 2014 Accepted: 18 July 2014Published: 29 July 2014
References1. An S, Mahapatra DR: Quasi-static and dynamic strain sensing using
carbon nanotube/epoxy nanocomposite thin films. Smart Mater Struct2009, 18:045013.
2. Wichmann M, Buschhorn S, Gehrmann J, Schulte K: Piezoresistive responseof epoxy composites with carbon nanoparticles under tensile load.Phys Rev B 2009, 80:245437.
3. Cattin C, Hubert P: Network formation and electrical conduction incarbon nanotube modified polydimethylsiloxane. Mater Res Soc SympProc 2012, 1410:1–6.
4. Ounaies Z, Park C, Wise KE, Siochi EJ, Harrison JS: Electrical propertiesof single wall carbon nanotube reinforced polyimide composites.Compos Sci Technol 2003, 63:1637–1646.
5. Gorrasi G, Piperopoulos E, Lanza M, Milone C: Effect of morphology of thefiller on the electrical behavior of poly(L-lactide) nanocomposites. J PhysChem Solids 2013, 74:1–6.
6. Lin H, Lu W, Chen G: Nonlinear DC conduction behavior in epoxy resin/graphite nanosheets composites. Physica B 2007, 400:229–236.
7. Celzard A, Furdin G, Mareche JF, McRae E: Non-linear current–voltagecharacteristics in anisotropic epoxy resin–graphite flake composites.J Mater Sci 1997, 32:1849–1853.
8. Zheng Q, Song Y, Wu G, Yi X: Reversible nonlinear conduction behaviorfor high-density polyethylene/graphite powder composites near thepercolation threshold. J Polym Sci Part B 2001, 39:2833–2842.

Oskouyi et al. Nanoscale Research Letters 2014, 9:369 Page 8 of 8http://www.nanoscalereslett.com/content/9/1/369
9. Chen G, Weng W, Wu D, Wu C: Nonlinear conduction in nylon-6/foliatedgraphite nanocomposites above the percolation threshold. J Polym SciPart B 2004, 42:155–167.
10. He LX, Tjong SC: Zener tunneling in conductive graphite/epoxy composites:Dielectric breakdown aspects. Express Polym Lett 2013, 7:375–382.
11. Simmons G: Generalized formula for the electric tunnel effect betweensimilar electrodes separated by a thin insulating film. J Appl Phys 1963,34:1793–1803.
12. Hu N, Karube Y, Yan C, Masuda Z, Fukunaga H: Tunneling effect in apolymer/carbon nanotube nanocomposite strain sensor. Acta Mater 2008,56:2929–2936.
13. Bao WS, Meguid SA, Zhu ZH, Weng GJ: Tunneling resistance and its effecton the electrical conductivity of carbon nanotube nanocomposites. J ApplPhys 2012, 111:093726.
14. Oskouyi AB, Mertiny P: Monte Carlo model for the study of percolationthresholds in composites filled with circular conductive nano-disks.Procedia Eng 2011, 10:403–408.
15. Oskouyi AB, Sundararaj U, Mertiny P: Tunneling conductivity and piezoresistivityof composites containing randomly dispersed conductive nano-platelets.Materials 2014, 7:2501–2521.
16. Liu CH, Fan SS: Nonlinear electrical conducting behavior of carbonnanotube networks in silicone elastomer. Appl Phys Lett 2007, 90:041905.
doi:10.1186/1556-276X-9-369Cite this article as: Oskouyi et al.: Current-voltage characteristics ofnanoplatelet-based conductive nanocomposites. Nanoscale ResearchLetters 2014 9:369.
Submit your manuscript to a journal and benefi t from:
7 Convenient online submission
7 Rigorous peer review
7 Immediate publication on acceptance
7 Open access: articles freely available online
7 High visibility within the fi eld
7 Retaining the copyright to your article
Submit your next manuscript at 7 springeropen.com
Related Documents