Current Status of NCEP Conventional and Satellite Observations and the Impact of Observations on the RUC and GFS Models Dr. DaNa L. Carlis NOAA/NWS/NCEP/EMC September 13, 2011 Significant contributions from Brad Ballish (NCO), Ron Gelaro (GMAO), Stan Benjamin (ESRL), Jim Jung (JCSDA), Dennis Keyser (EMC), John Derber (EMC), and Geoff DiMego

Current Status of NCEP Conventional and Satellite Observations and the Impact of Observations on the RUC and GFS Models Dr. DaNa L. Carlis NOAA/NWS/NCEP/EMC.
Dec 18, 2015
Welcome message from author
This document is posted to help you gain knowledge. Please leave a comment to let me know what you think about it! Share it to your friends and learn new things together.
Transcript
Current Status of NCEP Conventional and Satellite Observations and the Impact of
Observations on the RUC and GFS Models
Dr. DaNa L. CarlisNOAA/NWS/NCEP/EMC
September 13, 2011Significant contributions from Brad Ballish (NCO), Ron Gelaro (GMAO), Stan Benjamin (ESRL), Jim Jung (JCSDA), Dennis Keyser (EMC), John Derber (EMC), and Geoff DiMego (EMC)
Outline• Bufr/PrepBufr files• NCEP obs processing/formats• RUC/RR obs used• NAM obs used• GFS obs used• NCEP data monitoring websites• Satellite coverage• RUC Impact Study• GFS Impact Study
– Adjoint method– OSEs
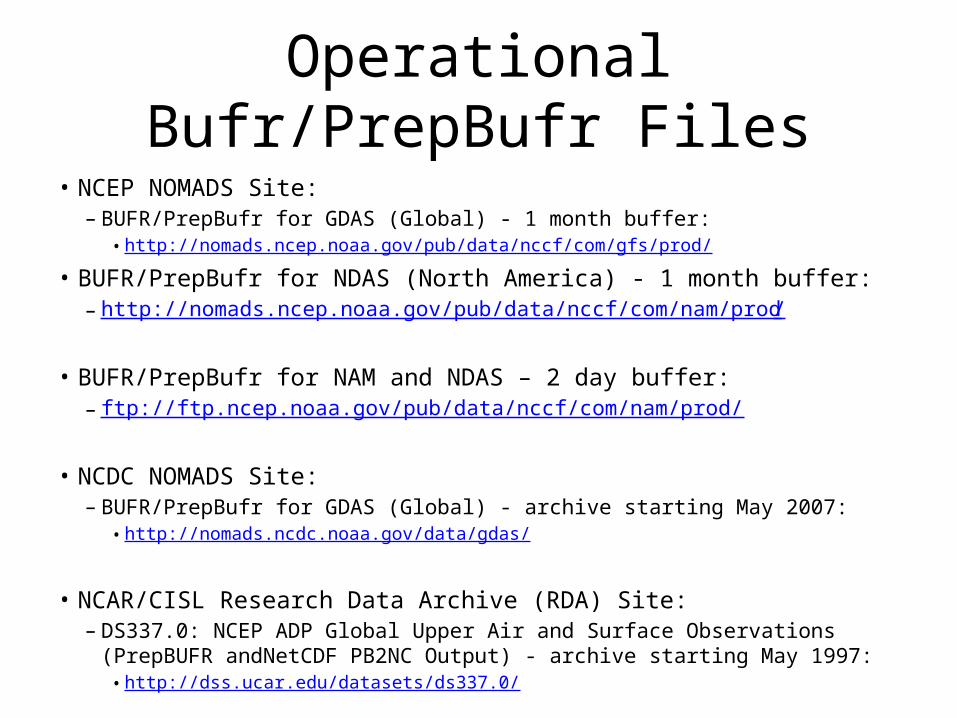
Operational Bufr/PrepBufr Files• NCEP NOMADS Site:
– BUFR/PrepBufr for GDAS (Global) - 1 month buffer:• http://nomads.ncep.noaa.gov/pub/data/nccf/com/gfs/prod/
• BUFR/PrepBufr for NDAS (North America) - 1 month buffer:– http://nomads.ncep.noaa.gov/pub/data/nccf/com/nam/prod/
• BUFR/PrepBufr for NAM and NDAS – 2 day buffer:– ftp://ftp.ncep.noaa.gov/pub/data/nccf/com/nam/prod/
• NCDC NOMADS Site:– BUFR/PrepBufr for GDAS (Global) - archive starting May 2007:
• http://nomads.ncdc.noaa.gov/data/gdas/
• NCAR/CISL Research Data Archive (RDA) Site:– DS337.0: NCEP ADP Global Upper Air and Surface Observations (PrepBUFR
andNetCDF PB2NC Output) - archive starting May 1997:• http://dss.ucar.edu/datasets/ds337.0/
Data available in real time inacceptable format
• Data formats– WMO acceptable formats – BUFR – CREX (not
really relevant) – used by most NWP centers– Almost every satellite program uses a different
format– Significant time and resources used
understanding/converting/developing formats• If data is not available in time for use in data
assimilation system – not useful
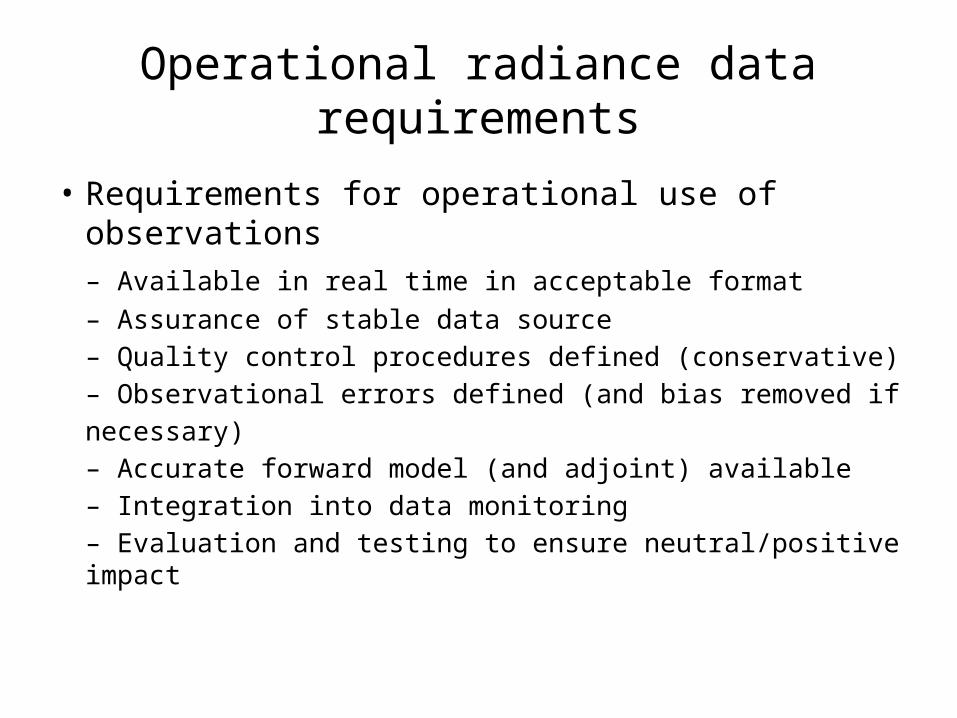
Operational radiance datarequirements
• Requirements for operational use of observations– Available in real time in acceptable format– Assurance of stable data source– Quality control procedures defined (conservative)– Observational errors defined (and bias removed ifnecessary)– Accurate forward model (and adjoint) available– Integration into data monitoring– Evaluation and testing to ensure neutral/positive impact
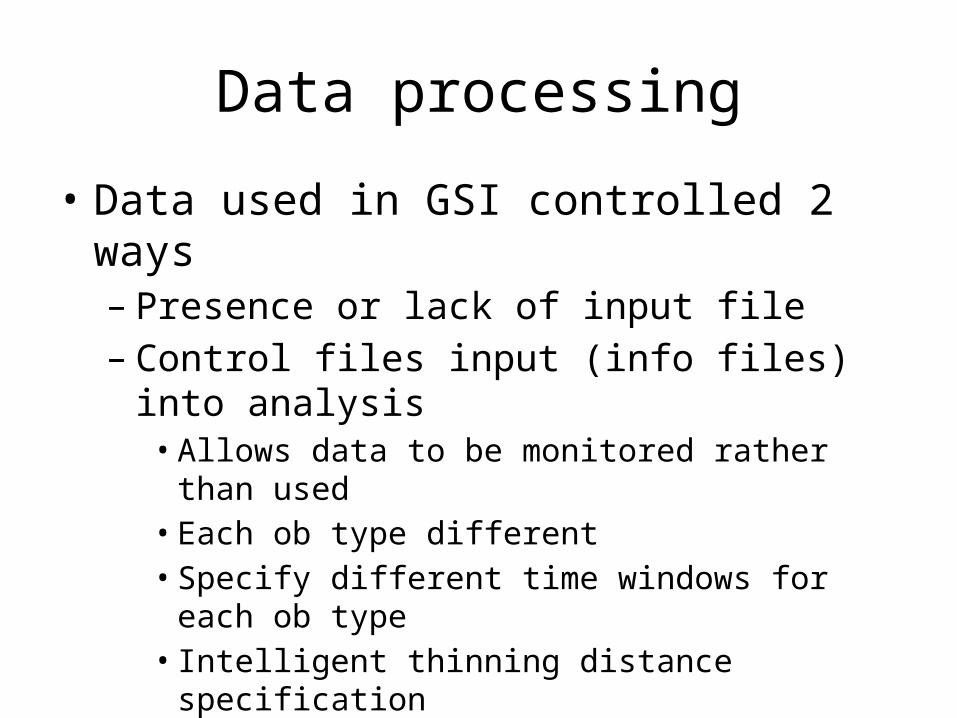
Data processing
• Data used in GSI controlled 2 ways– Presence or lack of input file– Control files input (info files) into analysis
• Allows data to be monitored rather than used• Each ob type different• Specify different time windows for each ob type• Intelligent thinning distance specification
11 12 13 Time (UTC)
1-hrfcst
BackgroundFields
AnalysisFields
1-hrfcst
3dvar
Obs
1-hrfcst
3dvar
Obs
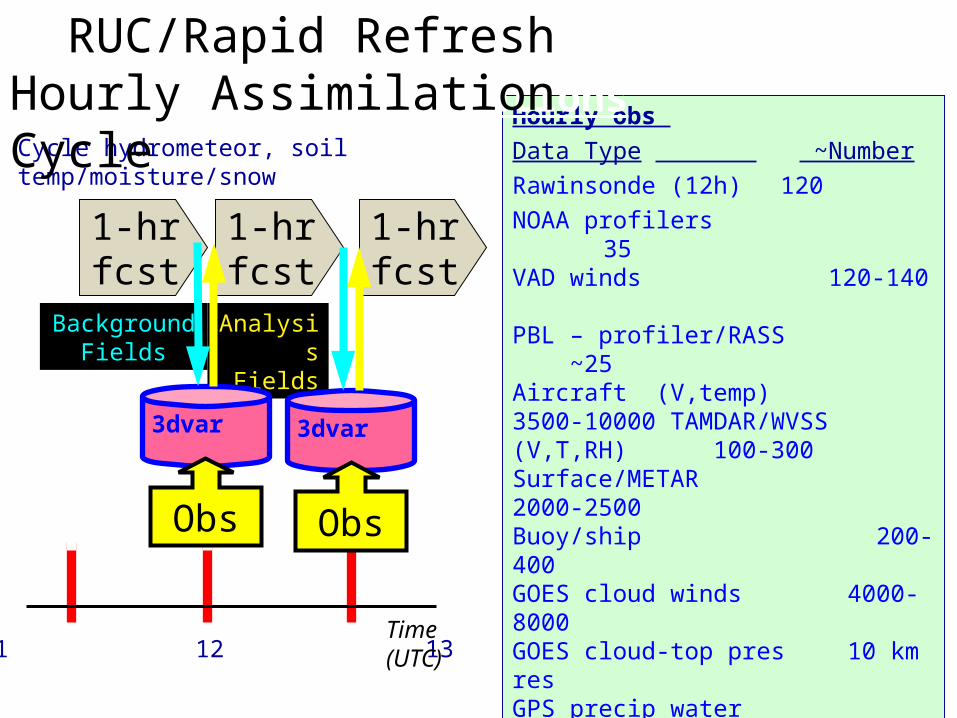
Cycle hydrometeor, soil temp/moisture/snowHourly obs Data Type ~NumberRawinsonde (12h) 120NOAA profilers 35 VAD winds 120-140 PBL – profiler/RASS ~25Aircraft (V,temp) 3500-10000 TAMDAR/WVSS (V,T,RH) 100-300Surface/METAR 2000-2500 Buoy/ship 200-400 GOES cloud winds 4000-8000 GOES cloud-top pres 10 km res GPS precip water ~300Mesonet (temp, dpt) ~8000 (RRv2)Mesonet (wind) ~4000 (RRv2)METAR-cloud-vis-wx ~1800AMSU-A/B/GOES radiances – RR onlyRadar reflectivity/ lightning 1kmRadar radial wind - tested, RRv2 impNacelle/tower/sodar (future)
Rapid Refresh Hourly Cycle / Observations RUC/Rapid Refresh Hourly Assimilation Cycle
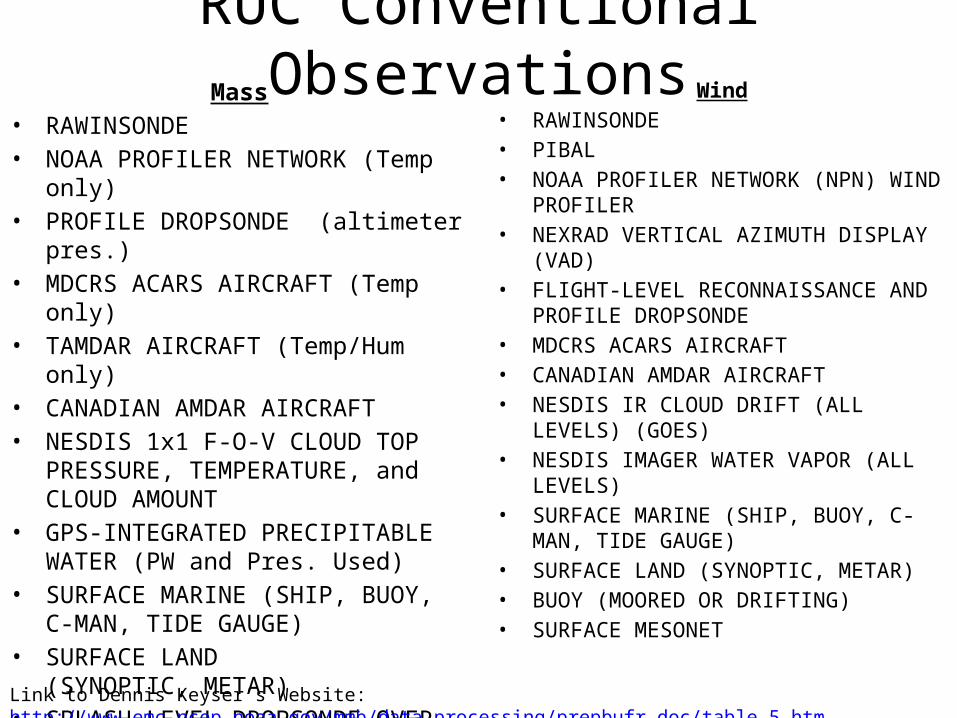
RUC Conventional ObservationsMass
• RAWINSONDE • NOAA PROFILER NETWORK (Temp only)• PROFILE DROPSONDE (altimeter pres.)• MDCRS ACARS AIRCRAFT (Temp only)• TAMDAR AIRCRAFT (Temp/Hum only)• CANADIAN AMDAR AIRCRAFT• NESDIS 1x1 F-O-V CLOUD TOP PRESSURE,
TEMPERATURE, and CLOUD AMOUNT• GPS-INTEGRATED PRECIPITABLE WATER
(PW and Pres. Used)• SURFACE MARINE (SHIP, BUOY, C-MAN,
TIDE GAUGE)• SURFACE LAND (SYNOPTIC, METAR)• SPLASH-LEVEL DROPSONDE OVER OCEAN • LAND (SYNOPTIC, METAR)• SURFACE MESONET
Wind• RAWINSONDE• PIBAL• NOAA PROFILER NETWORK (NPN) WIND
PROFILER • NEXRAD VERTICAL AZIMUTH DISPLAY (VAD)• FLIGHT-LEVEL RECONNAISSANCE AND PROFILE
DROPSONDE • MDCRS ACARS AIRCRAFT • CANADIAN AMDAR AIRCRAFT• NESDIS IR CLOUD DRIFT (ALL LEVELS) (GOES)• NESDIS IMAGER WATER VAPOR (ALL LEVELS) • SURFACE MARINE (SHIP, BUOY, C-MAN, TIDE
GAUGE)• SURFACE LAND (SYNOPTIC, METAR)• BUOY (MOORED OR DRIFTING) • SURFACE MESONET
Link to Dennis Keyser’s Website: http://www.emc.ncep.noaa.gov/mmb/data_processing/prepbufr.doc/table_5.htm
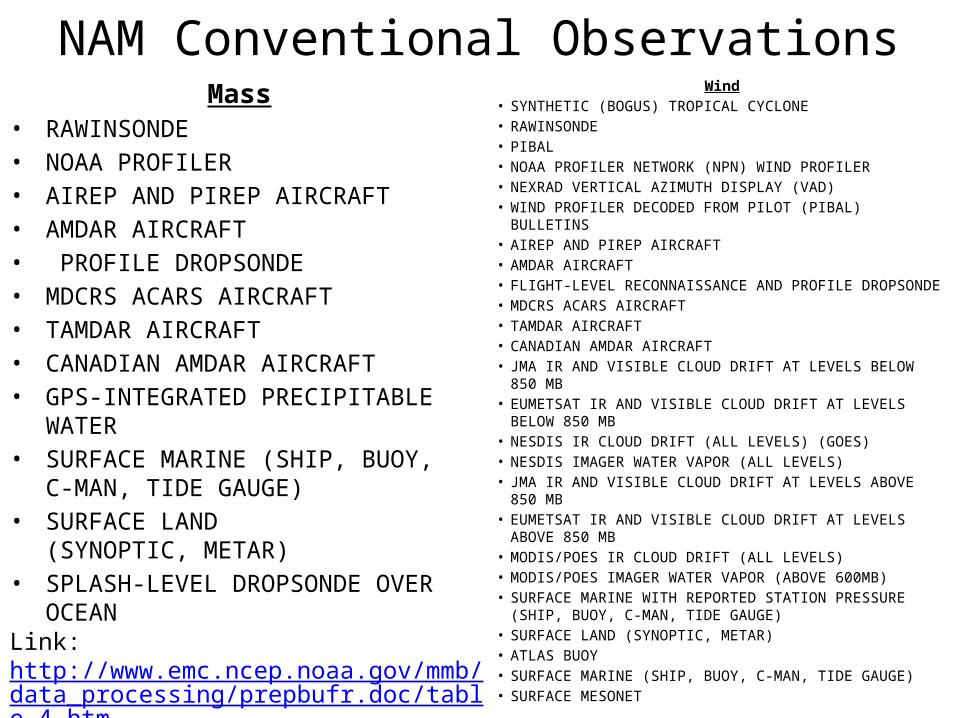
NAM Conventional ObservationsMass
• RAWINSONDE • NOAA PROFILER• AIREP AND PIREP AIRCRAFT• AMDAR AIRCRAFT • PROFILE DROPSONDE • MDCRS ACARS AIRCRAFT• TAMDAR AIRCRAFT• CANADIAN AMDAR AIRCRAFT• GPS-INTEGRATED PRECIPITABLE WATER• SURFACE MARINE (SHIP, BUOY, C-MAN,
TIDE GAUGE)• SURFACE LAND (SYNOPTIC, METAR)• SPLASH-LEVEL DROPSONDE OVER OCEAN
Wind• SYNTHETIC (BOGUS) TROPICAL CYCLONE• RAWINSONDE• PIBAL• NOAA PROFILER NETWORK (NPN) WIND PROFILER • NEXRAD VERTICAL AZIMUTH DISPLAY (VAD)• WIND PROFILER DECODED FROM PILOT (PIBAL) BULLETINS • AIREP AND PIREP AIRCRAFT • AMDAR AIRCRAFT• FLIGHT-LEVEL RECONNAISSANCE AND PROFILE DROPSONDE • MDCRS ACARS AIRCRAFT • TAMDAR AIRCRAFT • CANADIAN AMDAR AIRCRAFT• JMA IR AND VISIBLE CLOUD DRIFT AT LEVELS BELOW 850 MB • EUMETSAT IR AND VISIBLE CLOUD DRIFT AT LEVELS BELOW 850
MB • NESDIS IR CLOUD DRIFT (ALL LEVELS) (GOES)• NESDIS IMAGER WATER VAPOR (ALL LEVELS) • JMA IR AND VISIBLE CLOUD DRIFT AT LEVELS ABOVE 850 MB• EUMETSAT IR AND VISIBLE CLOUD DRIFT AT LEVELS ABOVE 850
MB• MODIS/POES IR CLOUD DRIFT (ALL LEVELS) • MODIS/POES IMAGER WATER VAPOR (ABOVE 600MB)• SURFACE MARINE WITH REPORTED STATION PRESSURE (SHIP,
BUOY, C-MAN, TIDE GAUGE)• SURFACE LAND (SYNOPTIC, METAR)• ATLAS BUOY• SURFACE MARINE (SHIP, BUOY, C-MAN, TIDE GAUGE)• SURFACE MESONET
Link: http://www.emc.ncep.noaa.gov/mmb/data_processing/prepbufr.doc/table_4.htm
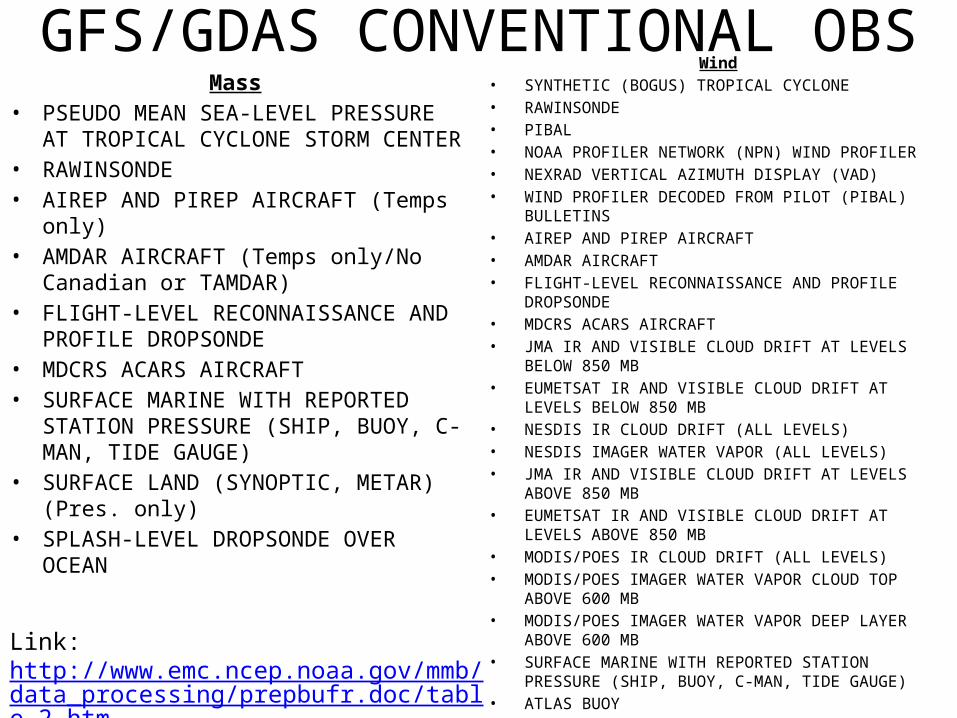
GFS/GDAS CONVENTIONAL OBSMass
• PSEUDO MEAN SEA-LEVEL PRESSURE AT TROPICAL CYCLONE STORM CENTER
• RAWINSONDE• AIREP AND PIREP AIRCRAFT (Temps only)• AMDAR AIRCRAFT (Temps only/No
Canadian or TAMDAR)• FLIGHT-LEVEL RECONNAISSANCE AND
PROFILE DROPSONDE• MDCRS ACARS AIRCRAFT• SURFACE MARINE WITH REPORTED
STATION PRESSURE (SHIP, BUOY, C-MAN, TIDE GAUGE)
• SURFACE LAND (SYNOPTIC, METAR) (Pres. only)
• SPLASH-LEVEL DROPSONDE OVER OCEAN
Wind• SYNTHETIC (BOGUS) TROPICAL CYCLONE• RAWINSONDE• PIBAL• NOAA PROFILER NETWORK (NPN) WIND PROFILER• NEXRAD VERTICAL AZIMUTH DISPLAY (VAD)• WIND PROFILER DECODED FROM PILOT (PIBAL) BULLETINS• AIREP AND PIREP AIRCRAFT• AMDAR AIRCRAFT• FLIGHT-LEVEL RECONNAISSANCE AND PROFILE DROPSONDE• MDCRS ACARS AIRCRAFT• JMA IR AND VISIBLE CLOUD DRIFT AT LEVELS BELOW 850 MB• EUMETSAT IR AND VISIBLE CLOUD DRIFT AT LEVELS BELOW 850
MB• NESDIS IR CLOUD DRIFT (ALL LEVELS)• NESDIS IMAGER WATER VAPOR (ALL LEVELS)• JMA IR AND VISIBLE CLOUD DRIFT AT LEVELS ABOVE 850 MB• EUMETSAT IR AND VISIBLE CLOUD DRIFT AT LEVELS ABOVE 850
MB• MODIS/POES IR CLOUD DRIFT (ALL LEVELS)• MODIS/POES IMAGER WATER VAPOR CLOUD TOP ABOVE 600 MB• MODIS/POES IMAGER WATER VAPOR DEEP LAYER ABOVE 600 MB• SURFACE MARINE WITH REPORTED STATION PRESSURE (SHIP,
BUOY, C-MAN, TIDE GAUGE)• ATLAS BUOY• SUPEROBED (1.0 DEGREE LAT/LON) SCATTEROMETER WINDS
OVER OCEAN (WINDSAT)• NON-SUPEROBED SCATTEROMETER WINDS OVER OCEAN
(ASCAT)
Link: http://www.emc.ncep.noaa.gov/mmb/data_processing/prepbufr.doc/table_2.htm
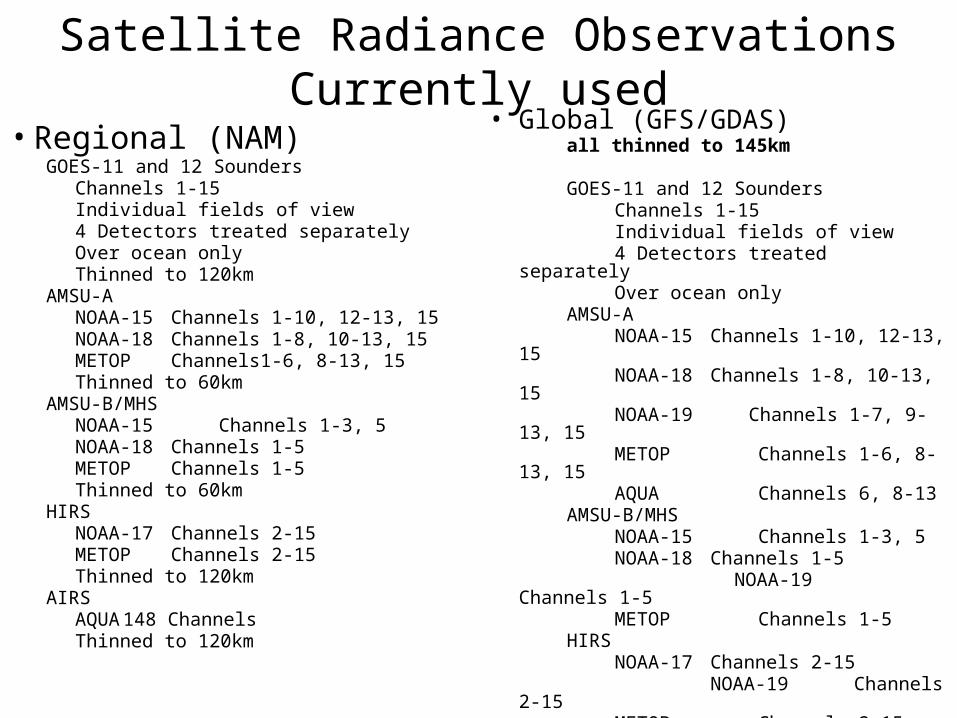
Satellite Radiance Observations Currently used
• Regional (NAM)GOES-11 and 12 Sounders
Channels 1-15Individual fields of view 4 Detectors treated separatelyOver ocean onlyThinned to 120km
AMSU-ANOAA-15 Channels 1-10, 12-13, 15NOAA-18 Channels 1-8, 10-13, 15METOP Channels1-6, 8-13, 15Thinned to 60km
AMSU-B/MHSNOAA-15 Channels 1-3, 5NOAA-18 Channels 1-5METOP Channels 1-5Thinned to 60km
HIRSNOAA-17 Channels 2-15METOP Channels 2-15Thinned to 120km
AIRSAQUA 148 ChannelsThinned to 120km
• Global (GFS/GDAS)all thinned to 145km
GOES-11 and 12 Sounders
Channels 1-15Individual fields of view 4 Detectors treated separatelyOver ocean only
AMSU-ANOAA-15 Channels 1-10, 12-
13, 15NOAA-18 Channels 1-8, 10-
13, 15NOAA-19 Channels 1-7, 9-13,
15METOP Channels 1-6, 8-
13, 15AQUA Channels 6, 8-13
AMSU-B/MHSNOAA-15 Channels 1-3, 5NOAA-18 Channels 1-5
NOAA-19 Channels 1-5METOP
Channels 1-5HIRS
NOAA-17 Channels 2-15
NOAA-19 Channels 2-15METOP
Channels 2-15AIRS
AQUA 148 Channels
IASIMETOP 165 Channels
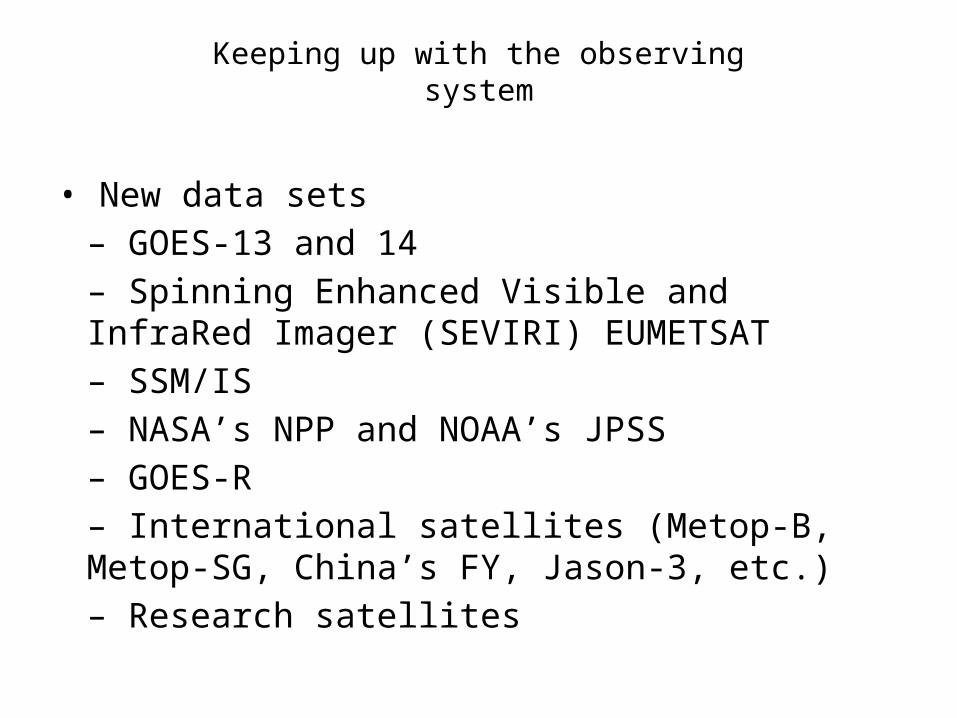
Keeping up with the observingsystem
• New data sets– GOES-13 and 14– Spinning Enhanced Visible and InfraRed Imager (SEVIRI) EUMETSAT– SSM/IS– NASA’s NPP and NOAA’s JPSS– GOES-R– International satellites (Metop-B, Metop-SG, China’s FY, Jason-3, etc.)– Research satellites
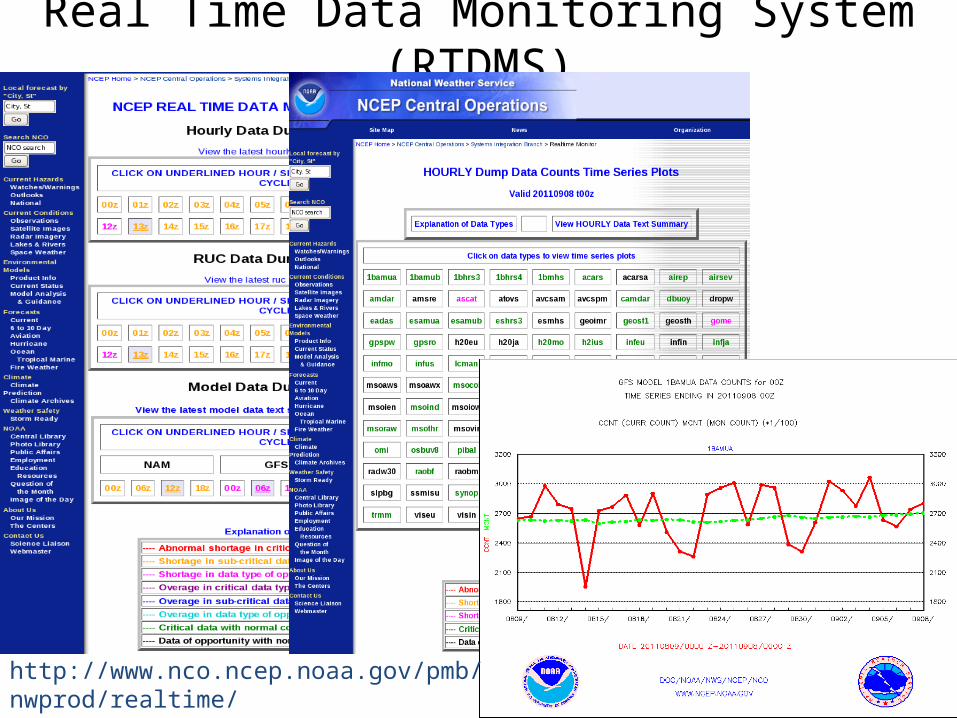
Real Time Data Monitoring System (RTDMS)
http://www.nco.ncep.noaa.gov/pmb/nwprod/realtime/
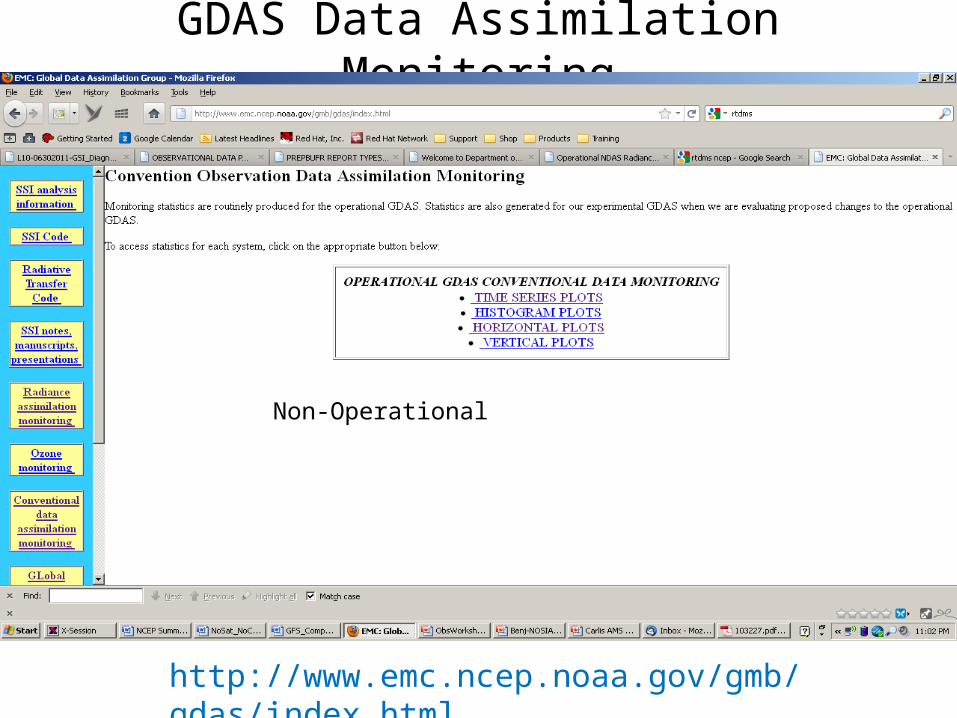
GDAS Data Assimilation Monitoring
http://www.emc.ncep.noaa.gov/gmb/gdas/index.html
Non-Operational
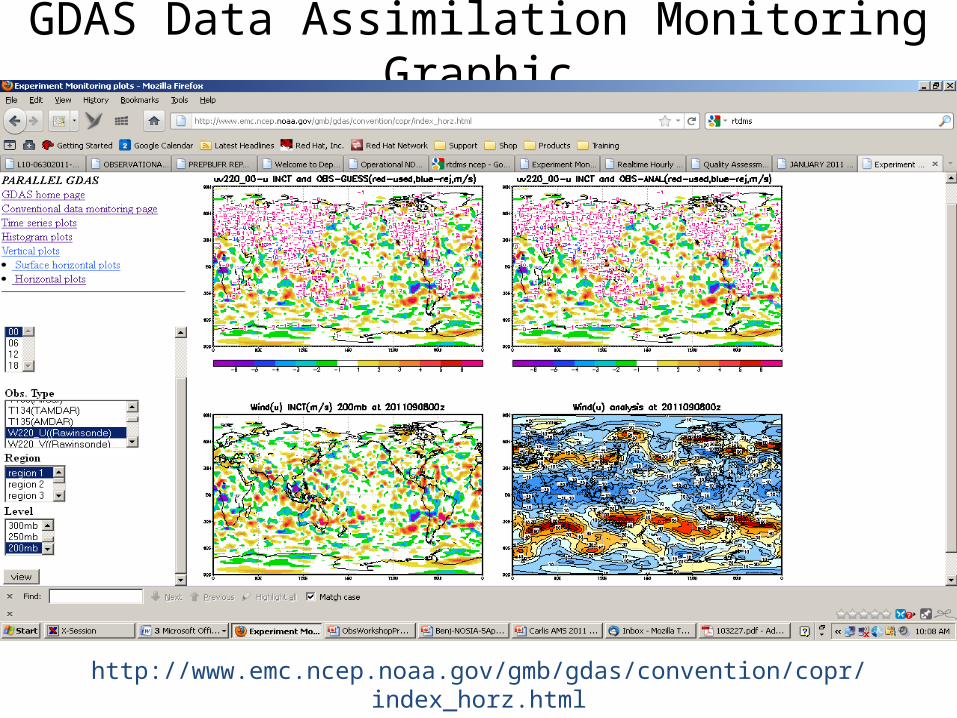
GDAS Data Assimilation Monitoring Graphic
http://www.emc.ncep.noaa.gov/gmb/gdas/convention/copr/index_horz.html
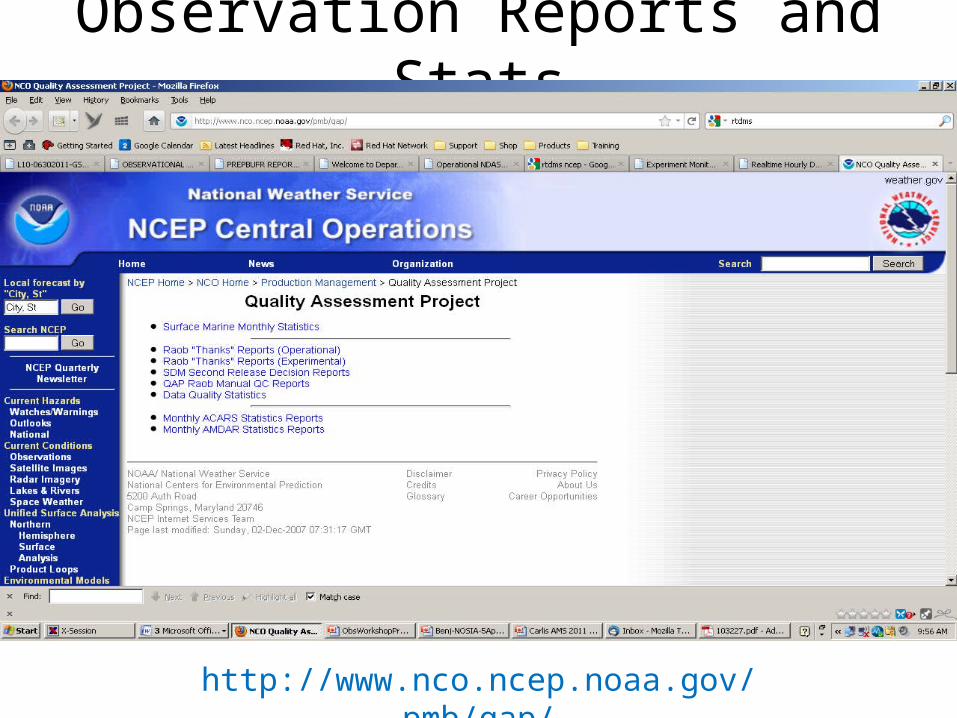
Observation Reports and Stats
http://www.nco.ncep.noaa.gov/pmb/qap/
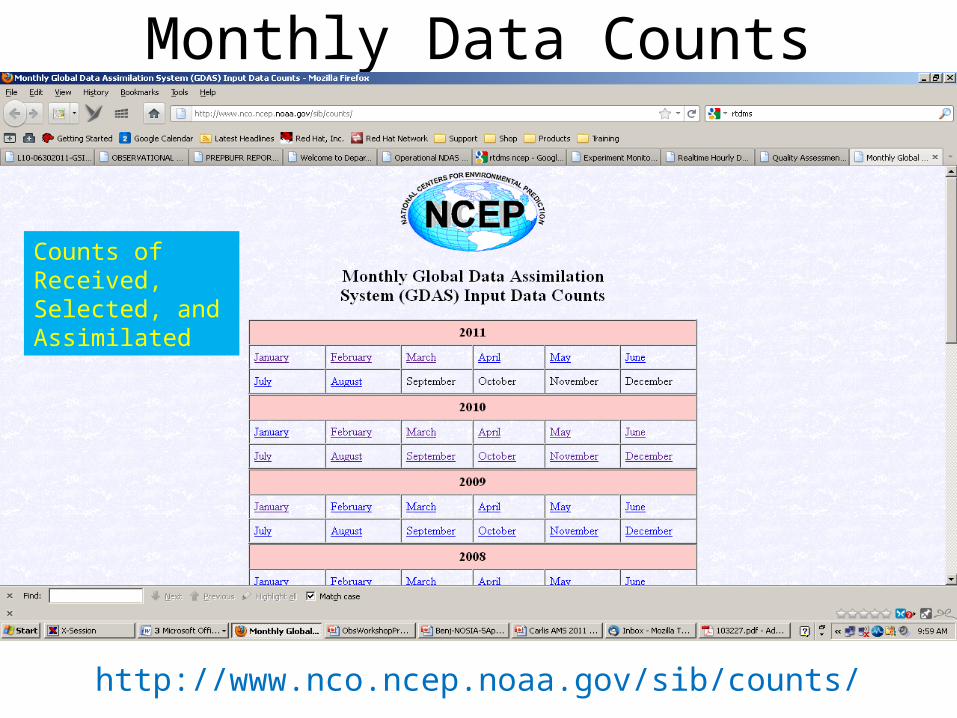
Monthly Data Counts
http://www.nco.ncep.noaa.gov/sib/counts/
Counts of Received, Selected, and Assimilated
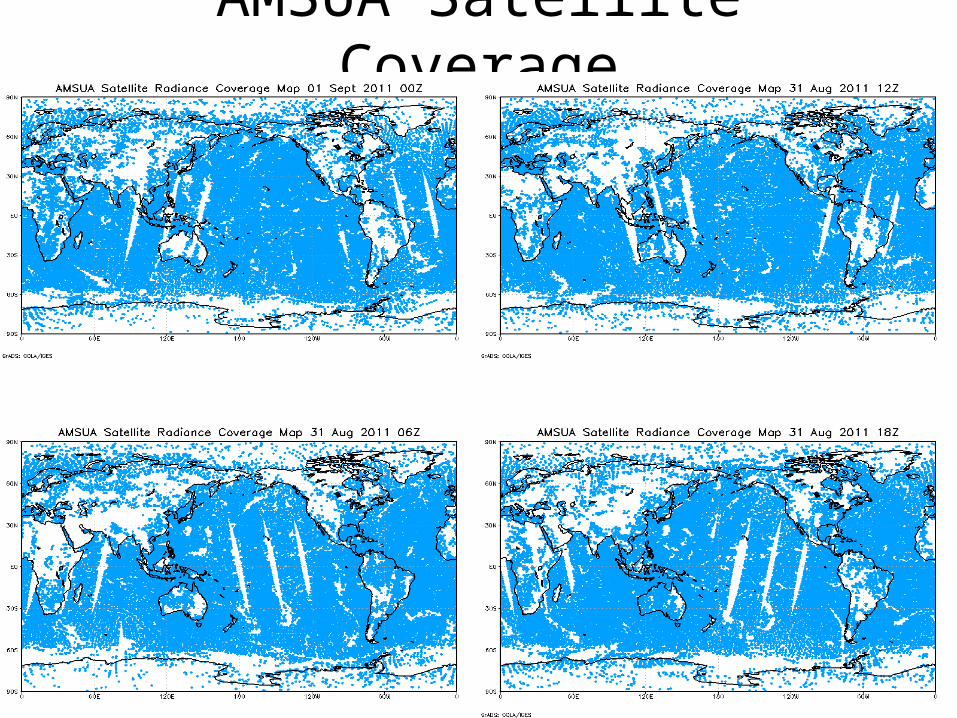
AMSUA Satellite Coverage
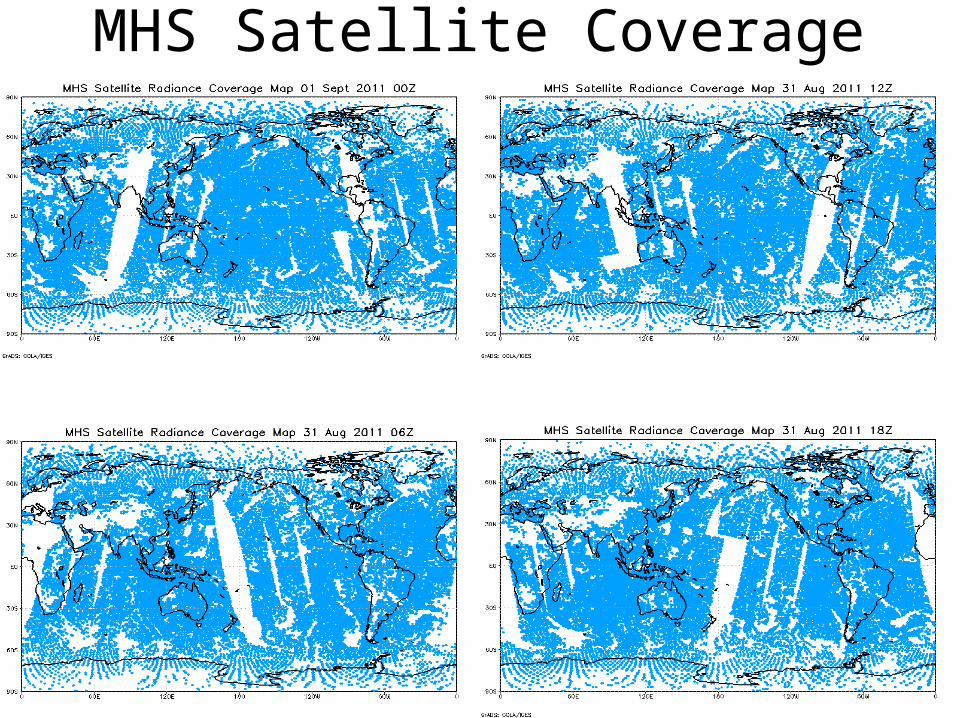
MHS Satellite Coverage
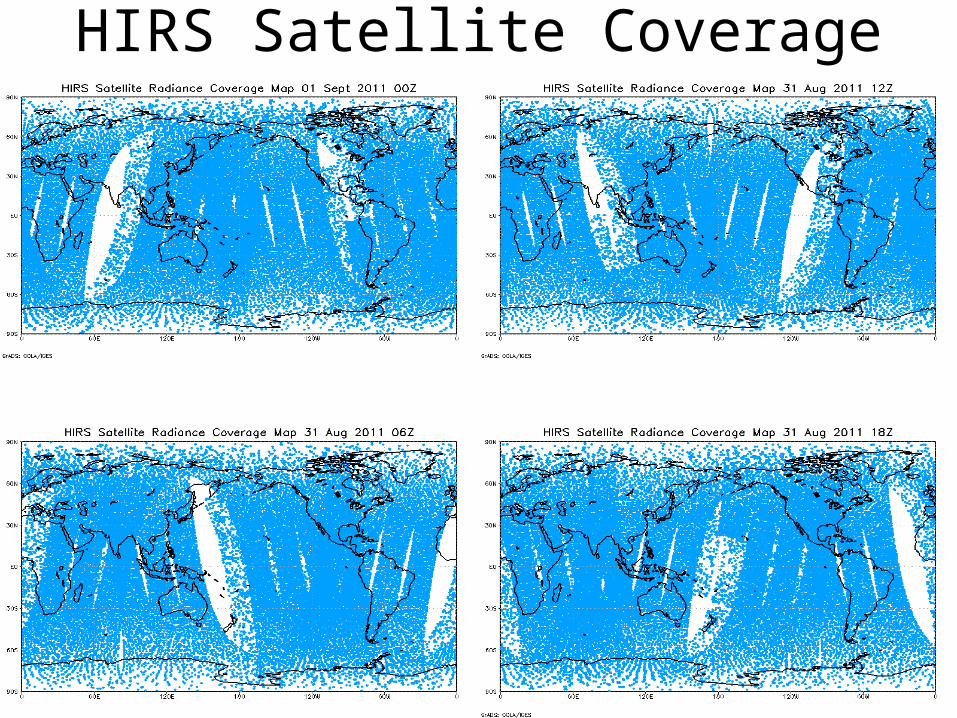
HIRS Satellite Coverage
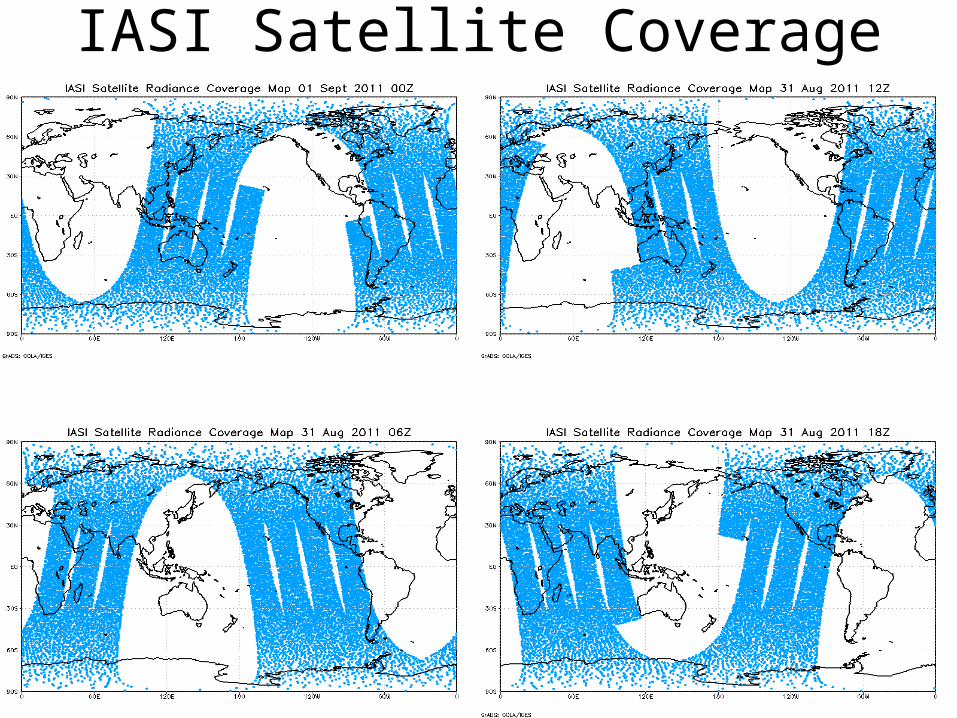
IASI Satellite Coverage
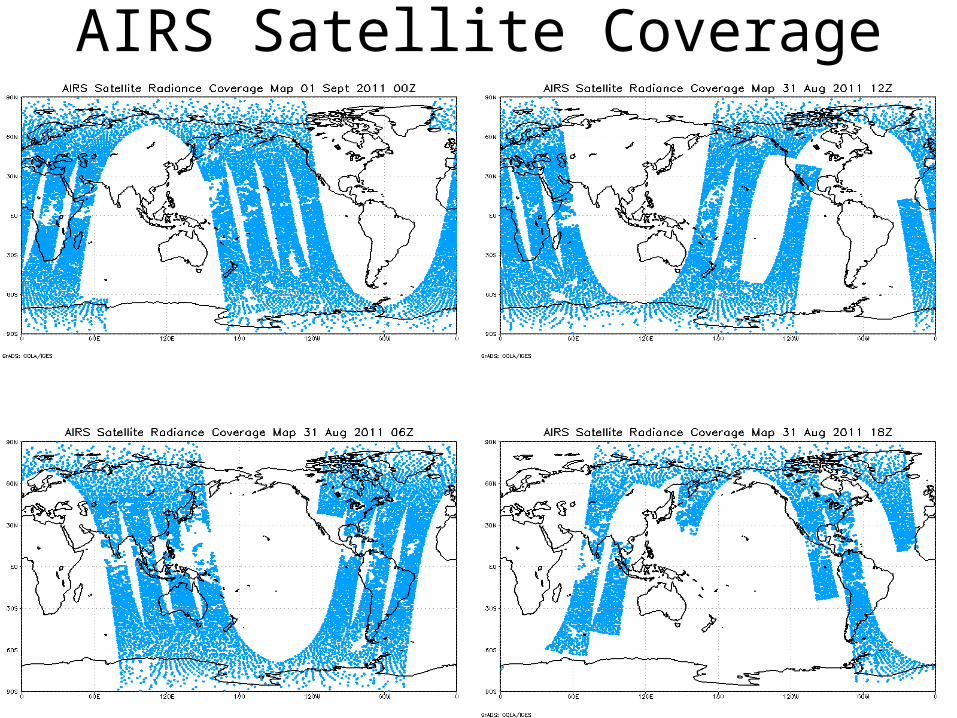
AIRS Satellite Coverage

NCEP Satellite Radiance Coverage
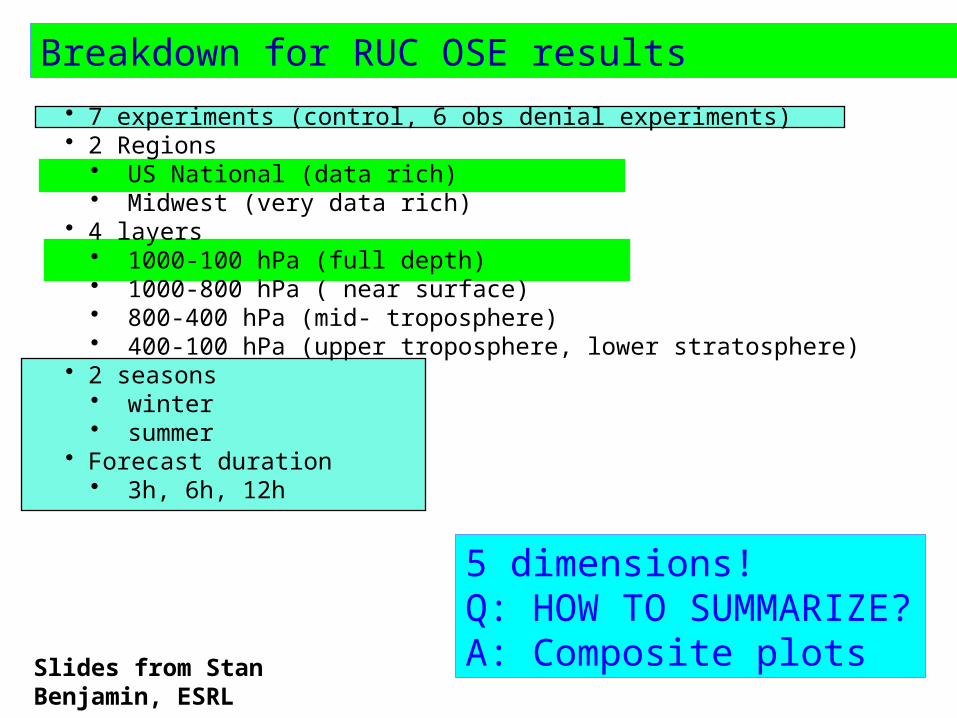
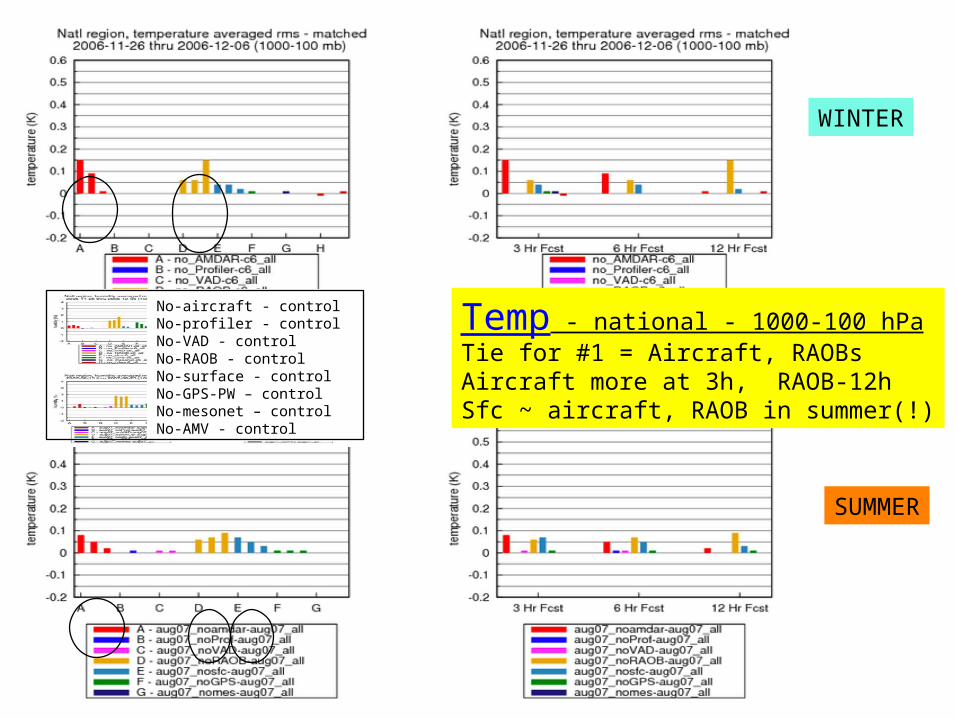
Breakdown for RUC OSE results
• 7 experiments (control, 6 obs denial experiments)• 2 Regions
• US National (data rich)• Midwest (very data rich)
• 4 layers• 1000-100 hPa (full depth)• 1000-800 hPa ( near surface)• 800-400 hPa (mid- troposphere)• 400-100 hPa (upper troposphere, lower stratosphere)
• 2 seasons• winter• summer
• Forecast duration• 3h, 6h, 12h
5 dimensions!Q: HOW TO SUMMARIZE?A: Composite plots
Slides from Stan Benjamin, ESRL
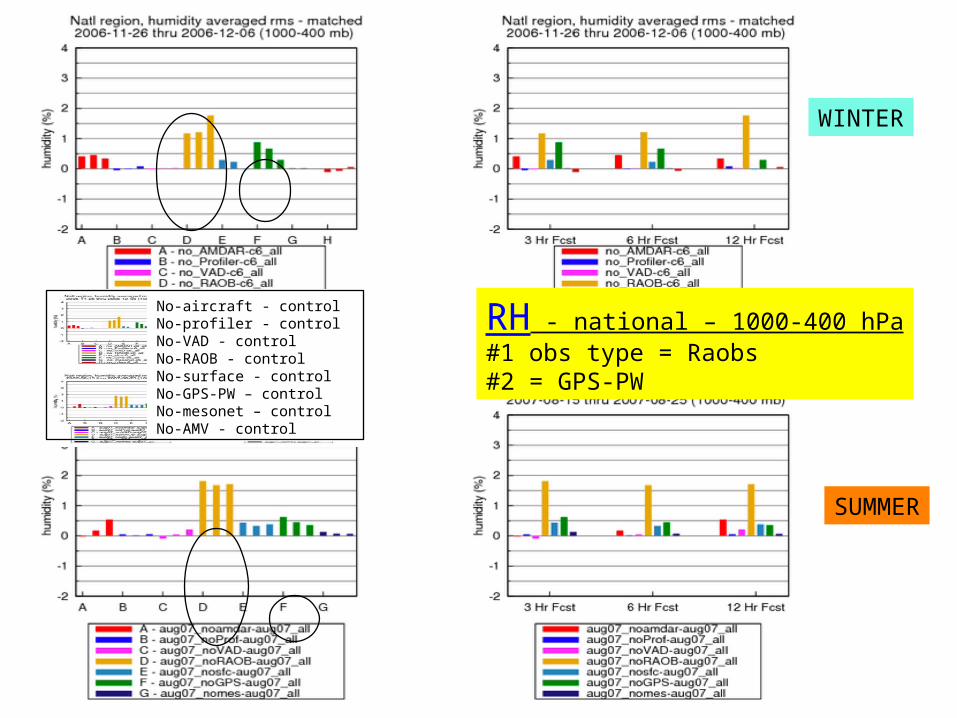
WINTER
SUMMER
RH - national – 1000-400 hPa#1 obs type = Raobs#2 = GPS-PW
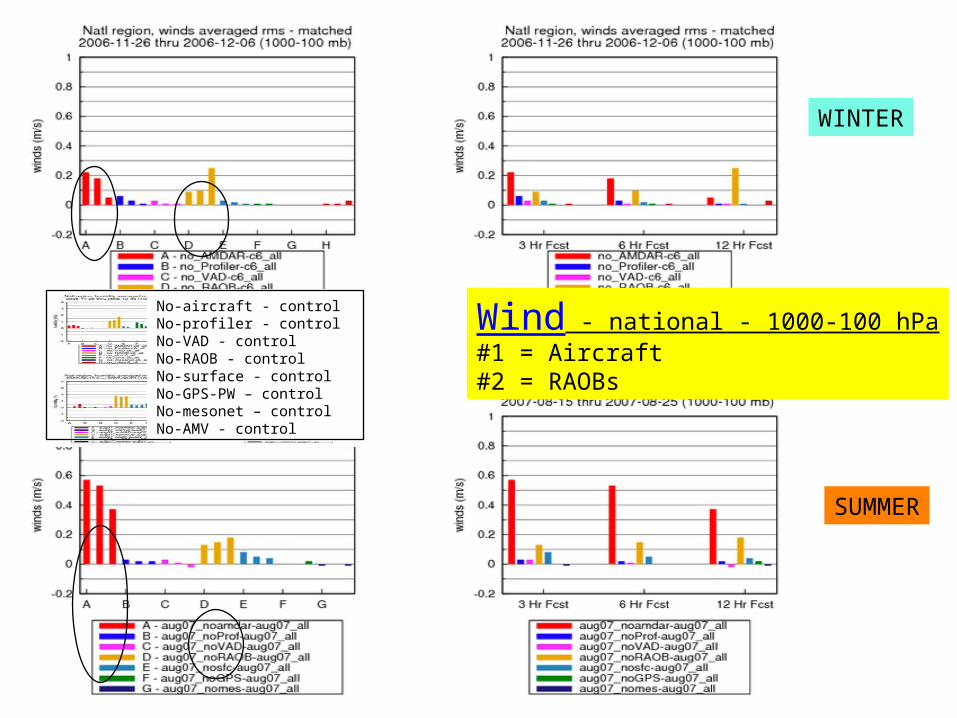
No-aircraft - controlNo-profiler - controlNo-VAD - controlNo-RAOB - controlNo-surface - controlNo-GPS-PW – controlNo-mesonet – controlNo-AMV - control
WINTER
SUMMER
Temp - national - 1000-100 hPaTie for #1 = Aircraft, RAOBsAircraft more at 3h, RAOB-12hSfc ~ aircraft, RAOB in summer(!)
No-aircraft - controlNo-profiler - controlNo-VAD - controlNo-RAOB - controlNo-surface - controlNo-GPS-PW – controlNo-mesonet – controlNo-AMV - control
WINTER
SUMMER
Wind - national - 1000-100 hPa#1 = Aircraft#2 = RAOBs
No-aircraft - controlNo-profiler - controlNo-VAD - controlNo-RAOB - controlNo-surface - controlNo-GPS-PW – controlNo-mesonet – controlNo-AMV - control
Analysis
Verifying Analysis
Background
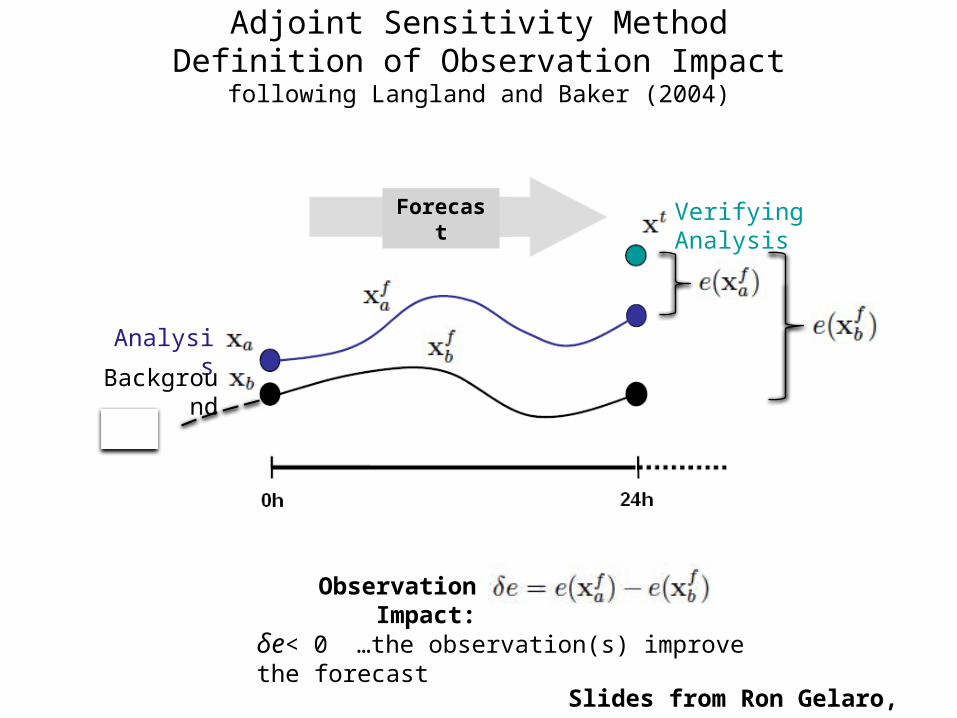
Adjoint Sensitivity MethodDefinition of Observation Impact
following Langland and Baker (2004)
Forecast
Observation Impact:
δe< 0 …the observation(s) improve the forecast
Slides from Ron Gelaro, NASA/GMAO
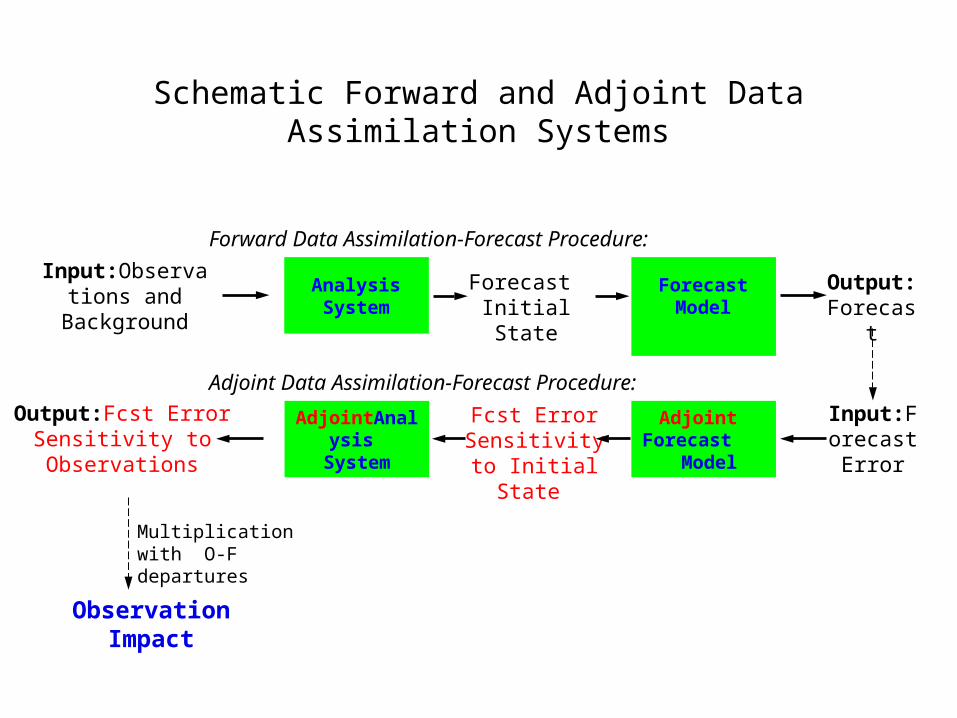
Schematic Forward and Adjoint Data Assimilation Systems
Forward Data Assimilation-Forecast Procedure:
Analysis System invisible
Forecast Modelinvisible
Input:Observations and Background
Forecast Initial State
Output:Forecast
Analysis System
Forecast Model
AdjointAnalysis System
Adjoint Forecast
Model
Output:Fcst Error Sensitivity to Observations
Fcst Error Sensitivity to Initial State
Input:Forecast Error
Adjoint Data Assimilation-Forecast Procedure:
Observation Impact
Multiplication with O-F departures
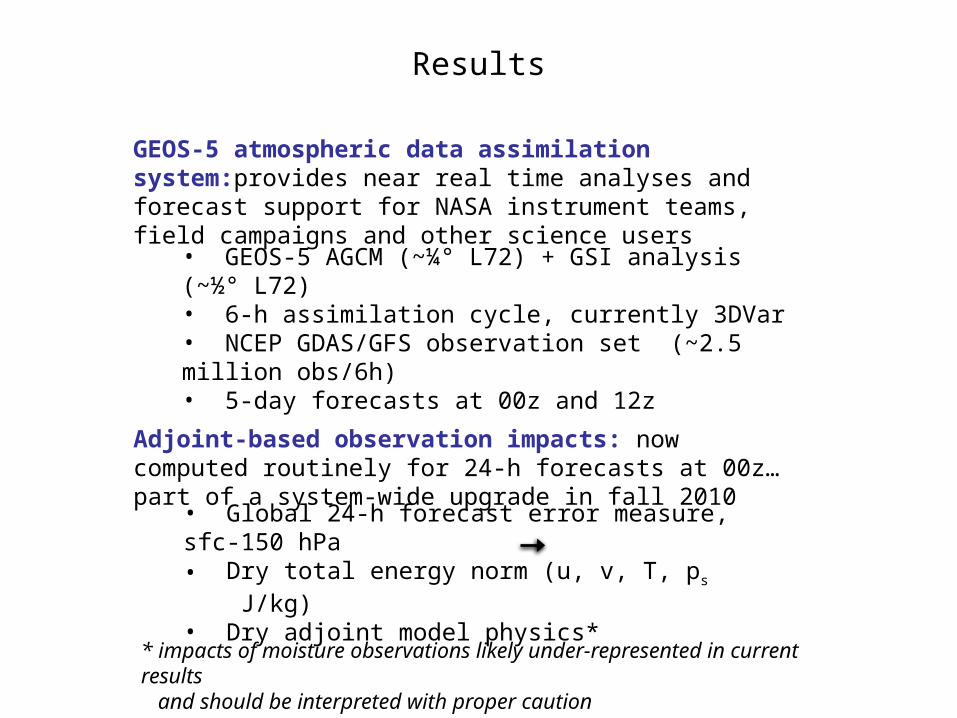
GEOS-5 atmospheric data assimilation system:provides near real time analyses and forecast support for NASA instrument teams, field campaigns and other science users
• GEOS-5 AGCM (~¼° L72) + GSI analysis (~½° L72)• 6-h assimilation cycle, currently 3DVar• NCEP GDAS/GFS observation set (~2.5 million obs/6h)• 5-day forecasts at 00z and 12z
Adjoint-based observation impacts: now computed routinely for 24-h forecasts at 00z…part of a system-wide upgrade in fall 2010
Results
• Global 24-h forecast error measure, sfc-150 hPa• Dry total energy norm (u, v, T, ps J/kg) • Dry adjoint model physics*
* impacts of moisture observations likely under-represented in current results and should be interpreted with proper caution
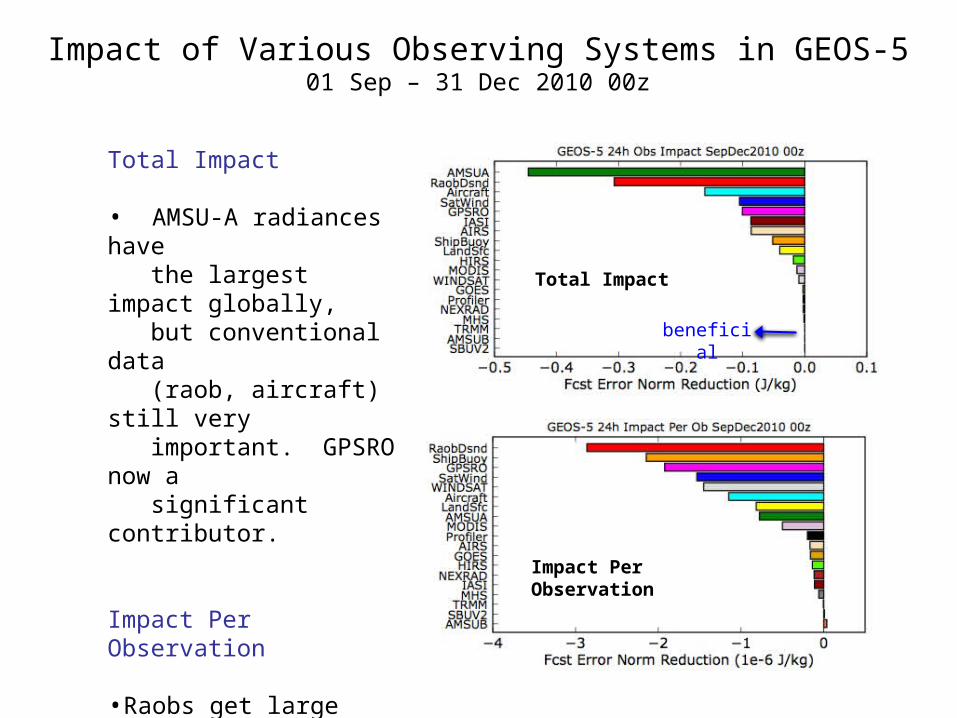
Total Impact
beneficial
Total Impact
• AMSU-A radiances have the largest impact globally, but conventional data (raob, aircraft) still very important. GPSRO now a significant contributor.
Impact Per Observation
•Raobs get large weight in the analysis and have large IPO. Ship obs are few, but are located where there are few other in-situ data.
Impact of Various Observing Systems in GEOS-501 Sep – 31 Dec 2010 00z
Impact Per Observation
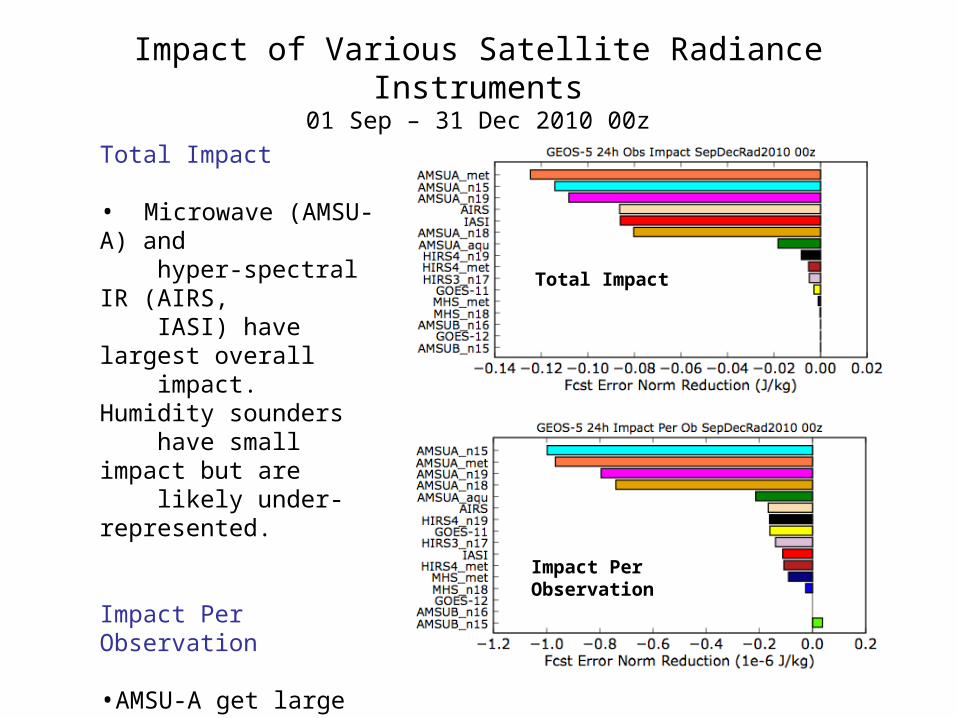
Total Impact
Total Impact
• Microwave (AMSU-A) and hyper-spectral IR (AIRS, IASI) have largest overall impact. Humidity sounders have small impact but are likely under-represented.
Impact Per Observation
•AMSU-A get large weight in the analysis and have large IPO. IASI and AIRS get less weight and are numerous, so IPO is smaller.
Impact of Various Satellite Radiance Instruments01 Sep – 31 Dec 2010 00z
Impact Per Observation
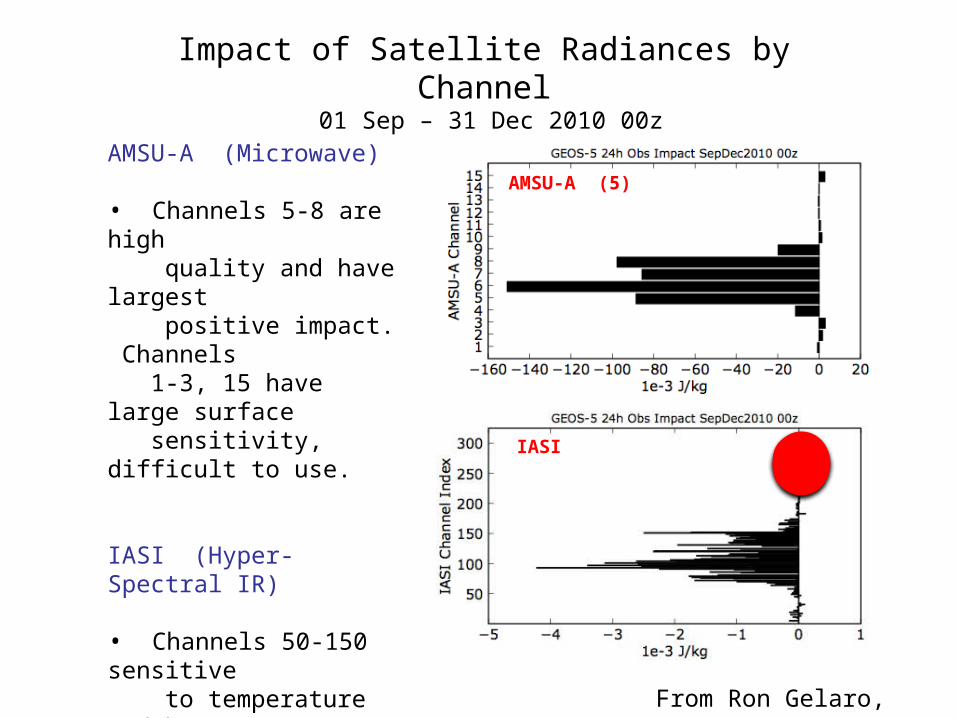
AMSU-A (5)
IASI
Impact of Satellite Radiances by Channel 01 Sep – 31 Dec 2010 00z
AMSU-A (Microwave)
• Channels 5-8 are high quality and have largest positive impact. Channels 1-3, 15 have large surface sensitivity, difficult to use.
IASI (Hyper-Spectral IR)
• Channels 50-150 sensitive to temperature and have significant positive impact. Channels 250-300 sensitive to ozone and water vapor, difficult to use.
From Ron Gelaro, NASA
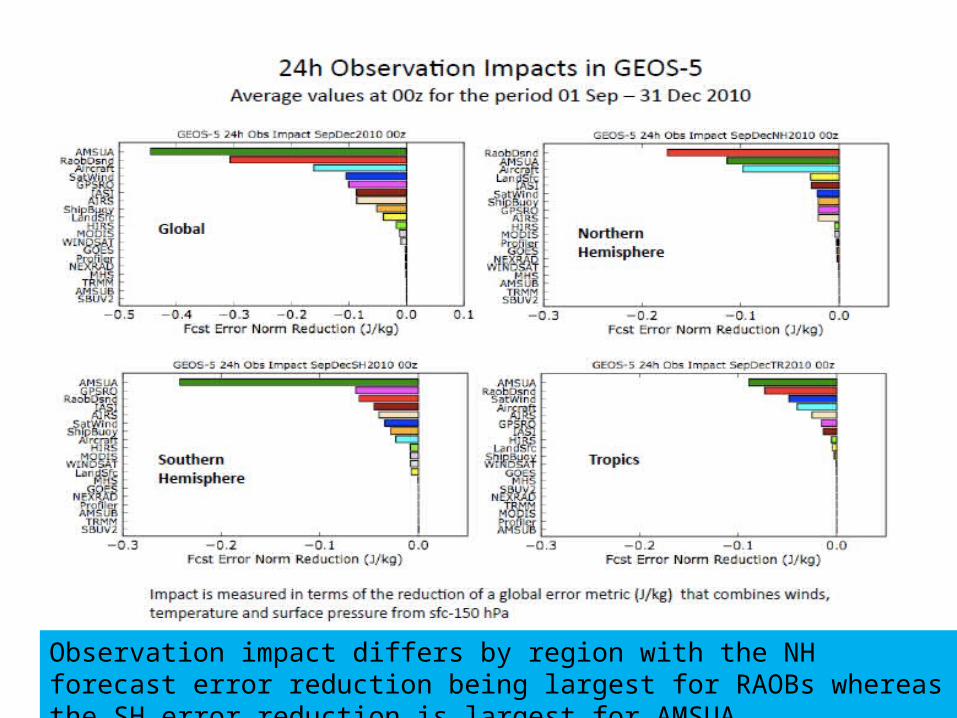
Observation impact differs by region with the NH forecast error reduction being largest for RAOBs whereas the SH error reduction is largest for AMSUA.
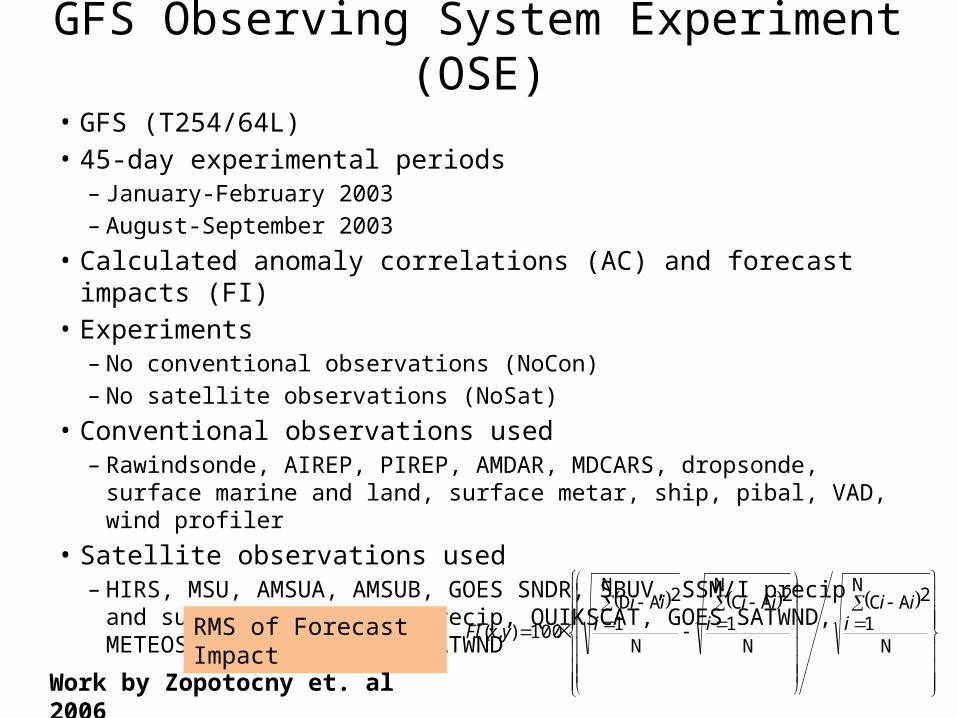
GFS Observing System Experiment (OSE)• GFS (T254/64L)• 45-day experimental periods
– January-February 2003 – August-September 2003
• Calculated anomaly correlations (AC) and forecast impacts (FI)• Experiments
– No conventional observations (NoCon)– No satellite observations (NoSat)
• Conventional observations used– Rawindsonde, AIREP, PIREP, AMDAR, MDCARS, dropsonde, surface
marine and land, surface metar, ship, pibal, VAD, wind profiler• Satellite observations used
– HIRS, MSU, AMSUA, AMSUB, GOES SNDR, SBUV, SSM/I precip and surface wind, TRMM precip, QUIKSCAT, GOES SATWND, METEOSAT SATWND, GMS-5 SATWND
N
N
1AC 2
N
N
1AC 2
N
N
1AD 2
100),( iii
iii
iii
yxFIRMS of Forecast Impact
Work by Zopotocny et. al 2006
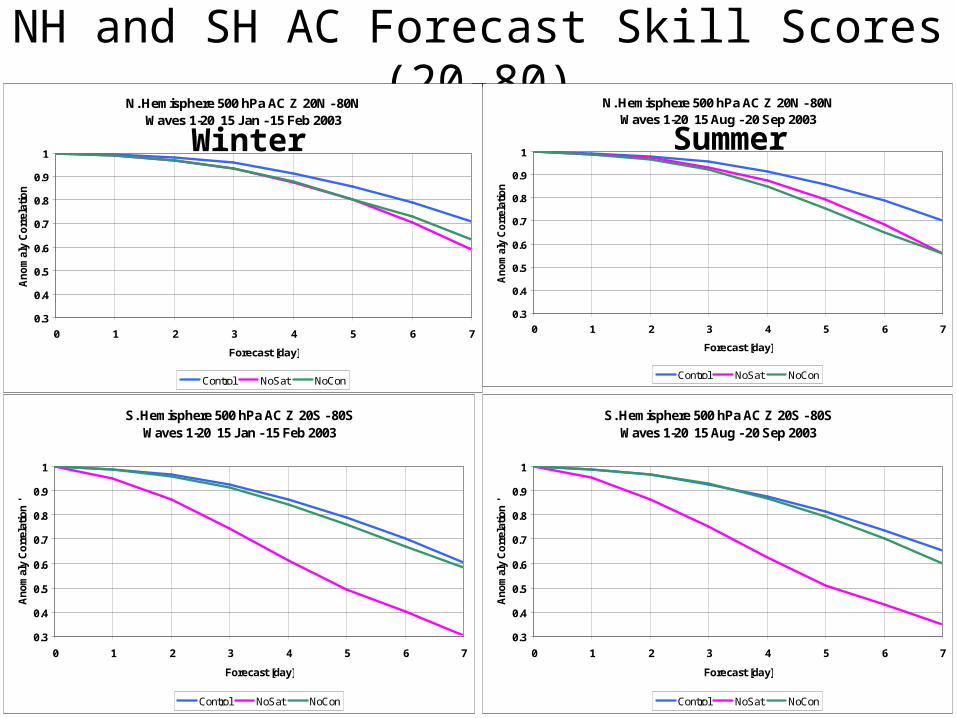
NH and SH AC Forecast Skill Scores (20-80)N. Hemisphere 500 hPa AC Z 20N - 80N
Waves 1-20 15 Jan - 15 Feb 2003
0.3
0.4
0.5
0.6
0.7
0.8
0.9
1
0 1 2 3 4 5 6 7
Forecast [day]
An
om
aly
Co
rrel
atio
n '
Control NoSat NoCon
N. Hemisphere 500 hPa AC Z 20N - 80NWaves 1-20 15 Aug - 20 Sep 2003
0.3
0.4
0.5
0.6
0.7
0.8
0.9
1
0 1 2 3 4 5 6 7
Forecast [day]
An
om
aly
Co
rrel
atio
n '
Control NoSat NoCon
S. Hemisphere 500 hPa AC Z 20S - 80SWaves 1-20 15 Jan - 15 Feb 2003
0.3
0.4
0.5
0.6
0.7
0.8
0.9
1
0 1 2 3 4 5 6 7
Forecast [day]
An
om
aly
Co
rrel
atio
n '
Control NoSat NoCon
S. Hemisphere 500 hPa AC Z 20S - 80SWaves 1-20 15 Aug - 20 Sep 2003
0.3
0.4
0.5
0.6
0.7
0.8
0.9
1
0 1 2 3 4 5 6 7
Forecast [day]
An
om
aly
Co
rrel
atio
n '
Control NoSat NoCon
Winter Summer
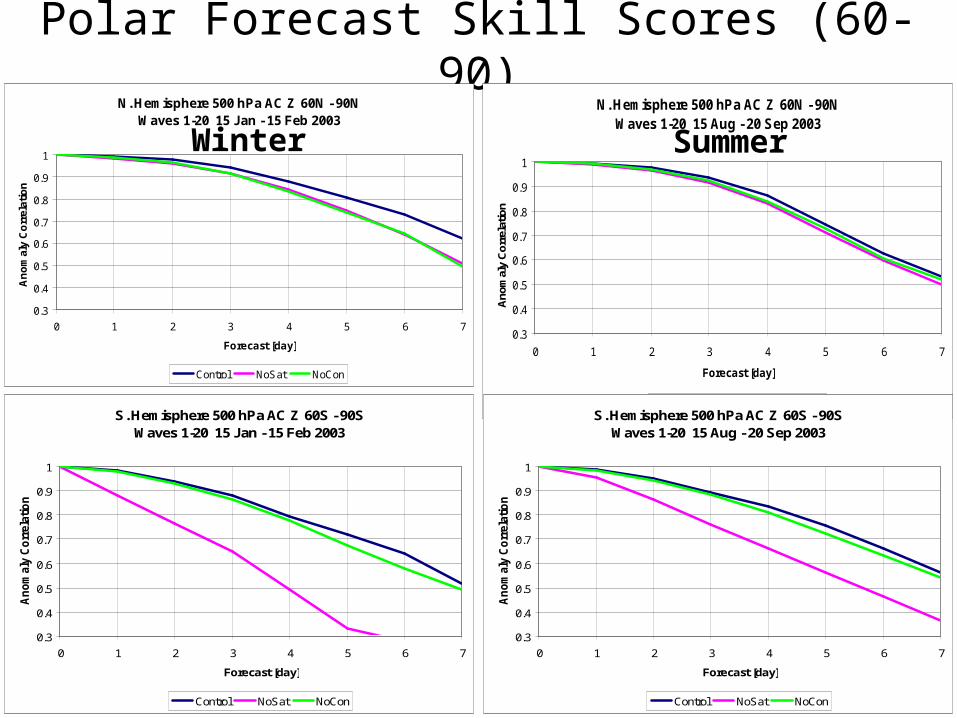
Polar Forecast Skill Scores (60-90)N. Hemisphere 500 hPa AC Z 60N - 90N
Waves 1-20 15 Jan - 15 Feb 2003
0.3
0.4
0.5
0.6
0.7
0.8
0.9
1
0 1 2 3 4 5 6 7
Forecast [day]
An
om
aly
Co
rrel
atio
n
Control NoSat NoCon
N. Hemisphere 500 hPa AC Z 60N - 90N Waves 1-20 15 Aug - 20 Sep 2003
0.3
0.4
0.5
0.6
0.7
0.8
0.9
1
0 1 2 3 4 5 6 7
Forecast [day]
Ano
mal
y C
orre
latio
n
Control NoSat NoConS. Hemisphere 500 hPa AC Z 60S - 90S
Waves 1-20 15 Jan - 15 Feb 2003
0.3
0.4
0.5
0.6
0.7
0.8
0.9
1
0 1 2 3 4 5 6 7
Forecast [day]
An
om
aly
Co
rrel
atio
n '
Control NoSat NoCon
S. Hemisphere 500 hPa AC Z 60S - 90SWaves 1-20 15 Aug - 20 Sep 2003
0.3
0.4
0.5
0.6
0.7
0.8
0.9
1
0 1 2 3 4 5 6 7
Forecast [day]
An
om
aly
Co
rrel
atio
n '
Control NoSat NoCon
Winter Summer
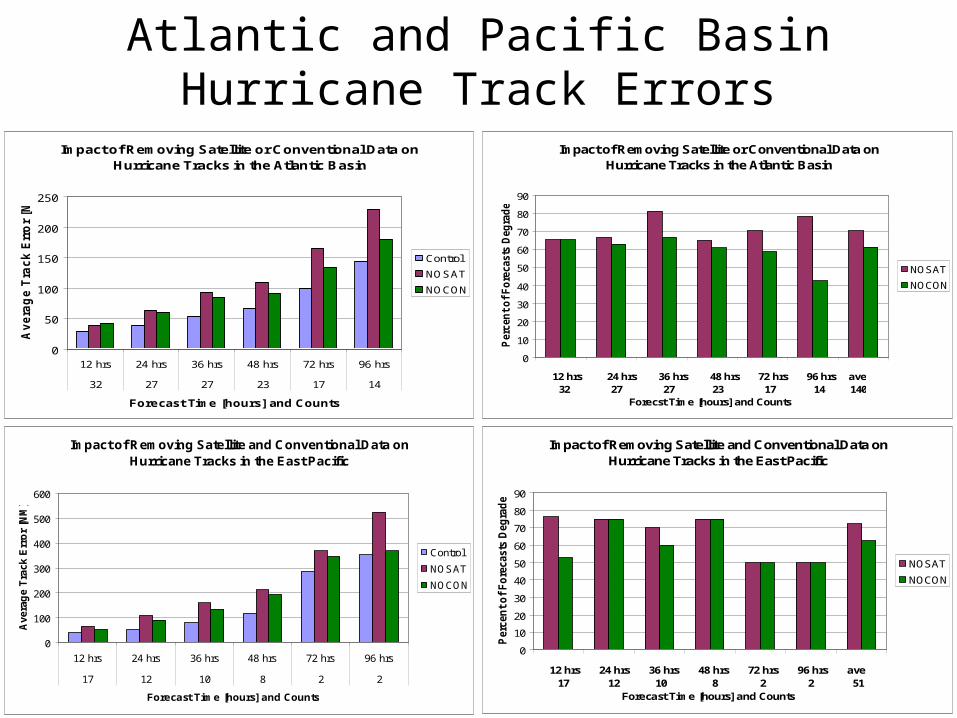
Atlantic and Pacific Basin Hurricane Track Errors
Impact of Removing Satellite or Conventional Data on Hurricane Tracks in the Atlantic Basin
0
50
100
150
200
250
12 hrs 24 hrs 36 hrs 48 hrs 72 hrs 96 hrs
32 27 27 23 17 14
Forecast Time [hours] and Counts
Av
era
ge
Tra
ck
Err
or
[NM
]
Control
NOSAT
NOCON
Impact of Removing Satellite or Conventional Data on Hurricane Tracks in the Atlantic Basin
0
10
20
30
40
50
60
70
80
90
12 hrs 24 hrs 36 hrs 48 hrs 72 hrs 96 hrs ave 32 27 27 23 17 14 140
Forecst Time [hours] and Counts
Perc
en
t o
f F
ore
casts
Deg
rad
ed
'
NOSAT
NOCON
Impact of Removing Satellite and Conventional Data on Hurricane Tracks in the East Pacific
0
100
200
300
400
500
600
12 hrs 24 hrs 36 hrs 48 hrs 72 hrs 96 hrs
17 12 10 8 2 2
Forecast Time [hours] and Counts
Avera
ge T
rack E
rro
r [N
M]
Control
NOSAT
NOCON
Impact of Removing Satellite and Conventional Data on Hurricane Tracks in the East Pacific
0
10
20
30
40
50
60
70
80
90
12 hrs 24 hrs 36 hrs 48 hrs 72 hrs 96 hrs ave 17 12 10 8 2 2 51
Forecast Time [hours] and Counts
Perc
en
t o
f F
ore
casts
Deg
rad
ed
'
NOSAT
NOCON
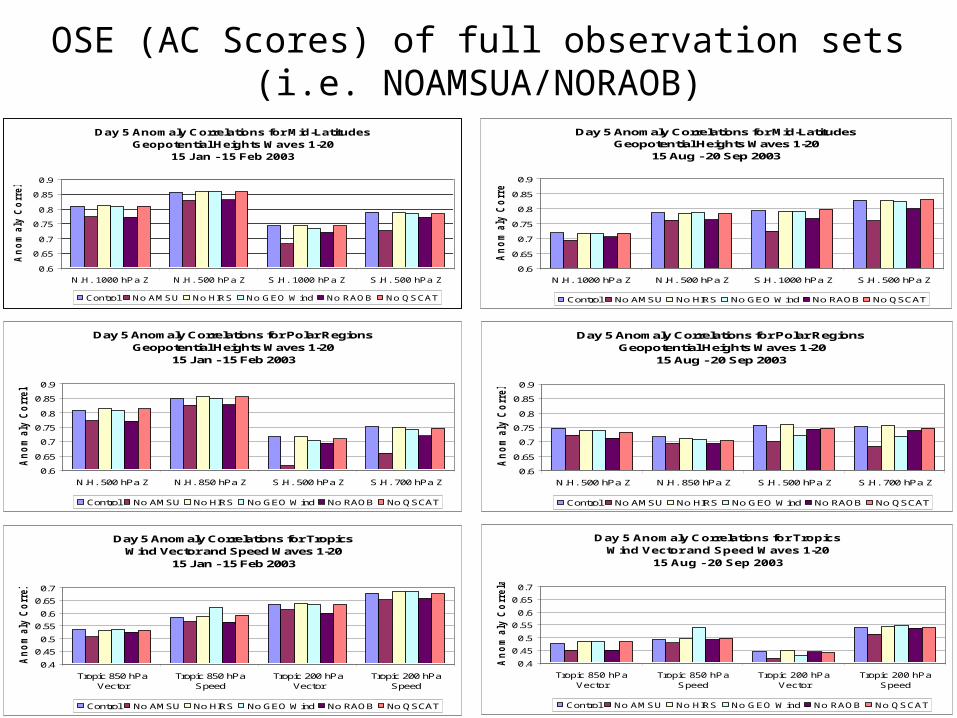
OSE (AC Scores) of full observation sets(i.e. NOAMSUA/NORAOB)
Day 5 Anomaly Correlations for Polar Regions Geopotential Heights Waves 1-20
15 Jan - 15 Feb 2003
0.6
0.65
0.7
0.75
0.8
0.85
0.9
N.H. 500 hPa Z N.H. 850 hPa Z S.H. 500 hPa Z S.H. 700 hPa Z
An
om
aly
Co
rrela
tio
n
'
Control No AMSU No HIRS No GEO Wind No RAOB No QSCAT
Day 5 Anomaly Correlations for TropicsWind Vector and Speed Waves 1-20
15 Jan - 15 Feb 2003
0.4
0.45
0.5
0.55
0.6
0.65
0.7
Tropic 850 hPaVector
Tropic 850 hPaSpeed
Tropic 200 hPaVector
Tropic 200 hPaSpeed
An
om
aly
Co
rrela
tio
n '
Control No AMSU No HIRS No GEO Wind No RAOB No QSCAT
Day 5 Anomaly Correlations for Mid-LatitudesGeopotential Heights Waves 1-20
15 Aug - 20 Sep 2003
0.6
0.65
0.7
0.75
0.8
0.85
0.9
N.H. 1000 hPa Z N.H. 500 hPa Z S.H. 1000 hPa Z S.H. 500 hPa Z
An
om
aly
Co
rrela
tio
n '
Control No AMSU No HIRS No GEO Wind No RAOB No QSCAT
Day 5 Anomaly Correlations for Polar Regions Geopotential Heights Waves 1-20
15 Aug - 20 Sep 2003
0.6
0.65
0.7
0.75
0.8
0.85
0.9
N.H. 500 hPa Z N.H. 850 hPa Z S.H. 500 hPa Z S.H. 700 hPa Z
An
om
aly
Co
rrela
tio
n
'Control No AMSU No HIRS No GEO Wind No RAOB No QSCAT
Day 5 Anomaly Correlations for TropicsWind Vector and Speed Waves 1-20
15 Aug - 20 Sep 2003
0.4
0.45
0.5
0.55
0.6
0.65
0.7
Tropic 850 hPaVector
Tropic 850 hPaSpeed
Tropic 200 hPaVector
Tropic 200 hPaSpeed
An
om
aly
Co
rrela
tio
n '
Control No AMSU No HIRS No GEO Wind No RAOB No QSCAT
Day 5 Anomaly Correlations for Mid-Latitudes Geopotential Heights Waves 1-20
15 Jan - 15 Feb 2003
0.6
0.65
0.7
0.75
0.8
0.85
0.9
N.H. 1000 hPa Z N.H. 500 hPa Z S.H. 1000 hPa Z S.H. 500 hPa Z
An
om
aly
Co
rrela
tio
n
Control No AMSU No HIRS No GEO Wind No RAOB No QSCAT
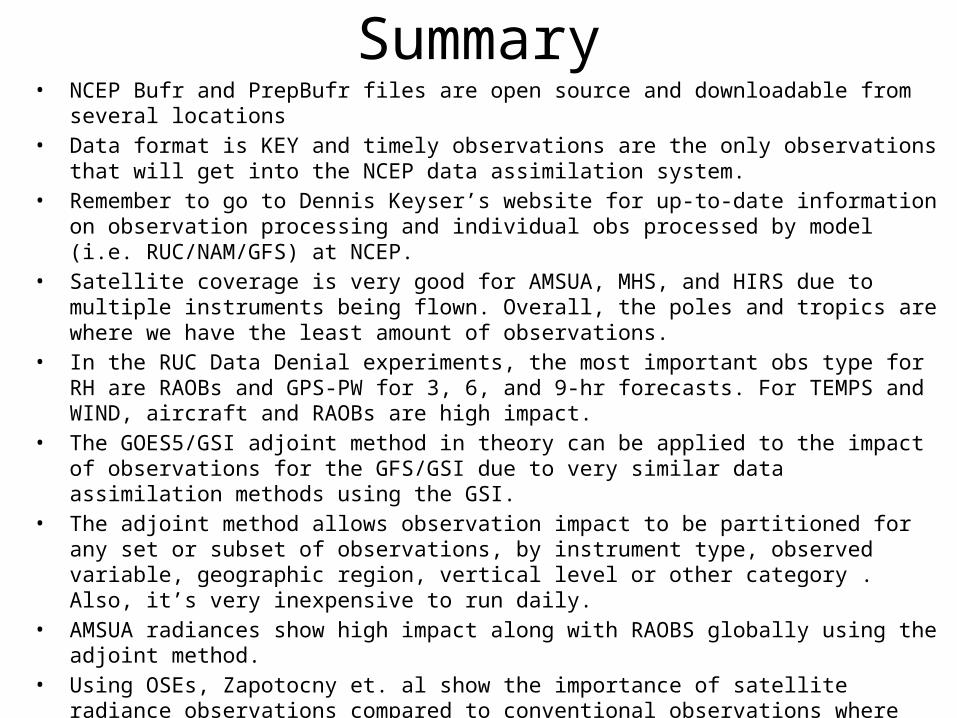
Summary• NCEP Bufr and PrepBufr files are open source and downloadable from several locations• Data format is KEY and timely observations are the only observations that will get into the NCEP data
assimilation system.• Remember to go to Dennis Keyser’s website for up-to-date information on observation processing and
individual obs processed by model (i.e. RUC/NAM/GFS) at NCEP.• Satellite coverage is very good for AMSUA, MHS, and HIRS due to multiple instruments being flown.
Overall, the poles and tropics are where we have the least amount of observations.• In the RUC Data Denial experiments, the most important obs type for RH are RAOBs and GPS-PW for
3, 6, and 9-hr forecasts. For TEMPS and WIND, aircraft and RAOBs are high impact.• The GOES5/GSI adjoint method in theory can be applied to the impact of observations for the
GFS/GSI due to very similar data assimilation methods using the GSI.• The adjoint method allows observation impact to be partitioned for any set or subset of observations,
by instrument type, observed variable, geographic region, vertical level or other category . Also, it’s very inexpensive to run daily.
• AMSUA radiances show high impact along with RAOBS globally using the adjoint method.• Using OSEs, Zapotocny et. al show the importance of satellite radiance observations compared to
conventional observations where both sets are about equally important to the GFS model skill (0-7 days) in the NH, but in the SH the importance of satellite radiance observations is magnified by the immediate loss in forecast skill.
• NOAMSU and NORAOB OSEs show the largest loss of skill for 5-day anomaly correlation scores in the polar, northern, and southern hemispheres
Related Documents


