IEEJ: December 2009 1 Current Status and Future Prospects of Electric Power as Automotive Fuel Harumi Hirai * Yuji Matsuo ** Hiroshi Uno *** Yu Nagatomi *** Summary The deployment of electric vehicles and plug-in hybrid vehicles on the premise of using low-carbon power sources (renewable energy and nuclear power) is expected to not only contribute to a stable energy supply by lowering dependence on oil (dependence on foreign supply sources) as fuel but also help to reduce CO 2 emissions. Moreover, the use of night-time electricity is likely to help spread the use of electric vehicles for commuter use by reducing energy cost. However, it is important to remember that if conventional electricity, mainly generated by coal-fired power plants, is to be used as a power source, the deployment of electric vehicles and plug-in hybrid vehicles may not necessarily be effective in reducing CO 2 emissions. It is also true that compared with vehicles powered by an internal-combustion engine, electric vehicles still have some shortcomings, such as their short driving range, some 100 km on a single charge of the battery, and the long battery-recharging time. To significantly increase the use of electric vehicles in the future, the key will be to develop a low-cost, high-performance battery. It will also be necessary to further reduce the cost of wind and photovoltaic power generation. As the use of electric vehicles spreads, it will become necessary to conduct a quantitative study on the optimization (cost minimization) of the power source mix (cost minimization), including additional power sources for automobiles. 1. Overview 1-1 Status and Outlook of Diffusion of Electric Vehicles An electric vehicle runs on an electric motor that is driven by electricity supplied from an on-board electricity storage battery. Although the history of electric vehicles began before the history of vehicles powered by an internal combustion engine, their use did not become widespread, due to their short driving range and supply infrastructure-related constraints, such as difficulty in securing power sources and power supply stations. Ever since motorization began in the United States in the 1920s, vehicles driven by an internal combustion engine using gasoline or diesel for fuel have remained the mainstay types of vehicles. However, the reduction of CO 2 emissions arising from the use of fossil fuels has become a focus of attention as a measure to combat global warming in recent years. As a result, the deployment of the electric vehicles is attracting interest as * Senior Research Fellow, Energy Demand, Supply and Forecast Analysis Group, Energy Data and Modeling Center, IEEJ ** Senior Economist, Energy Demand, Supply and Forecast Analysis Group, Energy Data and Modeling Center, IEEJ *** Economist, Energy Demand, Supply and Forecast Analysis Group, Energy Data and Modeling Center, IEEJ

Welcome message from author
This document is posted to help you gain knowledge. Please leave a comment to let me know what you think about it! Share it to your friends and learn new things together.
Transcript

IEEJ: December 2009
1
Current Status and Future Prospects of Electric Power
as Automotive Fuel
Harumi Hirai* Yuji Matsuo** Hiroshi Uno***
Yu Nagatomi***
Summary
The deployment of electric vehicles and plug-in hybrid vehicles on the premise of using
low-carbon power sources (renewable energy and nuclear power) is expected to not only contribute
to a stable energy supply by lowering dependence on oil (dependence on foreign supply sources) as
fuel but also help to reduce CO2 emissions. Moreover, the use of night-time electricity is likely to
help spread the use of electric vehicles for commuter use by reducing energy cost. However, it is
important to remember that if conventional electricity, mainly generated by coal-fired power plants,
is to be used as a power source, the deployment of electric vehicles and plug-in hybrid vehicles
may not necessarily be effective in reducing CO2 emissions.
It is also true that compared with vehicles powered by an internal-combustion engine, electric
vehicles still have some shortcomings, such as their short driving range, some 100 km on a single
charge of the battery, and the long battery-recharging time. To significantly increase the use of
electric vehicles in the future, the key will be to develop a low-cost, high-performance battery. It
will also be necessary to further reduce the cost of wind and photovoltaic power generation.
As the use of electric vehicles spreads, it will become necessary to conduct a quantitative
study on the optimization (cost minimization) of the power source mix (cost minimization),
including additional power sources for automobiles.
1. Overview
1-1 Status and Outlook of Diffusion of Electric Vehicles
An electric vehicle runs on an electric motor that is driven by electricity supplied from an
on-board electricity storage battery. Although the history of electric vehicles began before the
history of vehicles powered by an internal combustion engine, their use did not become widespread,
due to their short driving range and supply infrastructure-related constraints, such as difficulty in
securing power sources and power supply stations. Ever since motorization began in the United
States in the 1920s, vehicles driven by an internal combustion engine using gasoline or diesel for
fuel have remained the mainstay types of vehicles. However, the reduction of CO2 emissions
arising from the use of fossil fuels has become a focus of attention as a measure to combat global
warming in recent years. As a result, the deployment of the electric vehicles is attracting interest as
* Senior Research Fellow, Energy Demand, Supply and Forecast Analysis Group, Energy Data and Modeling Center, IEEJ
** Senior Economist, Energy Demand, Supply and Forecast Analysis Group, Energy Data and Modeling Center, IEEJ *** Economist, Energy Demand, Supply and Forecast Analysis Group, Energy Data and Modeling Center, IEEJ

IEEJ: December 2009
2
a way to reduce CO2 emissions.
Table 1-1 Number of Electric Vehicles Owned in Japan
Source : Next Generation Vehicle Promotion Center
Electric vehicles are not nearly as popular in Japan as gasoline-electric motor hybrid vehicles,
which have already been established as commercial vehicles. While only about 9,400 electric
vehicles (many of which are actually bicycles using electricity as a supplementary power source)
were in use in Japan in 2006 as shown in Table 1-1, the development of electric vehicles has come
into full swing in recent years.
Due to an improvement in battery performance and the development of a battery system that
enables fast recharging, commuter-type electric vehicles (mini-vehicle models) for short-range, town
driving are scheduled to be brought to the market one after another in 2009 through 2010. In addition,
commercial models of plug-in hybrid vehicles are also expected to be launched by the end of 2009.
Table 1-2 shows major global automakers’ development plans for electric vehicles (including
plug-in hybrid vehicles).
Table 1-2 Global Automakers’ Electric Vehicle Development Plans
(Vehicles)
2001 2002 2003 2004 2005 2006
Ordinary size 35 30 26 18 15 11
Small 412 374 331 296 258 222
78 63 48 27 17 11
2 2 1 1 1 1
23 20 16 14 13 12
Passenger cars 133 157 167 174 126 93
Commercial vehicles 577 528 467 345 217 155
Four-wheel 1,248 1,522 1,963 2,236 2,282 2,068
Two-wheel 2,143 2,895 4,658 5,357 6,999 6,848
4,651 5,591 7,677 8,468 9,928 9,421
Ele
ctri
c ve
hicl
es
Passengercars
Trucks
Buses
Special vehicles
Mini-vehicles
Motorvehicles
Total
Manufacturer Type Plan
Toyota Motor PHEV To start sales in Japan, U.S. and Europe by the end of 2009, initially for corporate and rental use
Nissan Motor To start sales in 2010 or later in Japan and U.S.
Aiming to start volume sales in the global market in 2012
Mitsubishi Motors EVTo start sales of the i MiEV in Japan by the end of 2009(at around \3 million; annual production target for 2011 at around 10,000 vehicles)
Fuji Heavy To start sales of two models in 2009 for use by local governments in Japan
Aiming to commercialize the STELLA in 2010
GM To launch the Chevrolet Volt PHEV in 2010 (production to start in the second half of 2010)
Announced production of the Saturn Vue Green Line of PHEV (2008)
Ford PHEV Co-developing a PHEV with Southern California Edison
VW PHEV Started test runs of the Golf Twin Drive PHEV
Daimler EVTo raise the standard of EV technology close to mass production levelAiming to start production in 2012 with annual volume of around 10,000 vehicles
EV・Supplied 100 EVs for use by police and public organizations London in 2007 (public road tests)・To introduce 100 units of the EV version of the Smart in Berlin by the end of 2009・To introduce EV versions of Benz models starting in early 2010
Chrysler EV(PHEV)Announced a plan to start sales in North America in 2010;Co-developing battery-related technologies with GE
BMW EV Started demonstration tests of an EV based on the Mini in U.S. in January 2009
Volvo and Saab PHEV Co-developing a PHEV
Opel PHEV Planning to start full-fledged sales in Europe in late 2011
EV
EV
PHEV
Manufacturer Mitsubishi Motors Fuji Heavy
Model Name i MiEVSubaru Plug-in STELLA
Concept
Photo image
Length x Width x Height 3,395×1,475×1,600mm 3,395×1,475×1,660mm
Weight 1,080kg 1,060kg
Passenger number 4 persons 4 persons
Maximum speed 130km/h 100km/h
Driving Range 160km 80km
Motor typePermanent magnetsynchronous motor47kW
Permanent magnetsynchronous motor40kW
BatteryLithium-ion battery16kWh
Lithium-ion battery9.2kWh
Electric Vehicles
Manufacturer Toyota Motor
Model Name Toyota Plug-in HV
Photo image
Length x Width x Height 4,445×1,725×1,490mm
Weight 1,360kg
Passenger number 5 persons
Engine displacement 1,496cc
Motor typeAlternating currentsynchronous motor
BatteryNickel-hydrogen battery6.5Ah×2(13Ah)
EV performanceEV driving range 13kmEV maximum speed 100km/h
Plug-in hybrid vehicle
Note : EV : Electric vehicles PHEV : Plug-in hybrid electric vehicles Source : Automakers’ web sites and press releases

IEEJ: December 2009
3
1-2 Prominent Features of and Challenges for Electric Vehicles
1-2-1 Benefits of Deployment of Electric Vehicles
One benefit of deploying electric vehicles is that it is expected to reduce CO2 emissions
compared with gasoline- or diesel vehicles. This is because electric vehicles can use power sources
with fewer CO2 emissions, such as renewable energy and nuclear power, as they run on electricity.
Secondly, the deployment of electric vehicles will contribute to a stable energy supply by reducing
dependence on fossil fuels (particularly oil) and on foreign energy sources. Thirdly, the use of
night-time electricity for battery recharging is expected to even out the burden on electricity supply
over the course of the day as shown in Fig. 1-1.
Fig. 1-1 Daily Pattern of the Burden on Power Supply
1-2-2 Prominent Features and Challenges
(1) Fuel Economy and Driving Range
As shown in Table 1-3, the fuel economy of an electric vehicle is 0.4MJ/km (110Wh/km),
better than 2.1MJ/km(15.5km/L) for a gasoline vehicle. However, the driving range of electric
vehicles is shorter than that of internal engine-powered vehicles, as even an electric vehicle
equipped with the most advanced battery can run only just over 100 km on a single charge.
Table 1-4 shows the average distance driven for gasoline and diesel vehicles in Japan. The
average distance driven per day for mini-vehicles is approximately 19.7 km, suggesting that an
electric vehicle equipped with the most advanced battery could meet the town driving needs of a
mini-vehicle owner with one or two plug-in recharges at home per week. However,
over-discharging of the battery should be avoided from the viewpoint of the longevity of batteries
currently available, and there are many other challenges to overcome, including the need to
establish a network of roadside recharging facilities and to shorten the recharging time
(development of fast recharging technology).
Peak-level supply capacity
Medium-level supply capacity
Baseline supply capacity
Hydroelectric power using a regulating
reservoir Hydroelectric power
using a storage reservoir
Pumped-storage hydroelectric power
Night-time recharging
Oil
LNG, LPG and other gases
Coal
Nuclear power
Run-off river-type power & geothermal power

IEEJ: December 2009
4
(2) Development of Low-Cost, High-Performance Battery
The greatest challenge to overcome in spreading the use of electric vehicles is their driving
ranges. The key to extending the range will be in reducing battery cost and improving battery
performance, which means increasing the battery output per weight (and per volume) and the battery
energy density. Until now, the nickel metal hydride battery, which has a high energy density and
which is suited to recharging quickly, has been used in hybrid vehicles. However, the lithium-ion
battery is regarded as the most promising candidate as the mainstay battery for electric vehicles. As
shown in Fig. 1-2, the energy density per volume of the lithium ion battery more than doubled from
230WH/L in 1990 to 580Wh/L in 2005.
Fig. 1-2 Trend in the Battery Energy Density per Volume
Ene
rgy
dens
ity
per
volu
me
(WH
/L)
Lithium-ion battery Nickel -hydrogen battery Nickel-cadmium battery
Source : Data compiled by Panasonic Energy Co., Ltd.
Note : Fuel economy of an electric vehicle: AC electricity consumption (recharging from an AC power source) Source : Electric vehicle: Data for the iMiEV and a report by the JHFC (fiscal 2007) were used as a reference.
Gasoline vehicle : The average of the figures for all passenger cars based on the list of fuel economy data prepared by the Minister of Land, Infrastructure, Transport and Tourism (March 2006) Hybrid vehicle : The average of the figures for the Prius and the Civic based on the above list of fuel economy data Diesel vehicle : A report by the JHFC
Fuel 1,000 vehiclesKm per vehicle
per yearKm per vehicle
per day
Gasoline 39,768
Diesel 2,549
Total 42,317 10,144 27.8
Mini-vehicle Gasoline 13,512 7,183 19.7
Passenger car
Table 1-4 Number of Passenger Cars Owned in Japan and the Distance Travelled
Source : Number of vehicles owned: Data compiled by the Automobile Inspection and Registration Information Association and the Annual Statistics of Automotive Transport (Ministry of Land, Infrastructure, Transport and Tourism)
Table 1-3 Comparison of Fuel Economy (10.15 mode ; Japan)
Mini-vehicle Small vehicle
(Kwh/km) 0.11
(MJ/km) 0.40
(km/l) 20.6 15.5
(MJ/km) 1.6 2.1
(km/l) 30.6
(MJ/km) 1.1
(km/l) 19.7
(MJ/km) 1.8Diesel vehicle
Gasoline vehicle
Hybrid vehicle
Electric vehicle
IEEJ: December 2009
5
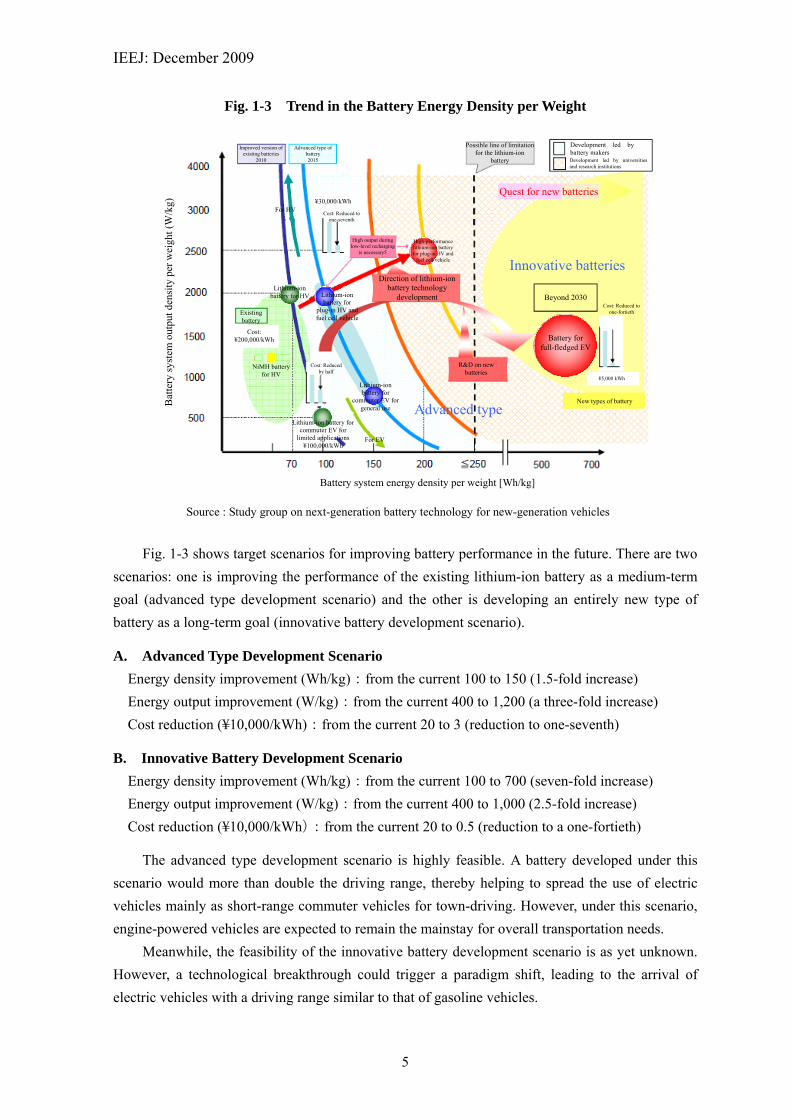
Fig. 1-3 Trend in the Battery Energy Density per Weight
Source : Study group on next-generation battery technology for new-generation vehicles
Fig. 1-3 shows target scenarios for improving battery performance in the future. There are two
scenarios: one is improving the performance of the existing lithium-ion battery as a medium-term
goal (advanced type development scenario) and the other is developing an entirely new type of
battery as a long-term goal (innovative battery development scenario). A. Advanced Type Development Scenario
Energy density improvement (Wh/kg):from the current 100 to 150 (1.5-fold increase)
Energy output improvement (W/kg):from the current 400 to 1,200 (a three-fold increase)
Cost reduction (¥10,000/kWh):from the current 20 to 3 (reduction to one-seventh) B. Innovative Battery Development Scenario
Energy density improvement (Wh/kg):from the current 100 to 700 (seven-fold increase)
Energy output improvement (W/kg):from the current 400 to 1,000 (2.5-fold increase)
Cost reduction (¥10,000/kWh):from the current 20 to 0.5 (reduction to a one-fortieth)
The advanced type development scenario is highly feasible. A battery developed under this
scenario would more than double the driving range, thereby helping to spread the use of electric
vehicles mainly as short-range commuter vehicles for town-driving. However, under this scenario,
engine-powered vehicles are expected to remain the mainstay for overall transportation needs.
Meanwhile, the feasibility of the innovative battery development scenario is as yet unknown.
However, a technological breakthrough could trigger a paradigm shift, leading to the arrival of
electric vehicles with a driving range similar to that of gasoline vehicles.
Bat
tery
sys
tem
out
put d
ensi
ty p
er w
eigh
t (W
/kg)
Improved version of existing batteries
2010
Advanced type of battery 2015
For HV ¥30,000/kWh
Cost: Reduced to one-seventh
High output during low-level recharging
is necessary5
High-performance lithium-ion battery for plug-in HV and
fuel cell vehicle
Direction of lithium-ion battery technology
development Lithium-ion
battery for HV Lithium-ion battery for
plug-in HV and fuel cell vehicle
Existing battery
Cost: ¥200,000/kWh
NiMH battery for HV
Cost: Reduced by half
Lithium-ion battery for commuter EV for
limited applications ¥100,000/kWh
Lithium-ion battery for
commuter EV for general use
For EV
Possible line of limitation for the lithium-ion
battery
Development led by battery makers Development led by universities and research institutions
Quest for new batteries
Innovative batteries
Beyond 2030
Battery for full-fledged EV
Cost: Reduced to one-fortieth
¥5,000 kWh
New types of battery
R&D on new batteries
Advanced type
Battery system energy density per weight [Wh/kg]

IEEJ: December 2009
6
2. Electricity Supply-Demand Condition and Future Outlook
2-1 Global Electricity Supply-Demand Condition
2-1-1 Trend in Global Power Generation Volume
As shown in Fig. 2-1, the global volume of power generation has grown steadily in recent
years, with the volume in 2005 more than tripling from 1971 to 18,235TWh/year. The power
generation mix has changed over the period, with the share of nuclear-power generation growing
from only 2% in 1971 to 16% in 2005. Meanwhile, the share of thermal power generation using
crude oil and oil products like fuel oil declined from 21% in 1971 to 6% in 2005 as a result of the
past oil crises, among other factors. Power generation using fossil fuels (mainly coal) accounts for
67% of the total.
Note : 1TWh=1 billion kWh Source : EA, Energy Balances of Non-OECD Countries 2005
2-1-2 Power-generation Volume and Power Source Mix in Major Countries
The power generation mix varies from country to country and from region to region. The
power sources of Japan and the EU countries are well diversified. Among the EU countries, France
relies mostly on nuclear-power generation. Meanwhile, Brazil depends significantly on
hydroelectric power generation. Countries rich in natural resources use their own resource reserves
to generate power, as in the case of China and Russia, which depend on coal and natural gas,
respectively. As developed countries are well advanced in electricity, their ratio of the
power-generation volume to the primary energy supply is relatively high. On the other hand,
countries like China and, especially, India, face a serious power shortage, as their ratio of the
power-generation volume to the primary energy supply is small. In the future, the ratio of the
power-generation volume to the primary energy supply is expected to increase in developing and
emerging countries, too, in line with the progress in electricity that comes with economic
development.
0%
20%
40%
60%
80%
100%
1971 1981 1991 2001 Year
Heat
Other fuels
Inflammable recycledmaterials and wastes
Solar, wind and other powers
Geothermal power
Hydroelectric power
Nuclear power
Natural gas
Oil products
Crude oil
Coal
Fig. 2-2 Trend in Global Power
Generation Mix
Fig. 2-1 Trend in Global Power
Generation Volume
0
4,000
8,000
12,000
16,000
20,000
1971 1981 1991 2001 Year
TWhHeat
Other fuels
Inflammable recycledmaterials and wastes
Solar, wind and other powers
Geothermal power
Hydroelectric power
Nuclear power
Natural gas
Oil products
Crude oil
Coal
Coal40%
Oil products6%
Natural gas20%
Nuclear power15%
Hydroelectricpower16%
200518,235TWh

IEEJ: December 2009
7
As shown in Fig. 2-3, the United States and other developed countries still account for most of
the volume in global power generation. However, China’s and India’s shares are growing sharply in
line with their economic growth. The current power-generation volume in China matches the
volume in the EU as a whole.
Fig. 2-3 Power Generation Mix by Major Country and Region (2005)
Note : The ratio of power generation to primary energy represents the total power generation volume divided by the total primary energy supply volume. Source : IEA, Energy Balances of OECD Countries 2005, Energy Balances of Non-OECD Countries 2005
2-1-3 CO2 Emission Intensity of Major Countries’ Electricity Sector
In all developed countries except for the United States, the CO2 emission volume per 1kWh of
power generation is lower than the global average. The volume is also lower than the global
average in Russia and Brazil, among emerging countries, as these two countries depend largely on
natural gas and hydroelectric power. On the other hand, the volume is higher than the average in
the United States, China and India, all of which depend heavily on coal. Moreover, the CO2
emission volume in these countries is large because of their huge electricity consumption due to
vast geographical and population sizes.
It can also be said that the CO2 emission volume per unit of power generation in each region is
significantly affected by the power gemeration mix there. As the electricity sector accounts for
some 40% of the global volume of energy-derived CO2 emissions, a study is under way on how to
shift this sector to a low-carbon system amid growing concerns over global warming.
Japa
n
U.S
.
U.K
..
Fra
nce
Ger
man
y
EU
(in
clud
ing
U.K
., F
ranc
e an
d G
erm
any)
Chi
na
Indi
a
Rus
sia
Bra
zil
Heat
Other fuels
Inflammable recycled materials and wastes
Solar, wind and other powers
Geothermal power
Hydroelectric power
Nuclear power
Natural gas
Oil products
Crude oil
Coal
Ratio of power generation to primary energy (right axis)
Global average

IEEJ: December 2009
8
Fig. 2-4 International Comparison of CO2 Emissions per 1 kWh
of Power Generation (2005)
Note : CO2 emissions per 1 kWh of power supplied at the power transmission end (including power used to generate heat for the co-generation system) Source : IEA, Energy Balances of OECD Countries 2005, Energy Balances of Non-OECD Countries 2005
3. Current Status and Outlook of Renewable Energy
Research and development have been ongoing for a long time with regard to renewable energy
as a means to provide a fundamental solution to the problem of natural resource depletion by
lowering dependence on fossil fuels. Such energy has attracted increasing attention in recent years
as a low-carbon-emission power-generation system. Renewables that are regarded as especially
promising as a power-generation system and expected to be deployed on a large scale in the future
are wind power, photovoltaic power and solar thermal power. These renewables are raising hopes
due to their larger potential compared with the potential of other renewables, including bio-energy
and micro-hydroelectric power-generation systems. It should be noted that the power-generation
volumes for renewable energy systems cited in this report are based on the assumption of a
power-generation capacity utilization ratio of 20% for wind power and 12% for photovoltaic
power.
3-1 Wind Power
3-1-1 Status of Deployment
Fig. 3-1 shows the trend in the global-installed capacity wind-power generation and the
installed capacity by country. As indicated here, wind-power-generation facilities have increased
sharply since the 1990s, particularly in Europe and the United States, boosting the global
power-generation capacity by 20-30% annually. In 2007, the global generation capacity stood at
0
200
400
600
800
1,000
Japan U.S. U.K. France Germany EU(including
U.K.,France andGermany)
China India Russia Brazil Worldwide
g-CO2/kWh
Global average

IEEJ: December 2009
9
94GW. Germany, the United States and Spain together account for nearly 60% of the total, and the
capacity in China and India is also growing.
Fig. 3-1 Global Installed Capacity of Wind-power Generation
Source : Global Wind Energy Council, “Global Wind 2007 Report”
Fig. 3-2 shows the power-generation capacity in Japan and a breakdown of the capacity by
region. Although the capacity is also growing in Japan, the ratio of wind power to the total
power-generation volume in the country was only 0.22% in 2006. By region, there are large
numbers of wind-power-generation facilities in Hokkaido, Tohoku and Kyushu, while the capacity
is relatively small in Kanto and Kinki. The disparity is attributable mainly to geographical factors.
Fig. 3-2 Installed Capacity of Wind-power Generation in Japan
Source : Compiled from materials prepared by NEDO
0
5
10
15
20
25
German
yU.S
.Spain
India
China
Denm
ark Italy
France
U.K.
Portuga
l
Canad
a
Nether
lands
Japa
n
(GW)
22.2
16.8
15.1
8.0
6.1
3.1 2.72.5 2.4 2.2 1.8 1.7 1.5
Installed capacity by country (2007) 設備容量
(GW)設備増加量
(GW)
設備容量
設備増加量
Trend in installed power-generation capacity
Increase in installed capacity
Installed capacity
Increase in installed capacity (GW)
0
50
100
150
200
250
300
350
400
Hokkaido Tohoku Kanto Chubu Kinki Chugoku Shikoku Kyushu &Okinawa
(MW)
170
367
55
84
14 18 18
200
Installed capacity by region (2005) Trend in installed power-generation capacity
0
100
200
300
400
500
600
700
800
900
1000
1990 1995 2000
0
100
200
300
400
500
600
700
800
900
1000基数 設備容量(MW)
設備容量
基数
Number of wind turbines
Number of wind turbines
Installed capacity
Installed capacity (MW)

IEEJ: December 2009
10
3-1-2 Supply Capacity
Based on the results of a nationwide survey on wind conditions, the New Energy and
Industrial Technology Development Organization (NEDO) assumes the construction of wind farms
with a capacity of 5,000 kW each on 1% of the areas where the average wind velocity is 5 m/s or
more. This assumption constitutes the basis of NEDO’s estimate of the potential installed capacity
of wind power in Japan. According to this estimate, the potential wind-power supply capacity
nationwide is 9.22 GW, with wind farms to be constructed mainly in Hokkaido, Tohoku and
Kyushu. On the assumption of a capacity utilization ratio of 20%, the maximum possible
wind-power-generation volume in Japan is estimated at around 16 GWh/year, which is equivalent
to around 1.4% of the total power-generation volume in 2006. This estimate assumes the
construction of onshore wind farms, but not offshore ones. The potential supply capacity will grow
if offshore wind farms are included in the estimate. However, in reality, offshore wind farms are
likely to be constructed only on a limited scale in Japan because of problems related to fishing
rights, etc.
Worldwide, the potential wind-power supply capacity is much higher. For example, the World
Energy Council (WEC) estimates that 29.14 million km2 of areas are available for wind-power
generation worldwide on the assumption that areas where the average wind velocity of 5.1 m/s to
8.8 m/s are suitable as wind farm sites. On the basis of this available area size and the same
assumptions used in the NEDO estimate for Japan, the potential global wind-power supply capacity
would come to approximately 74.6 billion kW as shown in Table 3-1. On the assumption of a
capacity utilization ratio of 20%, the global wind-power-generation volume would come to
approximately 130 trillion kWh/year, which is around seven times as large as the global total
power-generation volume in 2005. This estimate takes into consideration wind conditions on land
areas but not other factors, such as the distance from areas where there is electricity demand to
wind farm candidate sites, and the total size of areas available for wind-power generation will be
limited if such factors are taken into consideration. Meanwhile, if offshore wind farms are taken
into consideration, the potential supply capacity would grow.
Table 3-1 Areas Available for Wind-power Generation and
Potential Supply Capacity Worldwide
Areas available* (10,000 km2)
Potential supply capacity** (billion kW)
North America 788 20.2 Central & South America 331 8.5 Western Europe 197 5.0 Ex-Soviet & East Europe 678 17.4 Middle East & North Africa 257 6.6 Rest of Africa 221 5.7 East Asia & Asia-Pacific 419 10.7 Rest of Asia 24 0.6 Total 2,914 74.6
Source : World Energy Council, “New Renewable Energy Resources”

IEEJ: December 2009
11
3-1-3 Constraints Related to Grid Stability
In Japan, electric power companies set the upper limit on the volume of wind-power-derived
electricity that may be connected to a power grid from the viewpoint of the grid stability. Under
this condition, the maximum possible wind-power supply volume is just over 1% of the total power
supply. In May 2008, the Federation of Electric Power Companies of Japan announced that up to 5
GW of wind-power-derived electricity and up to 10 GW of photovoltaic power-derived electricity
can be connected to grids across Japan without affecting the grid stability.
Meanwhile, Germany, Spain and Denmark have already boosted the ratio of
wind-power-derived electricity to between 5% and 17%. However, it is important to remember that
the situation in these countries is different from the situation in Japan in that they have huge
cross-border grids and make international electricity trade. Generally speaking, in order to maintain
grid stability when unstable wind-power-derived electricity is connected to the grid, it is necessary
to strengthen power transmission and distribution networks, enhance grid management and increase
both the power-storage capacity and the backup power output capacity. In other words, if the cost
of such improvement measures can be financed, grid stability issues related to wind-power
generation will be resolved.
For example, the U.K. Department of Trade and Industry (DTI) estimates1 the cost of
deploying wind power would be approximately 0.9 pound/MWh (approximately ¥0.2/kWh) at
maximum if wind-power-derived electricity is to account for 20% of the total power supply. Hence,
it is generally assumed that renewable energy-derived electricity, including wind-power-derived
one, can be connected to a grid at a realistic cost if its ratio is around 20% or less, and, roughly
speaking, this can be regarded as the potential deployment rate for renewable energy.
3-1-4 Power-generation Cost
As wind-power generation has already been introduced on a large scale, the power-generation
cost is only slightly higher than or, in some cases, comparable to the cost of thermal and
nuclear-power generation. According to the OECD’s comparison of the costs of various
power-generation systems in the United States and Europe2 (on the assumption of discount rates of
5% and 10%), the cost of wind-power generation in the United States is $48/MWh with a discount
rate of 10%, almost comparable to $43/MWh for gas-fired thermal power generation and $47 for
nuclear-power generation. In contrast, the costs of photovoltaic-power generation and solar thermal
power, at $209/MWh and $269/MWh, respectively, are several times as high as the cost of thermal
and nuclear power generation. This situation applies in other countries as well.
According to the International Energy Agency (IEA), the estimated cost of wind power ranges
from around $89 to $135/MWh in areas with weak wind conditions and from around $65 to
$94/MWh in areas with average wind conditions. By 2015, the cost is estimated to drop to $53/MWh
as shown in Fig. 3-3. Therefore, in areas with favorable wind conditions, the cost is likely to impose
little constraint. However, the cost of offshore wind-power generation is several hundred dollars/kW
1 DTI “Quantifying the System Costs of Additional Renewables in 2020” (2002) 2 OECD “Projected Costs of Generating Electricity 2005 update”

IEEJ: December 2009
12
higher than the cost of onshore wind power. Therefore, if wind power is to be deployed on a large
scale in the future, it will be necessary to make efforts to reduce the cost of off-shore wind power.
Fig. 3-3 Trend in the Cost of Onshore Wind-power Generation and the Future Outlook
Source : IEA, “Energy Technology Perspectives 2008”
3-1-5 Outlook on Future Deployment
According to the “Outlook for Long-Term Energy Supply and Demand (2008),” compiled by
Japan’s Ministry of Economy, Trade and Industry, the photovoltaic-power generation capacity is
estimated to increase 40-fold between 2005 and 2030 to 53.21 GW and the wind-power generation
capacity is estimated to grow six-fold over the same period to 6.61 GW, as shown in Fig. 3-4.
Fig. 3-4 Japan’s Target for Installed Capacity of Solar and Wind Power Generation
Source : Ministry of Economy, Trade and Industry, “Outlook for Long-Term Energy Supply and Demand”
0
10
20
30
40
50
60
70
80
90
100
U.S. Denmark Germany Italy 2015(IEA
assessment)
2005(OECD estimate)
2005(IEA
assessment)
USD/MWh
53
65~94
8883
60
48
0
1000
2000
3000
4000
5000
6000
2005 2020 2030
(million kW)
PV power generation
Wind powergeneration

IEEJ: December 2009
13
The estimated wind-power generation capacity is equivalent to around 70% of the potential
installed capacity mentioned in 3-1-2. Without building offshore wind farms, it would be difficult
to raise the capacity far beyond the estimated figure. On the assumption of a capacity utilization
ratio of 20%, the wind-power generation volume will be equivalent to around 1.3% of the total
power-generation volume estimated for 2050.
In the meantime, the IEA estimates that by 2050, the global volume of wind-power generation
will grow to 5,174 TWh/year at maximum (see Fig. 3-5), which will be equivalent to 12% of the
global volume of overall power generation. While this is a very ambitious estimate, it can be said
that as shown above, the figure is mostly feasible in light of the potential supply capacity and
additional investment costs. Nevertheless, if the generation volume is to be actually raised to that
level, countries around the world will need to implement policy measures to support the capacity
installation of wind-power generation and make appropriate investments to ensure the grid stability.
According to an estimate by the Institute of Energy Economics, Japan (IEEJ) (reference case),
the volume of power generation from renewable energy including wind power, photovoltaic power
and solar thermal power, will grow to 2,479 TWh by 2050, and the above estimate is far higher
than this figure.
Fig. 3-5 Future Outlook on Global Installed Capacity of Wind-power Generation
Source : IEA, “Energy Technology Perspectives 2008”
3-2 Photovoltaic and Solar Thermal Power Generation
3-2-1 Status of Deployment
Active research on photovoltaic-power generation (solar cells) has been ongoing for several
decades, and single-crystalline and polycrystalline silicon solar cells have been the mainstay types
of cells until now. However, because of cost factors, there has also been a gradual shift to
amorphous solar cells and compound-based solar cells, which accounted for approximately 9% of
the total in 2007. As will be addressed later, the cost of photovoltaic-power generation is very high
compared with the cost of other power sources, so the current research and development focuses on
both improving efficiency and reducing the cost.
With regard to crystalline silicon solar cells, there is no fundamental constraining factor in
terms of the supply of silicon itself. However, the rapid spread of photovoltaic-power generation
0
1000
2000
3000
4000
5000
6000
2005 2050ACT Map
2050Blue Map
TWh/yr
3,607TWh(9%)
5,174TWh(12%)
111TWh(0.6%)
洋上風力
陸上風力
Offshore wind power
Onshore wind power

IEEJ: December 2009
14
has caused a supply-demand crunch for crystalline silicon for now, constraining the production of
solar cells. Nevertheless, as the production capacity of crystalline silicon is being expanded
substantially, this problem will be resolved in the medium and long term. In the meantime, with
regard to compound-based solar cells, the limited availability of necessary rare metals may emerge
as a constraining factor when such cells are deployed on a large scale in the future.
As shown in Fig. 3-6 and Fig. 3-7, the installed photovoltaic-power generation capacity of the
IEA member countries is growing rapidly, with the installed capacity amounting to 5.7GW in 2006.
Together, Japan, Germany and the United States account for 70% of the total capacity. In particular,
the installed capacity in Germany has expanded rapidly in recent years as a result of the revision of
the feed-in tariff system (under which electricity generated from photovoltaic systems are
purchased at fixed prices). Most of the photovoltaic-power generation systems now in use have
been installed on roofs of buildings and houses and are grid-connected, and this approach is
expected to continue in the future.
The solar thermal power-generation system generates electricity through a steam turbine using
heat generated by solar light concentrated on heat-absorbing materials. Although solar thermal
systems with a capacity of up to around 50MW have been in practical use in countries like the
United States and Spain since the 1980s, solar thermal power generation is still in the trial stage
and has yet to become widespread. In Japan, a test plant was built in Nio Town, Kagawa Prefecture,
but the project was abandoned. Since then, no solar thermal project has been planned in Japan.
3-2-2 Potential Supply Capacity
Table 3-2 shows NEDO’s estimates of the potential installed capacity of photovoltaic-power
generation in Japan. NEDO estimates the potential capacity at approximately 100 GW, the bulk of
which will be installed in single-family homes and condominiums. On the assumption of a
capacity-utilization ratio of 12%, the power-generation volume will come to 105TWh/year,
equivalent to around 10% of the total power generation in Japan in 2006.
If the global solar power generation capacity is calculated on the same assumptions with this
Fig. 3-6 Trend in Installed Capacity of
Solar Wind Power Generation
Source : IEA, “Energy Technology Perspectives 2008”
Fig. 3-7 Trend in Installed Capacity of
PV Power Generation by Country
0
500
1000
1500
2000
2500
3000
3500
1997 1998 1999 2000 2001 2002 2003 2004 2005 2006
Japan
Germany
U.S.
Spain
Australia
MW
Source : IEA, Photovoltaic Power System Programme

IEEJ: December 2009
15
estimate, with capacity at houses calculated in proportion to the population ratio and capacity at
industrial facilities calculated in proportion to the GDP ratio, it comes to approximately 3,800 GW,
equivalent to around 20% of the global power-generation volume in 2005.
Solar thermal power generation is suited to regions where the sunlight intensity and sunshine
rate are high and the annual rainfall volume is relatively small, given that it uses concentrated
sunlight. For example, Africa, the Americas, the Middle East and Australia may be suitable regions.
According to an estimate by the IEA, a solar thermal plant covering 100 square miles of area can
meet all of the electricity needs of the United States, and there is no supply-side constraining factor.
However, as solar thermal power generation is still at the early stage of deployment, its future is
uncertain.
Table 3-2 Potential Supply Capacity of PV Power Generation
Source : NEDO
3-2-3 Power-generation Cost
As described above, the power-generation cost of photovoltaic and solar thermal power is very
high compared with the cost of other power sources, so these systems are not competitive enough.
For photovoltaic-power generation, the problem is that the manufacturing cost of solar cells has not
been reduced sufficiently, and in the case of a solar thermal system, the high cost reflects the fact
that it is still at the very early stage of deployment.
Nonetheless, the power-generation cost of photovoltaic power is decreasing rapidly as shown
in Fig. 3-8. Under its photovoltaic power development program, NEDO aims to reduce the cost to
¥7/kWh by 2030.
According to the IEA, the cost of the photovoltaic-power generation system in 2006 was
approximately $6.25/W, 60% of which was the manufacturing cost of solar cell modules. This cost
has been dropping at a learning rate of 15–20%, and if the trend continues, the cost is expected to
drop to $3.75-4.4/W by 2010 in line with a future large-scale deployment. If this trend of cost
decline continues until 2050 to push the system cost down to $1.07/W, the power-generation cost
would fall to $50–70/MWh.
(Unit: GW)
Potential supply capacity inJapan
(in the case of progress made intechnology development
according to NEDO’s roadmap)
Potential supply capacityworldwide
Single-family homes 45.4 2,274
Condominiums 16.5 826
Public facilities 10.4 521
Industrial facilities, etc. 29.6 215
Total 102 3,836

IEEJ: December 2009
16
Fig. 3-8 Trend in the Price of Solar Power Generation Systems in Japan and
the Cost Reduction Targets
Source : NEDO
As shown above, the cost of photovoltaic-power generation is currently very high, and
photovoltaic power will become competitive with other power sources only if the cost is reduced
sharply in line with a large-scale deployment. Thus, cost reduction is the major challenge for
photovoltaic power.
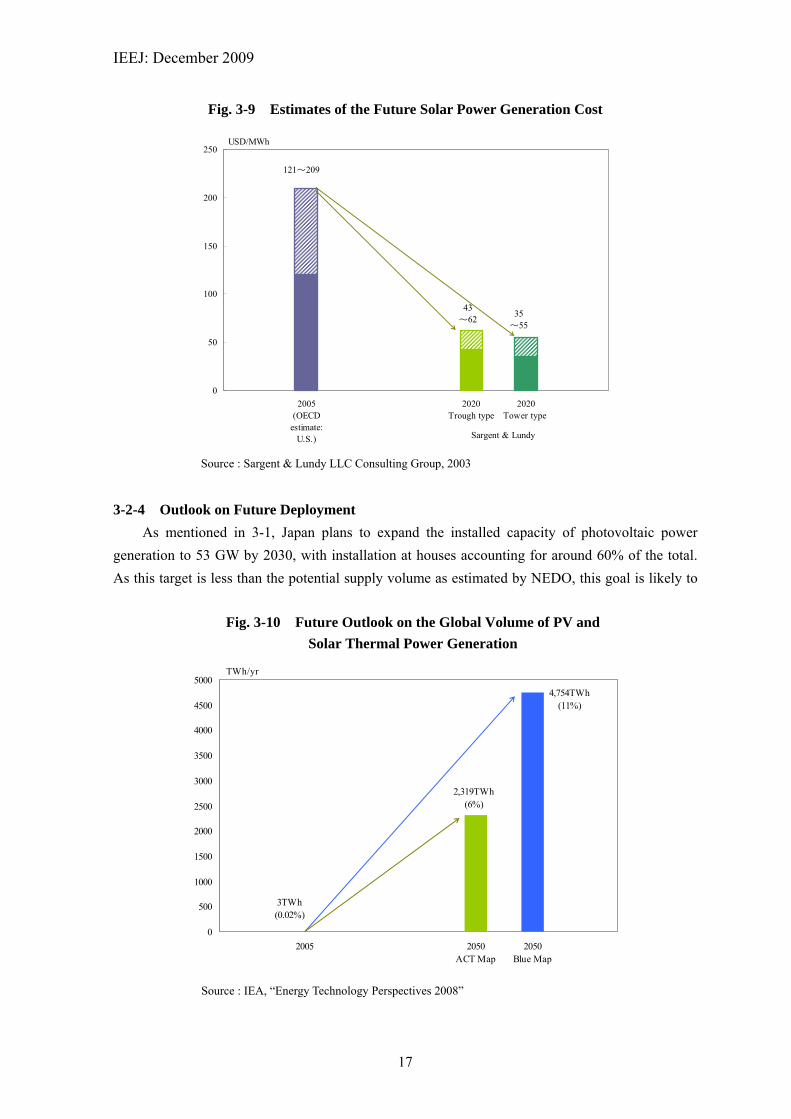
The future of solar thermal power generation is uncertain, since its deployment has so far been
limited. However, its cost is expected to drop rapidly if mass production of solar thermal systems
starts and technology development advances. While the parabolic trough is the mainstay solar
thermal system, the tower is expected to achieve similar cost efficiency in the future. According to
Sargent & Lundy LLC Consulting Group’s estimate shown in Fig. 3-9, the future power-generation
cost of the parabolic trough will range from around $43 to $62/MWh and the cost of the tower will
range from around $35 to 55/MWh.
0
50
100
150
200
250
300
350
400
1993 1995 1997 1999 2001 2003
万円/kW¥10,000/kW
(Year)
Pow
er g
ener
atio
n co
st
¥50/kWh
¥30/kWh
Development of the thin-film solar cell (based on silicon compounds) in addition to
the bulk crystal silicon-based solar cell
¥23/kWh
¥14/kWh
<<Battery technology>> Cost reduced through the development of
new-generation technology
System equipped with a storage battery
Deployment of a system with enhanced
autonomy
(Reduction in thickness and performance improvement due to
the multi-junction structure)
<<System technology>> System that imposes little burden on the grid
Shift from the stand alone system to the integrated system
(Expansion in size Extension of the BOS
longevity)
Active network control
Development of new materials comprised of neither silicon nor
compounds
¥7/kWh (Solar cells using new materials (pigment, etc.) and a new structure)
[Reference: Plan for the deployment of solar power generation]
For household use
For industrial use
For overseas markets
Conventional grid-connected system Local community PV system
Wide-area connection system New energy network
High-voltage connection internal consumption system Hydrogen production
Solar home system (SHS)** Very large-scale PV power plant (VLS-PV)
IEEJ: December 2009
17
Fig. 3-9 Estimates of the Future Solar Power Generation Cost
Source : Sargent & Lundy LLC Consulting Group, 2003
3-2-4 Outlook on Future Deployment
As mentioned in 3-1, Japan plans to expand the installed capacity of photovoltaic power
generation to 53 GW by 2030, with installation at houses accounting for around 60% of the total.
As this target is less than the potential supply volume as estimated by NEDO, this goal is likely to
0
50
100
150
200
250
2005(OECD
estimate:U.S.)
2020Trough type
2020Tower type
USD/MWh
35~55
43~62
121~209
Sargent & Lundy
0
500
1000
1500
2000
2500
3000
3500
4000
4500
5000
2005 2050ACT Map
2050Blue Map
TWh/yr
2,319TWh(6%)
4,754TWh(11%)
3TWh(0.02%)
Fig. 3-10 Future Outlook on the Global Volume of PV and
Solar Thermal Power Generation
Source : IEA, “Energy Technology Perspectives 2008”

IEEJ: December 2009
18
be achieved if the government actively implements measures to encourage installation in homes.
The potential global-installed capacity of 3.8 billion kW, which was mentioned in 3-2-2,
would, roughly speaking, lead to a global power-generation volume of 4,000 TWh/year. Assuming
electricity consumption of 5 kW per household, this would be sufficient to meet the needs of
around 800 million households. According to the IEA’s estimate of global installed capacity, as
shown in Fig. 3-10, the installed capacity of solar systems, including photovoltaic and solar thermal
systems, will grow by the year 2050 to a maximum of 4,754 TWh/year, which will be equivalent to
11% of the overall power generation. Such a huge increase in the installed capacity will be possible
if governments around the world actively implement measures to support the deployment of solar
systems and the cost drops sharply as a result of technology development and massive deployment.
4. Current Status and Outlook of Nuclear Power
4-1 Current Status of Nuclear-power Generation Worldwide
Nuclear-power generation is attracting strong attention as an effective means to combat global
warming because it does not emit CO2 in the power-generation process and also because the CO2
emission amount over the entire life cycle of nuclear-power stations is extremely small compared
with coal- and gas-fired thermal power stations. After World War II, various countries started
developing nuclear-power generation, and in the 1970s, the installed capacity expanded rapidly,
mainly in North America and Europe. Later, the growth slowed down, and the total volume of
nuclear-power generation declined temporarily as a result of the closures of obsolete nuclear plants
in the United States and Europe. In the 2000s, the installed capacity started growing again, led by
installation in Asian countries, and many countries are planning to introduce nuclear-power
0
50
100
150
200
250
300
350
400
450
1970 1975 1980 1985 1990 1995 2000 2005
(年)
(百万kW) アジア アフリカ 旧ソ連 欧州 中南米 北米Asia Africa Ex-Soviet Europe Central & South America
North America (GW)
(Year)
Fig. 4-1 Trend in Global Installed Capacity of Nuclear Power Generation
Source : Japan Atomic Industrial Forum, “World Nuclear Power Plants”

IEEJ: December 2009
19
generation on a large scale. As of January 2008, there were a total of 435 nuclear reactors in
operation in 31 countries around the world, with the combined capacity of 392 GW. According to
an estimate by the IEA, electricity derived from nuclear power accounted for 6% of the
consumption of primary energy and 15% of the overall power generation. Fig. 4-1 shows the trend
in the installed capacity of nuclear-power generation.
4-2 Key to Deployment of Nuclear-power Generation
While various countries are planning to expand nuclear-power generation or introduce it for
the first time, the future deployment of nuclear power will be affected by many factors, including
the power-generation cost, the potential supply capacity and social acceptance. An overview of
these factors is below.
(1) Power-generation Cost
In Japan, the Subcommittee to Study Costs and Other Issues of the Electricity Industry
Committee under the Advisory Committee for Natural Resources and Energy conducted a cost
assessment of nuclear-power generation in 2004. According to the assessment, on the assumption
of a discount rate of 3% and a capacity utilization ratio of 80%, the cost of nuclear-power
generation is ¥5.3/kWh, lower than the costs of all other power sources, including hydroelectric
power (¥11.9/kWh), oil-fired thermal power (¥10.7/kWh), LNG-fired thermal power (¥6.2/kWh)
and coal-fired thermal power (¥5.7/kWh).
In the meantime, in 2003, the Massachusetts Institute of Technology issued a report entitled
“The Future of Nuclear Power,” which argued that from the viewpoint of cost and non-proliferation,
the U.S. government should focus its nuclear-power research and development on the once-through
fuel cycle. According to the cost comparison made in this report, the cost of nuclear-power
generation was estimated at $67/MWh, higher than the cost of coal- and gas-fired thermal power
Generation. According to a cost assessment conducted by the University of Chicago and the
Congressional Budget Office (CBO), the cost of nuclear power was also estimated to be higher
than the cost of other power sources.
As shown above, the results of cost assessment vary from country to country and from
organization to organization. The biggest point of difference between these various cost
assessments is the discount rate. Generally speaking, nuclear-power generation is notable for its
large initial investment cost and small operating cost, which means that a high discount rate is
unfavorable for nuclear-power generation. Investors’ expected return on stock and bond
investments is generally higher in the United States than in Japan. U.S. electric power companies
raise most of their necessary funds from the stock market, whereas Japanese electric power
companies depend mostly on loans from banks, mainly low-interest loans provided by
Development Bank of Japan and other lenders. This results in the difference between the discount
rates assumed in cost assessments made in Japan and the United States. In order to encourage
electric power companies to decide to invest in power sources with high initial investment costs,
such as nuclear power plants, innovative coal and gas-fired thermal power plants installed with

IEEJ: December 2009
20
CCS (CO2 capture and storage) equipment, it is essential to either clarify the advantage of nuclear
power as a low-carbon power source through carbon pricing, ensure a business condition that
would allow them to raise a large amount of funds with low risk or implement policy measures that
would support them in other ways. If a cost advantage is ensured for nuclear power, nuclear power
is likely to be deployed rapidly not only in China and India, which are already promoting
large-scale nuclear-power development plans to meet their huge electricity needs, but also in South
East Asia and the Middle East, where nuclear power has not yet been deployed.
(2) Uranium Supply-Demand Condition
In the 1970s, uranium production increased significantly and uranium prices surged amid
expectations that nuclear-power generation would grow rapidly. However, nuclear-power
generation later entered a period of stagnation worldwide and accordingly, uranium production
declined and uranium prices remained slumped at less than $20/lb. As nuclear-power generation
began to draw renewed attention in recent years, uranium prices started to rise in 2004, climbing
above $130/lb in 2007 because of concerns over supply following a mining accident, among other
factors. Although uranium prices fell back to around $60/lb later, they have been staying at
relatively high levels compared with prices during the period of stagnation for nuclear-power
generation.
Fig. 4-2 Outlook on Uranium Supply-demand until 2030
Source : Uranium supply : OECD/NEA, “Uranium 2007” Uranium demand : Estimate by the authors
40
50
60
70
80
90
100
110
120
130
2007 2010 2015 2020 2025 2030
123
118
87 89
8381
54
68
69
87
98
Uranium demand(baseline case)
Uranium supply(Existing projects+projects
set for implementation)
Uranium supply capacity(Existing projects+projects setfor implementation+projects
under consideration)
1,000 tU
117
96
121
91
Uranium demand(high-growth case)

IEEJ: December 2009
21
Therefore, investment in uranium resource development is rapidly becoming active, with the
global investment amount growing from approximately $100 million around 2000 to nearly $10
billion in 2007. As a result, uranium production is expected to increase significantly. In 2006, the
global volume of uranium production stood at 40,000 tons U, equivalent to only around 60% of the
global needs, and the supply gap was filled with uranium released from stockpiles and extracted
from dismantled nuclear warheads. However, according to “Uranium 2007,” a report prepared by
the OECD Nuclear Energy Agency, the annual uranium production capacity is estimated to increase
to 96,000 tons U in 2015 as long as additional production from development projects that have
already been given the go-ahead is taken into consideration; and this figure will grow further to
117,000 tons U if additional production from projects in the planning stage is also included.
Meanwhile, as will be addressed later, the global installed capacity of nuclear-power
generation is estimated to grow to approximately 571 GW by 2030 under our baseline scenario and
to approximately 724 GW under the high-growth scenario. The annual volume of uranium demand
is estimated to grow to 98,000 tons U by 2030 under the baseline scenario and to 121,000 tons
under the high-growth scenario on the assumption of the average capacity utilization ratio of
around 80%, the average reloading fuel burn-up (average heat value per one ton of uranium input)
of 42GWd/t, a uranium concentration ratio (concentration of enriched uranium U235 added to
nuclear fuel) of 3.7%, a tail concentration (concentration of remnant U235 generated in the
enriching process) of 0.3% and a heat efficiency of 34%. Fig. 4-2 indicates trends in the estimated
uranium demand and the uranium supply capacity projected in “Uranium 2007.”
As shown in Fig. 4-2, surplus supply capacity of 36,000 tons U and 32,000 tons U will arise
under the baseline scenario and under the high-growth scenario, respectively, if the uranium
supply-demand condition eases in the medium- to long-term as a result of the ongoing moves to
expand production rapidly and if development projects now at the planning stage start to proceed
smoothly by 2020. Therefore, the uranium supply-demand balance is not likely to emerge as a
major constraining factor for future development of nuclear-power generation. However, there is a
risk of the uranium supply-demand condition tightening in the future if development projects now
at the planning stage fail to proceed smoothly due to a fallback in uranium prices or other factors.
(3) Situation Surrounding Plant Construction and Equipment Supply
As mentioned in 4-1, many nuclear power plants were constructed in the 1970s and 1980s,
mainly in the United States and Europe. The number of new plant start-ups peaked in 1985, and
since the 1990s, nuclear-power generation has faced a period of stagnation. Fig. 4-3 shows the
trends in the number of new plant start-ups and the expected number of decommissioned plants
based on the assumption of a plant longevity of 40 years from the start-up of operation. As shown
in this figure, for a long period of time from around 2015, plants with a combined capacity of
around 5GW to 10GW or more are expected to be decommissioned annually. If the installed
capacity of nuclear-power generation is to be expanded, it will be necessary to build new plants at a
sufficient pace to more than offset the decline expected by the decommissioning.

IEEJ: December 2009
22
Fig. 4-3 Start-up Years of Existing Nuclear Reactors
Source : Japan Atomic Industrial Forum, “World Nuclear Power Plants”
In the meantime, as orders for new nuclear reactors for commercial power generation have
been sluggish since the 1990s, there has been consolidation among nuclear power plant
manufacturers, resulting in a situation in which a small number of plant manufacturers capable of
offering plant concepts and design know-how with high levels of cost efficiency and reliability
dominate the market. As of 2009, the only global plant manufacturers that have international
competitiveness are three Japanese companies (Mitsubishi Heavy Industries, Ltd., Toshiba
Corporation and Hitachi Ltd.),Westinghouse Electric Corporation of the United States, which is
owned by Toshiba, General Electric Company of the United States, which has formed a partnership
with Hitachi, Areva of France, ROSATOM of Russia and AECL of Canada. These companies
downsized their nuclear-power business during the slump in nuclear plant construction. Their plant
construction capacity is expected to grow gradually as they increase their workforces again.
However, it will likely be difficult for them to sharply expand the construction capacity at an early
date given the need to secure adequate personnel.
In addition to expertise in plant design and construction, nuclear-power generation requires
many special and sophisticated equipment and components, and only a limited number of
companies can supply such equipment and components. In the most prominent instance, Japan
Steel Works, Ltd. is said to be the world’s only company that is capable of producing high-quality,
large forgings for nuclear reactor pressure vessels, and some people predict that the limited supply
capacity of such forgings will constrain the global capacity of nuclear plant construction. In light of
the above, the number of new nuclear power plants that can be constructed is expected to be limited
at least over the next 10 years or so, and the plant construction capacity is likely to virtually set the
upper limit on the installed capacity of nuclear power. However, from a long-term perspective
0
5
10
15
20
25
30
35
40
45
1960 1970 1980 1990 2000 2010 2020 2030 2040 2050
(GW)
Start-up years ofexisting nuclear reactors
Expected years of decommissioningon the assumption of a 40-year
reactor life

IEEJ: December 2009
23
stretching as far ahead as 2050, the power-generation capacity may expand at a faster pace than in
the 1970s if nuclear power deployed to the maximum possible extent and plant and equipment
manufacturers increase their manufacturing capacity sufficiently to meet the needs. In particular,
China aims to secure technology transfers from other countries so that it can foster a domestic
industry capable of building nuclear power plants on its own. In order to ensure that nuclear-power
generation is deployed in many more countries around the world, it will be necessary to enable
countries that do not have a plant construction capacity to design and build plants on their own.
4-3 Outlook on Future Deployment
4-3-1 Plans for Deployment by Region
We can provide a rough estimate of nuclear power deployment over a period extending to
around 2030 based on policy measures and estimates announced by individual countries. The
figures cited below are based on an assumption of a global average capacity utilization ratio that is
around 80% for nuclear power plants.
(a) Americas
In the United States, although no new nuclear reactor has been started up since the Watts Bar
Nuclear Plant Unit 1 started operation in 1996, the government has established a legislative
framework for supporting the construction of nuclear power plants, with more than 30 new plants
planned. However, as not all of them are likely to be actually constructed, the installed capacity of
nuclear-power generation will be expanded only on a limited scale. Meanwhile, Canada, which is
well experienced in nuclear-power generation and has its own plant technology, has a plan to
increase its power-generation capacity gradually.
Mexico, Brazil and Argentina also have nuclear reactors in operation, and they are expected to
build more plants.
(b) Europe and Former Soviet Union
While the installed nuclear-power capacity is expected to increase in France, the United
Kingdom and Finland, Germany, Spain, Sweden and Belgium have adopted the policy of phasing
out nuclear power. However, there are moves to review this policy amid growing awareness about
global warming. In Europe as a whole, the installed nuclear-power capacity is expected to continue
decreasing slightly until 2030.
Russia, with its own light-water nuclear technology, is far advanced in nuclear-power
generation, and it not only plans to build a large number of new nuclear plants on its territory but
also aims to sell nuclear reactors to other countries. Among the former Soviet republics, Ukraine is
building a new nuclear reactor. Kazakhstan, which is rich in uranium reserves and actively
developing its nuclear-power industry, is also expected to build new nuclear plants.
(c) Middle East and Africa
In the Middle East, many countries, including the UAE, Jordan and Saudi Arabia, are starting

IEEJ: December 2009
24
to consider deploying nuclear power. However, as no detailed plans have been drawn up, we
assume that none of the nuclear plants now under consideration will start operation until 2030 and
that the two Bushehr reactors under construction in Iran will be the only reactors to have started
operation by then in this region. In Africa, South Africa, which has the region’s only nuclear reactor
in operation, is expected to increase its installed nuclear capacity sharply in the future. Among
other countries, Egypt is considering building a new reactor but has not announced a detailed plan.
(d) Asia
China has drawn up a large-scale nuclear-power development plan in response to the rapidly
growing electricity demand, and it is already constructing nuclear power plants. The plan, which
calls for the construction of plants with a combined capacity of 40GW by 2020, has a fair chance of
being realized. Although an even more ambitious target has been set, we estimated China’s future
installed capacity mostly based on the development plan.
India has until recently focused on the development of nuclear-power generation using its own
technology, intended to establish a thorium cycle. India has received a very limited degree of
support from other countries because it conducted nuclear tests and refuses to accede to the Nuclear
Non-proliferation Treaty (NPT). However, by taking advantage of the signing of a nuclear
cooperation treaty with the United States, India is planning to promote the development of
nuclear-power generation on a large scale using imported light-water reactors. The success of this
plan will depend on political negotiations on the domestic and diplomatic fronts. We estimated the
country’s future installed capacity on the assumption that nuclear power will be introduced
according to this plan.
In Southeast Asia, although Thailand, the Philippines, Malaysia, Indonesia and Vietnam plan
to deploy or introduce nuclear power, the implementation of their plans are likely to be delayed and
the pace of deployment is expected to vary from country to country.
We assume that the installed capacity in Japan and South Korea will increase mostly
according to their plans. As for Taiwan, we assume that the country’s plan to phase out nuclear
reactors in operation will be delayed.
4-3-2 Outlook on Development of Nuclear-power Generation Worldwide
The development of nuclear-power generation around the world is expected to proceed
steadily, led by Asia, with the installed capacity projected to grow from 387 GW at the end of 2006
to 504 GW in 2020 and to 571 GW in 2030. The volume of electricity generated by nuclear power
is projected to increase from 2,800 TWh/year in 2005 to 4,200 TWh/year in 2030. However, as the
volume of electricity generated by natural gas- and coal-fired thermal power is set to increase more
steeply, the ratio of electricity generated from nuclear power is expected to decline from around
15% in 2005 to around 12% in 2030. This means that under the existing policy framework, the
greenhouse gas emission reduction effect to be gained from an increase in nuclear-power
generation will be limited, making it necessary to implement more aggressive measures. Table 4-1
shows the expected trend in the global installed capacity over the period to 2030.

IEEJ: December 2009
25
Table 4-1 Future Outlook on the Global Installed Capacity of Nuclear-power Generation
By 2030, the global installed capacity of nuclear power is estimated to increase by 185 GW.
Of that amount, Asia will account for 124 GW, equivalent to a capacity of around 100 reactors.
This number includes reactors to be built in countries that already have nuclear plants, such as
China, India, South Korea, Japan and Taiwan, as well as countries planning to deploy nuclear
power for the first time, including Thailand and Vietnam. The number of countries operating
commercial nuclear power plants in 2030, including the latter countries, is expected to increase to
more than 40 from 31 in 2006. As the use of nuclear-power generation spreads worldwide, it will
become more important than ever to tackle such issues as assurance of nuclear plant safety, stability
of uranium fuel supply and nuclear non-proliferation.
Among other organizations, the IEA forecasts in “World Energy Outlook 2007 - China and
India Insights” that the global installed capacity of nuclear power will grow to 415 GW by 2030. In
“Energy, Electricity and Nuclear Power Estimates for the Period up to 2030,” the IAEA assumes
that the global installed capacity will grow to 691 GW by 2030 in the “high case” and 447 GW
under the “low case.” According to “The Global Nuclear Fuel Market Supply and Demand
2007–2030,” compiled by the World Nuclear Association (WNA), the global installed capacity will
grow to 529 GW by 2030 in the reference case, to 730 GW in the high case and to 285 GW in the
low case. As the prospects for nuclear-power generation beyond 2030 are mostly uncertain, it is
difficult to predict specifically what the status of development will be like. In terms of
technological advance, in addition to existing reactors and their advanced versions known as
evolutionary third-generation light-water and heavy-water reactors, new types of reactors may be
deployed, starting in the 2020s in the case of small- and medium-scale reactors starting and in the
2040s in the case of fourth-generations reactors such as the fast-breeder reactor (FBR). However,
other nuclear power-generation technologies (e.g., thorium cycle and nuclear fusion) have little
chance of being commercialized by 2050.
According to the IEA’s “Energy Technology Perspectives 2008,” the global installed capacity
of nuclear power will grow to 570 GW by 2050 under the Baseline scenario, to 1,250 GW under
the BLUE Map scenario and to 2,000 GW under the BLUE Map hiNUC scenario. The BLUE Map
scenario assumes that 30 GW of new capacity will be added annually from 2009 onward. However,
in light of the time needed for plant construction and the construction capacity of plant
manufacturers, this assumption appears to be somewhat unrealistic. Nonetheless, if the global
installed capacity of nuclear power is expanded significantly and the supply capacity is
strengthened, a sharp increase like this may be feasible after 2030.
Based mainly on forecasts (for the period leading up to 2030) made by the Institute of Energy
Economics, Japan, we have come up with the following three scenarios while taking into
2006 2010 2020 2030
Installed capacity(GW)
387.0 403.0 504.4 571.0

IEEJ: December 2009
26
consideration forecasts by other organizations and various variable factors.
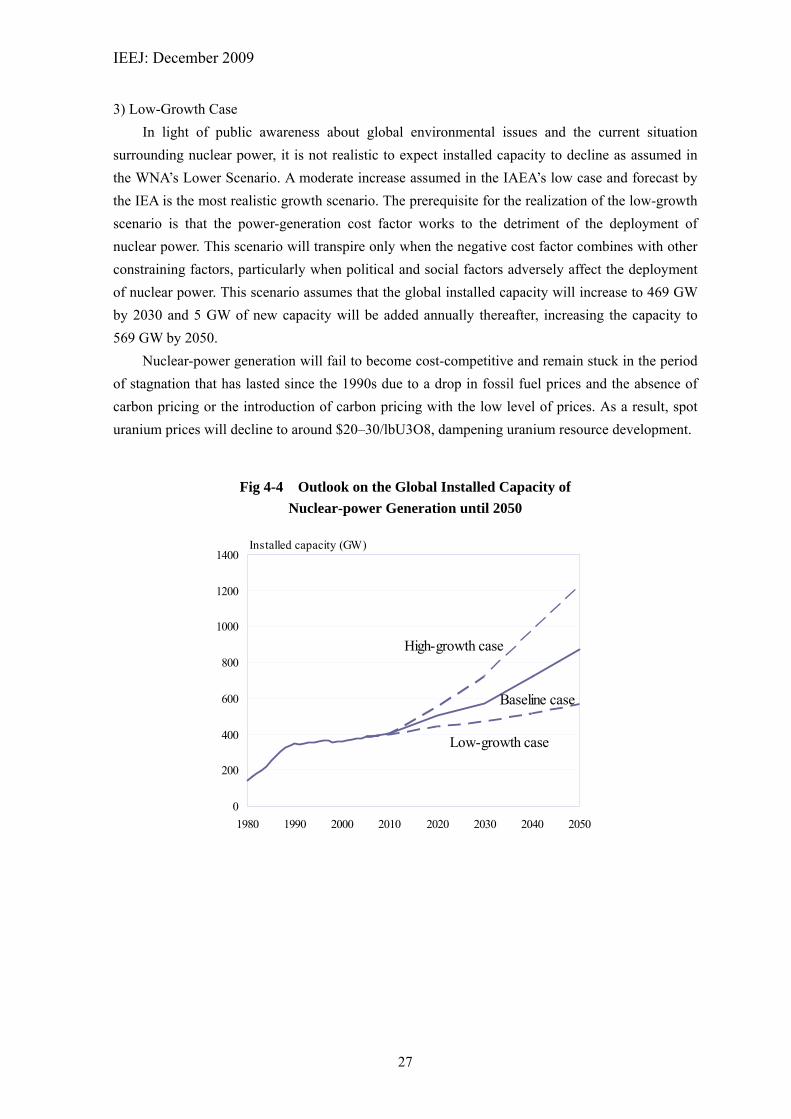
1) Baseline Case
In accordance with a forecast by the Institute of Energy Economics, Japan, the global installed
capacity will grow to 571 GW by 2030 and 15 GW of new capacity will be added annually
thereafter, boosting the global installed capacity to 871 GW by 2050. This scenario reflects a
situation in which the power-generation cost factor mostly works to support the spread of
nuclear-power generation while the plant and equipment supply factor sets the limits on capacity
installation.
In this case, governments will support the deployment of nuclear-power generation out of
consideration for global environmental issues, and an upsurge in fossil fuel prices and the
introduction of carbon pricing will prompt the construction of nuclear plants on a large-scale
around the world. In major electricity-consuming countries like China and India, the installed
capacity of nuclear power will show a particularly sharp increase, and the construction of new
plants will proceed steadily in advanced nuclear power countries such as Japan, the United States
and Russia. The policy of phasing out nuclear power, adopted by some European countries, will be
reversed, or plant closures will be delayed substantially. Moreover, as a result of active financial
and technical support provided by developed countries, Southeast Asian countries that are
preparing to implement nuclear-power development plans, such as Vietnam and Thailand, will
begin operations of reactors around 2020 or later, and Middle East countries will also introduce
nuclear-power generation, leading to an increase in the global installed capacity. Because of the
increase in the installed capacity, uranium prices will stay at a relatively high level of $60/lbU308
or more, prompting active uranium resource development.
2) High-Growth Case
In the IAEA’s “high case,” the global installed capacity will grow to around 700 GW by 2030.
If this scenario is to transpire, the power-generation cost factor should support the spread of nuclear
power and the plant and equipment supply factor should impose no constraint, thereby maximizing
the deployment of nuclear power. The installed capacity will increase to 725 GW by 2030 and
25GW of new capacity will be added annually thereafter, increasing the capacity to 1,225 GW by
2050.
This case assumes that countries around the world, including both developed and developing
countries, will introduce nuclear-power generation on a large scale because the advantage of
nuclear-power generation in terms of policy support and cost assumed in the baseline case will be
maintained. At the same time, it will also be necessary for construction of nuclear power plants to
increase significantly, especially after 2030, not only in advanced nuclear power countries but also
in emerging countries like China and India, leading to an unprecedented pace of growth in nuclear
plant construction worldwide.
IEEJ: December 2009
27
3) Low-Growth Case
In light of public awareness about global environmental issues and the current situation
surrounding nuclear power, it is not realistic to expect installed capacity to decline as assumed in
the WNA’s Lower Scenario. A moderate increase assumed in the IAEA’s low case and forecast by
the IEA is the most realistic growth scenario. The prerequisite for the realization of the low-growth
scenario is that the power-generation cost factor works to the detriment of the deployment of
nuclear power. This scenario will transpire only when the negative cost factor combines with other
constraining factors, particularly when political and social factors adversely affect the deployment
of nuclear power. This scenario assumes that the global installed capacity will increase to 469 GW
by 2030 and 5 GW of new capacity will be added annually thereafter, increasing the capacity to
569 GW by 2050.
Nuclear-power generation will fail to become cost-competitive and remain stuck in the period
of stagnation that has lasted since the 1990s due to a drop in fossil fuel prices and the absence of
carbon pricing or the introduction of carbon pricing with the low level of prices. As a result, spot
uranium prices will decline to around $20–30/lbU3O8, dampening uranium resource development.
Fig 4-4 Outlook on the Global Installed Capacity of
Nuclear-power Generation until 2050
0
200
400
600
800
1000
1200
1400
1980 1990 2000 2010 2020 2030 2040 2050
Installed capacity (GW)
High-growth case
Baseline case
Low-growth case
IEEJ: December 2009
28
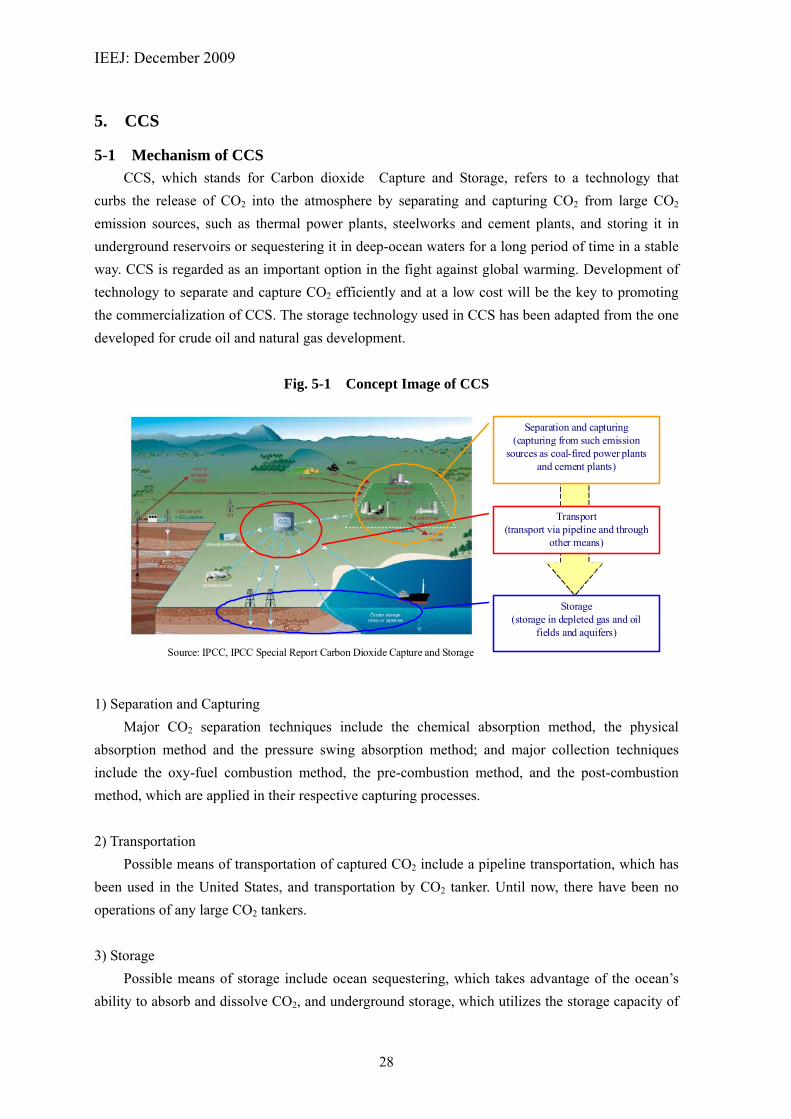
5. CCS
5-1 Mechanism of CCS
CCS, which stands for Carbon dioxide Capture and Storage, refers to a technology that
curbs the release of CO2 into the atmosphere by separating and capturing CO2 from large CO2
emission sources, such as thermal power plants, steelworks and cement plants, and storing it in
underground reservoirs or sequestering it in deep-ocean waters for a long period of time in a stable
way. CCS is regarded as an important option in the fight against global warming. Development of
technology to separate and capture CO2 efficiently and at a low cost will be the key to promoting
the commercialization of CCS. The storage technology used in CCS has been adapted from the one
developed for crude oil and natural gas development.
Fig. 5-1 Concept Image of CCS
1) Separation and Capturing
Major CO2 separation techniques include the chemical absorption method, the physical
absorption method and the pressure swing absorption method; and major collection techniques
include the oxy-fuel combustion method, the pre-combustion method, and the post-combustion
method, which are applied in their respective capturing processes.
2) Transportation
Possible means of transportation of captured CO2 include a pipeline transportation, which has
been used in the United States, and transportation by CO2 tanker. Until now, there have been no
operations of any large CO2 tankers.
3) Storage
Possible means of storage include ocean sequestering, which takes advantage of the ocean’s
ability to absorb and dissolve CO2, and underground storage, which utilizes the storage capacity of
Source: IPCC, IPCC Special Report Carbon Dioxide Capture and Storage
Separation and capturing(capturing from such emission
sources as coal-fired power plantsand cement plants)
Transport(transport via pipeline and through
other means)
Storage(storage in depleted gas and oil
fields and aquifers)

IEEJ: December 2009
29
such underground reservoirs as depleted gas fields and aquifers.
CCS may enable the reduction of CO2 emissions at a relatively low cost, and it may also bring
about commercial gains by contributing to enhanced oil recovery (EOR) in some cases. On the
other hand, there are various criticisms and concerns, such as that CCS will impose an additional
cost, that it will promote the use of fossil fuels, that input of additional energy will become
necessary and that stored CO2 may leak into the atmosphere.
5-2 Major Activities by Individual Countries
5-2-1 Major CCS Projects
Currently, several commercial CCS projects are under consideration. These projects are
motivated by the following four factors.
(i) Proximity to Storage Reservoirs
There is a rich database of possible storage reservoirs, including depleted fields and aquifers,
that are located near the CO2 emission source (e.g., Sleipner, In Salah, Weyburn and Gorgon
projects).
(ii) Low Separation and Capturing Cost (no need for significant additional investment)
The separation and capturing cost is low because an existing gasification plant that separates
CO2 during the gasification process is used, eliminating the need for additional significant
investment (e.g., Sleipner, In Salah and Weyburn projects).
(iii) Expected Contribution to Enhanced Recovery of Oil and Gas
The injection of CO2 is expected to contribute to an increase in oil and gas production, which
will generate additional profits (e.g., Weyburn project).
(iv) CO2 Reduction Incentive Arising from Carbon Tax, Emission Credit Trading, etc.
The imposition of a carbon tax or the introduction of CO2 emission credit trading provides an
economic incentive for reducing CO2 emissions (e.g., Sleipner project).
Of the CCS projects, the Snovit project was abandoned, as it was judged to be incapable of
achieving the original profit target and unfeasible in terms of cost. With regard to other projects
under consideration, attention should be paid to external factors such as energy prices and the
possible introduction of a carbon tax, as well as the results of feasibility studies. There are also
commercial projects for the storage of CO2 emitted from coal-fired thermal power plants, including
the Zerogen-Stanwer project (starting in 2012 in Australia), the Saskpower project (starting in 2012
in Canada), the FutureGen project (starting in 2012 in the United States), the RWE project (starting
in 2014 in Germany) and the RWE Tilbury project (starting in 2016 in the United Kingdom).

IEEJ: December 2009
30
Table 5-1 Major CCS Projects
Source : IPCC, IPCC Special Report Carbon Dioxide Capture and Storage and RITE, CO2 Storage Technology (2006)
5-2-2 Details of Major Projects
1) Sleipner (Norway)
This project, which captures CO2 emitted from natural gas production facilities, has stored one
million tons of CO2 annually since 1996. It has now grown into a major international CCS project,
and the storage status is being monitored. Until now, no leakage of CO2 has been observed. This
project is expected to contribute to the accumulation of experiences and know-how useful for
addressing the key issues for future commercialization of CCS, including storage safety and
monitoring method.
Fig. 5-2 Location of the Sleipner Project
Starting year Project Name Country CO2 emission source Storage reservoir typeInjected volume
(10,000 t-CO2/year)Participating companies
1996 Sleipner Norway Natural gas productionOcean aquifer above a
gas field100 Statoil
2000 Weyburn CanadaCoal gasification plant (transport
via a 350 km pipeline)Depleted oil field
(EOR)100
Petroleum Technology ResearchCenter (Canada)
2004 In Salkh Algeria Natural gas production Gas field 120Sonatrack、BP、
Statoil
2007 Snovit Norway LNG plant Aquifer 70 Statoil
2008 Gorgon Australia Natural gas production Aquifer 500 Chebron、Exxon Mobil、Shell
2010 Draugen NorwayNatural gas-fired power plant,
methanol plantDepleted oil field
(EOR)250 Shell、Statoil
2010Miller-Peterhead
DF1U.K. Hydrogen combustion turbine
Depleted oil field(EOR)
180BP、ConocoPhilips
Shell、Scottish and SouthernEnergy
2011 Carrson DF2 U.S. Oil pitch-based IGCCDepleted oil field
(EOR)400 BP、Edison Mission Group
Sleipner gas field
Source : IEA, Natural Gas Information 2006

IEEJ: December 2009
31
2) Weyburn Project (Canada)
This project separates CO2 from a synthesis gas plant in the U.S. state of North Dakota and
transports it through a 350 km pipeline for injection into an oil field in the Canadian province of
Saskatchewan for the purpose of enhanced oil recovery. Since 2001, 5,000 t-CO2 of CO2 per day
has been injected. At this oil field, which was discovered in 1955, a total of 335 million barrels of
crude oil have been recovered, and the injection of CO2 is expected to lead to an additional
production of at least 122 million barrels. About half of the injected CO2 is recovered along with oil
for reuse, with the other half sequestered underground. Stored CO2 is being monitored through
international cooperation.
Fig. 5-3 Location of the Weyburn Project
Source : IEA, Natural Gas Information 2006
5-2-3 Individual Countries’ CCS Policies
1) United States
The Department of Energy has announced a carbon-sequestering technology roadmap for
technology development in the period leading up to 2012. In 2003, the Carbon Sequestering
Leadership Forum was established under the U.S. leadership for international exchanges of
information. In the same year, President Bush announced a budget allocation of $1 billion for the
construction of a zero-emission coal gasification power plant under the FutureGen project.
2) EU
With a view to achieving zero emission for thermal power plants using fossil fuels by 2020,
the European Commission is conducting a study on the reduction of the CO2 separation and
capturing cost and the stability and reliability of CO2 storage, and drawing up a map of potential
CO2 storage sites while seeking to improve the efficiency of thermal power plants. Moreover, new
Saskatchewan
North Dakota

IEEJ: December 2009
32
thermal power plants are expected to be required to be installed with CCS equipment.
3) Japan
Research and development are underway under the leadership of the Research Institute of
Innovative Technology for the Earth (RITE). In 2005, the government drew up the Technology
Strategy Map for CO2 Fixation, which set forth a roadmap toward the establishment of
underground storage technology by 2015. In 2006, the global environment subcommittee of the
environmental committee under the Industrial Structure Council announced CCS 2020, Japan’s first
policy paper on CCS. CCS 2020 estimated the potential underground storage capacity at 5.2 billion
tons, forecast that the potential volume of CO2 storage in aquifers would increase after further
exploration and recommended that efforts be made to further reduce the CCS cost in Japan, which
ranges from ¥5,000/t-CO2 to more than ¥10,000/t-CO2.
4) International Framework
The 1996 guidelines set by the Intergovernmental Panel on Climate Change (IPCC), for which
the Kyoto Protocol serves as the basis, does not recognize the use of CCS as a CO2 reduction
measure. At the First Session Conference of the Parties Serving as the Meeting of the Parties to the
Kyoto Protocol, issues related to CCS were debated, and project boundaries, leakage and
permanence were recognized as major issues. Currently, debate is ongoing as to whether or not
CCS should be recognized as a Clean Development Mechanism (CDM), with a conclusion
expected to be reached by the end of 2009. Canada has drawn up the CO2 Capture & Storage
Technology Roadmap (CCSTRM), while Australia has announced a CCS technology development
roadmap for the next 30 years.
5-3 Current Status and Outlook of CCS in Japan
5-3-1 Potential Storage Capacity
In a report written by RITE, geological strata are classified according to their geological
features into Category A (storage in anticline) and Category B (storage in geological structures with
a stratigraphic trap). Table 5-2 indicates the potential storage capacity in Japan estimated for each
category. This report shows not only the potential storage capacity in the whole of Japan but also
the estimated nationwide distribution of the storage capacity. The estimate of the distribution is
based on the following premises:
Potential storage reservoirs should be located near areas where medium-size or large emission
sources are concentrated.
Potential storage reservoirs should be located where sedimentary rocks formed in the Tertiary
and Quarternary periods are distributed.
Geological strata comprised of layers of mudstone and siltstone on top of a thick layer of sand
should be identified as candidates for storage reservoirs.
The side boundary of the storage reservoir should meet either of the following conditions:

IEEJ: December 2009
33
*Has a geological structure suited for tratigraphic trap;
*Constitutes a boundary at less than 800 meters underground and at less than 200 meters under
water; and
*Constitutes a clear fault zone.
The storage capacity should be calculated in volume terms based on the volume of the
identified storage reservoirs and according to various parameters.
Table 5-2 CCS Potential in Japan
Geological data Category A
(Storage in an anticline structure)
Category B (Storage in a structure with
a stratigraphic trap)
Oil and gas field
Rich data on wells and seismic exploration available
A1 3.5 billion t-CO2
Basic test boring
Data on wells and seismic exploration available
A2 5.2 billion t-CO2
B1 27.5 billion t-CO2
Basic geophysical exploration
No data on wells, data on seismic exploration available
A3 21.4 billion t-CO2
B2 88.5 billion t-CO2
Concept image of storage
Total 30.1 billion t-CO2 116 billion t-CO2 Grand total 146.1 billion t-CO2
*Inland-area valleys and inland bays (e.g., Seto Inland Sea, Osaka Bay and Ise Bay) are not included. *Geological strata eligible for CCS are those more than 800 meters underground and those less than 400 meters under water
Source : RITE, “Report on Results of Research and Development of Underground Storage Technology for Carbon Dioxide, 2007”
Well Well

IEEJ: December 2009
34
Fig. 5-4 Distribution of Storage Reservoirs in Japan
Source : RITE, “Report on Results of Research and Development of Underground Storage Technology for Carbon, 2007”
We herein show the distribution of coal-fired thermal power plants, steelworks and cement
plants as large CO2 emission sources where CCS is expected to be introduced. As shown in Fig. 5-5,
large CO2 emission sources are distributed mainly in industrial zones in coastal regions. In the
Kanto region, regarded as the largest emission source region, nearly 100 million tons of CO2 are
emitted annually.
In order to assess the total potential storage capacity in Japan, it is necessary to match each
CO2 emission source with a storage reservoir. For example, the Category A storage reservoirs
closest to the Kanto region are located off Hamamatsu in Shizuoka Prefecture and off Miyagi,
which means that 100 km to 200 km of transportation will be necessary to store CO2 emitted in the
Kanto region in a Category A storage reservoir.
Basic geophysical exploration line
A-2
A-3
A-2/3 (excl. conditions related to depth and lithofacies)
Ocean boundary
B-1 (dissolved-in-water gas field) B-2 (with stratus thickness of more than 800 m)
Depth under water (less than 200 m)
Depth under water (less than 1,000 m)
Areas near large and medium-size emission sources
A well and geophysical exploration line Microtremor array observation point
Area for the calculation of potential storage capacity
Major large storage reservoir candidate sites Onshore Yoshii-Higashikashiwazaki gas field: 0.8 billion t-CO2 Nagaoka-Katagai coal-bed gas field: 0.21 billion t-CO2 Offshore Off Kashima-Soma: 6.97 billion t-CO2 Onshore dissolved-in-water gas field Southern Kanto gas field: 22.68 billion t-CO2 The total potential is estimated at 146.1 billion t-CO2. (Another organization estimates the total potential at 1.5 billion t-CO2.)

IEEJ: December 2009
35
Fig. 5-5 Distribution of Large CO2 Emission Sources and Storage Reservoirs
Source : RITE, “Report on Results of Research and Development of Underground Storage Technology for Carbon, 2007”
5-3-2 Current CCS Cost
RITE is implementing model projects to assess the CCS cost in Hokkaido and Niigata.
Table 5-3 Storage Costs (Hokkaido)
Note : The price unit is ¥/t-CO2 Source : RITE, “Report on Results of Research and Development of Underground Storage Technology for Carbon, 2007”
We herein show the concept of practical use of CCS by describing seven systems, including a
steelworks and a thermal power plant. Table 5-3 shows the cost of each system in the model
projects.
The model analysis results indicate that it is very important to select the combination of a CO2
separation and capturing site and a CO2 injection site so as to minimize the transportation distance,
because transportation using a pipeline is costly in Japan. Meanwhile, as the separation and
capturing cost accounts for a significant portion of the total cost, it will be necessary to maintain a
high utilization ratio of CO2 generation equipment and reduce the cost through technology
Total: 539 million t-CO2/year Number of plants: 161 Average: 3.3 million t-CO2/year per plant Maximum: 24 million t-CO2/year per plant
[Scale]
Structure
A-2
A-3
A-2/3 (excl. conditions related to depth and lithofacies)
B-1 (dissolved-in-water gas field)
Hokkaido (15 power plants; 3
steelworks)
Tohoku (Sea of Japan coast) (24 power plants)
Southern Tohoku (Pacific coast)
(35 power plants)
Chubu (Sea of Japan coast) (10 power plants)
Kanto (Pacific coast)
(20 power plants; 13 steelworks)
Tokyo Bay (72 power plants; 32
steelworks)
Ise Bay (49 power plants; 11
steelworks)
Osaka Bay (31 power plants; 19
steelworks)
Seto Inland Sea (34 power plants; 41
steelworks) Northeastern Kyushu (34 power plants; 41
steelworks)
Northwestern Kyushu (25 power plants)
From C steelworks toTomakomai
From F steelworks toTomakomai
From D steelworks toTomakomai
From A thermal plant tothe seas off Mukawa
From 3 emission sourcesto 2 injection sites
Unit
Storage volume 100 100 100 100 234 10,000 t-CO2/year
Separation & capturing 4,170 4,140 3,130 4,120 4,000
Pressurizing 1,710 1,390 1,840 1,640 1,810
Transport 2,760 820 590 220 1,410
Injection 1,360 1,340 2,130 1,100 1,240
Total 10,000 7,700 7,680 7,080 8,460
V/t-CO2¥/t-CO2

IEEJ: December 2009
36
development.
We compared the cost estimated on the assumption of 100 km of transportation and a storage
volume of one million t-CO2/year, the cost indicated by a model project and the estimated cost in a
case where assumptions of the model project were altered. As a result, we found that the CCS cost
in Japan is higher than the emission credit price on the European Climate Exchange (ECX).
The assumptions of the estimated costs used in the above cost comparison are as follows:
◆ Estimate by the Institute of Energy Economics, Japan (100km):100 km of pipeline
transportation
◆ Hokkaido model:8.4 km of pipeline transportation
◆ Hokkaido model (based on the target cost):The separation and capturing cost is reduced to the
government’s target of ¥2,000/t-CO2.
◆ Reference (transportation by sea):The terms of transportation in the above target cost-based
model is changed to 1,000 km of transportation by sea.
Fig. 5-6 Comparison of CCS Storage Costs
Note : Regarding the IEEJ estimate for a 100 kilometer pipeline transport and the reference case (transport by sea), the pressurizing cost is included in the transport cost Source : RITE, “Report on Results of Research and Development of Underground Storage Technology for Carbon, 2007” and other materials
RITE estimated the CCS cost by taking into consideration the matching of emission sources
and storage reservoirs across Japan. The process of the estimation is as follows:
We calculated the travel distance between each CO2 emission source and storage reservoir by
identifying the shortest route between them on the basis of such data as the location of the emission
source, the annual emission volume and the location, depth and capacity of the storage reservoir on
the assumption that the two sites will be linked through an underground pipeline built along roads.
We also developed a model for minimizing the cost of transporting CO2 from the emission source
3,3594,120
2,000 2,000
1,640
1,640
3,609
220
220 3,320
937
1,1001,100
1,100
0
2,500
5,000
7,500
10,000
IEEJ estimate (100 km) Hokkaido model Hokkaido model (basedon the target cost)
Reference (transport bysea)
\/t-CO2
Separation & capturing Pressurizing
Transport Injection
Current averageprice on theexchange: 25euros/t-CO2
7,905
7,080
4,960
6,420

IEEJ: December 2009
37
to the storage reservoir and injecting CO2 and identified the cost and storage potential curves. Then,
we calculated the transportation and injection costs for each pair of emission source and storage
reservoir. The costs are calculated for each of the separation, capturing, pressurizing, transportation
and injection processes and expressed as functions of the annual CO2 processing volume. The
volume of CO2 emitted in each process is also expressed as a function of the annual CO2 processing
volume. Through these calculation processes, we eventually arrived at the CCS avoided cost. The
results of the calculation are as shown in Fig. 5-7.
Fig. 5-7 CCS Cost Curve (up : RITE estimate; down : concept graph)
Cos
t (¥1
,000
/t-C
O2)
CO2 storage volume (109t-CO2)
Existing capturing technology: 500,000 t-CO2/year per well
Future capturing technology: 500,000 t-CO2/year per well
Existing capturing technology: 200,000 t-CO2/year per well
Future capturing technology: 200,000 t-CO2/year per well
Existing capturing technology: 200,000 t-CO2/year per well
Existing capturing technology: 500,000 t-CO2/year per well
Future capturing technology: 200,000 t-CO2/year per well
Future capturing technology: 500,000 t-CO2/year per well In the case of the use of Categories A2
and A3 storage reservoirs
CO2 storage volume (100 million tons/year)
Cost(\/t-CO2)
10,000
5,000
ECX25€/t-CO2
In cases where the storage volumeis small
(Stored at a site near the CO2emission source)
In cases where the storage volume is large(Storage at distant sites to be increased)
Source : RITE, “Report on Results of Research and Development of Underground Storage Technology for Carbon, 2007”and other materials

IEEJ: December 2009
38
Consequently, the CO2 reduction cost is expected to exceed ¥10,000/t-CO2 if the storage
volume surpasses around 90 million t-CO2 /year. The cost is expected to be roughly halved through
technology development. The emission credit price on the ECX in 2004 to 2008, cited as a
reference, is about 25 euros/t-CO2 or about ¥4,000/t-CO2.
In light of the above, the separation and capturing cost accounts for most of the CO2 storage
cost, making it essential to reduce the separation and capturing cost and ensure an optimal
matching of emission sources and storage reservoirs. In addition, the cost of CO2 reduction made
through CCS in Japan is apparently higher than the cost in Europe.
5-3-3 Future Outlook
We estimated a feasible potential CCS capacity based on the viable storage ratio for each
category of geological strata that was assumed on the basis of RITE’s category-wise storage
potential. We assumed a storage period of 100 years, although there is no firm international
consensus on the storage period.
Based on the above assumptions, the CCS potential is estimated at approximately 150 million
t-CO2/year (equivalent to around 10% of the total potential of 146.1 billion t-CO2). This is
equivalent to around 80% of CO2 emitted by electric power companies in fiscal 2006 and around
11.5% of CO2 emitted by all sectors.
Fig. 5-8 CO2 Emission Volume and the Estimate CCS Potential in Japan
Source : Institute of Energy Economics Japan, Handbook of Energy and Economic Statistics
0
4
8
12
16
Total Derived from coal
Total for all sectors Electric power companies
Derived from gasDerived from oil
Derived from coal
Estimate of the CCS potential(0.146 billion t-CO2/year)
Equivalent to 11.5% of totalemissions from all sectors
Billion t-CO2/year
Calculation method *To set an assumed ratio of viable storage to the potential storage capacity for each category as defined by RITE. (A1: 80%, A2: 50%, A3: 30%, B1: 10%, B2: 0%) *Storage period The storage-monitoring period is assumed to be 100 years.

IEEJ: December 2009
39
5-4 Status and Outlook of CCS Worldwide
5-4-1 Potential Storage Capacity
Several organizations, including the IPCC, have announced estimates of the global CO2
storage potential. Geologically, the storage potential is estimated at approximately 10 trillion t-CO2,
enough to store 350 years’ worth of global CO2 emissions. Existing depleted gas fields, for which
there are abundant test drilling data, are estimated to have a potential storage capacity for around
30 years’ worth of emissions. To increase the potential for a greater capacity, it will be necessary to
develop deep saline strata and aquifers as storage reservoirs. Such geological strata involve several
unknowns, as there is not much drilling data on them.
Table 5-4 Global CCS Storage Potential
Note : “Deep saline strata” refers to strata that are surrounded by sandstone and saline carbonate rocks (limestone and dolomite) formed in a sediment-filled valley and that contain sea water. Source : GTSP, “Carbon Dioxide Capture and Geologic Storage,”and IPCC, “IPCC Special Report Carbon Dioxide Capture and Storage”
Unknowns related to Aquifers
◆ There are various storage methods, including physically trapping CO2 under cap rocks,
chemical dissolution and mineralization.
◆ There may be a gap between the initially estimated storage capacity and the actual capacity.
Gt-CO2
Geographicalcapacity
Capacity inU.S.
EstimateHigh case
EstimateLow case
Deep saline strata 9,500 3,630Uncertain, butpossibly 104 1,000
Depleted gas field 700 35Depleted oil field 120 12Unrecoverable coal bed 140 30 200 3-15Deep halite strata, basaltic strata Unknown 240 - -Others Unknown Unknown - -
GTSP IPCC
Geographic strata
900 675
Fig. 5-9 Distribution of Storage Potential (GTSP)
Source : GTSP, “Carbon Dioxide Capture and Geologic Storage”

IEEJ: December 2009
40
◆ Problems may arise from the reaction between dissolved CO2 and the surrounding minerals.
◆ There is no consistent method for assessing capacity.
◆ Available geological data on deep saline strata and aquifers are limited compared with data on
oil fields.
The IPCC assessed the distribution of storage reservoirs from the geological viewpoint, and
decided to focus attention on sediment-filled valleys suited for the formation of geological strata
that may contain oil, gas and coal reserves as potential storage sites. Among regions regarded as
having large storage potential are the Middle East, the North Sea, the Ural region, the United States
and Canada, where there are many sediment-filled valleys, suited for the formation of the anticline
structure, and gas and oil fields.
The Global Energy Technology Strategy Program (GTSP) estimated detailed, region-by-region
storage potential. According to this estimate, regions rich in oil and gas, not to mention countries
with a vast geographic area, have a large storage potential.
The estimated storage potential of major countries are as follows: 3,900Gt-CO2 for the United
States, 2,100Gt-CO2 for Russia, 1,300Gt-CO2 for Canada, 390Gt-CO2 for China, 460Gt-CO2 for
the Middle East, 380Gt-CO2 for India and 1.5Gt-CO2 for Japan. Low-cost storage is expected in the
United States in particular, as 95% of all large emission sources in the country are located within 50
miles of possible storage reservoirs.
5-4-2 Current CCS Cost
The CCS cost of coal-fired thermal power generation estimated by the IPCC ranges from $17 to
$19/t-CO2. The capturing cost accounts for most of the total cost. The transportation cost estimated by
the IPCC is relatively low, compared with RITE’s estimate. This is because the pipeline cost in Japan
is high while the pipeline construction cost assumed in the IPCC’s estimate is relatively low.
Fig. 5-10 Cost Estimate by IPCC
(left : cost estimate; right : breakdown of the cost [median figures])
45
30
4.5 4.25 0.2
17.5
0
25
50
75
100
Coal & gasfired thermalpower plants
Hydrogen,ammonia andgas producers
Undergroundstorage
Monitoring Offshorestorage
Capturing Transport Storage
US$/t-CO2
Capturing84%
Transport8%
Undergroundstorage
8%
Monitoring0%
Source : IPCC, “IPCC Special Report Carbon Dioxide Capture and Storage”

IEEJ: December 2009
41
Fig. 5-11 Cost Estimate by GTSP (left : cost by process; right : cost curve)
Note : “5” and “6” represent the estimated costs for thermal power plants and “1” and “2” reflect the estimated revenue from oil and gas recovered through EOR. Source : GTSP, “Carbon Dioxide Capture and Geologic Storage”
Regarding the CCS cost estimated by the GTSP, the assumed transportation cost is very
different from the one used in RITE’s estimate. The capturing cost is around $30/t-CO2 and the
transportation and injection cost is $15/t-CO2. Whether EOR is possible or not is also the key to
estimating the CCS cost.
5-4-3 Outlook for the Future
We estimated the CCS storage potential based on a viable storage ratio calculated on the basis
of the assumptions used by the IPCC and the GTSP.
The overall storage potential, mainly the potential of depleted oil fields, gas fields and coal
mines, which are expected to have highly viable storage potential, is estimated at approximately 5
to 7 billion Gt-CO2/year (equivalent to 19% to 26% of the global CO2 emission volume in 2005,
which stood at 26.5 billion t-CO2). The use of deep saline strata and aquifers is expected to help
expand the storage potential. If deep saline strata and aquifers are included in the estimate, the CCS
potential is estimated at approximately 12 billion t-CO2/year based on the above assumptions.
However, it is important to remember that deep saline strata and aquifers involve some geological
problems.
The ETP 2008 report estimates that the storage volume in 2050 will stand at around 5.2 billion
t-CO2/year (of which the power-generation sector will account for 3.5 billion t-CO2) if an incentive
of $50/t-CO2 is provided. Under the BLUE Map scenario of the ETP 2008 report, the overall
storage volume in 2050 is estimated at 10.4 billion t-CO2 and the storage volume in the
power-generation sector at 5.6 billion t-CO2. The ETP characterizes these estimates as “very
challenging.”
EOR
Coal-fired thermal power plants $50/t-CO2
Gas-fired thermal power plants & cement plants
(long-distance transport)

IEEJ: December 2009
42
Fig. 5-12 Global CO2 Emission Volume and Estimated Global CCS Potential
Note : 1Gt-CO2=1 billion t-CO2 Source : IEA, “World Energy Outlook 2007,” “Energy Technology Perspectives 2008” and other materials
The global storage volume is estimated at around 3.6 billion t-CO2 (equivalent to 32% of the
total emission volume of the power-generation sector, which came to around 10.9 billion t-CO2)
based on the figures for 2005 and the above assumptions. Based on the estimated figures for 2050
and the above assumptions, the global storage volume is estimated at around 5.7 billion t-CO2/year
(equivalent to 24% of the power-generation sector, estimated at 23.7 billion t-CO2).
0
100
200
300
合計 うち石炭起源
全部問合計 電気事業者
億t-CO2/年石炭起源 石油起源 ガス起源
C C Sポテンシャル想定値
(約170億t-C O 2/年)
全部門合計の63%
ET P2008
(約52億t-C O 2/年)
Billion t-CO2/year Derived from coal Derived from oil Derived from
gas
Estimate of the CCS potential (Approx. 17 billion t-CO2/year)
Equivalent to 63% of total emissions from all sectors
ETP 2008 (Approx. 5.2 billion
t-CO2/year)
Total for all sectors
Total Derived from coal
Electric power companies
Calculation method *To set an assumed viable storage ratio by using data compiled by the IPCC and the GTSP as a reference. *(Depleted gas field: 80%; depleted oil field: 80%; coal bed: 50%; deep saline strata & aquifer: 10%) *Storage period The storage-monitoring period is assumed to be 100 years.
55%
35%25%
13%24% 27% 25%
34% 31% 27%
12%
35%
16%
69%
34%20% 25%
32%25%
15%
10%
5%
10%
52%
30%
17%
17%
14%
17%
12%
33%
21%10% 2%
8%
23%
9%3%
10%
5% 4% 5%
1% 3% 7%
6% 5%11% 6% 7% 5%
14% 15% 14%
0%
20%
40%
60%
80%
100%
2050 2030 2050 2005 2050 2005 2035 2005 2030 2050
CCS(IEEJ
Estimate)
CCS Wind power PV power Nuclear power
Others
India
China
OECD(Pacific)
OECD(Europe)
OECD(NorthAmerica)
Fig. 5-13 Technology Deployment Share by Region
Note : The regional geographic categories used in the calculation of the IEEJ estimate are the United States, Europe, Japan, China, India and others. Source : IEA, “Energy Technology Perspectives 2008”

IEEJ: December 2009
43
On a country-by-country basis, the United States will account for 55% of the global storage
volume. According to an estimate of region-by-region deployment of new technologies in the ETP
2008 report, the U.S. share is estimated at 25% and the Chinese share at 33%. Although China’s
CCS potential as evaluated by the GTSP is not very high, the country is expected to have the
largest CO2 storage capacity according to the ETP 2008. More precise geological surveys and
analysis should be conducted with regard to the CO2 storage potential of China and Russia, whose
vast geographic area requires thorough investigations.
5-5 Conclusion
CO2 storage demonstration tests that are under way in many regions preparing for
commercialization are expected to contribute to the accumulation of necessary management
experiences and know-how. As uncertainties remain over the estimates of the global CO2 storage
potential, a further advance in geological surveys and analysis is necessary. Therefore, it is difficult
to provide a clear, viable estimate of the potential at the moment. As for the CCS cost, the CO2
separation and capturing cost is similar around the world, and continuous technology development
is expected to reduce the cost. It is impossible to assess the transportation cost and the injection
cost with a universal yardstick, as these costs are affected by local circumstances such as the depth
of storage reservoirs, geological conditions and the distance between the emission source and the
storage site. Depending on the circumstances, economic incentive may arise if CCS is used in
combination with EOR. External factors that may affect the deployment of CCS include carbon
price and the trend of carbon-free power sources, such as nuclear power and renewable energy.
There are presumably few technological obstacles to the deployment of CCS. However, if
CCS is to be commercialized on a large scale, cost factors and public acceptability issues, such as
whether underground storage of CO2 is appropriate in the first place, could emerge as a challenge.
Below, we will describe challenges and prospects for CCS in Japan and worldwide.
Japan
◆ High hopes are pinned on aquifers as storage reservoirs with a high potential. Detailed
geological surveys and analysis will need to be conducted.
◆ The separation and capturing cost should be reduced continuously through technology
development.
◆ As the transportation cost is high, the proximity of CO2 emission sources to storage sites is
important.
Worldwide
◆ Although the overall storage potential is vast if deep saline strata and aquifers are included, a
close examination is necessary to assess their viability as practical-use actual storage
reservoirs.
◆ If further efforts are made to reduce the capturing cost, it may become possible to store CO2
through CCS at a CO2 reduction cost as low as $50/t-CO2.

IEEJ: December 2009
44
Future Challenges
◆ It is essential to reduce the energy input necessary for capturing CO2 (equivalent to 20% to
40% of the power-generation volume) and the CO2 capturing cost.
◆ How will CCS be characterized under the international framework for CO2 reduction efforts?
(Will it be recognized as a CDM and how long should CO2 be stored?)
◆ What will a universal legal framework be like? (How long will such a framework require
stored CO2 to be monitored?)
◆ Will an international carbon market be established?
6. Supply Capacity, LCA Assessment and Cost Efficiency
6-1 Supply Capacity
6-1-1 Supply Potential of Nuclear Power and Renewable Energy
If electric vehicles are to be deployed on a large scale (on the premise of the selection of a low
CO2 emission power source), power sources for electric vehicles need to meet these conditions: (i)
the supply potential of the source must be sufficient, (ii) the distribution of the source should not be
uneven and (iii) stable and sustained supply should be possible. Sources that meet these conditions
include renewable energy (see Chapter 3), nuclear power (see Chapter 4) and CCS-capable thermal
power (see Chapter 5).
As for renewable energy, wind power and photovoltaic power meet these conditions. However,
biomass power and geothermal power are unevenly distributed, and hydroelectric power, although
it has a high potential, is expected to have little surplus supply capacity as an additional power
source for automotive applications given its importance as a power source for existing needs.
Regarding CCS-capable thermal power (particularly coal-fired thermal power), there are
geographical constraints, as CO2 storage sites are not evenly distributed and the storage capacity is
limited, making it difficult to expect a large amount of power supply for automotive applications.
Meanwhile, although the plant construction capacity constitutes a bottleneck for nuclear power, this
problem can be resolved in the medium to long term.
In light of the above, renewable energy, including wind power and photovoltaic power, and
nuclear power are expected to serve as additional power sources for automotive applications. Table
6-1 shows the maximum supply capacity (the potential capacity) that was mentioned in Chapters 3
and 4. This table also includes the estimated power-generation volumes based on a quantitative
analysis model developed by the Institute of Energy Economics, Japan.
The combined maximum supply capacity (potential capacity) of nuclear power and renewable
energy (wind and photovoltaic power) that may be attained around 2050 is estimated at 15.3 trillion
kWh/year, including 6.1 trillion kWh/year (baseline case) for nuclear power, 5.2 trillion kWh/year
for wind power and 4.0 trillion kWh/year for photovoltaic power. However, it should be noted that
this estimate assumes that the power-generation cost of photovoltaic power will decline to ¥7/kWh
from ¥30/kWh and that nuclear power-related problems like the construction capacity bottleneck
will be resolved.

IEEJ: December 2009
45
Table 6-1 Supply Capacity of Nuclear Power and Renewable Energy
Note : The figures for nuclear power are those in the baseline case. The capacity utilization is 80% for nuclear power, 20% for wind power and 12% for PV power. Source : Nuclear power : Estimates cited in Chapter 4 Wind and PV power : Estimates cited in Chapter 3
Some 6.3 trillion kWh/year (see Table 6-1) out of the total supply capacity of 15.3 trillion
kWh/year in nuclear, wind and photovoltaic power is set to be supplied for non-automotive
applications, leaving approximately 9.0 trillion kWh/year for supply for automotive applications.
The 9.0 trillion kWh/year is the maximum supply capacity of power for use in electric vehicles.
6-1-2 Power Supply Capacity for Electric Vehicles
Table 6-2 shows the volume of power necessary to meet the power needs of electric vehicles
on the assumption that an average electric vehicle travels about 10,000 km annually with a fuel
economy of 110 Wh/km.
Assuming that passenger vehicles owned around the world total 2 billion units and that all of
them will be replaced with electric vehicles, the volume of necessary power would expand to 2.2
trillion kWh/year at maximum. Table 6-1 shows the necessary volumes of power corresponding to
the maximum supply capacity and the number of electric vehicles in use. This indicates that nuclear
power, wind power and photovoltaic power each has a sufficient supply potential to meet the power
needs of electric vehicles alone.
However, it is important to remember that the estimated figures are based on the crude
assumptions of a capacity utilization ratio of 80% for nuclear power, 20% for wind power, 12% for
photovoltaic power, and a 100% usage of electricity from these power sources for electric vehicles.
In practice, on the premise of a night-time recharging, only eight hours of power supply are
used for electric vehicles in the case of nuclear power (as well as wind power), and in the case of
photovoltaic power generation, electricity generated during the day is stored in a storage battery for
recharging purposes. Therefore, in some cases, it will be possible to meet the power needs of
electric vehicles with power from existing power sources, without using power from additional
sources, by achieving efficient power supply management based on an optimal power source mix.
This will reduce the necessary additional power supply capacity compared with the estimates
calculated on the basis of the above assumptions. Moreover, as photovoltaic power and wind power
Installed capacity Generation volume Installed capacity Generation volume
(billion kW) (billion kWh/year) (billion kW) (billion kWh/year)
0.87 6,100 0.54 3,809
2.95 5,174
3.84 400
7.66 11,674.0 2.31 6,288Total
Maximum possible supply capacity (2050)
Wind2,479
PV
Nuclear
Estimate for 2050 (IEEJ reference estimate)
1.77

IEEJ: December 2009
46
are affected by weather conditions, power supply for electric vehicles is likely to come from a
combination of these with nuclear or other power sources, rather than from these renewable energy
sources alone.
Table 6-2 Power Needs of Electric Vehicles
Note: The assumptions are as follows : Distance run per vehicle : approx. 10,000 km Fuel economy : 110 Wh/km Number of passenger cars owned worldwide : approx. 2 billion units Global population : approx. 8 billion
Fig. 6-1 Comparison of the Power Needs of Electric Vehicles and the Supply Capacity
Note : The figures for nuclear power capacity are those in the baseline case, and the reference figure for 2050 (②) represent the power supply volume for non-automotive applications.
6-2 Life Cycle Assessment (LCA)
6-2-1 Definitions of Assessment of CO2 Emissions (LCA Basis) and Power-generation Volume
The LCA assessment of power sources is classified into the assessment of upstream operations
(drilling, production and transportation), the assessment of power plants (combustion and power
generation) and the assessment of transmission and distribution networks (including transformer
substations). The power-generation volume used in calculating the CO2 emission volume per 1
kWh varies between the power generation end, the power transmission end, the demand end and
the point of sales to users. (This is because of internal power consumption at power plants and
transformer substations as well as power loss during transmission and distribution.) Although
Million units 100 200 500 1,000
Share (%) 5% 10% 25% 50%
Distance run 1 billion km/year 1,000 2,000 5,000 10,000
Necessary power volume 1 billion kWh/year 110 220 550 1,100
Passenger car
0
2,000
4,000
6,000
8,000
10,000
12,000
14,000
16,000
18,000
0.1 billion units 0.2 billion units 0.5 billion units 1.0 billion units 1.5 billion units 2.0 billion units
PV power
Wind power
Nuclear power
(billion kWh/year)
Supply capacity forelectric vehicles
(①―②)
Maximum supply capacity ①
Engine-powered vehicles will remainthe mainstay while the use of electric
vehicles spreads.
A paradigm shift occurs, with electricvehicles becoming the mainstay.
2050Reference ②
Necessary power volume

IEEJ: December 2009
47
assessment is usually conducted at the power transmission end, this report also conducts
assessment at the demand end, where electric vehicles are recharged. In Japan, the ratio of power
lost during transmission and consumed at power plants for internal use to the power volume at the
power generation end is around 9.9%.
Table 6-3 shows an international comparison of power-generation efficiency (by fuel type) and
power loss during transmissions and at power plants.
Table 6-3 International Comparison of Power Generation Efficiency (thermal power)
and the Power Loss Ratio (2006)
Source : Calculated based on IEA, Energy Balances (actual figures for 2006) Power generation efficiency=heat efficiency
Table 6-4 CO2 Emission Volume by Power Source
(LCA basis ; at the power transmission end)
Note : CO2 emissions resulting from input of energy for building construction and machinery production are excluded. Source : Thermal power : Toyota Motor and Mizuho Others : Estimated by the IEEJ based on data compiled by the Central Research Institute of Electric Power Industry
6-2-2 LCA Assessment by Power Source Type (in Japan’s case)
Table 6-4 shows the CO2 emission volume by type of power source (at the power transmission
end in Japan) calculated on an LCA basis. The CO2 emission volume per 1kWh (=3.6MJ) of power
is 18.5g for nuclear power, 8.3g for wind power and 10.1g for photovoltaic power, all of which are
less than around one-fiftieth of the emission volume for thermal power, which stands at between
517g to 981g.
Fig. 6-2 shows the LCA assessment of the CO2 emission volume including emissions
generated through input of energy for the construction and production of buildings and machinery.
The emission volume per 1kWh of power at the power transmission end comes to 35g for nuclear
power (pressurized water reactor), 29g for wind power and 53g for photovoltaic power.
(g-CO2/kWh)
Oil LNG LNG combined Coal PV Wind Nuclear Geothermal Hydroelectric
45.1 108.9 94.4 78.1
738.5 522.9 423.2 903.2
(combustion) (738.3) (488.3) (405.8) (873.8)
783.6 631.8 517.6 981.3 10.1 8.3 18.5 9.7 1.9
Upstream sector
1.9Power generation sector
Ash and waste disposal
Total
10.1 8.3 18.5 9.7
Japan U.S. Europe China India Worldwide
9.9 13.3 14.9 18.9 32.4 17.2
Coal 42.0 36.9 36.5 32.6 26.3 33.7
Oil 46.1 35.4 38.7 34.2 30.8 35.8
Gas 45.1 44.3 47.1 38.9 41.9 38.2
Thermal 43.8 38.6 40.3 32.6 27.5 35.1
Ratio of power loss at plants and during transmission (%)
Power generationefficiency (%)

IEEJ: December 2009
48
Fig. 6-2 LCA Assessment of CO2 Emissions by Power Source
(at the power transmission end : emissions resulting from building construction
and machinery production included)
6-2-3 Comparison of CO2 Emission Volume per 1 km of Distance Travelled by Power
Source Type
Fig. 6-3 shows the CO2 emission volume by power source type calculated on the basis of the
CO2 emission volume per 1 kWh of power for each type and an assumed fuel economy of 110
Wh/km. The power volume does not include power lost during transmission. The CO2 emission
volume comes to 2.1g for nuclear power, 1.0g for wind power and 1.1g for photovoltaic power, all
of which are miniscule figures compared with 57.5g to 109g for thermal power.
Fig. 6-3 CO2 Emissions per 1 km of Distance Travelled by Power Source
(at the transmission end)
Note : Power loss during transmission is not included.
887
704 478407
53 25223511152829130 111
3888
0
200
400
600
800
1000
1200
Coal-fired thermal Oil-fired thermal LNG steam LNG combined PV Wind Nuclear
(BWR)
Geothermal Hydroelectric Nuclear
(PWR)
Nuclear cycle
(BWR)
Nuclear cycle
(PWR)
Fuel combustion
Others
g-CO2/kWh
0
5
10
15
20
25
1 2
Enrichment
Power generation
Drilling andReprocessingMoldingOthers
Facility construction
Facility disposal
CO2emissionsarisingfrom plantoperation
g-CO2/kWh
Breakdown of nuclear power generation by process
(BWR, nuclear fuel cycle)
0
20
40
60
80
100
120
Oil LNG LNG combined Coal PV Wind Nuclear Geothermal Hydroelectric
g-CO2/km

IEEJ: December 2009
49
6-2-4 International Comparison of CO2 Emission Volume Based on Power Source Mix
(average)
Fig. 6-4 shows the CO2 emission volume (at the demand end) on an LCA basis for individual
countries calculated on the basis of country-by-country power-generation efficiency (by fuel type),
the ratios of power loss at power plants and during transmission that are indicated in Table 6-3, and
the assessment of CO2 emissions by type of power source in Japan that are indicated in Table 6-4.
The CO2 emission volume per 1kWh of power stands at 518g for Japan, 756g for the United
States and 522g for Europe. The emission volume for China, at 1,157g, is more than double the
amount for Japan, while the emission volume for India, at 1,640g, is more than triple that for Japan.
This is because coal-fired thermal power, which emits a large volume of CO2, has a significant
share in the power source mix of these countries: 78% in the case of China and 69% in the case of
India. Moreover, as shown in Table 6-2 1, whereas the ratio of power lost at power plants and
during transmission is around 10% in Japan, the ratio is 18.9% in China and 32.4% in India. In the
future, the gap between developed and developing countries is expected to narrow as problems like
power loss are resolved.
Fig. 6-4 International Comparison of the CO2 Emission Volume Calculated Based
on the Power Source Mix (at the demand end)
Note : CO2 emission volume per 1 kWh of power at the demand end (excluding emissions arising from the use of heat)
6-2-5 International Comparison of CO2 Emission Volume per 1 km of Distance Travelled
Fig. 6-5 shows the CO2 emission volume (at the demand end) per 1 km of distance travelled
by an electric vehicle, calculated by multiplying the CO2 emission volume (at the demand end) per
1 kWh of power indicated in Fig. 6-4 with the fuel economy indicated in Table 1-3.
In Japan and Europe, the CO2 emission volume per 1 km of distance travelled comes to
around 57g for electric vehicles, much lower than 176g for gasoline vehicles and 94g for hybrid
518
756522
1,157
1,640
776
27%
50%
29%
78%
69%
40%
0
400
800
1,200
1,600
2,000
Japan U.S. Europe China India Worldwide
0%
10%
20%
30%
40%
50%
60%
70%
80%
90%g-CO2/Kwh

IEEJ: December 2009
50
vehicles. In China, the CO2 emission volume per 1 km of distance travelled comes to around 127g
for an electric vehicle, higher than 127g for hybrid vehicles, while in India, the emission volume
stands at 180g for electric vehicles, higher than the emission volume for both gasoline-powered and
hybrid vehicles.
It is important to remember that as shown above, the deployment of electric vehicles could
increase CO2 emissions in some cases, particularly in developing countries, on the premise of the
existing power source mix. In the medium to long term, the deployment of electric vehicles is
expected to reduce CO2 emissions in developing countries, too, due to improvement in power
efficiency and the power loss ratio as well as changes in the power mix (e.g., reduction in the share
of coal-fired thermal power).
Fig. 6-5 International Comparison of CO2 Emissions per 1 km of Distance Travelled
Calculated Based on the Power Source Mix (LCA basis ; at the demand end)
6-3 Cost Efficiency
6-3-1 Comparison of Cost per 1 km of Distance Travelled by Power Source Type
As shown in Table 6-5, the current power-generation cost (at the power transmission end)
comes to ¥5.3/kWh for nuclear power and ¥6.0 kWh for wind power, both of which are fairly
competitive compared with ¥5.7 to ¥10.7 for thermal power. Fig. 6-6 shows the cost per 1km of
distance travelled calculated by multiplying the current power-generation cost with the fuel
economy indicated in Table 6-6.
57
83
57
127
180
85
176
89
146
0
20
40
60
80
100
120
140
160
180
200
Japan U.S. Europe China India Worldwide Gasolinevehicle
Hybridvehicle
Dieselvehicle
g-CO2/km

IEEJ: December 2009
51
Source : Compiled based on data compiled by the subcommittee on cost assessment, “Projected Costs of Generating Electricity” by the OECD/NEA, and materials prepared by the New and Renewable Energy Subcommittee
The energy cost per 1 km of distance travelled by an electric vehicle comes to ¥0.6/km for
nuclear power and ¥0.7/km for wind power, both of which compare well with the cost for thermal
power, which ranges from ¥0.6 to ¥1.2/km. Meanwhile, for photovoltaic power and CCS-capable
coal-fired thermal power, the energy costs are far higher, at ¥3.3/km in the case of the former and
¥1.2/km in the case of the latter. If the cost of photovoltaic power generation is reduced from the
current ¥30/kWh to ¥7/kWh (see Chapter 3), the cost per 1 km of distance travelled will drop to
around ¥0.8/kWh, comparable to the cost for nuclear and wind power.
Fig. 6-6 Cost per 1 km of Distance Travelled by Electric Vehicle by Power Source
(at the power transmission end ; ¥/km)
Table 6-5 Power Generation Cost
by Power Source
(¥/kWh ; at the power transmission end)
Hydroelectric & geothermal 11.9Nuclear 5.3
PV 30.0Wind 6.0
Biomass 12.0Oil 10.7
Coal 5.7Coal with CCS 10.7
Gas 6.2
Table 6-6 Fuel Economy
(km/L)
Gasoline vehicle 15.5Gasoline HEV 30.6Diesel vehicle 19.7
(kWh/km)Electric vehicle 0.11
1.3
0.6 0.7
1.31.2
0.6
1.2
0.7
3.3
0.0
1.0
2.0
3.0
4.0
Hydro
electr
ic & ge
otherm
al
Nuclea
rPV
Win
d
Biomas
sOil
Coal
Coal w
ith C
CSGas

IEEJ: December 2009
52
6-3-2 International Comparison of Current Energy Cost per 1 km of Distance Travelled
Based on Electricity Rates
Table 6-7 shows country-by-country electricity rates (peak and off-peak rates) and gasoline
and diesel prices. Fig. 6-7 shows the estimated energy cost by country calculated on the basis of the
fuel economy indicated in Table 6-6.
Table 6-7 Electricity Rates and Fuel Prices
Source : Electricity : Rates cited in Chapter 2 Fuel prices (incl. the consumption tax) : Calculated based on data compiled by the IEA, the Oil Information Center and the European Commission. Figures for fuel prices in China (Shanghai) are from 2007.
Fig. 6-7 International Comparison of the Energy Cost per 1 km of Distance Travelled
(at the demand end)
The energy cost per 1km of distance travelled by an electric vehicle based on electricity rates
(off-peak rates) in individual countries (in the case of night-time recharging) ranges from ¥0.9 to
¥1.5, far lower than the cost for gasoline-powered vehicles, which ranges from ¥5.87 to ¥12.9.
In Japan: cost for electric vehicles=¥1.3/km; cost for gasoline vehicles=¥9.7/km
In the United States: cost for electric vehicles=¥0.9/km; cost for gasoline vehicles=¥5.8/km
City Peak Off-peak Gasoline Diesel
Japan Tokyo 21.6 8.6 150 132
U.S. California 17.6 5.6 91 101
Europe France 16.0 9.8 200 172China Shanghai 9.1 4.5 117 97
Fuel prices (\/L)Electricity rate (\/kWh)
1.3
3.4
9.7
4.9
6.7
0.9
2.8
5.8
3.0
1.5
12.9
6.5
8.7
0.71.4
5.1
2.5
7.6
3.5
4.9
0.0
2.0
4.0
6.0
8.0
10.0
12.0
14.0
Off
-pea
k
Peak
(ref
eren
ce)
Gas
olin
e ve
hicl
e
Gas
olin
e H
EV
Die
sel v
ehic
le
Electric vehicle Engine-powered vehicle
\/k
m
Tokyo
California
France
Shanghai

IEEJ: December 2009
53
In France: cost for electric vehicles=¥1.5/km; cost for gasoline vehicles=¥12.9 km
In China: cost for electric vehicles=¥0.7/km; cost for gasoline vehicles=¥7.6/km
The energy cost for electric vehicles is already fairly competitive under the current electricity
pricing system. In the future, the electricity pricing system, which does not assume large-scale
deployment of electric vehicles, may be adapted so as to suit such a situation.
7. Conclusion and Future Challenges
7-1 Conclusion
(1) Advantages of Electric Vehicles
The advantages of electric vehicles are that they are effective in reducing CO2 emissions, they
contribute to a stable energy supply by reducing dependence on foreign supply sources for fossil
fuels and they help to even out the burden on electricity supply over the course of the day as well as
reduce electricity costs through the use of night-time recharging.
(2) Prominent Feature of and Challenge for Electric Vehicles
While electric vehicles have a superior fuel economy, their relatively short driving range of
around 100 km is likely to limit their spread for now.
(3) Key to Future Spread of Electric Vehicles
(i) The key to the future spread of electric vehicles will be the development of low-cost, high
performance batteries. The driving range of electric vehicles is likely to more than double in the
future due to an improvement of the performance of the lithium-ion battery, leading to their
spread as commuter vehicles for short-range driving.
(ii) Although it is possible that the development of an entirely new type of battery will turn electric
vehicles into mainstay vehicles, it is not clear now how likely this scenario is.
(4) Power Sources for Electric Vehicles (additional power sources)
Power sources for electric vehicles, which should be selected with a low CO2 emission as the
prerequisite, must meet such conditions as (i) that the supply potential of the source is sufficient,
(ii) that the distribution of the source is not uneven and (iii) stable and sustained supply is possible.
Nuclear power and renewable energy such as wind and photovoltaic power are promising as power
sources that meet these conditions.
(5) Supply Potential
(i) The combined supply potential (with the “supply potential” defined as the maximum possible
supply capacity to be attained by around 2050) of nuclear, wind and photovoltaic power is
estimated at approximately 15.3 trillion kWh/year.
(ii) With 6.3 trillion kWh/year of the total supply capacity set to be used for non-automotive

IEEJ: December 2009
54
applications, the maximum possible supply for automotive applications comes to 9 trillion
kWh/year, a capacity mostly sufficient to meet the power needs of electric vehicles.
(6) CO2 Emission Volume per 1 km of Distance Travelled by Power Source Type
The CO2 emission volume per 1 km of distance travelled by an electric vehicle comes to 2.1g
for nuclear power, 1.0g for wind power and 1.1g for photovoltaic power, compared with 57.5g to
109g for thermal power. Thus, electric vehicles using these power sources are almost CO2-free.
(7) CO2 Emission Volume per 1 km of Distance Travelled Based on Current Power Source
Mix (average)
Compared with the CO2 emission volume (at the demand end) per 1 km of distance travelled
by a gasoline vehicle and a hybrid vehicle, 176g and 94g, respectively, the emission per the same
distance travelled by an electric vehicle comes to the following:
(i) 57g in Japan and Europe, meaning that the CO2 reduction effect will be significant, and;
(ii) 127g in China and 180g in India, indicating that the deployment of electric vehicles could
increase CO2 emissions in some cases. This is attributable to such factors as the large share of
coal-fired thermal power in the power source mix and poor power-generation efficiency, as well
as a high power loss ratio in developing countries and emerging countries. Although such
problems are expected to be improved in the medium to long term, it is important to remember
that the deployment of electric vehicles will not necessarily reduce CO2 emissions under the
current circumstances.
(8) Energy Cost (at the demand end)
(i) Based on the electricity rates (off-peak rates) and fuel prices in individual countries, the
estimated energy cost per 1 km of distance travelled by an electric vehicle range from ¥0.9 to
¥1.5, far lower than the range of ¥5.7 to ¥12.9 for the same distance travelled by a gasoline
vehicle.
(ii) Although the current electricity pricing system does not assume a large-scale deployment of
electric vehicles, it may be adapted so as to suit such a situation in the future.
7-2 Conclusion and Future Challenges
The following is an assessment of how the supply stability, the CO2 emission reduction effect
and the cost efficiency will be like if electric vehicles and plug-in hybrid vehicles are to be
deployed on the premise of the use of low-carbon power sources (renewable energy and nuclear
power).
(1) Energy Supply Stability
(i) Additional power supply is secured through an increase in the capacity utilization ratio of
existing facilities due to the use of night-time electricity and construction of new capacity.
Although new capacity alone will be sufficient to meet the electricity needs of electric vehicles,

IEEJ: December 2009
55
the use of night-time electricity means that the actual volume of additional power to be made
available through new capacity construction will be smaller than the nominal new capacity.
(ii) The use of renewable energy such as wind and photovoltaic power as well as nuclear power
will help to reduce dependence on oil as fuel (dependence on foreign supply sources).
(2) CO2 Emission Reduction Effect
(i) If low-CO2-emission power sources (renewable energy and nuclear power) are used, the
deployment of electric vehicles will contribute to the reduction of CO2 emissions.
(ii) However, it may not contribute to the reduction of CO2 emissions in cases where conventional
power sources are used and the share of coal-fired thermal power in the power source mix is
high.
(3) Energy Cost
(i) Under the current electricity pricing system (in the case of night-time electricity), the energy
cost for electric vehicles will be lower than the cost for vehicles using oil-based fuels.
(ii) However, if a new power source (e.g., renewable energy) is to be used, further cost reduction
efforts will be necessary so as to minimize the public burden because the current supply cost is
high.
In light of the above, electric vehicles are likely to become popular as commuter vehicles for
short-range driving. However, there are many challenges to overcome before the use of electric
vehicles becomes widespread. In particular, research and development on an innovative high
performance battery will be essential on the vehicle side, while on the power source side, further
cost reduction will be necessary with regard to wind and photovoltaic power. In addition,
quantitative research on how to optimize the power source mix (minimization of cost), including
additional power sources for electric vehicles, will be needed.
Contact: [email protected]
Related Documents