A comparison through a Scandinavian and Baltic point of view Current state of energyproduction and useage, sources and domestic production

Current state of energyproduction and useage, sources and domestic production.
Dec 26, 2015
Welcome message from author
This document is posted to help you gain knowledge. Please leave a comment to let me know what you think about it! Share it to your friends and learn new things together.
Transcript

A comparison through a Scandinavian and Baltic
point of view
Current state of energyproduction and useage, sources and domestic production
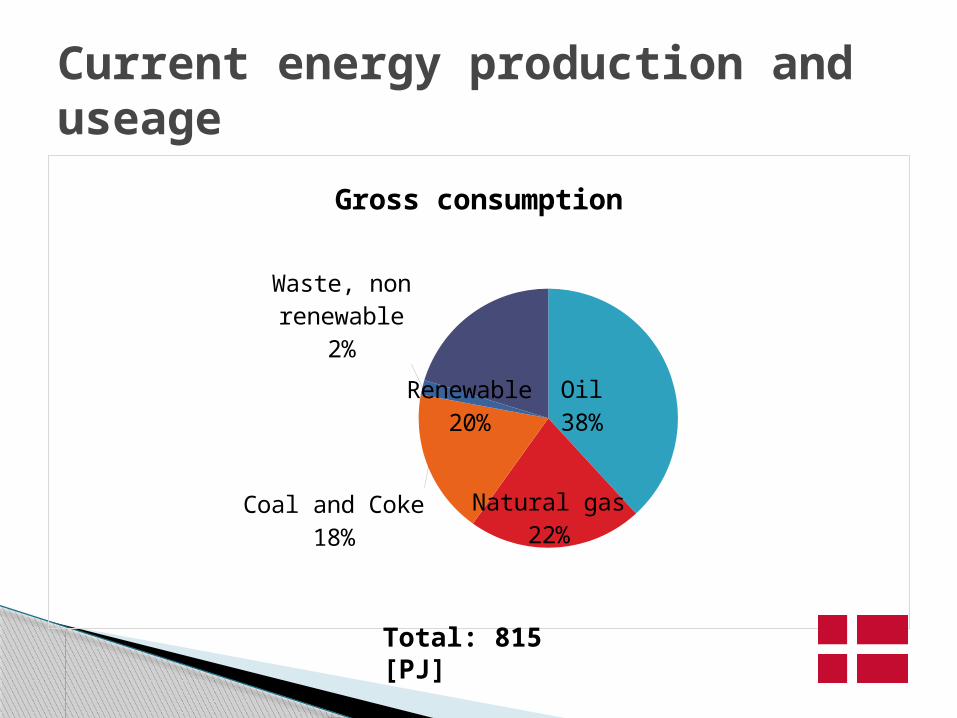
Oil38%
Natural gas22%
Coal and Coke18%
Waste, non renewable
2% Renewable20%
Gross consumption
Current energy production and useage
Total: 815 [PJ]

Non e
nerg
y us
e
Tran
spor
t
Indu
stry
and
agr
icul
ture
Trad
e an
d Se
rvice
House
hold
s0
50100150200250
Energyuse by sector
Usage by sector
Total: 635 [PJ]

Crude
oil
[100
0 To
nnes
]
Oil pr
oduc
ts [1
000
Tonn
es]
Natur
al g
as [m
illio
n Nm
3]
Coal [
1000
Ton
nes]
Elec
tricity
[GW
h]0
5000
10000
15000
20000
25000
ExportImport
Import and export
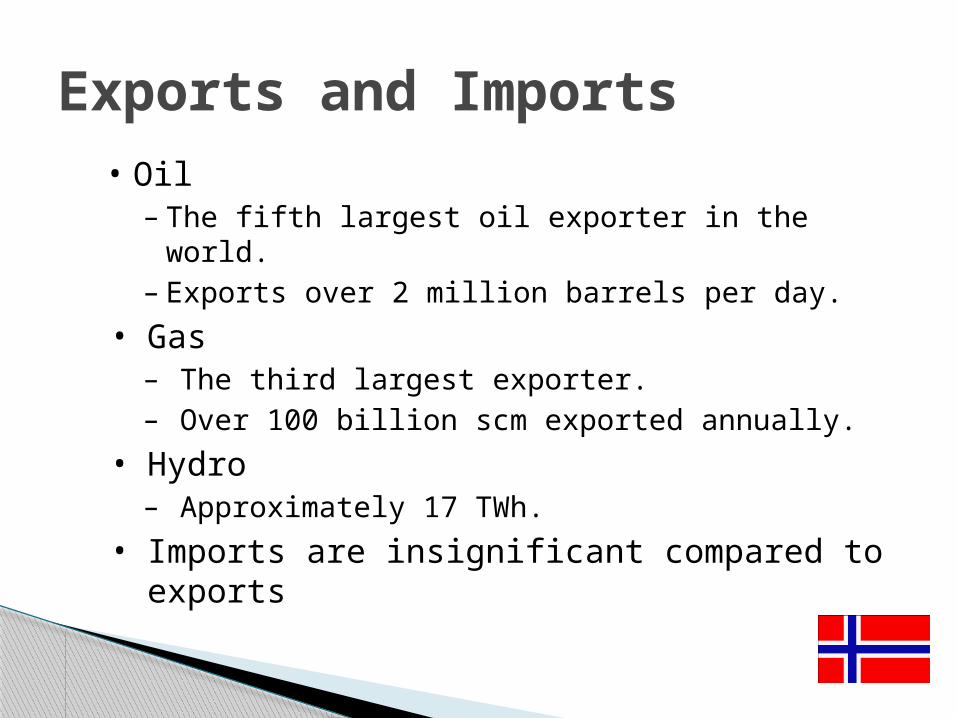
Exports and Imports• Oil– The fifth largest oil exporter in the world.– Exports over 2 million barrels per day.
• Gas– The third largest exporter.– Over 100 billion scm exported annually.
• Hydro– Approximately 17 TWh.
• Imports are insignificant compared to exports

Type of Energy


Because of environmental conflicts it is hard to achieve acceptance for large scale hydropower.
Focus on improved use of already developed rivers.
Old plants may be replaced by more efficient plants.
The government has presented a strategy for development of Small hydro.◦ Important for energy supply.◦ Important for local development.◦ Secure income for farmers to maintain settlement
patterns in rural areas. International focus on renewable energy.
Present situation of Hydro

Hydro◦ Approximately 96% of all power production is
hydropower.◦ Annual production: 124 TWh, annual variation +-
20%◦ Installed capacity: 29.600 MW, 1250 power plants. ◦ Reservoir capacity: 83,4 TWh
Wind◦ 10 TWh licensed by the government.◦ 1,8 TWh developed or under construction.◦ 4,1 TWh appealed to the officials.◦ 4,1 TWh has a final license – ready for
development.
Resources and Usage

Oil◦ The total oil resources are between 10,6 and 16,9 billion
scm.◦ 7,1 billion scm has already been produced.◦ Over 2 million barrels per day produced
Russia 10,1 and Saudi-Arabia 9,8 Gas
◦ Over 4.000 billion scm of recoverable gas reserves◦ 2.000 billion scm to be discovered.◦ 30% of all gas production in Western Europe.◦ The fifth largest producer in the world, but has only 1.6% of
the world’s proven gas reserves. Others
◦ Solar, osmotic etc.
Resources and Usage

Usage

The total distric heat production was 7308 GWh
The total electric energy production was 5569 GWh
The total amount of energy produced was 12 877 GWh
4259 GWh of energy was imported 2605 GWh of energy was exported
Energy production in Latvia
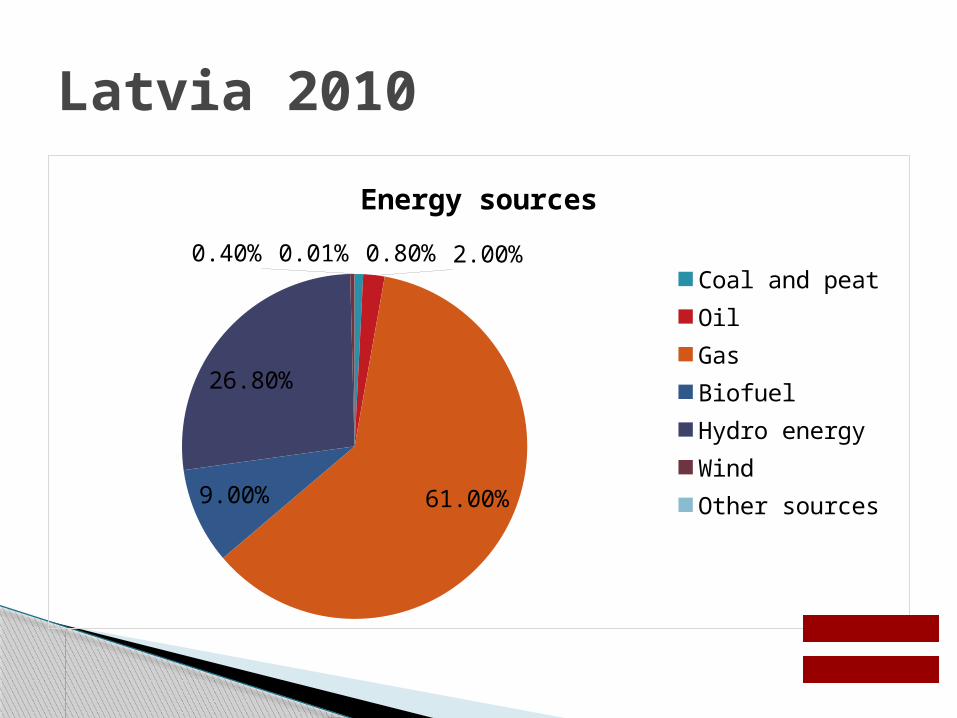
0.80% 2.00%
61.00%9.00%
26.80%
0.40% 0.01%
Energy sources
Coal and peat OilGasBiofuelHydro energyWindOther sources
Latvia 2010

18%
28%35%
14%
4%
Energy consumption
ConstructionTransportHouseholdsServicesAgriculture, forestry, hunting, fishing
Latvia 2010

The total district heat production was 13 148 GWh
The total electric energy production was 15 358 GWh
The total amount of energy produced was 28 506 GWh
4783 GWh of energy was imported 7715 GWh of energy was exported
Energy production in Lithuania

19%
33%33%
13%
2%
Energy consumption
ConstructionTransportHouseholdsServicesAgriculture, forestry, hunting, fishing
Lithuania 2009

0% 3%
34%
8%
40%
4%
0%
1%
10%
Energy sources
Coal and peatOilGasBiofuelsNuclearHydroGeothermalWindOther sources
Lithuania 2009

Oil
Coal/p
eat
Nucle
ar
Hydro
Biof
uel a
nd w
aste
Geoth
erm
alGas
Win
d0
20
40
60
Share of total primary energy supply, IEA 2009
NorwayDenmarkIcelandSwedenFinlandLithuaniaLatviaEstonia
A Scandinavian and Baltic comparison

Thank you for your attention!
Related Documents