Current QA Practice and Future Directions Todd Pawlicki

Welcome message from author
This document is posted to help you gain knowledge. Please leave a comment to let me know what you think about it! Share it to your friends and learn new things together.
Transcript

Current QA Practice and Future Directions
Todd Pawlicki

Quality and Safety
Current approaches
Future approaches
The physicist facing such fantastic progress is fascinated by so many wonderful toys but he feels sometimes like a sorcerer’s apprentice wanting every day more powerful tools, but not always sure of being able to master their outcome.
- A Dutreix. Radiother Oncol. 1984

Quality and Safety
Dunscombe 2010

Quality and Safety

Definition of Medical Errors
• The failure of a planned action to be completed as intended or the use of a wrong plan to achieve an aim
• A factor contributing to errors is the fragmented nature of the health care delivery system – or ‘nonsystem’
To Err Is Human: Building a Safer Health System. 1999: National Academies Press (www.nap.edu/catalog/9728.html).

Traditional Physics Contribution to Quality

On-Going Physics Contributions
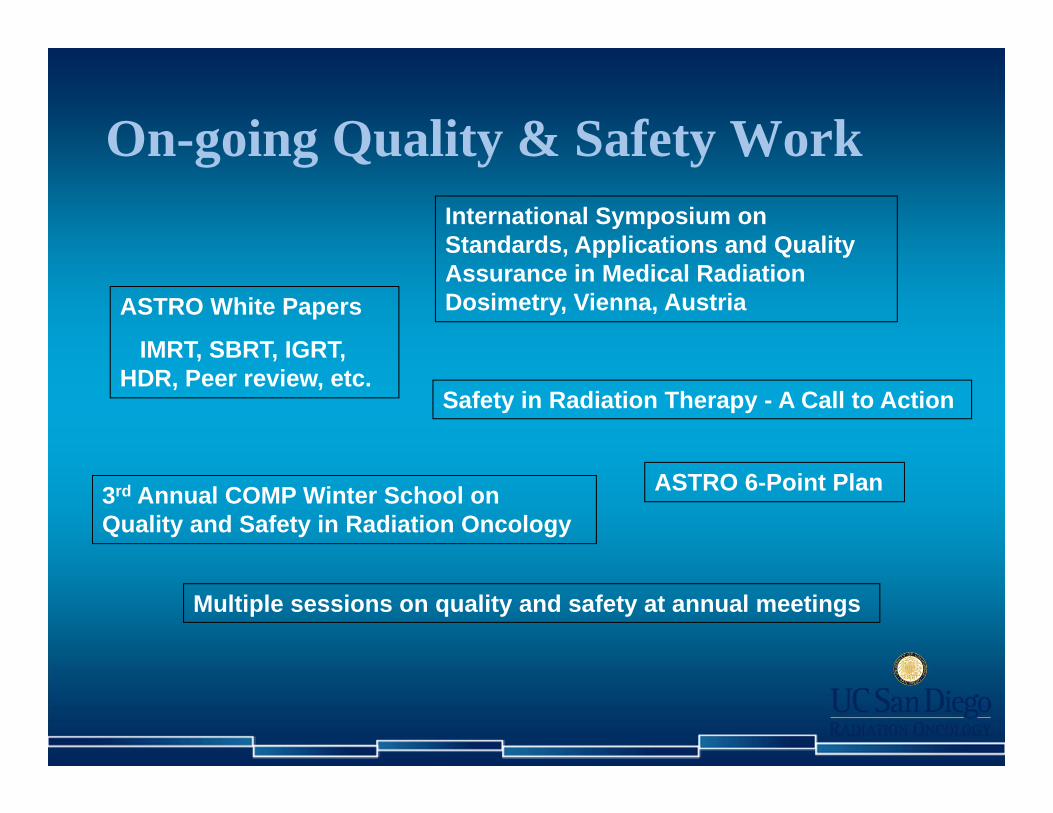
On-going Quality & Safety Work
ASTRO White Papers
IMRT, SBRT, IGRT, HDR, Peer review, etc.
International Symposium on Standards, Applications and Quality Assurance in Medical Radiation Dosimetry, Vienna, Austria
3rd Annual COMP Winter School on Quality and Safety in Radiation Oncology
Safety in Radiation Therapy - A Call to Action
ASTRO 6-Point Plan
Multiple sessions on quality and safety at annual meetings

Physics Contributions cont.
• International Commission of Radiation Units and Measurements (ICRU) ~1925
• Numerous AAPM Task Groups and Reports dating back to 1977
• First International Symposium on Quality Assurance in Radiation Therapy (1983)
• Quality Assurance of Radiation Therapy: The Challenges of Advanced Technologies (2007)

0
10
20
30
40
50
1975
1977
1979
1981
1983
1985
1987
1989
1991
1993
1995
1997
1999
2001
2003
2005
2007
2009
1st Symposium
NY Times Articles
Therac-25 incidents
2nd Symposium
PubMed: ‘Quality’ & ‘Radiotherapy’

Where are we now in RT?
• New technology & more complicated treatments– Hard work
• Investigate incidents once they have occurred– Charts rounds = quality improvement?
• “If it ain’t broke, don’t fix it.” – Leads to latent errors in a process that can manifest
long into the future
• Measure and inspect against tolerance limits

Action & Tolerance Levels (TG-142)
Accept
Target
Action Required
Tolerance Levels
Action Required

Current Approach to Quality
Target
Prob
abili
ty o
f fai
lure
to
fulfi
ll th
e pr
escr
iptio
n
+Tolerance Limit
100%
0%
-Tolerance Limit

A New Component of Quality

Radiotherapy
• Process vs Procedure• Clinical flow
– # days from contours to plan– # days from sim to first tx
• Medical– Image review – Contouring
• Technical– IMRT QA, meas vs calc
Simulation
Prescription
Follow-up
Consultation
Planning
Treatment
Simulation
Prescription
Follow-up
Consultation
Planning
Treatment

IMRT QA
Within limits(don’t worry about it)
– or –
Outside limits (something is wrong, fix it, re-measure)
– or –
Getting close to limits (come back to it later)
What is the process?

What is the process?
Daily Patient Setup with Imaging


Process View
• Every process displays variation
• Identify two types of variation– Systematic (signal)– Random (noise)

Daily Patient Setup
Patient Number2019181716151413121110987654321
0.7
0.6
0.5
0.4
0.3
0.2
0.1
0.0
vector by Patient Number
GYN – bony anatomy
Prostate – Fiducials

Different Operators
Therapist Level
vect
or
PhysicianExpertBeginner
0.8
0.7
0.6
0.5
0.4
0.3
0.2
0.1
0.0
Boxplot of vector vs Therapist Level
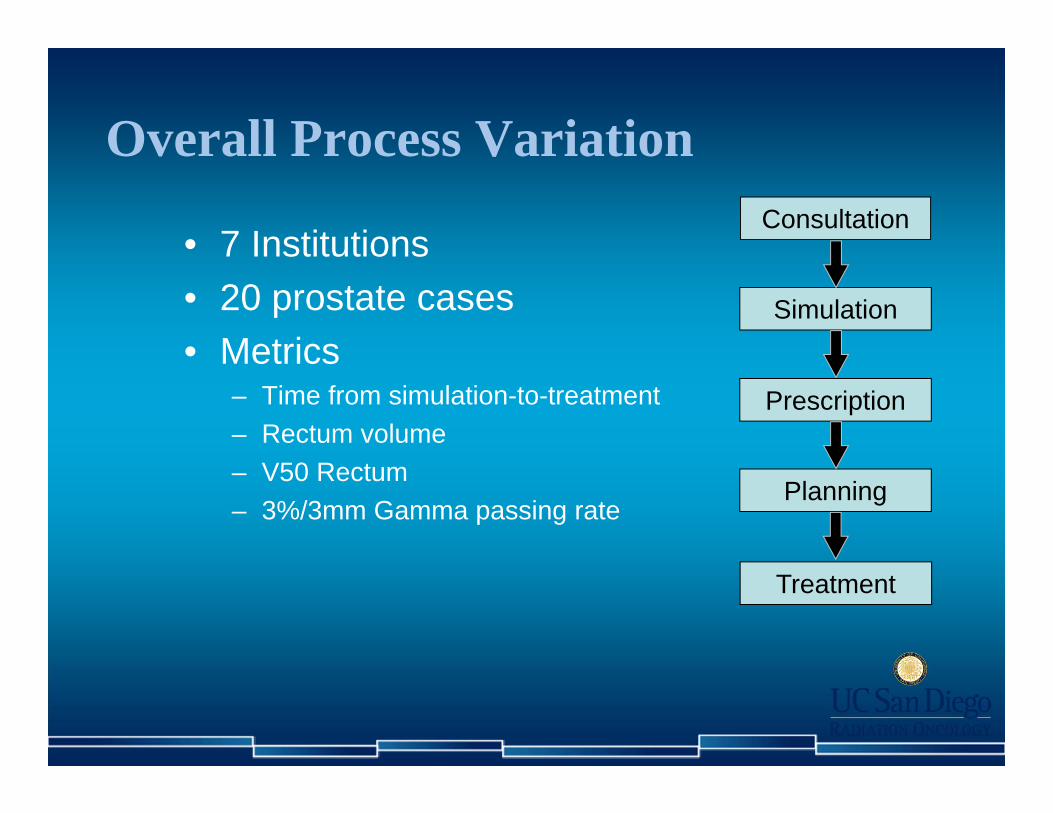
Overall Process Variation
• 7 Institutions• 20 prostate cases • Metrics
– Time from simulation-to-treatment– Rectum volume– V50 Rectum– 3%/3mm Gamma passing rate
Simulation
Prescription
Consultation
Planning
Treatment


CT to Sim Rectum Vol Rectum V50 IMRT Gamma
1
2
3
4
5
6
7
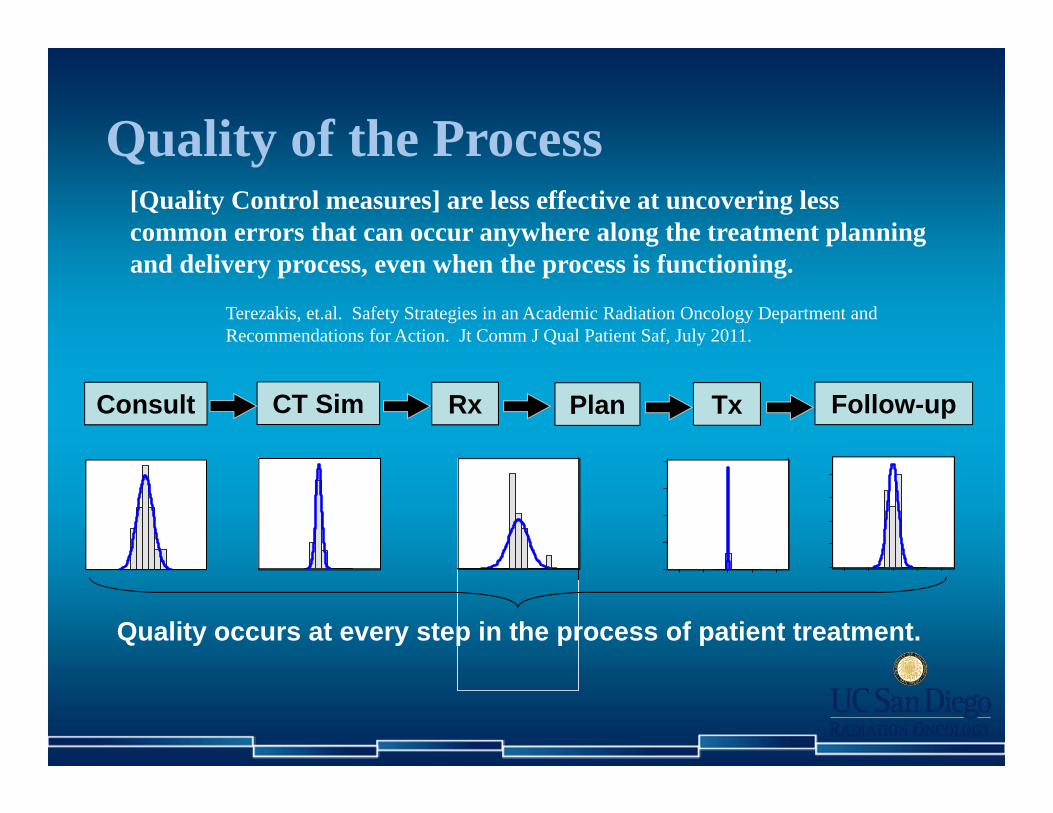
Quality of the Process
CT Sim Rx Follow-upConsult Plan Tx
Quality occurs at every step in the process of patient treatment.
[Quality Control measures] are less effective at uncovering less common errors that can occur anywhere along the treatment planning and delivery process, even when the process is functioning.
Terezakis, et.al. Safety Strategies in an Academic Radiation Oncology Department and Recommendations for Action. Jt Comm J Qual Patient Saf, July 2011.
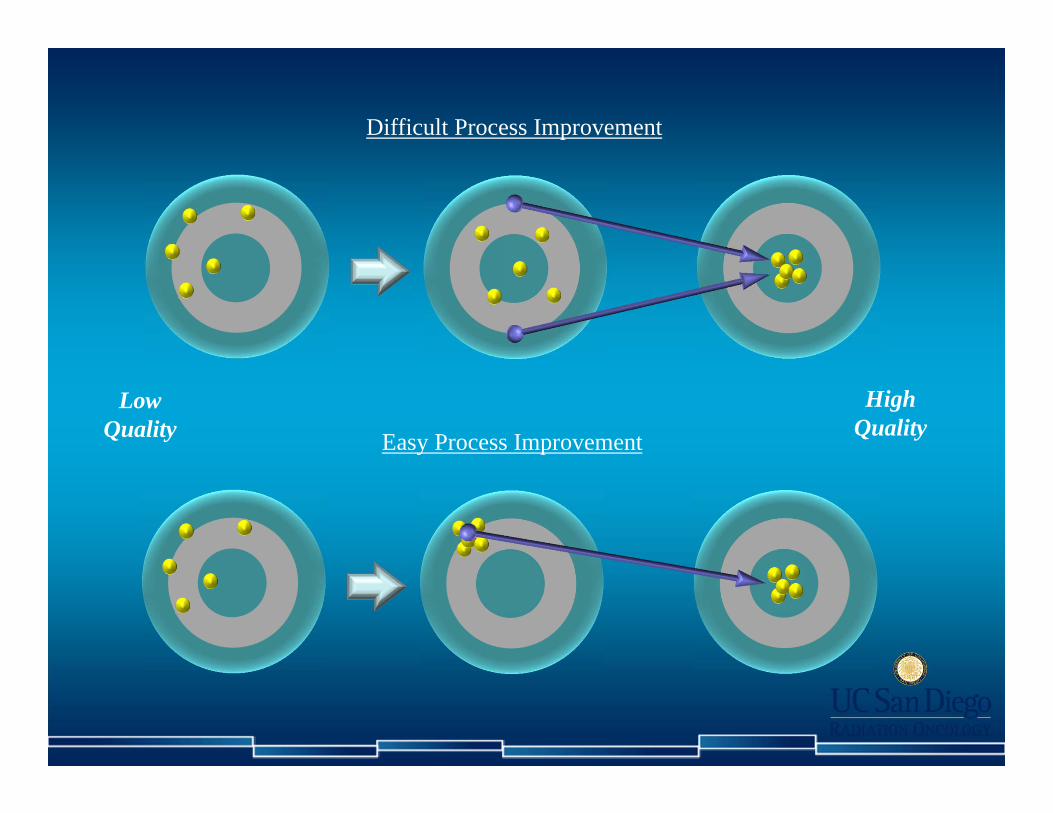
Difficult Process Improvement
Low Quality
High QualityEasy Process Improvement
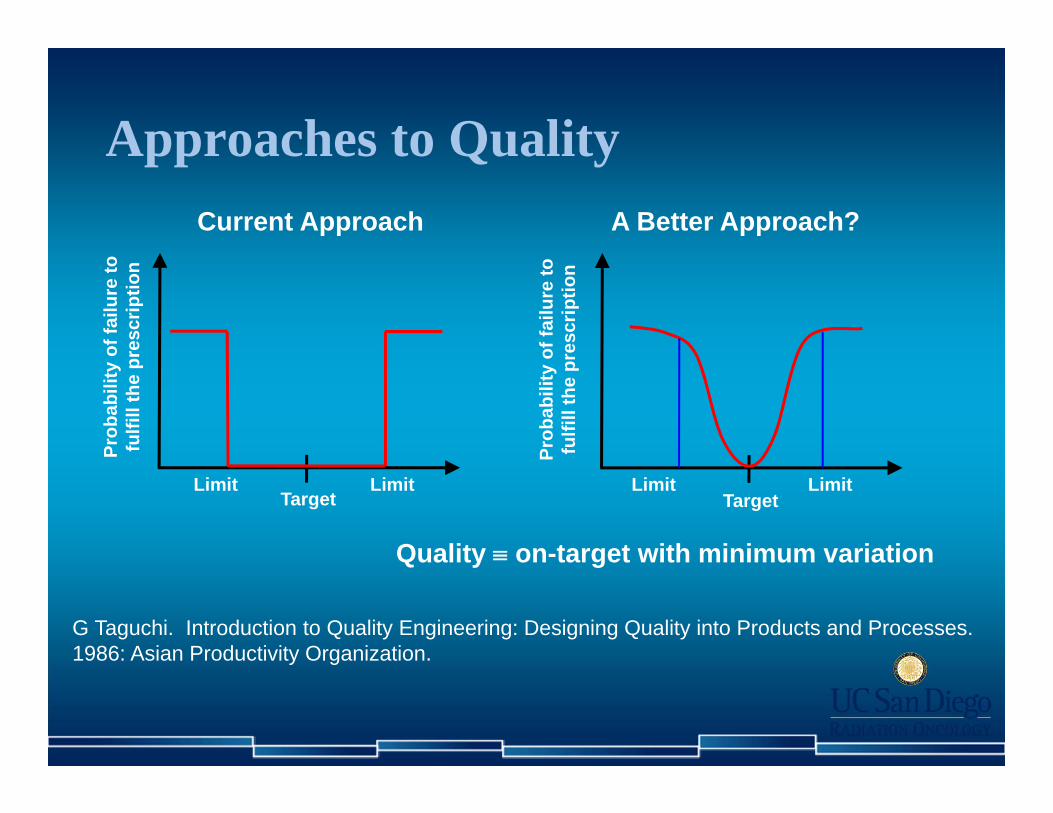
Approaches to Quality
TargetLimit
Prob
abili
ty o
f fai
lure
to
fulfi
ll th
e pr
escr
iptio
n
LimitTarget
Limit Limit
Quality on-target with minimum variation
Current Approach A Better Approach?
Prob
abili
ty o
f fai
lure
to
fulfi
ll th
e pr
escr
iptio
n
G Taguchi. Introduction to Quality Engineering: Designing Quality into Products and Processes. 1986: Asian Productivity Organization.

Nomenclature
• Quality indicators
• Quality measures
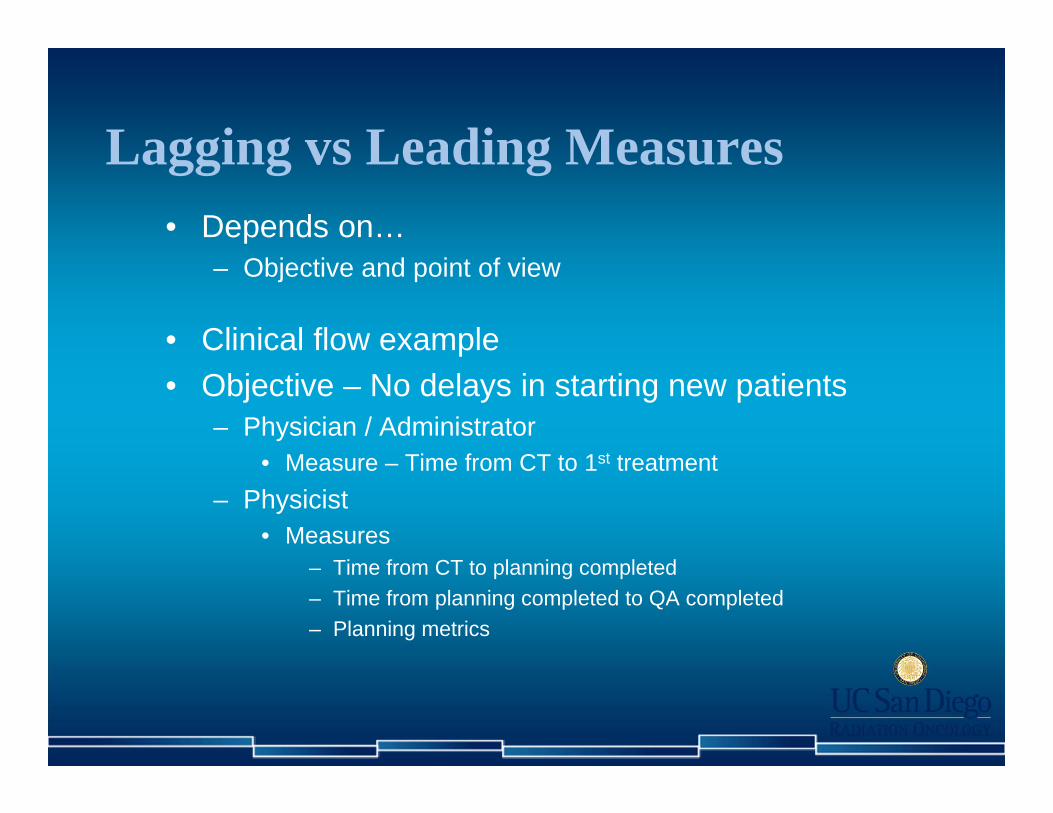
Lagging vs Leading Measures• Depends on…
– Objective and point of view
• Clinical flow example• Objective – No delays in starting new patients
– Physician / Administrator• Measure – Time from CT to 1st treatment
– Physicist• Measures
– Time from CT to planning completed– Time from planning completed to QA completed– Planning metrics

Clinical practice measure Physics measure
Indicator Process efficiency Consistency of linac X-ray output
Measure Time from CT simulation to first treatment Daily Linac output
Operational definition
of the measure
Work–hours from the time that the simulation
bill is created to the first linac beam–on for the
patient’s treatment.
The x-ray output will be measured for a
10x10cm2 field at the position of the isocenter
with an appropriate amount of build-up.
Source for the
measureDepartment standard AAPM TG–142
Data source Rad Onc information system RBA–5 beam measurement device
Plan for data
collection
Rich from IT will export data once per week
on Monday after treatments and provide it to
Mary in administration.
The therapist on the linac will measure the
output before treatment. The data
automatically dumps to the database. The
physicist of the day will collect the data each
day for analysis.
Data sampling or
stratification plan
Include 100% of the non-emergency cases
with a CT simulation . Non-CT cases are not
included. Data will be grouped weekly.
Each linac x-ray output will be measured
daily. Data will be analyzed per day for each
x-ray energy.
Target 7 working days 0% difference from baseline
Action limits + 2 working days ± 3%

Quality Measures
KQM’s
Flow
Plan
SetupContours
Delivery
Linac output IMRT QA
intra-fraction motion
Targets Normal Tissues
Simulation to 1st fraction Plan turn around time Fraction of cases re-planned
DVH Max dose Min dose
Daily shiftsinter-fraction motion

Nomenclature cont.• Goal or target• Action limits and Tolerance levels
Accept
Action Limits
Target
Tolerance LevelsInvestigate Investigate
Stop Treatment
Stop Treatment

Tolerance Levels
• Analyzing process behavior – Tolerance levels should be process specific and
set by a statistical analysis of process data
• Create limit lines around historical average performance of a process– Point outside limit lines is an operational definition for action

Tolerance Limits Based on Process Performance

Use of Process Charts
• Phase 1– Use historical data to understand process performance
• Phase 2– Assessment of expected process performance– Process monitoring and improvement

IMRT QA
More consistent process – less chance for error, high quality
Less consistent process – more chance for error, low quality
Action Limits

Accept
Quality Improvement
Action Limits
Target
Quality Improvement
Tolerance Limits
Quality Improvement

Wheeler & Chambers1992
Figure 1.10
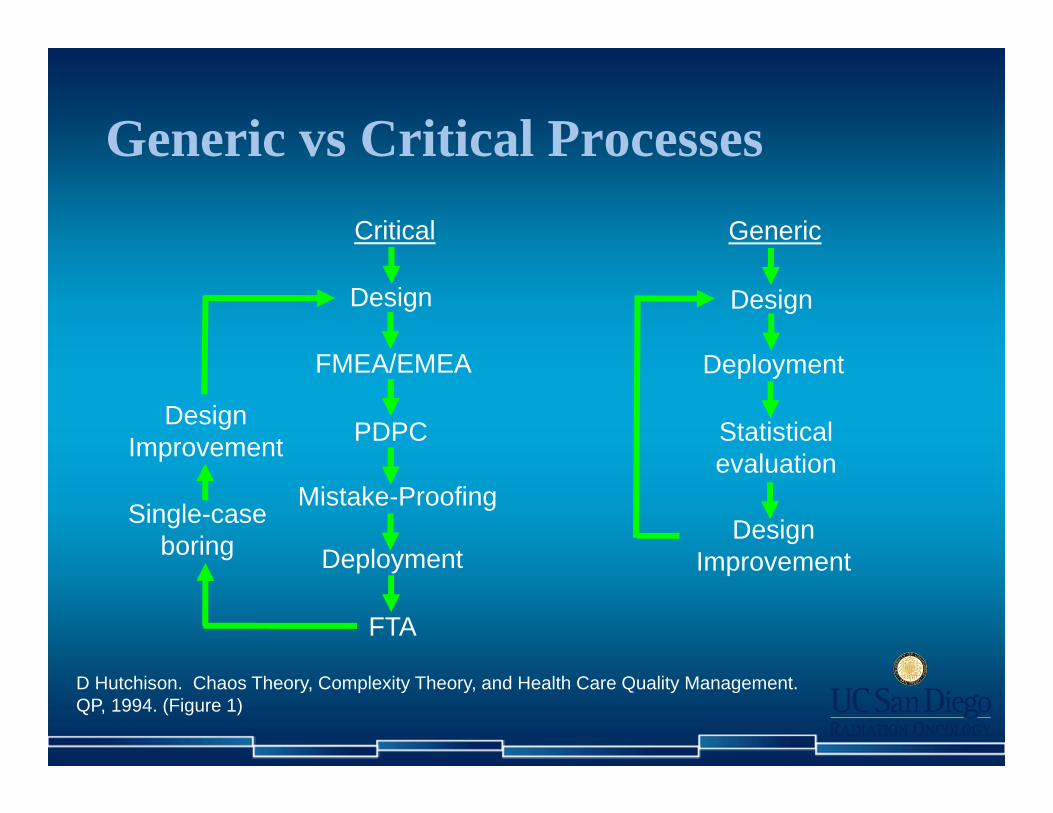
Generic vs Critical Processes
D Hutchison. Chaos Theory, Complexity Theory, and Health Care Quality Management. QP, 1994. (Figure 1)
Generic
Design
Statistical evaluation
Deployment
Design Improvement
Single-case boring
Design Improvement
Design
FTA
Deployment
Mistake-Proofing
PDPC
FMEA/EMEA
Critical

Six Sigma DMAIC• Define – Measure – Analyze – Improve – Control • Data-driven process improvement
DefineWhat problem to solve?
MeasureWhat is the process capability?
AnalyzeWhen & where do defects occur?
ImproveGo after root causes.
ControlControl process to sustain gains.
Redesign
Optimization

Six Sigma Training
• 5 members– Physicist– Dosimetrist– Therapist– Clin Ops Manager– IT
• June – December 2010
DefineWhat problem to solve?
MeasureWhat is the process capability?
AnalyzeWhen & where do defects occur?
ImproveGo after root causes.
ControlControl process to sustain gains.

Six Sigma – Project Scorecard
Develop a Project Charter with the Project Focus , Key Metrics , and Project Scope
Create a Process Map of the key process involving key personnel involved in the process .
Ana lyze process flow and identi fy waste
Priori ti ze potentia l solutions including cost benefi ts .
Create a Control Plan for solution
Form an improvement team including key s takeholders
Create a plan for col lecting data Determine sources of variation across process
Identi fy, eva luate, and select, best solution
Continue to monitor and s tabi l ze process us ing control charts
Va l idate problem s tatement and goals with s takeholders
Determine process performance / capabi l i ty
Ana lyze data col lected for trends, patterns , and relationships .
Develop, optimize and Implement pi lot solution
Develop SOP's and process maps for implemented solution
Create a communication plan with action i tems
Val idate the measurement sys tems
Perform root cause analys is and priori tize causes .
Develop "To Be" value s tream map
Trans ition project to process owner
Create a Value Stream Map of the selected process involving key personnel involved in the process .
Col lect data for "As ‐Is " processAna lyze two samples us ing Hypothes is Tests
Val idate pi lot solution for portentia l improvements with feedback from key s takeholders
Communicate project success & cha l lenges to create opportuni ties for sys tem wide adoption.
Develop a high level process map (SIPOC)
Analyze three or more samples us ing ANOVA
FMEA of potentia l fa i lures Faci l i ta te change management
Col lect basel ine data i f exis tsUnderstand relationships in two variables Correlation
Des ign of Experiments
Determine "Voice of Customer" as i t relates to the project
Determine relationships in variables using Regression
Review with Sponsor Review with Sponsor Review with Sponsor Review with Sponsor Review with Sponsor
Define Measure Analyze Improve Control
Value Stream Map
Process Map
RCA
Regression Analysis
FMEADesign of Experiments
Control ChartSOPs
SIPOC

Six Sigma – Lessons Learned
• Requirements– Direct line of accountability to senior management
• Key to success– Team problem solving– Real-time data
• Most difficult part– Data collection and analysis
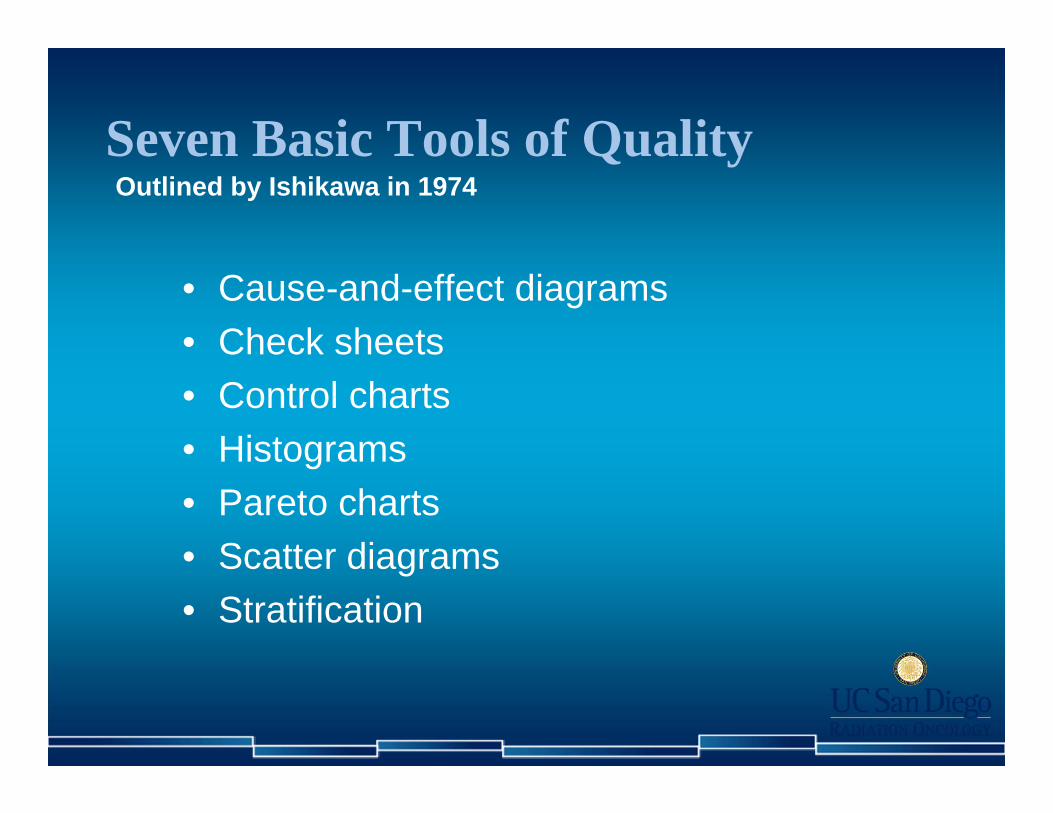
Seven Basic Tools of Quality
• Cause-and-effect diagrams• Check sheets• Control charts• Histograms• Pareto charts• Scatter diagrams• Stratification
Outlined by Ishikawa in 1974

Follow-up
Steps toward quality improvement1. Determine Key Quality Measures2. Set action limits on those measures3. Obtain real-time data4. Process performance Action Limits?
Consultation
Simulation
Prescription
Planning
Treatment
Quality improvement– Real-time and on-going– Not a one-time or periodic intervention
Benchmarking / Standardization – A “best way” to do things

Ways to Quality Improvement
Scientific approach to process quality
Collaboration with quality experts
Focus from rad onc leadership
Fast publication of guidance documents
Effective collaboration with vendors
Pawlicki and Mundt Med Phys 2007Vision 20/20 Article

• Standardization and information sharing – e.g., linac performance, etc.
• Methods to easily capture relevant data – Process benchmarking and action limits– Continuous feedback mechanism
• Tools to evaluate process performance– Easily compare process outputs to benchmarks
Vendor Collaborations

Continued Efforts
• New technologies
• Mistake-proofing (FMEA)
• Software usability
• Human factors

Big Picture ModeConcerned with high level
aspects of quality, accreditation, etc.
Re-active ModeDriven by latest and loudest
Ideal ModeBalance between quality perspective and quality
control
Drill Down ModeFocus on details to the
detriment of everything else
Perspect ive
Co
ntr
ol

Summary
• New equipment and techniques will always be important
• Process view and scientific approach to quality improvement– Knowledge and experience with quality tools
• Minimize process variation
• Physicists should play a larger role in overall quality improvement
Related Documents