UNIT 7.13 Diffraction Techniques in Structural Biology Martin Egli 1 1 Department of Biochemistry, Vanderbilt University School of Medicine, Nashville, Tennessee A detailed understanding of chemical and biological function and the mecha- nisms underlying the molecular activities ultimately requires atomic-resolution structural data. Diffraction-based techniques such as single-crystal X-ray crys- tallography, electron microscopy, and neutron diffraction are well established and they have paved the road to the stunning successes of modern-day structural biology. The major advances achieved in the last twenty years in all aspects of structural research, including sample preparation, crystallization, the construc- tion of synchrotron and spallation sources, phasing approaches, and high-speed computing and visualization, now provide specialists and nonspecialists alike with a steady flow of molecular images of unprecedented detail. The present unit combines a general overview of diffraction methods with a detailed description of the process of a single-crystal X-ray structure determination experiment, from chemical synthesis or expression to phasing and refinement, analysis, and quality control. For novices it may serve as a stepping-stone to more in-depth treatises of the individual topics. Readers relying on structural information for interpreting functional data may find it a useful consumer guide. C 2016 by John Wiley & Sons, Inc. Keywords: crystallization diffraction electron microscopy neutron scat- tering structural biology X-ray crystallography How to cite this article: Egli, M., Diffraction techniques in structural biology. 2016. Curr. Protoc. Nucleic Acid Chem. 65:7.13.1-7.13.41. doi: 10.1002/cpnc.4 INTRODUCTION There are numerous approaches that fur- nish insight into the conformational proper- ties of biopolymers such as proteins and nu- cleic acids. Among these, diffraction-based techniques occupy a unique place due to the atomic-resolution picture that they can reveal. Thus, provided a single crystal of a receptor, virus, or RNA diffracts X-rays to very high res- olution, conformation, molecular interactions, and water structure can be visualized in stun- ning detail. Selected examples of successes in the crystallographic structure determination of macromolecular assemblies, receptors, molec- ular machines, and viruses are depicted in Figure 7.13.1. In the last fifteen years, we have wit- nessed an unprecedented increase in the num- ber of new crystal structures. Online databases such as the Research Collaboratory for Struc- tural Biology/Protein Data Bank (RCSB/PDB; http://www.rcsb.org; 115,764 structures as of February, 9, 2016; Berman et al., 2000; Rose et al., 2015) and the Nucleic Acid Database (NDB; http://ndbserver.rutgers.edu; 7,977 structures deposited as of February 3, 2016; Berman et al., 1992; Narayanan et al., 2013) now boast large numbers of entries. The number of new PDB entries per year has reached almost 10,000 in the past three years. Indeed, with the advent of structural genomics, the old adage that structure determination is preceded by a thorough understanding of func- tion has given way to structure-driven initia- tives that promise insights into function from structure, i.e., the Protein Structure Initiative (PSI) funded by the U.S. National Institutes of Health (https://www.nigms.nih.gov/Research/ specificareas/PSI/Pages/default.aspx; Chan- donia and Brenner, 2006; Terwilliger et al., Current Protocols in Nucleic Acid Chemistry 7.13.1-7.13.41, June 2016 Published online June 2016 in Wiley Online Library (wileyonlinelibrary.com). doi: 10.1002/cpnc.4 Copyright C 2016 John Wiley & Sons, Inc. Biophysical Analysis of Nucleic Acids 7.13.1 Supplement 65

Welcome message from author
This document is posted to help you gain knowledge. Please leave a comment to let me know what you think about it! Share it to your friends and learn new things together.
Transcript

UNIT 7.13Diffraction Techniques in StructuralBiologyMartin Egli1
1Department of Biochemistry, Vanderbilt University School of Medicine, Nashville,Tennessee
A detailed understanding of chemical and biological function and the mecha-nisms underlying the molecular activities ultimately requires atomic-resolutionstructural data. Diffraction-based techniques such as single-crystal X-ray crys-tallography, electron microscopy, and neutron diffraction are well establishedand they have paved the road to the stunning successes of modern-day structuralbiology. The major advances achieved in the last twenty years in all aspects ofstructural research, including sample preparation, crystallization, the construc-tion of synchrotron and spallation sources, phasing approaches, and high-speedcomputing and visualization, now provide specialists and nonspecialists alikewith a steady flow of molecular images of unprecedented detail. The present unitcombines a general overview of diffraction methods with a detailed descriptionof the process of a single-crystal X-ray structure determination experiment,from chemical synthesis or expression to phasing and refinement, analysis, andquality control. For novices it may serve as a stepping-stone to more in-depthtreatises of the individual topics. Readers relying on structural information forinterpreting functional data may find it a useful consumer guide. C© 2016 byJohn Wiley & Sons, Inc.
Keywords: crystallization � diffraction � electron microscopy � neutron scat-tering � structural biology � X-ray crystallography
How to cite this article:Egli, M., Diffraction techniques in structural biology. 2016. Curr. Protoc.
Nucleic Acid Chem. 65:7.13.1-7.13.41.doi: 10.1002/cpnc.4
INTRODUCTIONThere are numerous approaches that fur-
nish insight into the conformational proper-ties of biopolymers such as proteins and nu-cleic acids. Among these, diffraction-basedtechniques occupy a unique place due to theatomic-resolution picture that they can reveal.Thus, provided a single crystal of a receptor,virus, or RNA diffracts X-rays to very high res-olution, conformation, molecular interactions,and water structure can be visualized in stun-ning detail. Selected examples of successes inthe crystallographic structure determination ofmacromolecular assemblies, receptors, molec-ular machines, and viruses are depicted inFigure 7.13.1.
In the last fifteen years, we have wit-nessed an unprecedented increase in the num-ber of new crystal structures. Online databasessuch as the Research Collaboratory for Struc-
tural Biology/Protein Data Bank (RCSB/PDB;http://www.rcsb.org; 115,764 structures as ofFebruary, 9, 2016; Berman et al., 2000;Rose et al., 2015) and the Nucleic AcidDatabase (NDB; http://ndbserver.rutgers.edu;7,977 structures deposited as of February 3,2016; Berman et al., 1992; Narayanan et al.,2013) now boast large numbers of entries.The number of new PDB entries per year hasreached almost 10,000 in the past three years.Indeed, with the advent of structural genomics,the old adage that structure determination ispreceded by a thorough understanding of func-tion has given way to structure-driven initia-tives that promise insights into function fromstructure, i.e., the Protein Structure Initiative(PSI) funded by the U.S. National Institutes ofHealth (https://www.nigms.nih.gov/Research/specificareas/PSI/Pages/default.aspx; Chan-donia and Brenner, 2006; Terwilliger et al.,
Current Protocols in Nucleic Acid Chemistry 7.13.1-7.13.41, June 2016Published online June 2016 in Wiley Online Library (wileyonlinelibrary.com).doi: 10.1002/cpnc.4Copyright C© 2016 John Wiley & Sons, Inc.
BiophysicalAnalysis ofNucleic Acids
7.13.1
Supplement 65

Figure 7.13.1 Recent triumphs of structural biology. (A) The ribosome (large subunit; PDBentry code 1ffk). (B) Adrenergic receptor (GPCR; PDB entry code 2rh1). (C) Poliovirus (PDBentry code 2plv). (D) Photosystem II (PDB entry code 1s5l). (E) Cyanobacterial masterclock protein KaiC (PDB entry code 2gbl). (F) Fatty acid synthase (PDB entry codes 2uvband 2uvc). Reproduced from Molecule of the Month Illustrations ([email protected]; http://www.rcsb.org/pdb/static.do?p=education_discussion/molecule_of_the_month/index.html) by David S.Goodsell with permission from RCSB Protein Data Bank (PDB).
2009), and offshoots such as the PSIStructural Biology Knowledgebase (http://www.sbkb.org; Gabanyi et al., 2011).
For some one-hundred years (Wilkins,2013), starting with the first diffraction im-age of zinc blende taken by Friedrich, Knip-ping, and von Laue (1912) and the interpreta-tion of its structure by Bragg (Bragg, 1913),
diffraction techniques have shaped our per-ception of the structure of condensed matter.An overview of the Nobel prizes awarded toscientists behind discoveries related to diffrac-tion and their application to physics, chem-istry, biology, and medicine provides evi-dence for the wide-ranging scientific impactof diffraction phenomena (Fig. 7.13.2 and
DiffractionTechniques in
Structural Biology
7.13.2
Supplement 65 Current Protocols in Nucleic Acid Chemistry

Figure 7.13.2 Nobel laureates in the fields of X-ray, neutron and electron diffraction, and diffraction-based structuralchemistry and structural biology (http://www.nobelprize.org). Image courtesy of Prof. Angelo Vedani, University of Basel.
Table 7.13.1). The explosive growth in thenumber of crystal structures during the lastseveral years followed dramatic advances inpractically all areas of X-ray crystallogra-phy, including crystallization (sparse matrixscreens and robotics; Jancarik and Kim, 1991;Doudna et al., 1993; Scott et al., 1995; Bergeret al., 1996; see UNIT 7.6, Ferre-D’Amare andDoudna, 2000), crystal handling (flash freez-ing; Garman and Owen, 2006), data collec-tion and resolution (synchrotron sources andfast charge coupled device [CCD] detectors;
Hendrickson, 2000), phasing (single- andmulti-wavelength anomalous dispersion; Ter-williger and Berendzen, 1999; Weeks et al.,2003; Sheldrick, 2010), electron density mapinterpretation and model building (automaticchain tracing; CCP4, 1994; Abola et al., 2000;Emsley and Cowtan, 2004), and structurerefinement (increased computer power, sim-ulated annealing, and maximum likelihood re-finement; Murshudov et al., 1999; Brungerand Adams, 2002; Adams et al., 2010). It isnow feasible to mount a protein crystal in the
BiophysicalAnalysis ofNucleic Acids
7.13.3
Current Protocols in Nucleic Acid Chemistry Supplement 65

Table 7.13.1 Nobel Prizes Related to Diffraction and Crystallography
Year Nobel laureate(s) Field Discoverya
1901 Wilhelm C. Roentgen Physics Recognition of the extraordinary serviceshe has rendered by the discovery of theremarkable rays subsequently namedafter him
1914 Max von Laue Physics Discovery of the diffraction of X-rays bycrystals
1915 William H. Bragg andWilliam L. Bragg
Physics Their services in the analysis of crystalstructure by means of X-rays
1927 Arthur H. Compton andCharles T. R. Wilson
Physics Discovery of the effect named after him,method of making the paths ofelectrically charged particles visible bycondensation of vapor
1936 Peter J. W. Debye Chemistry Contributions to our knowledge ofmolecular structure through hisinvestigations on dipole moments and onthe diffraction of X-rays and electrons ingases
1937 Clinton J. Davisson andGeorge P. Thomson
Physics Experimental discovery of the diffractionof electrons by crystals
1946 James B. Sumner Chemistry Discovery that enzymes can becrystallized
1954 Linus C. Pauling Chemistry Research into the nature of the chemicalbond and its application to the elucidationof the structure of complex substances
1962 John Kendrew and MaxPerutz
Chemistry Studies of the structures of globularproteins
1962 James D. Watson, FrancisH. C. Crick, and MauriceH. F. Wilkins
Medicine Discoveries concerning the molecularstructure of nucleic acids and itssignificance for information transfer inliving material
1964 Dorothy Hodgkin Chemistry Determinations by X-ray techniques ofthe structures of important biochemicalsubstances
1976 William N. Lipscomb Chemistry Studies on the structure of boranesilluminating problems of chemicalbonding
1982 Aaron Klug Chemistry Development of crystallographic electronmicroscopy and his structural elucidationof biologically important nucleicacid-protein complexes
1985 Herbert A. Hauptman andJerome Karle
Chemistry Outstanding achievements in thedevelopment of direct methods for thedetermination of crystal structures
1987 Robert Huber, JohannDeisenhofer, and HartmutMichel
Chemistry Determination of the three-dimensionalstructure of a photosynthetic reactioncenter
1994 Clifford G. Shull Physics Development of the neutron diffractiontechnique
continued
DiffractionTechniques in
Structural Biology
7.13.4
Supplement 65 Current Protocols in Nucleic Acid Chemistry

Table 7.13.1 Nobel Prizes Related to Diffraction and Crystallography, continued
Year Nobel laureate(s) Field Discoverya
1997 John E. Walker Chemistry Three-dimensional structure of ATPsynthase
2003 Peter Agre and RoderickMacKinnon
Chemistry Discovery of water channels, structuraland mechanistic studies of ion channels
2006 Roger D. Kornberg Chemistry Studies of the molecular basis ofeukaryotic transcription
2009 Thomas A. Steitz,VenkatramanRamakrishnan, and Ada E.Yonath
Chemistry Studies of the structure and function ofthe ribosome
2011 Daniel Shechtman Chemistry Discovery of quasicrystals
2012 Robert J. Lefkowitz andBrian K. Kobilka
Chemistry Studies of G-protein-coupled receptors
aSource: http://www.nobelprize.org.
morning and end up with a preliminary, par-tially refined structure in the afternoon.
The so-called X-ray free-electron laser(FEL) constitutes the most exciting devel-opment in recent years in macromolecularcrystallography and for structural biology ingeneral (Chapman et al., 2011). Short fem-tosecond (fs) X-ray pulses of extreme bril-liance, in combination with showers of nano-or microcrystals that consist of just a fewdozen unit cells in some cases, yield diffractiondata essentially before vaporizing the sam-ples. Thus, nanocrystallography using FELsenables structural characterization of proteincrystals that are beyond the reach of con-ventional crystallography and can also affordtime-resolved analyses (molecular movies).
However, all these breakthroughs do notchange the fact that crystallography can be atedious business. Crystallization and phasingrepresent common bottlenecks on the way toa structure, and what is many times a straight-forward exercise can become a make-or-breakeffort that lasts months or years in some cases.Although it is impossible a priori to identifyproblem cases, empirical evidence exists sup-porting the notions that membrane proteinsare hard to crystallize, that sampling proteinsfrom various organisms increases the chancesof obtaining diffraction-quality crystals, andthat derivatization and phasing approaches,ideally suited for proteins in the 15- to 50-kDa range, are frequently inadequate to crackthe structures of large macromolecular assem-blies. Particularly as far as the latter are con-cerned, electron microscopy (EM) representsa powerful approach for structure and function
studies at the intermediate 5- to 30-A resolu-tion range. In favorable cases and with averag-ing of �1 million subunits, near-atomic reso-lution can be achieved (Fig. 7.13.3; Baumeis-ter and Steven, 2000; Zhou, 2008). Improve-ments in sample preparation and the advent ofso-called direct detection cameras (that countelectrons) now result in increasing numbersof cryo-EM structures with resolutions of 5 Aor higher, thus bridging the gap between themedium- and atomic-resolution range (Bin-shtein and Ohi, 2015). Moreover, hybrid struc-tural approaches (Schneidman-Duhovny et al.,2012), marrying EM and X-ray crystallog-raphy (Fig. 7.13.4; Liu et al., 2010; Reddyet al., 2010), crystallography and solutionNMR (Carlon et al., 2016), small angle X-ray scattering (SAXS; see UNIT 7.18, Burke andButcher, 2012), EM and X-ray crystallography(Pattanayek et al., 2011), or other combina-tions of biophysical and structural techniquesare becoming ever more popular.
This unit gives an overview of some of themajor techniques in structural biology, partic-ularly those that rely on diffraction, by brieflysummarizing the benefits and limitations ofindividual methods and comparing them toeach other. It will then describe in some de-tail the main stages of structure determinationsby single-crystal X-ray crystallography, fromcrystallization to structure refinement, anal-ysis, and quality control. It is by no meansthe intent of the author to provide an exhaus-tive account of the topic of X-ray diffractionand macromolecular structure determination(Rupp, 2010; Ennifar, 2015). The interestedreader may turn to some of the additional
BiophysicalAnalysis ofNucleic Acids
7.13.5
Current Protocols in Nucleic Acid Chemistry Supplement 65

Figure 7.13.3 From the visible to the invisible. The diagram depicts the rough sizes of cells andtheir components on a logarithmic scale and illustrates the range of objects that can be visualizedwith different techniques.
Figure 7.13.4 Comparison of adenovirus structures obtained by X-ray crystallography and cryo-EM at 3.5 A resolution. (A) Structure and electron density of a segment of protein VIII obtainedby X-ray crystallography (Reddy et al., 2010; Reddy and Nemerow, 2014). (B) The correspondingsegment and electron density obtained by cryo-EM (Liu et al., 2010). Image courtesy of Prof. VijayReddy, The Scripps Research Institute.
reading material listed at the end of the unitfor a more in-depth treatment of the individualtopics touched upon in this brief review.
MAJOR TECHNIQUES INSTRUCTURAL BIOLOGY
The following methods are considered tobe of primary importance for experimen-tal, three-dimensional structure determination:X-ray crystallography, X-ray fiber diffrac-tion, electron diffraction, electron microscopy,neutron diffraction, and nuclear magnetic
resonance (NMR). There are additional tech-niques that can provide insight into the shapeof macromolecules, for example, SAXS (Put-nam et al., 2007; Hura et al., 2013), fluores-cence resonance energy transfer (FRET; Lil-ley and Wilson, 2000; Schuler and Eaton,2008), electron paramagnetic resonance spec-troscopy (EPR; Mchaourab et al., 2011; UNIT
7.17, Romainczyk et al., 2012), and hydrogen-deuterium exchange in combination with massspectrometry (HDX/MS; Konermann et al.,2011). Although these and other techniques
DiffractionTechniques in
Structural Biology
7.13.6
Supplement 65 Current Protocols in Nucleic Acid Chemistry

Figure 7.13.5 Light microscopy versus diffraction. Structure determination by X-ray diffractionentails the use of a mathematical lens, Fourier Transformation (FT), to “focus” the scatteredradiation.
Figure 7.13.6 Principles of fiber diffraction. The diffraction pattern resulting from aligned helicalstructures in fibers exposed to X-rays exhibit characteristic cross-like shapes. The drawing ofthe DNA duplex was originally created by Odile Crick and is adapted from Kemp (2003) withpermission from Nature Publishing Group.
are very useful in combination with any of theabove approaches and can also shed light onthe dynamic behavior of molecular systems,they will not be considered further here.
A key difference between optical or elec-tron microscopy and X-ray diffraction is that,unlike light or electron beams, X-rays cannotbe focused (Fig. 7.13.5). The X-ray crystallo-graphic visualization of a molecule requires amathematical lens—Fourier transformation—that generates a 3D structure from the ampli-tudes of the scattered radiation (the structurefactors) and the phases. The phase informationis lost in the diffraction experiment, but sev-eral methods allow one to recover the phasesand we will get back to the so-called phaseproblem in X-ray crystallography (see Phas-ing Approaches section below).
X-Ray Fiber DiffractionFiber diffraction can give key insights
into the geometry of nucleic acids or fibrousproteins (i.e., collagen) and its golden eracoincides with the discovery of the struc-ture of DNA. Very long double-helical DNAmolecules tend to be packed side by side inan ordered manner inside fibers. The helicalstructure gives rise to cross-shaped diffrac-tion patterns with various separations betweenlayer lines (Fig. 7.13.6). The spacing of layerlines is determined by the helical repeat, andas the repeat distance increases, the layer linesmove closer together. The DNA diffractionpattern depicted in Figure 7.13.6 shows dif-ferent numbers of spots, and the pattern fromA-DNA indicates a higher degree of regu-larity in the packing arrangement of fibers
BiophysicalAnalysis ofNucleic Acids
7.13.7
Current Protocols in Nucleic Acid Chemistry Supplement 65
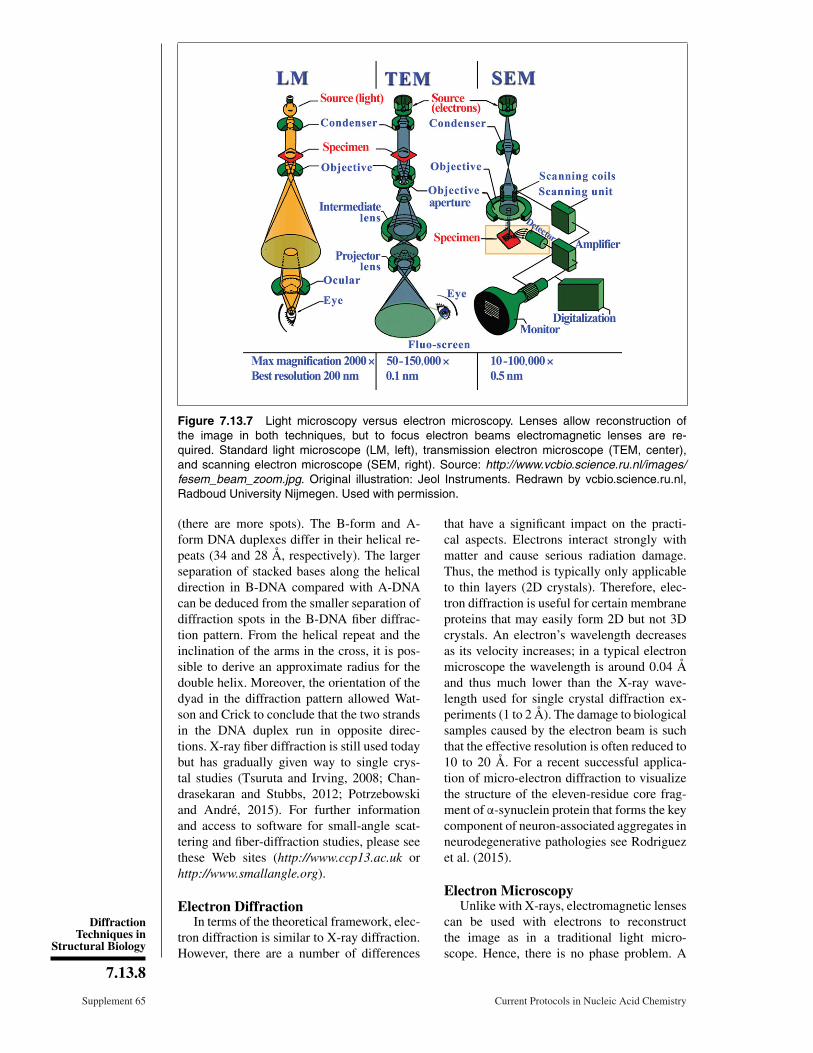
Figure 7.13.7 Light microscopy versus electron microscopy. Lenses allow reconstruction ofthe image in both techniques, but to focus electron beams electromagnetic lenses are re-quired. Standard light microscope (LM, left), transmission electron microscope (TEM, center),and scanning electron microscope (SEM, right). Source: http://www.vcbio.science.ru.nl/images/fesem_beam_zoom.jpg. Original illustration: Jeol Instruments. Redrawn by vcbio.science.ru.nl,Radboud University Nijmegen. Used with permission.
(there are more spots). The B-form and A-form DNA duplexes differ in their helical re-peats (34 and 28 A, respectively). The largerseparation of stacked bases along the helicaldirection in B-DNA compared with A-DNAcan be deduced from the smaller separation ofdiffraction spots in the B-DNA fiber diffrac-tion pattern. From the helical repeat and theinclination of the arms in the cross, it is pos-sible to derive an approximate radius for thedouble helix. Moreover, the orientation of thedyad in the diffraction pattern allowed Wat-son and Crick to conclude that the two strandsin the DNA duplex run in opposite direc-tions. X-ray fiber diffraction is still used todaybut has gradually given way to single crys-tal studies (Tsuruta and Irving, 2008; Chan-drasekaran and Stubbs, 2012; Potrzebowskiand Andre, 2015). For further informationand access to software for small-angle scat-tering and fiber-diffraction studies, please seethese Web sites (http://www.ccp13.ac.uk orhttp://www.smallangle.org).
Electron DiffractionIn terms of the theoretical framework, elec-
tron diffraction is similar to X-ray diffraction.However, there are a number of differences
that have a significant impact on the practi-cal aspects. Electrons interact strongly withmatter and cause serious radiation damage.Thus, the method is typically only applicableto thin layers (2D crystals). Therefore, elec-tron diffraction is useful for certain membraneproteins that may easily form 2D but not 3Dcrystals. An electron’s wavelength decreasesas its velocity increases; in a typical electronmicroscope the wavelength is around 0.04 Aand thus much lower than the X-ray wave-length used for single crystal diffraction ex-periments (1 to 2 A). The damage to biologicalsamples caused by the electron beam is suchthat the effective resolution is often reduced to10 to 20 A. For a recent successful applica-tion of micro-electron diffraction to visualizethe structure of the eleven-residue core frag-ment of α-synuclein protein that forms the keycomponent of neuron-associated aggregates inneurodegenerative pathologies see Rodriguezet al. (2015).
Electron MicroscopyUnlike with X-rays, electromagnetic lenses
can be used with electrons to reconstructthe image as in a traditional light micro-scope. Hence, there is no phase problem. A
DiffractionTechniques in
Structural Biology
7.13.8
Supplement 65 Current Protocols in Nucleic Acid Chemistry

Figure 7.13.8 Example of a SEM image. Thestar-shaped structure in a mature extracellu-lar Acanthamoeba polyphaga mimivirus, anicosahedral double-stranded DNA virus. Thescale bar measures 200 nm. Reproduced fromZauberman et al. (2008).
comparison between a standard light micro-scope and transmission and scanning electronmicroscopes (TEM and SEM, respectively) isdepicted in Figure 7.13.7. Samples for EMhave to be carefully prepared: (1) they need tobe exposed to high vacuum and therefore fixedwith special chemicals or frozen; (2) extremelythin sections are required, as electrons havelimited penetrating power; and (3) samples areoften exposed to heavy metals (staining) be-cause the contrast depends on the atomic num-ber. In SEM, the specimen is dried and coatedwith a thin layer of heavy metal. The techniqueallows visualization of secondary electronsthat are scattered or emitted from the speci-men surface. SEM provides great depth of fo-cus but only surface features can be examinedand the resolution is not very high (�100 A).
An example of a SEM image is shown inFigure 7.13.8.
TEM uses electrons that have passedthrough a specimen to form an image. Speci-mens are usually fixed, embedded, sectioned,and stained with an electron-dense material.Various techniques can be differentiated,one of them being metal shadowing thatallows visualization of surface structures orcell components. Another technique is freezefracture or freeze etch, used for studying mem-branes and the cell interior. Finally, negativestaining and cryo-electron microscopy(Fig. 7.13.9) can be applied to unfixedbiological samples. Thus, these techniquesare useful to visualize large macromolecularassemblies such as viruses or ribosomes.
A single protein molecule gives only a weakand ill-defined image in the electron micro-scope. Increasing the signal by using higherintensity beams or longer exposure only in-creases the radiation damage. Therefore, it isnecessary to combine the information frommany molecules so as to average out randomerrors in the single images. This is more easilyachieved when the molecule or particle fea-tures high symmetry, a key property of manyviruses (Chiu et al., 1997). It is possible toapply averaging techniques and reconstruc-tion analysis also to nonsymmetric molecules(Saibil, 2000). Images of randomly orientedmolecules are collected and classes of simi-lar particles are generated (Fig. 7.13.10). An-gles are then assigned to each class and a3D averaging procedure is carried out. Theprocess can be further refined by projectingthe image obtained, and using the projec-tions to break the original classes into smaller
Figure 7.13.9 Negative-stain and cryo-EM. Left: A virus particle is outlined with good contrastby heavy-metal stain but is somewhat flattened due to dehydration. Right: By comparison, it ispreserved in the native state in the cryo-EM sample, but the protein-ice contrast is very low. Theparticle is therefore imaged over holes in the carbon support to maximize the contrast. Reprintedfrom Saibil (2000) with permission from the International Union of Crystallography.
BiophysicalAnalysis ofNucleic Acids
7.13.9
Current Protocols in Nucleic Acid Chemistry Supplement 65

Figure 7.13.10 Single-particle electron microscopy (EM) 3D-reconstruction from 2D-projections.A set of 2D-projections (four in this case) is depicted along rendered iso-surfaces. The Fouriertransform (FT) of a 2D-projection is equivalent to a central section in the 3D-FT of a molecule. Oncea sufficient number of sections are available, the complete 3D-transform can be generated andinverse-transformed into a 3D-density map (bottom). Reprinted from Saibil (2000) with permissionfrom the International Union of Crystallography.
ones and then assigning more precise angles(Fig. 7.13.11).
In favorable cases and facilitated by im-provements in preparation techniques, suchas cross-linking (Southworth and Agard,2011), and direct (electron) detection cam-eras (Binshtein and Ohi, 2015), cryo-EM can
reach near-atomic resolution (Fig. 7.13.4).If more detailed structures of componentsof a particle are available from X-ray crys-tallography or solution NMR, these can bebuilt into the cryo-EM molecular envelope(Zhou, 2008; Fig. 7.13.12). Therefore, EMand X-ray crystallography are complementary
DiffractionTechniques in
Structural Biology
7.13.10
Supplement 65 Current Protocols in Nucleic Acid Chemistry

Figure 7.13.11 Refinement by projection matching. Reference images are created by projectinga 3D-map into a set of different orientations (center). Each raw image from the data set (left) is thenrotationally and translationally aligned to individual reference images and given the orientation withthe highest correlation coefficient. Images aligned in this fashion are grouped and averaged onceagain to create an improved 3D map (bottom). Reprinted with permission from Saibil (2000) withpermission from the International Union of Crystallography.
techniques (Liu et al., 2010; Reddy et al.,2010). When considering the structures oftypical single protein or enzyme-ligand com-plexes in the 20 to 150 kDa molecular weightrange, crystallography still delivers far moredetailed information. Nevertheless, EM isan extremely useful technique for studyingmacromolecule assemblies that are difficult tocrystallize or in cases where the production oflarge amounts of materials is problematic. Amore detailed comparison of the similaritiesand differences between EM and X-ray crys-tallography is provided in Table 7.13.2.
Neutron DiffractionA fundamental difference between diffrac-
tion of X-rays (photons) and neutrons is thatthe former are scattered by electrons and thelatter by protons. Neutrons are highly penetrat-ing and unlike X-rays they are nondestructive,and crystals of macromolecules do not decayin neutron beams even after lengthy exposuretimes. X-rays are typically blind to hydrogenatoms in crystals of macromolecules, unless
diffraction data are available to extremely highresolution (�1 A). Even in those cases, thehydrogen atoms of water molecules in well-ordered solvent networks (first and secondshell hydration) normally remain invisible.
The atomic form factor, f, in X-ray scat-tering (a measure of the scattering intensityof a wave by an isolated atom) is replaced bythe scattering length, b, in neutron diffraction.The scattering length varies randomly acrossthe periodic table and its magnitude can differsignificantly even with isotopes of the sameelement, as in the case of hydrogen (1H)and deuterium (2H). The atomic form factors(f�Z) and scattering lengths (unit of measure10-15 m = 1 fm) for selected elements andisotopes are: hydrogen (f = 1; b = −3.8),deuterium (f = 1; b = 6.5), carbon (f = 6, b= 6.6), nitrogen (f = 7, b = 9.4), oxygen (f =8, b = 5.8), sulfur (f = 16, b = 3.1), and iron(f = 26, b = 9.6). For a full list, please seehttp://www.ncnr.nist.gov/resources/n-lengths).Thus, deuterium and carbon exhibit very sim-ilar scattering lengths and the light element
BiophysicalAnalysis ofNucleic Acids
7.13.11
Current Protocols in Nucleic Acid Chemistry Supplement 65

Figure 7.13.12 3D model of the archaeal thermosome holoenzyme. Crystal structures of thesubunits (in color) are modeled into the EM-molecular envelope of the hexadecameric chaperone.Reprinted from Baumeister and Steven (2000) with permission from Elsevier.
can be observed in the presence of the heaviercarbon, oxygen, nitrogen, and sulfur atoms(Fig. 7.13.13). Deuterium also displays muchweaker incoherent scattering than hydrogen.Therefore, visualization of the positions ofhydrogen atoms in neutron crystallographicexperiments requires perdeuteration ofproteins.
There are a number of advantages of neu-tron macromolecular crystallography (NMC)for structural biology (Blakeley et al., 2008).The positions of hydrogen atoms can be lo-cated even at resolutions of �2 A. Thus, NMCis complementary to ultrahigh resolution X-ray macromolecular crystallography (XMC;Afonine et al., 2010; Fenn et al., 2011). Theprotonation and ionization states of atoms canbe determined, thus yielding atomic chargesand pKas (Leal et al., 2010; Casadei et al.,2014). Insights can be gained into hydrogen-bonding patterns because NMC allows oneto determine the orientation of hydroxyl andamide groups (Hanson et al., 2004). Simi-larly, the conformations of methyl groups andside chains can be established in neutron den-sity maps, thus providing details on packing
arrangements. Because it is possible to ob-serve hydrogen atoms in neutron structures,the orientations of water molecules can be de-termined, effectively revealing donor and ac-ceptor patterns in water networks (Arai et al.,2005; Chatake et al., 2005). This will con-tribute to a better understanding of the roleof water molecules at active sites and the ef-fects on conformation and stability of solva-tion shells. Further advantages of NMC con-cern the monitoring of hydrogen/deuterium(H/D) exchange, permitting insight into sol-vent accessibility, dynamics, and folding pat-terns. Finally, NMC allows one to discriminatebetween metals at active sites due to uniqueneutron scattering cross-sections, i.e., Mn(25)= −3.6 fm, Fe(26) = 9.5 fm, and Zn(30) =5.6 fm.
More widespread applications of NMChave traditionally suffered from the high costof the instrumentation required (either a nu-clear reactor or a spallation neutron source[SNS]; the complexity and cost of neutron de-tectors also exceed by far those of state-of-the-art X-ray CCDs) and the need for large crystals(�1 mm3). However, the availability of SNSs
DiffractionTechniques in
Structural Biology
7.13.12
Supplement 65 Current Protocols in Nucleic Acid Chemistry

Table 7.13.2 Electron Microscopy versus X-Ray Crystallography
Variable Electron microscopy (EM) Crystallography
Sample size Relatively low amounts of materialneeded
Milligram quantities required
Crystals No need for single crystals Crystallization constitutes abottleneck on the way tostructure determination
Molecular size Typically applied to large-sizemacromolecules or assemblies, (>300kDa), but the technique has beensuccessfully applied to a 78-kDa DNAnanostructure (Kato et al., 2009)
No intrinsic size limitation(structures up to MDa sizerange have been determined);large molecules can bedifficult to crystallize
Resolution Typically �10 A; but near-atomicresolution is possible (Zhou, 2008; Liuet al., 2010; Binshtein and Ohi, 2015;Rodriguez et al., 2015); the number ofcryo-EM structures with resolutions of5 A and higher is steadily increasing
Near-atomic resolution canbe achieved even with verylarge molecules, permittingdetailed insights intorecognition and mechanisticaspects
Figure 7.13.13 Neutron versus X-ray macromolecular crystallography. Left: The neutron density for Tyr137 in thestructure of D-xylose isomerase contoured at 1.5σ (green) and 2.0σ (yellow) clearly reveals the orientation of thedeuteron on the O atom of tyrosine. Right: The protonation state of Tyr254 remains unclear from electron density mapsin the X-ray crystal structure of the same enzyme determined to 0.94-A resolution at −170°C. Reprinted from Hansonet al. (2004) with permission from the International Union of Crystallography.
in Europe, Japan, and the U.S. (Fig. 7.13.14)that produce high-intensity beams has sparkeda renewed interest in applications of neutronscattering and promises a renaissance of NMC.The design criteria for the MacromolecularNeutron Diffractometer (MaNDi) on the SNSat Oak Ridge National Laboratory (ORNL;Oak Ridge, Tennessee, U.S.) anticipate
resolution limits of between 1.5 and 2.0 A forcrystals with a lattice constant of up to 150 A(2.5 to 3.0 A for constants of 150 to 300 A).Moreover, the time spent to collect data froma crystal with a volume of 0.125 mm3 and unitcell constants of maximum 100 A is expectedto be 24 hr for a resolution of �2 A (Coateset al., 2010). Biophysical
Analysis ofNucleic Acids
7.13.13
Current Protocols in Nucleic Acid Chemistry Supplement 65

Figure 7.13.14 The Spallation Neutron Source (SNS) at Oak Ridge National Laboratory (ORNL, Oak Ridge, Tennessee,U.S.). The SNS instrument hall will eventually contain 24 instruments on 18 beam lines. The Macromolecular NeutronDiffractometer (MaNDi, BL-11B) and the Single-Crystal Diffractometer (TOPAZ, BL-12) are of particular interest for neutronmacromolecular crystallography research. Source: http://neutrons.ornl.gov/instruments; please visit the original Web siteand click on the individual boxes for details of the instrument layout and capabilities.
Nuclear Magnetic ResonanceSpectroscopy
Certain nuclei, for example 1H, 13C, 15N,and 31P, possess an angular momentum. Theenergy levels associated with nuclei of differ-ent spin angular momentums can be separatedin high magnetic fields. The spin will alignalong the field and absorption of electromag-netic radiation of the appropriate frequency(radio waves) then induce a transition. Whenthe nuclei revert to their equilibrium state, theyemit radiation that can be measured. Most im-portantly, the precise frequency of the emittedradiation is dependent on the environment ofthe individual nuclei. These different frequen-cies are referred to as chemical shifts. NMRspectra are further complicated by scalar cou-pling between neighboring nuclei that is ap-parent from the splitting of individual signals(Fig. 7.13.15; Keeler, 2011).
Protein NMR spectra contain a large num-ber of overlapping peaks, and it is impossibleto interpret a one-dimensional (1D) spectrum.However, it is possible to design 2D NMRexperiments and to plot the results into anxy-diagram, i.e., a so-called 2D homonu-clear COSY (correlation spectroscopy)experiment. In this 2D representation, thediagonal corresponds to the common 1Dspectrum. Off-diagonal peaks arise fromthe interactions between hydrogen atomsthat are relatively closely spaced. Anothercommon type of NMR experiment withproteins concerns the heteronuclear singlequantum correlation (HSQC), i.e., betweenthe nitrogen atom of an NHx group with theattached proton. Therefore, each signal in a15N-HSQC spectrum represents a signal froma single amino acid. In addition to the signalsfrom the HN protons in the backbone, the
DiffractionTechniques in
Structural Biology
7.13.14
Supplement 65 Current Protocols in Nucleic Acid Chemistry

Figure 7.13.15 One-dimensional 1H-NMR spectrum of ethanol. The three groups of protons inthis small molecule, (C)H3, (C)H2, and (O)H, all exhibit different chemical shifts relative to theprotons in reference molecule, tetramethylsilane (TMS). The characteristic splitting of the signalsarising from the methyl (1:2:1) and methylene (1:3:3:1) protons is the result of through-bondcoupling between neighboring nuclei.
Figure 7.13.16 Two-dimensional heteronuclear NMR spectroscopy. 15N-HSQC spectrum of thecircadian clock protein KaiB from the cyanobacterium Synechococcus elongatus recorded on an800-MHz spectrometer. HSQC, heteronuclear single quantum correlation.
HSQC spectrum also contains signals fromthe amino groups of the side chains of Asnand Gln and the aromatic N-H groups in theHis and Trp side chains. However, unlike a2D homonuclear spectrum, a heteronuclear13C- or 15N-HSQC spectrum does not containa diagonal (Fig. 7.13.16; Wuthrich, 1986).
Relaxation processes are very sensitive toboth geometry and motion, but only inter-actions between atoms that are <5 A apartcan typically be detected. Therefore, NMRspectroscopy allows us to map the distancesbetween pairs of atoms by specifying whichpairs are close together in space; NMR spectra
BiophysicalAnalysis ofNucleic Acids
7.13.15
Current Protocols in Nucleic Acid Chemistry Supplement 65

Table 7.13.3 X-Ray Crystallography versus Solution NMR Spectroscopy
Variable X-ray crystallography NMR spectroscopy
Amount and purity ofmaterial (30-kDa protein)
10-50 mg, very pure, stable atroom temperature
10-20 mg, 95% pure, stable atroom temperature; if >10kDa must be labeled with 15Nand/or 13C
Studied sample Crystals with high content ofnon-crystalline solvent(�50% protein)
�1 mM protein in solution(�1% protein)
Physiological relevance Artifacts due to crystalpacking forces
Artifacts due to use ofisolated fragments or domains
Experimental variations ofsample conditions
Very difficult, crystallizationconditions have to bemaintained
Straightforward, can change,e.g., temperature, pH
Size limitations Virtually none (40-MDastructures determined)
�50 kDa at present (40-kDastructures solved)
Meaning of single data point None: one spot hascontributions from the wholeunit cell
Single inter-atomicinteractions interpreted asdistance or angle constraint
Meaning of all data points After FT with proper phases,direct definition of theelectron density within oneunit cell
All observable inter-atomicinteractions interpreted asdistances and torsion angles
Interpretation of experimentaldata
Relatively quantitative Relatively qualitative
Most time consuming Varies: crystallization, phasegeneration, model building
Resonance assignments
Final result One model that minimizes Rfactor; model variations anduncertainties “hidden” in Bvalues
Many models (ensemble)satisfying constraints;variations explicit in multiplemodels
Use of stereo-chemicalconstraints
Necessary (exception:ultra-high resolution dataavailable)
Necessary
Classes of proteins amenableto study
Stable tertiary structure (fold)throughout most of thepolypeptide; non-aggregating
Folded and unfolded regionscan occur; non-aggregating
Observation of dynamicprocesses
Very difficult, but in principleenzyme reactions can befollowed in crystals
Very straightforward
Measure of accuracy Biochemical data, threadingcalculation, ϕ–ψ plots(potential energy)
Biochemical data, threadingcalculation, ϕ–ψ plots(potential energy)
Measure of precision Resolution, R factors, RMSa
deviations from standardbond lengths and angles
Average RMSDb amongstructures in calculated family
Comparable resolution 2 A resolution, R factor<25%
RMSDb <1.0 A for most ofthe polypeptide length
aRMS, root mean square.bRMSD, root-mean-square deviation.
DiffractionTechniques in
Structural Biology
7.13.16
Supplement 65 Current Protocols in Nucleic Acid Chemistry

contain information about the 3D structure ofprotein molecules. In reality, it is far fromtrivial to assign the peaks in a spectrum toa specific H atom in the protein sequence.Kurt Wuthrich worked out a solution to theassignment problem in the 1980s and he wasco-awarded the 2002 Nobel Prize in Chem-istry for the development of NMR spec-troscopy for determining the 3D structure ofbiological macromolecules in solution. Bothsolution NMR and X-ray crystallography pro-vide insight into the 3D structures of macro-molecules. In many ways, the two techniquesare complementary, with the most significantlimitation of NMR and crystallography beingsize (<40 kDa) and the need for single crys-tals, respectively, and a distinct advantage ofNMR being the ability to gain insight into dy-namic processes, e.g., base pair opening kinet-ics in DNA (see UNIT 7.20, Szulik et al., 2014).A more detailed comparison of these two keytechniques in structural biology is provided inTable 7.13.3.
SINGLE CRYSTAL X-RAYCRYSTALLOGRAPHY
OverviewThe following sections are dedicated to ar-
guably the most powerful “weapon” in thestructural biology arsenal: X-ray crystallogra-phy. This technique can provide more detailedmodels than any of the other approaches avail-able to study macromolecules. In principle,there is no limitation as far as size is concerned:the basic principles remain the same inde-pendently of whether one is working out thestructure of an oligonucleotide with a molec-ular weight of a few kDa or that of a virusa thousand times larger. Individual steps ofa structure determination are outlined in Fig-ure 7.13.17. Among them, crystallization andphasing constitute the biggest hurdles. Despitethe fact that impressive advances have beenmade in recent years to increase the chances ofobtaining protein or nucleic acid crystals, crys-tallization has remained a trial-and-error ap-proach that frequently fails when only a singleconstruct is available. It can easily escalate intoa potentially costly and time-consuming battlewhen various constructs and/or homologousproteins from different organisms are screened(McPherson, 1998; Ducruix and Giege, 1999;Doublie, 2007a; Ennifar, 2015). However, theend—be it a detailed three-dimensional modelof an enzyme, receptor, RNA, or protein-DNAcomplex and the biological insights gainedfrom it—generally justifies the means.
Sample PreparationCrystallography requires large, milligram
amounts of pure material, precluding in mostcases isolation of enzymes or receptors forcrystallization from tissues. Instead, proteinsbased on recombinant DNA technology areused for the structural studies. The DNA issubcloned from a cDNA library or, alterna-tively, the gene is synthesized. A battery ofexpression vectors is commercially availableand, while Escherichia coli still represents themost common organism for over-expression,insect cells, yeast, and human cell lines arebecoming ever more popular for producing re-combinant proteins. In addition, cell-free ex-pression should also be considered as an alter-native approach.
Molecules for crystallization need to bereasonably well structured and not floppy.Therefore, it is important to consider possiblyunstructured or flexible regions, i.e., at the N-or C-terminus, in the design of the construct.Constructs amenable to crystallization can of-ten be identified by limited proteolysis (Donget al., 2007; Lei and Egli, 2016). In many cases,only domains can be crystallized, or it is neces-sary to resort to the homologous proteins froma thermophilic organism for successful crys-tallization. Induced-fit binding of a ligand mayrender the protein with the ligand bound morelikely to crystallize than protein alone. It is alsoworthwhile to consider whether there are manycharged residues that are solvent exposed. Thisis because reduction of surface entropy by mu-tation of Lys to Ala or other strategies candramatically increase the chances of obtainingcrystals or of producing higher quality crys-tals (Czepas et al., 2004). Another importantaspect concerns the size of the protein: Is thetarget a small protein (less than �70 aminoacids) or a polypeptide? In that case, crystal-lization of the small protein as a fusion witha larger and well-characterized protein, suchas glutathione-S-transferase (GST) or others,should be tried (Smyth et al., 2003). This oftenimproves solubility and allows for phasing bymolecular replacement of the GST.
Fusion with a variety of tags or proteinsalso facilitates purification via affinity chro-matography (Structural Genomics Consortia,2008). Some popular ones include the (His)6
tag, GST, maltose-binding protein (MBP), andsmall ubiquitin-like modifier (SUMO) protein.Further purification steps may involve gel fil-tration and/or ion-exchange chromatography.Procedures that should be avoided are am-monium sulfate precipitation and lyophiliza-tion, and care should be applied when
BiophysicalAnalysis ofNucleic Acids
7.13.17
Current Protocols in Nucleic Acid Chemistry Supplement 65

Figure 7.13.17 Individual stages of a macromolecular X-ray crystal structure determination.Selected methods are listed on the right. Approaches for refining structures include least-squaresfitting and simulated annealing. Adapted from Ringe and Petsko (1996).
combining various fractions following col-umn chromatography or different batches ofprotein. In general, the purification shouldbe carried out quickly and proteins need tobe handled gently and maintained at reducedtemperature. Turbid samples need to be cen-trifugated and, for filtrations, cartridges withminimal dead volume should be used and oneshould check for adsorption (OD/activity) af-ter filtering. As a rule of thumb, the purityof a protein should be 90% to 95% by SDS-polyacrylamide gel electrophoresis (PAGE)with Coomassie stain. The purified proteincan be further characterized with native PAGE,light scattering (monodispersity does not nec-essarily improve the chances of obtaining crys-tals), isoelectric focusing (to determine the iso-electric point, pI), mass spectrometry, circulardichroism (CD) spectroscopy, and other tech-niques. Proteins of low solubility (<1 mg/mL)
are typically not suitable for crystallization ex-periments, and a search for other constructs ormutation via in vitro directed evolution maybe advisable in such cases.
DNA is produced by solid-phase chemi-cal synthesis using suitably protected phos-phoramidite building blocks (Gait, 1984). Twobasic methods exist for producing RNAs ofsufficient quality suitable for crystallizationand X-ray structure determination. Longerfragments (>50 nucleotides) can be gener-ated by in vitro transcription using the DNA-dependent T7 RNA polymerase (Milligan andUhlenbeck, 1989; Wyatt et al., 1991). Forshorter RNA oligonucleotides, the method ofchoice is chemical synthesis, usually by thesolid-phase phosphoramidite technique. Dueto the presence of the 2′-hydroxyl group in thefuranose sugar, chemical synthesis of RNAis more complicated compared with DNA.
DiffractionTechniques in
Structural Biology
7.13.18
Supplement 65 Current Protocols in Nucleic Acid Chemistry

Figure 7.13.18 Two related methods for growing single crystals of biomacromolecules. Schematic depictions of the(A) hanging and (B) sitting drop vapor diffusion techniques. The volume of the droplets is in the nL (nanodrop settingrobots) to μL range.
Common protection groups for the 2′-OHmoiety are the tert-butyl dimethyl silyl (TB-DMS) group (Scaringe et al., 1990; Wincottet al., 1995), the 2′-acetoxy ethyl orthoester(2′-ACE; Scaringe et al., 1998), and the tri-isopropylsilyloxymethyl (TOM) functionality(Pitsch et al., 2001). The latter approach hasallowed production of RNAs as long as 100residues, a size range that includes many bi-ologically interesting RNA motifs. Once de-protected and cleaved from the solid support,DNA and RNA oligonucleotides are typicallypurified via trityl-on reverse phase HPLC orion-exchange chromatography. However, col-umn chromatography is not suitable for thepurification of longer fragments. Instead, largeRNAs need to be purified by denatured PAGEand desalted following elution from the gel(Wyatt et al., 1991).
CrystallizationThere are a number of crystallization tech-
niques commonly used with proteins or nu-cleic acids: Hanging-drop and sitting-drop va-por diffusion, batch/microbatch under oil, freeinterface diffusion employing either integratedfluidic circuits (i.e., the Topaz crystallization
system) or the Zeppezauer tube, and dial-ysis (Ducruix and Giege, 1992; Carter andSweet, 1997a,b; McPherson, 1998; McRee,1999; Carter, 2003a,b; Rhodes, 2006; Drenth,2007; Doublie, 2007a; Rupp, 2010; Ennifar,2015). The first two techniques are illustratedschematically in Figure 7.13.18. Both are fastand easy to setup and versatile for both screen-ing and optimization. The droplets can beviewed through glass (hanging drop) or eithera plastic lid or a transparent tape (sitting drop)under a microscope. The drop size can vary butthe volume of hanging drops is usually limitedto �5 μL. In both cases, the concentration ofthe particular precipitant in the reservoir ex-ceeds that in the drop. As a result, water willdiffuse from the drop to the reservoir, thus in-creasing the concentration of the precipitantin the drop over time and slowly lowering thesolubility of the protein. Ideally, the protein so-lution will change from the unsaturated region(in terms of a phase diagram) to a labile, super-saturated region, where stable nuclei sponta-neously form and grow. The advantage of thesitting drop method is that it can be automatedand used in combination with crystallizationrobots.
BiophysicalAnalysis ofNucleic Acids
7.13.19
Current Protocols in Nucleic Acid Chemistry Supplement 65

Microbatch crystallizations usingpetroleum oil or silicon oil are also eas-ily setup and can be automated to some degreeas well. By comparison, crystallizations usingdialysis are somewhat more time consumingto setup, but the method allows for a greatercontrol of the individual parameters that affectcrystallization. Moreover, dialysis is ideal forreplacing the crystallization buffer by a cryosolution, required for flash freezing crystals.Free interface diffusion in a Zeppezauer tubeworks better in microgravity, but crystalliza-tion experiments in space are expensive andnot likely to be available in the foreseeablefuture.
Crystallization remains a trial and error—mostly error—approach and there is no gen-eral recipe for overcoming the nucleation bar-rier, i.e., a universal nucleant. There are manyways to achieve supersaturation in principle,including adding protein directly to precipi-tant, altering the temperature, increasing thesalt concentration (salt out), decreasing the saltconcentration (salt in), adding a ligand thatchanges the solubility of the protein, alteringthe dielectric constant of the medium, evapo-rating water, adding polymer (i.e., polyethy-lene glycols [PEGs]) to produce volumeexclusion, adding a cross-linking agent, con-centrating the macromolecule, and removinga solubilizing agent. Success in crystalliza-tion is to a large degree dependent on crystalpacking interactions and these remain unpre-dictable. Lattice contacts are noncovalent andentail various classes of hydrogen bonds (di-rect bonds between polar, uncharged groupssuch as OH, NH2, =O; direct bonds be-tween one or more charged groups, so-calledsalt bridges; two polar or charged groupsbridged by a water molecule; bridging of twomoieties by a chain of two or more watermolecules; and van der Waals interactions. Op-timal packing requires electrostatic and shapecomplementarity.
It is now common to resort to so-called sparse matrix crystallization screensto increase the chances of obtaining crys-tals. Such screening kits are commer-cially available (see for example, http://www.hamptonresearch.com) and they come in avariety of flavors, e.g., suitable for proteins,protein-protein complexes, membrane pro-teins, DNA oligonucleotides, RNA. The initialset of protein crystallization solutions com-piled by Jancarik and Kim in the early 1990sis shown in Figure 7.13.19 (Jancarik and Kim,1991). Individual solutions typically feature
a salt, a particular precipitant, and a buffer.The pH of the buffers ranges from �4 to 9and ammonium sulfate figures prominently inthe list of salts or precipitants. Similarly, var-ious classes of PEGs are favorites among theprecipitants. The recipes for many of thesescreens are largely based on empirical datathat demonstrate, for example, that many pro-teins can be crystallized from ammonium sul-fate solutions. However, not all salts are thesame and in the Hofmeister series one candistinguish between stabilizing kosmotropes(weakly hydrated cations such as NH4
+ or Cs+
and strongly hydrated anions such as citrate orsulfate) and destabilizing chaotropes (stronglyhydrated cations such as Mg2+ or Al3+ andweakly hydrated anions such as nitrate or per-chlorate; Collins, 2004). The use of PEGs inprotein crystallization is based on the tendencyof the random coil, water-soluble polymersto reduce protein solubility by volume exclu-sion (PEG and protein cannot occupy the samespace at the same time). This mutual exclusionis mainly dependent on size and shape as wellas on concentration.
Setting up hundreds or perhaps thousandsof crystallization trials is a tedious task andthe screening process is nowadays facilitatedby crystallization robotics. An exampleof a crystallization robot is depicted inFigure 7.13.20. Robotics can be used to gen-erate crystallization screens (so-called liquidhandlers), to setup sitting-drop crystallizationplates (the 96-well format is quite common),and to barcode, store, retrieve, and image atregular intervals of one’s choice the plates.Epifluorescence microscopy can be used todifferentiate between crystals of salt andprotein; phosphate buffer should be avoidedas phosphate tends to crystallize readily andsuch crystals are then often mistaken forcrystals of a macromolecule. Initial leads canbe further optimized by manual crystallizationsetups and the size optimized by seeding.Micro-seeding uses seed beads from crushedcrystals in a serial dilution to seed fresh dropsin the hope that the introduction of a few seednuclei into a metastable solution will producelarger crystals. Streak seeding is similar tomicro-seeding but quicker in that a whisker isused to pull off seeds from a crystal in orderto then streak it through a fresh drop. Finally,macro-seeding consists of partially dissolvingthe surface layers of a crystal and then placingit into a fresh metastable solution for growth(http://xray.bmc.uu.se/�terese/crystallization/tutorials/tutorial4.html).
DiffractionTechniques in
Structural Biology
7.13.20
Supplement 65 Current Protocols in Nucleic Acid Chemistry

Figure 7.13.19 Example of a sparse matrix crystallization screen. Composition of the 50 solutions in theso-called Crystal Screen that is commercially available from Hampton Research. Reprinted with permissionfrom Hampton Research (http://hamptonresearch.com/product_detail.aspx?cid=1&sid=17&pid=1).
There are some differences between thecrystallizations of proteins and nucleic acids,owing to the polyanionic nature of the latter.Thus, many DNA or RNA oligonucleotidescan be crystallized in the presence of ei-ther magnesium chloride or polyamines (e.g.,
spermine tetrahydrochloride; Berger et al.,1996). Other alkaline earth metal ions suchas Ca2+, Sr2+, and Ba2+ are also quitewidespread, as are Na+, K+, and Rb+.Sodium cacodylate represents a very commonbuffer and 2-methyl-2,4-pentanediol (MPD),
BiophysicalAnalysis ofNucleic Acids
7.13.21
Current Protocols in Nucleic Acid Chemistry Supplement 65

Figure 7.13.20 Automation of crystallization experiments. Crystallization robotics at VanderbiltUniversity include: (A) A Xantus lipidic cubic phase robot. (B) A Formulatrix Rock Imager for stor-age and automatic imaging of crystallization plates. (C) A TPP LabTech Mosquito nanodrop setterrobot. (D) In the laboratory of the author, the MaX WorkCell by Thermo Fisher Scientific. TheWorkCell integrates nanodrop setting (“Mosquito,” on the left), liquid handling, and screen prepa-ration (“Starlet,” Hamilton Company; on the right), and sealing of crystallization plates (bottomright).
ammonium sulfate, and PEGs are probably themost commonly used precipitants (Baeyenset al., 1994). When all attempts to crystallizea protein fail, it is a good idea to resort to adifferent construct or to try a homolog from adifferent organism. Similarly, the key to suc-cess in nucleic acid crystallization is to trymultiple sequences and to include overhangingbases at the 5′- or 3′-termini. Another optionin RNA crystallography is helix engineering,for example by incorporating a tetraloop at theend of a stem (double helical) region and atetraloop receptor elsewhere (Ferre-D’Amareet al., 1998a). The pairing of such motifs oftenmediates stabilizing intermolecular contacts.A related approach to potentially generate astable lattice is the use of mutagenized RNAswith a binding site for a particular protein. Anexample of this is constituted by a hepatitisdelta virus ribozyme that contains the high-affinity binding site for the basic RNA bind-ing domain of the U1A spliceosomal protein(Ferre-D’Amare et al., 1998b).
A note of caution at the end of this sec-tion: although it is exciting to see crystals un-der a microscope, it turns out that many crys-tals do not diffract X-rays at all, or only veryweakly. Before letting the excitement build up
too much, it is therefore a good idea to test thecrystals for diffraction on an in-house X-raysetup.
Data Collection and ProcessingX-rays are high-energy photons and the
wavelengths of those used in macromolecu-lar crystallography experiments lie in the 0.5to 1.8 A range (Blundell and Johnson, 1976;Woolfson, 1997; Rhodes, 2006). X-rays can,for example, be generated in sealed high-voltage tubes where an anode (for exampleCu, Mb, Fe) is bombarded with electrons froma heated cathode filament. An electron is hit-ting the anode material, and, as it passes withinproximity of an atom, the electron is attractedto the nucleus by the Coulombic force. Thisalters the trajectory of the electron, and thecloser the electron is to the nucleus, the greaterthe change in its trajectory. To conserve mo-mentum, a photon is created, whereby the pho-ton’s energy depends on the degree to whichthe electron’s trajectory was changed. The en-ergy released in the form of photons is referredto as Brems-Strahlung (“braking radiation” or“white radiation”). Every now and then, anelectron that hits the anode target is of suf-ficiently high energy to displace an electron
DiffractionTechniques in
Structural Biology
7.13.22
Supplement 65 Current Protocols in Nucleic Acid Chemistry

Figure 7.13.21 X-ray generators and detectors. Two 4-circle, kappa-geometry X-ray diffractionsetups currently used by researchers at Vanderbilt University. (A) The sealed tube Oxford XcaliburPX2 Ultra (Oxford Diffraction). (B) The rotating anode Bruker Microstar (Bruker AXS). Tube housing(Xcalibur), beam collimator, beam stop, CCD detector, crystal cooler, goniostat, goniometer head,and telescope are clearly visible.
from an inner shell (i.e., the K shell) and anelectron from a higher shell (for example L, M)then takes its place, with the energy differencebetween them being emitted as monochro-matic X-ray radiation. Normally X-rays arepolychromatic, but monochromatic radiationcan be obtained by way of a monochromator,for example a graphite crystal.
However, most of the energy is generated asheat and not “light,” and X-rays from a sealed-tube setup (Fig. 7.13.21A) are typically not ofhigh enough intensity for data collection with
weakly diffracting macromolecular crystals.By comparison, so-called rotating anode units(Fig. 7.13.21B) feature an effective increasein the area of the anode target bombarded byaccelerated electrons. However, the advantagein terms of higher intensity X-rays comes ata cost: rotating anode generators require moremaintenance than sealed-tube setups as partsneed to be replaced (cathode filament), cleaned(rotating anode), or rebuilt (ferrofluidic seal).
Today, most diffraction data collectionsare conducted at X-ray synchrotrons, where
BiophysicalAnalysis ofNucleic Acids
7.13.23
Current Protocols in Nucleic Acid Chemistry Supplement 65

Figure 7.13.22 X-ray Synchrotron. Aerial view of the Advanced Photon Source (APS) at ArgonneNational Laboratory, a so-called 3rd generation X-ray synchrotron.
Table 7.13.4 Impact of X-Ray Synchrotron Radiationa
Dramatic improvements in resolution (<1 A in some cases)
High-throughput X-ray crystallography (structural genomics)
Structural analysis of multi-component macromolecular machines
Micro- and 2D-crystallography (small crystals and membranes)
New phasing strategies (MAD)
Ultrafast time-resolved crystallography (ns resolution)
X-ray absorption spectroscopy (XAS, EXAFS)
Non-crystalline diffraction and small angle scattering
X-ray microscopy of whole hydrated single cells
Material sciences
aAbbreviations: MAD, multi-wavelength anomalous dispersion; ns, nanosecond; EXAFS, extended X-ray absorptionfine structure spectroscopy.
electron or positron beams are circling closeto the speed of light in a storage ring(Fig. 7.13.22). X-rays are emitted in a tan-gential fashion when the beam is deflectedby extremely strong electromagnets, so-calledwigglers or undulators (Helliwell, 1992). Un-like the above sealed-tube or rotating anodegenerators that produce X-rays of a particu-lar wavelength (i.e., CuKα = 1.5418 A), thewavelength of the X-ray beam at synchrotronsis tunable. The availability of synchrotrons hashad a major impact on structural biology andhas impacted many other areas of research in adramatic fashion (Table 7.13.4; Hendrickson,
2000). The higher intensity of X-rays at syn-chrotrons leads to significant improvements inthe resolution of diffraction data (>0.5 A andmore), but also causes radiation damage ofcrystals. Damage inflicted over the long runon a rotating anode source can occur in min-utes on an unattenuated undulator beamline.Primary radiation damage is due to the largeabsorption cross-section of heavier atoms suchas sulfur or selenium and secondary damage iscaused by free radicals and photoelectrons.
To preserve crystals in the beam, they needto be flash-frozen and maintained near liquidnitrogen temperature in a cold stream during
DiffractionTechniques in
Structural Biology
7.13.24
Supplement 65 Current Protocols in Nucleic Acid Chemistry

Figure 7.13.23 Inside a Synchrotron experimental station. The Marresearch charge-coupled de-vice detector (MARCCD 225; foreground, http://www.rayonix.com) mounted on the MAR desktopbeamline (DTB) at the insertion device beamline (5-ID-D hutch) of the DuPont-Northwestern-Dowcollaborative access team (DND-CAT), located at sector 5 of the Advanced Photon Source (APS).The view is into the beam that is transported along the tube visible in the center of the upper half ofthe photograph. The instrumentation colored light blue in the background is not part of the macro-molecular crystallography setup. Work conducted at the DND-CAT now focuses more on surfaceand interface science, nano-materials, catalysis, and environmental science. The macromolecularcrystallography efforts have moved to the new Life Sciences (LS-CAT) at sector 21 of the APSthat offers four ID lines and is jointly run by Michigan institutions, Northwestern University, theUniversity of Illinois at Urbana-Champaign, the University of Wisconsin, and Vanderbilt University.Further consortia that operate ID and/or Bending Magnet (BM) beamlines for macromolecularcrystallography at the APS include BioCARS-CAT (sector 14), IMCA-CAT (sector 17), SBC-CAT(sector 19), SER-CAT (sector 22), GM/CA-CAT (sector 23), NE-CAT (sector 24), and LRL-CAT(sector 31).
data collection (Fig. 7.13.23; Harp et al., 1998;Garman and Owen, 2006). Crystals mountedin capillaries (possible for neutron data col-lection; see http://www.mitegen.com/ for rapidroom temperature mounting) will not last verylong in the beam. For flash-freezing, crystalsare scooped up from a droplet with a nylonloop and then swiped through a cryoprotectantbefore being plunged into liquid nitrogen. Thechoice of cryoprotectant is important, as ice in-side the loop formed during freezing will leadto diffuse scattering and powder pattern ringsin diffraction images. Popular protectants areglycerol, sucrose, ethylene glycol, propyleneglycol, low-molecular weight PEGs, MPD,and 2,3-butanediol. Very high concentrationsof salts such as sodium malonate have alsobeen reported to be suitable for cryoprotection.Crystals are then shipped to the synchrotronsource in the frozen state inside so-called dry-shippers. Most macromolecular crystallogra-phy synchrotron beamlines are now equippedwith automatic sample changers and most
feature remote access, allowing users to col-lect data without leaving the office or thelaboratory.
Prior to the actual data collection, a singleframe or multiple test frames (Fig. 7.13.24)are recorded and indexed and the orientationmatrix determined and refined. Once Bravaislattice type and Laue group are assigned, oneneeds to decide on the best data acquisitionprotocol. Important parameters are the angleof rotation (around the phi axis in most cases),exposure time, and the crystal-to-detector dis-tance. In terms of the correct rotation angle,fine phi slicing guarantees a reduced back-ground whereas coarse phi slicing is more suit-able for rapid data collection. In cases wherecrystals diffract to very high resolution, it isnecessary to collect separate low-, medium-,and high-resolution data sets, whereby properacquisition of low-resolution reflections mayrequire an attenuated beam. In general, datacollection is now a matter of minutes, andas long as the crystal survives, it is better to
BiophysicalAnalysis ofNucleic Acids
7.13.25
Current Protocols in Nucleic Acid Chemistry Supplement 65

Figure 7.13.24 Diffraction data collection. Close up of a 1° (�Phi) diffraction image obtainedfrom a single crystal of the so-called Dickerson Drew Dodecamer (DDD; B-form DNA of sequenceCGCGAATTCGCG). The dark spots represent individual reflections and the diffraction limit isaround 1 A. Data statistics for this particular crystal of the DDD are listed in Table 7.13.5.
collect too much data than too little. CCD de-tectors are used to record individual diffrac-tion frames (Figs. 7.13.21 to 7.13.24). Thesedetectors offer several advantages over multi-wire proportional counters or image plate areadetectors, i.e., a linear response and high dy-namic range, rapid readout, and high spatialresolution. Unlike standard data collectionsthat use X-rays with a discrete wavelengthin the rotation mode, Laue diffraction experi-ments employ “white” or polychromatic radi-ation with exposures in as little as 50 psec fortime-resolved structural studies. Such experi-ments are complicated by multiple intensities,variations in the absorption coefficient, an un-even detector response at varying wavelengths,and reflection spot overlaps, among others.
While the data collection is ongoing, theexperimenter starts the data reduction. The re-flections (spots) in the individual images orframes are indexed and the crystal and detec-tor parameters are refined before the diffrac-tion peaks are integrated, i.e., their intensitiesextracted. After establishing the relative scalefactors between measurements, these parame-ters are once more refined using the total data
set. Finally, the frames are merged and a statis-tical analysis of reflections based on the spacegroup symmetry is computed. An example ofthe completeness and quality of a diffractiondata set broken down into resolution shellsor bins is shown in Table 7.13.5. The finalproduct of the diffraction experiment is a filewith the amplitudes of individual reflections(the so-called structure factors, Fobs) and theirstandard deviations σ(Fobs). The Rsym repre-sents the spread of equivalent reflections (thesmaller the better) and the resolution limit canbe estimated from the mean I/σ(I) ratio (thehighest resolution shell included should havea mean I/σ(I) � 2) and/or the completeness ofthe data in a higher shell (i.e., >70% in theoutermost shell).
Phasing ApproachesUnfortunately, the measured structure fac-
tor amplitudes alone are insufficient for build-ing a structural model. The Fourier trans-formation of the diffraction pattern that isneeded to generate the crystal structure (in theform of an electron density distribution) re-quires both the amplitudes and the phases of
DiffractionTechniques in
Structural Biology
7.13.26
Supplement 65 Current Protocols in Nucleic Acid Chemistry

Table 7.13.5 Diffraction Data Quality: Breakdown into Resolution Bins
Resolution (A) N (unique) Mean (I/σ (I)) Completeness (%) Rsyma
20.00-3.00 1436 22.4 98.8 0.067
3.00-2.50 997 26.1 99.8 0.059
2.50-2.00 2218 24.5 99.5 0.063
2.00-1.80 1626 18.5 97.4 0.049
1.80-1.60 2578 18.5 99.0 0.049
1.60-1.40 4282 16.0 100.0 0.064
1.40-1.20 7524 13.7 100.0 0.085
1.20-1.10 6060 8.5 99.7 0.154
All data 26,721 15.5 99.5 0.064
aRsym = �hkl�i |I(hkl)i - 〈I(hkl)〉|/�hkl�i〈I(hkl)i〉The Rsym is a measure for the similarity of the intensities of symmetry-equivalent reflections. It should be a small aspossible, typically �5%. Another parameter, Rmerge, is used to characterize the similarity of corresponding reflections indifferent data sets (i.e., low- and high-resolution data sets) or in data sets from different crystals.
structure factors (Blundell and Johnson, 1976;Woolfson, 1997; McRee, 1999; Rhodes, 2006;Drenth, 2007; Doublie, 2007b; Rupp, 2010;Ennifar, 2015). However, the phase informa-tion is lost in the diffraction experiment. Con-trary to data collections that are rapid andmore or less automatic, the determinationof a structure can therefore still be a time-consuming challenge. There are four basictechniques for solving the phase problem withcrystals of macromolecules: multiple isomor-phous replacement (MIR), single- and multi-wavelength anomalous dispersion (SAD andMAD, respectively) and a combination of thetwo (multiple isomorphous replacement withanomalous scattering or MIRAS), molecularreplacement (MR), and direct methods (DM).Molecular replacement requires a good modelstructure and it is the method of choice forcomplexes of the same enzyme with differ-ent ligands (i.e., inhibitors) or multi-domainproteins for which the structure of a domainis available (i.e., fusion proteins). Particularlywith crystals of oligonucleotide duplexes, oneis often tempted to perform rotation and trans-lation searches using A- or B-form models.However, the failure rate is quite high and rel-atively small deviations between the confor-mations of the model and the actual structureare sufficient to derail the search.
Direct methods are model-independent, butwill only work in cases for which diffrac-tion data to very high resolution are available(<1.0 A). In addition, there is a size limit andthe structure of a 100-kDa protein is unlikely tobe phased by DM even with crystals diffractingto atomic resolution. Of the �104,000 struc-
tures currently deposited in the Protein DataBank, <0.7% were determined at resolutionsof 1 A and higher. Unlike with crystal struc-tures of small molecules that are mostly solvedby DM, the approach is not likely to replaceMAD or MIR as the standard phasing tech-niques for new macromolecular structures inthe near future (Terwilliger and Berendzen,1999; Weeks et al., 2003; Sheldrick, 2010).
Both MIR and MAD require derivatizationof a macromolecule, which is the introduc-tion of heavy atoms into the crystal lattice.Heavy atoms can be bound covalently or bycoordination and can be incorporated syntheti-cally (nucleic acids), covalently during proteinexpression (selenium), by co-crystallization,soaking of native crystals, or in a pressurecell (xenon). A key difference between MADand MIR is the requirement with the latterthat native crystal and derivative crystals (two,or even better more than two, derivatives areneeded for MIR) are closely isomorphous. Inthis context, it is noteworthy that highly sim-ilar unit cell constants are not necessarily anindication that the orientations of the proteinor nucleic acid in two crystals are identical.The classic approach for introduction of heavyatoms is soaking, and a resource for heavy-atom derivatization can be found at http://www.sbg.bio.ic.ac.uk/had/heavyatom.html (HeavyAtom Databank). Among the favorites for pro-teins are mercurial compounds (binding to freecysteines or methionine) and platinum com-pounds (binding mainly to methionine, histi-dine, and cysteine; Pt(CN)2 binds to positivelycharged residues; Petsko, 1985; Rould, 1997;Garman and Murray, 2003). The heavier the
BiophysicalAnalysis ofNucleic Acids
7.13.27
Current Protocols in Nucleic Acid Chemistry Supplement 65

Figure 7.13.25 Multiwavelength anomalous dispersion (MAD) experiment. Example of an X-rayfluorescence spectrum from a protein crystal that contains Se-methionine (Se-Met) in place ofMet (Maf protein from Bacillus subtilis; 189 amino acids and 6 Se atoms per protein molecule).The theoretical K absorption edge of selenium lies at 12.6578 keV or 0.9795 A (an energy of12.398 keV corresponds to 1.0 A; http://skuld.bmsc.washington.edu/scatter/). In a typical MADexperiment, diffraction data of high redundancy from the same crystal are collected at three orfour wavelengths (i.e., reference below the edge, low, inflection point, inf., peak, max, and referenceabove the edge, high).
atom the better since the scattering amplitudeis proportional to the number of electrons.
Several classes of heavy atoms can be dif-ferentiated: single metal ions are bound elec-trostatically; endogenous metal ions such aszinc in zinc fingers and iron in heme that can beused directly for phasing or substituted to ob-tain a larger signal (i.e., Sr2+ for Ca2+); com-pounds requiring a chemical reaction; multi-metal complexes for larger molecules (forexample the tantalum bromide cluster; Egli,2015); xenon and krypton; and anions such ashalides or triiodide. For nucleic acids, Rb+,Sr2+, Ba2+ (Tereshko et al., 2001), and Tl+
(Conn et al., 2002) are particularly useful andhelix engineering for generating a coordina-tion site for Co(III) hexamine has been usedfor large RNAs (Keel et al., 2007), as havelanthanides (Holbrook and Kim, 1985; Kimet al., 1985). For soaking, it is important toestablish a suitable stabilizing solution or arti-ficial mother liquor. The crystal is then trans-ferred to the stabilizing solution that containsthe heavy atom at a concentration of typi-cally <1 to 10 mM. Occasionally, cracks orragged edges develop and crystals need to betested for diffraction at various time intervals,whereby it is useful to have a diffraction im-age prior to soaking for comparison. There
are various ways to determine whether theheavy atom is indeed bound. A color changeor cracking may be taken as evidence forbinding. Mass spectrometry or microscopicparticle-induced X-ray emission (MicroPIXE)microprobe can also be used to confirm suc-cessful derivatization. Ultimately, the experi-mental determination of difference Pattersonpeaks (there are various means to retrieve thelocations of heavy atoms) is the best proof fora useful derivative that paves the way to aninterpretable electron density map.
Contrary to MIR, MAD phasing can be ac-complished with a single derivative and thetechnique has gained widespread popularityin the past twenty years and now accounts forthe majority of newly determined structures(Hendrickson, 2000). However, since diffrac-tion data need to be collected at the absorp-tion peak of a particular anomalously scatter-ing atom (Fig. 7.13.25), MAD or the relatedSAD experiments have to be performed at asynchrotron source.
The most common anomalous scatterer forproteins is selenium, which can be incor-porated as Se-methionine in E. coli usingan auxotrophic strain or metabolic inhibition(Hendrickson et al., 1990; Doublie, 1997).High concentrations of isoleucine, lysine, and
DiffractionTechniques in
Structural Biology
7.13.28
Supplement 65 Current Protocols in Nucleic Acid Chemistry

Figure 7.13.26 MAD phasing. Experimental electron density map based on five Se sites obtainedfrom a Se-Met crystal of the Maf protein (2.7 A resolution, no solvent flattening), calculated withthe program SOLVE (Terwilliger and Berendzen, 1999). The map displays clear boundaries andreveals large solvent-filled channels (black regions).
threonine are known to block methionine syn-thesis in E. coli by inhibiting aspartokinases.In addition, phenylalanine and leucine act insynergy with lysine. Thus, growth in a mediumlacking methionine but supplemented with Se-methionine and plenty of the methionine path-way inhibitors allows for efficient incorpora-tion of the Met analog. Se-Met derivatizationdoes not always work and a number of caveatsneed to be considered.
Selenium is toxic and so cells will not growas fast. Se-Met derivatized proteins are oftenless soluble and the altered solubility can af-fect crystallization. Selenium is also easily ox-idized and this may blur the absorption edge orrender phasing more difficult. Moreover, it iscrucial to precisely determine the peak of theanomalous absorption signal with a particularcrystal on the beamline using a fluorescencedetector (Fig. 7.13.25). Very tiny deviationsfrom the maximum may subsequently lead tofailure in locating the anomalous scatterers oradversely affect the quality of the MAD elec-tron density map (for a successful example,see Fig. 7.13.26). Bromine is the most pop-ular anomalous scatterer for derivatization ofcrystals of nucleic acids or protein-nucleic acidcomplexes, and can be covalently incorporated
in the form of Br5U or Br5C. Naturally, manyother heavy atoms are not only useful for MIRbut can also serve as anomalous scatterers. Forexample, most crystals of oligonucleotides aregrown in the presence of alkaline earth metalions and it is advisable to always collect MADor SAD data with crystals that contain Sr2+ orBa2+. This is because the common assumptionthat structures of oligonucleotide fragmentstypically yield to phasing by MR is incorrect.Selenium has also been covalently incorpo-rated into nucleic acids for structure determi-nation via SAD or MAD (Wilds et al., 2002;Pallan and Egli, 2007a,b).
Accurate phases are very important, as theyinfluence the quality of the experimental elec-tron density and without accurate density, it isimpossible to build a model. SAD and MADphasing have the advantage that the deriva-tive does not have to be isomorphous with thenative crystal. Once the model based on, say,the Se-Met protein structure is built and re-fined, it can be used to solve the native crystalstructure via MR if the two are not isomor-phous. However, that is not always necessary,and one may decide to just use the structure ofthe Se-Met protein unless the native data setis of higher resolution. Experimental electron
BiophysicalAnalysis ofNucleic Acids
7.13.29
Current Protocols in Nucleic Acid Chemistry Supplement 65

density maps based on SAD or MAD are oftenof excellent quality, making it possible to auto-matically trace the protein and build an initialmodel.
Thus, it is not uncommon to end up with apreliminary model of a protein within hoursof completing data collection; however, inmost cases the initial electron density needsto be improved. This is achieved by improvingthe phases, since they are the terms with thelargest amount of error in the Fourier trans-formation. Inaccuracies in the phases domi-nate those in the amplitudes with regard tothe quality of the electron density. The gen-eral approach to improving the phase informa-tion is to apply constraints in real space; thisis referred to as density modification. Den-sity modification methods that are commonlyused are solvent flattening (and flipping), non-crystallographic symmetry averaging (multi-ple molecules per asymmetric unit that are notrelated by crystallographic symmetry, e.g., inviruses), histogram matching, phase combina-tion and extension, and the maximum likeli-hood approach (Carter and Sweet, 1997a,b;Murshudov et al., 1999; Carter, 2003a; Adamset al., 2010).
Refinement and AnalysisThe model built into the experimental den-
sity typically represents just a rough approx-imation, and to arrive at a final structure it isnecessary to refine it. Each atom in the modelis represented by coordinates x, y, and z, an oc-cupancy parameter (q � 1), and a temperaturefactor (B-factor). The atomic coordinates arestored in a file of a particular format, i.e., theso-called PDB format. The objective of crys-tallographic refinement is to apply changes tothe atomic model such that the difference be-tween model (represented by calculated struc-ture factors Fcalc) and the observed structurefactors Fobs are minimized. The R-factor is ameasure for the deviations between the calcu-lated and observed amplitudes:
R-factor = �hkl‖F(hkl)obs |− |F(hkl)calc||/�hkl|F(hkl)obs|
where by h, k, and l represent the Miller in-dices, the coordinates of reflections in recipro-cal space.
Refinement is an iterative process that en-tails the following basic steps: manual build-ing and (re)fitting, automatic constrained least-squares optimization taking into account bothX-ray data and geometric constraints of thephysical model, and electron density map cal-
culation from the improved model (so-calledFourier sum and difference electron densitymaps), followed by additional building and soforth. The model will profit from a large ex-cess of reflection data over the number of pa-rameters (x, y, z, q, B) that define the model.A ratio of, say, 10 would be considered ex-cellent, and a ratio of 2 represents a poorlyover-determined structure. To reduce the to-tal number of parameters that need to berefined, stereochemical restraints are applied(i.e., bond length, bond angle, torsion angle,planarity, chirality, van der Waals distances).The restraints are entered as terms in the refine-ment target and are weighted so that the devi-ations from ideal values match those found indatabases of high-resolution structures. Thus,the target function is an energy that consistsof an X-ray (Fobs, Fcalc) and an empirical term(e.g., bonds, angles, van der Waals contacts),and optimization algorithms such as steepestdescent or conjugate gradient are used to findthe nearest minimum in the target function.
To escape local energy minima in the tar-get function and to improve the radius of con-vergence, simulated annealing (molecular dy-namics or MD) is used (Brunger and Adams,2002; Adams et al., 2010). Atoms are givenrandom starting velocities and their motionis modeled according to Newton’s laws ofmotion (bond stretching and angle bending).The temperature of the system is increased(to �2000°C) with periodic cooling (anneal-ing), followed by energy minimization. TheMD equations are modified through additionof crystallographic residual to the empiricalpotential energy. Overall, the random elementand the thermal motion help to overcome localminima in the target function. Another variantof the least-squares optimization is maximumlikelihood (Murshudov et al., 1999). Its basicpremise is that refinement is not just a matterof making Fcalc equal to Fobs, but also needs toconsider the phases. To decide how to move anatom, we need to take into account the overallaccuracy of the model and the best model isconsistent with all observations. Consistencyis measured statistically by the probability thatthese observations would be made given thecurrent model. The probabilities include allsources of error (including the model) and asthe model gets better, errors get smaller andprobabilities become sharper, which in turnincreases the likelihood.
The R-factor serves as one guide for the sta-tus of the refinement. An R-factor of �60% isconsistent with a random relation between theobserved and calculated amplitudes. A good
DiffractionTechniques in
Structural Biology
7.13.30
Supplement 65 Current Protocols in Nucleic Acid Chemistry

Figure 7.13.27 Resolution and quality of the electron density. Comparison of the quality of theFourier (2Fo-Fc) sum electron density around adenosine monophosphate in crystal structuresobtained at various resolutions (1σ threshold). (A) 2.85 A, ATP in the crystal structure of the KaiCprotein from Synechococcus elongatus. (B) 1.80 A, A residue in the crystal structure of a B-formDNA. (C) 1.10 A, atomic resolution, A residue in the crystal structure of an A-form DNA.
starting model will have an R-factor of 40%to 45% and a final model of a macromolecularstructure may exhibit an R-factor of �20%.During the refinement (2Fobs-Fcalc), sum elec-tron density maps should look like the cor-rected model, although they can be biased byincorrect phases/models. On the other hand(Fobs-Fcalc), difference electron density mapswill indicate missing or incorrectly placedatoms. So-called omit maps can be used to re-move phase bias that results from least-squaresrefinement using wrong coordinates. These aredifference electron density maps calculated af-
ter removing a part of the model from the cal-culation of Fcalc amplitudes. Because nearbyatoms have been influenced by the incorrectportions, the “memory” associated with theomitted atoms needs to be removed. This isachieved by annealed omit maps that are cal-culated after removal of specific portions ofthe structure and additional MD. A compos-ite omit map can be generated by placing a3D grid over the entire unit cell and removingone grid box at a time, calculating the Fcalc,and then repeating this for all grid boxes andsumming over all grid points.
BiophysicalAnalysis ofNucleic Acids
7.13.31
Current Protocols in Nucleic Acid Chemistry Supplement 65

Figure 7.13.28 Structure refinement and quality control. Conformations of the � and � backbone torsion angle pairs(Ramachandran plot) for amino acids in the crystal structure of human cytochrome P450 21A2 in complex with proges-terone (PDB ID code 4Y8W; Pallan et al., 2015). Individual angles fall either into the preferred regions (1230 residues[94.5%]) or allowed regions (44 residues [3.4%]), and the rest are outliers (red squares). The plot was generated withRAMPAGE (http://mordred.bioc.cam.ac.uk/�rapper/rampage.php; Lovell et al., 2003).
An independent measure of the quality ofthe fit is provided by the R-free, an R-factorthat is based on a test data set, reflections (typ-ically amounting to 5% of the total diffractiondata) that are set aside and are not includedin the refinement (Brunger, 1992). The R-freewill be higher than the R-factor (i.e., by up to5%) and an R-free of 30% with an R-factor(also called R-work) of 20% may indicateerrors or over-refinement. Obviously, modelbuilding and refinement are easier with high-
resolution data. Figure 7.13.27 depicts sumelectron densities around an aromatic moietyat different resolutions and it is obvious that amap at 3 A offers some challenges to the modelbuilder. Other parameters beyond R-factorsand resolution that need to be considered forjudging quality and correctness of a structureare the root-mean-square deviations (RMSDs)of bond lengths and angles from standard val-ues (should be <0.02 A and 3°, respectively)and the B-factors (portions of a structure with
DiffractionTechniques in
Structural Biology
7.13.32
Supplement 65 Current Protocols in Nucleic Acid Chemistry

atoms displaying B-factors >50 A2 indicateweak electron density). With crystal structuresof proteins, the so-called Ramachandran plot(Fig. 7.13.28) can be used to pinpoint problem-atic areas in a structure based on deviations ofthe backbone torsion angles from commonlyencountered values. In the case of nucleic acidstructures, correlating torsion angles is morecomplicated because DNA and RNA featuresix backbone torsion angles and a glycosidictorsion angle. However, a correlation for indi-vidual nucleosides, for example, of the glyco-sidic torsion angle χ between nucleobase andsugar with the δ torsion angle that reflects thesugar pucker, reveals patterns that are charac-teristic for particular duplex forms and indica-tive of the structural diversity among naturaland artificial pairing systems (Anosova et al.,2016).
It is important to realize that crystallo-graphic models often lack parts of a protein ornucleic acid sequence. The N- and C-terminalportions of a protein are normally more flexi-ble than the core as are the terminal nucleotidesin DNA duplexes or single-stranded regions inRNAs. In the crystal structure of E. coli DNApolymerase I (Klenow fragment), �10% of theamino acids are missing because they couldnot be seen in the electron density map at�2.5 A. This indicates that proteins packedinto a crystal lattice can still retain consid-erable flexibility. Indeed, some enzymes areactive in the crystalline state and enzymatic re-actions have been studied using Laue crystal-lography. Along with protein or nucleic acid,crystals contain a lot of water (in some casescrystals consist of 70% to 80% water), andthe final model consists not just of the coor-dinates of protein atoms but many first andsecond shell water molecules, ions, and othercosolutes.
Crystal packing forces obviously have aneffect on the structure of a macromoleculeand need to be considered in the conforma-tional analysis of a protein. Rather than curs-ing them, lattice forces should be considereda blessing, as they can provide valuable infor-mation on the deformability of a loop region orparticular features of the interface between aprotein and its interacting partner. Apart fromanisotropic B-factors from data at very highresolution, crystal structures typically providemostly static information. Occasionally, two ormore crystal forms are available, however, al-lowing one to sample multiple conformationsof the same molecule. In such cases, it is pos-sible to determine how packing forces affect
the structure of a protein or nucleic acid and toidentify flexible regions and relative motionsof domains.
Web Sites with Information onCrystallographic Concepts andResources
A list of selected Web sites with tutorials onsymmetry, space groups, diffraction, Fouriertransformation, and other concepts, resources,or free software is provided in Table 7.13.6.
SUMMARY AND OUTLOOKProgress in structural biology over the last
quarter of a century has been dramatic on allfronts, including instrumentation, mechanisticinsights into ever-larger molecules and mul-tiprotein complexes, and the automation ofindividual steps on the way to a structure deter-mination (for those involved in a crystal struc-ture analysis, see Fig. 7.13.16). The increasingcomplexity of the problems being tackled hasled to the recognition that one technique aloneoften cannot provide all the answers and hasmotivated researchers to apply hybrid struc-tural approaches, e.g., combinations of singlecrystal X-ray crystallography and cryo-EM,crystallography and SAXS, or NMR and com-putational simulations (computational biologyhas not been discussed beyond applications incrystallography in this unit).
Looking into the crystal ball, one can seefurther significant developments in the areaof X-ray synchrotron sources in the future,with fourth-generation synchrotrons currentlyunder construction. One benefit of these willbe the increased flux densities that are ex-pected to be 103 to 106 times higher thanthose of current state-of-the-art light sources(McSweeney, 2014). Moreover, microfocusbeamlines are enabling crystal structure de-terminations with ever-smaller crystals. Theparallel emergence of the free-electron laser(FEL) opens a new era of X-ray crystallogra-phy and gives a further boost to structural bi-ology. In an FEL, electrons traveling at nearlythe speed of light make their way through anundulator magnet where they are accelerated,resulting in the release of photons. Electronscontinue to move in phase with the field ofthe light emitted and the fields add togetherin a coherent fashion. The wavelength of theresulting X-ray beam of high brilliance canbe tuned by changes in the magnetic fieldstrength of the undulators or the energy ofthe electron beam. This setup precludes theneed for a large storage ring (Fig. 7.13.22).
BiophysicalAnalysis ofNucleic Acids
7.13.33
Current Protocols in Nucleic Acid Chemistry Supplement 65

Table 7.13.6 Online Crystallography Resources and Tutorials
URL Information
http://crystal.chem.upenn.edu/course/index.html Course on structuredetermination by X-raycrystallography
http://xray.tamu.edu/xscd_course.php Single-crystal diffractioncourse
http://www.bioc.rice.edu/�georgep/xrayviewform.html XRayView, a virtual X-Raycrystallography laboratoryprogram
http://img.chem.ucl.ac.uk/sgp/large/sgp.htm Space group diagrams andtables
http://people.brandeis.edu/�foxman1/teaching/indexpr.html Symmetry and space grouptutorial
http://escher.epfl.ch/escher Escher web sketch
http://www.ysbl.york.ac.uk/�cowtan/fourier/duck1.html Kevin Cowtan’s picture bookof Fourier transforms andinteractive structure factortutorial
http://www-structmed.cimr.cam.ac.uk/course.html Randy Read’s proteincrystallography course
http://www.lks.physik.uni-erlangen.de/diffraction/ Interactive tutorial ondiffraction
http://www.ruppweb.org/Xray/101index.html Bernhard Rupp’scrystallography 101
http://cns-alumni.bu.edu/�slehar/fourier/fourier.html An intuitive explanation ofFourier theory
http://www.iucr.org/education/pamphlets International Union ofCrystallography teachingpamphlets
Instead of exposing a crystal for seconds percollected diffraction frame, an FEL producesbrief pulses of 10-femtosecond (fs) duration(repeated 120 times per second), whereby eachX-ray flash contains as many photons as thebeam at a synchrotron source over about asecond (Spence, 2014). Beyond crystallogra-phy, including time-resolved studies (Moffat,2014), applications could include material sci-ence, imaging, surgery, and others.
Instead of relatively large single crys-tals, FEL crystallography is performed withnanocrystals that often contain just a few dozenunit cells and are delivered into the beam asa gas-focused liquid jet with a diameter of�5 μm (Chapman et al., 2011). But the needto collect thousands of frames still means thatthe amounts of protein required are substan-tial. Moreover, not all proteins will yield suit-able nanocrystals, some will not diffract, andtesting them requires an FEL. The amounts of
data collected are huge and terabite-size datasets are common. However, thanks to the ex-tremely short X-ray pulses, radiation damageis not an issue anymore, as the data are es-sentially acquired before the crystals are de-stroyed. Hence there is no need to flash-freezecrystals, enabling observation of protein struc-tures at ambient temperature and potentiallyallowing the experimenter to change the sam-ple environment relatively rapidly. Of inter-est in this regard is the discovery that crystalssuitable for FEL experiments can be grown in-side cells (Gallat et al., 2014). In the distantfuture and, provided the flux of X-ray pho-tons at FELs can be increased significantlyand the pulses shortened further, the dream ofsingle-molecule X-ray diffraction may cometrue (Hajdu, 2000; Fromme, 2014).
Automation of protein expression and pu-rification, crystallization, data collection andstructure determination, and model building
DiffractionTechniques in
Structural Biology
7.13.34
Supplement 65 Current Protocols in Nucleic Acid Chemistry

will continue, initiated and driven by the needfor high-throughput crystallography as part ofstructural genomics projects and drug discov-ery. A decade and a half of large-scale struc-ture determination of proteins has had a majorimpact on technological advances that haveclearly benefited traditional structural biologyprojects. However, the expectation that onemay have had regarding potential outcomes ofthe PSI, namely that function could be gleanedfrom structure alone, has not been fulfilledin most cases (Chandonia and Brenner, 2006;Terwilliger et al., 2009; for all PSI publica-tions see http://olenka.med.virginia.edu/psi/).A more likely scenario is that structural in-formation deposited in publicly accessibledatabases and improved data sharing in com-bination with biochemical, mutational, and ge-netic studies (that are perhaps initiated by thestructural data) will allow the classification ofproteins of unknown function at an increasedpace.
The achievements made in terms of thestructural characterization of soluble proteins,RNA, molecular machines, multisubunit com-plexes, and others cannot detract from the factthat there are areas where progress has beenslower and significant challenges remain. Anexample that comes to mind is the membraneprotein field. Many structures have been deter-mined, including those for photo systems andion channels as well as an increasing num-ber of G-protein-coupled receptors (GPCRs,e.g., Kang et al., 2015), starting with the crys-tal structure of β-adrenergic receptor in 2007(Rasmussen et al., 2007). However, expres-sion of stable constructs of membrane proteinsin amounts suitable for structural characteri-zation, solubilization, and crystallization stillconstitute formidable obstacles on the way toa more routine generation of structural data.Capturing dynamic systems involving forma-tion of relatively labile protein-protein com-plexes represents another frontier of struc-tural biology (Radaev and Sun, 2002; Dafforn,2007; Schneidman-Duhovny et al., 2012). Onesuch system studied in the laboratory of theauthor is the minimal circadian clock from thecyanobacterium Synechococcus elongatus thatcan be reconstituted in vitro from three pro-teins in the presence of ATP. The KaiA, KaiB,and KaiC proteins interact to form complexesof different compositions throughout the 24-hour cycle, whereby the concentrations of thefree proteins and the respective complexes os-cillate (Johnson et al., 2008; Egli and John-son, 2015; Pattanayek and Egli, 2015). Clearly,only by using hybrid structural approaches
such as those outlined above can one expect tomake headway with regard to a structural dis-section of dynamic protein-protein complexesand a better understanding of mechanistic as-pects.
AcknowledgmentsThe author would like to thank the U.S.
National Institutes of Health (R01 GM103937and P01 CA160032), the Defense AdvancedResearch Project Agency (DARPA) and Van-derbilt University for financial support.
Literature CitedAbola, E., Kuhn, P., Earnest, T., and Stevens,
R.C. 2000. Automation of X-ray crystal-lography. Nat. Struct. Biol. 7:973-977. doi:10.1038/80754.
Adams, P.D., Afonine, P.V., Bunkoczi, G., Chen,V.B., Davis, I.W., Echols, N., Headd, J.J.,Hung, L.-W., Kapral, G.J., Grosse-Kunstleve,R.W., McCoy, A.J., Moriarty, N.W., Oeffner,R., Read, R.J., Richardson, D.C., Richard-son, J.S., Terwilliger, T.C., and Zwart, P.H.2010. PHENIX: A comprehensive Python-based system for macromolecular structuresolution. Acta Cryst. D 66:213-221. doi:10.1107/S0907444909052925.
Afonine, P.V., Mustyakimov, M., Grosse-Kunstleve, R.W., Moriarty, N.W., Langan,P., and Adams, P.D. 2010. Joint X-rayand neutron refinement with phenix.refine.Acta Cryst. D 66:1153-1163. doi: 10.1107/S0907444910026582.
Anosova, I., Kowal, E.A., Dunn, M.R., Chaput,J.C, Van Horn, W.D., and Egli, M. 2016. Thestructural diversity of artificial genetic poly-mers. Nucleic Acids Res. 44:1007-1021. doi:10.1093/nar/gkv1472.
Arai, S., Chatake, T., Ohhara, T., Kurihara, K.,Tanaka, I., Suzuki, N., Fujimoto, Z., Mizuno,H., and Niimura, N. 2005. Complicated waterorientations in the minor groove of the B-DNAdecamer d(CCATTAATGG)2 observed by neu-tron diffraction measurements. Nucleic AcidsRes. 33:3017-3024. doi: 10.1093/nar/gki616.
Baeyens, K.J., Jancarik, J., and Holbrook, S.R.1994. Use of low-molecular-weight polyethy-lene glycol in the crystallization of RNAoligomers. Acta Cryst. D 50:764-767. doi:10.1107/S0907444994003458.
Baumeister, W. and Steven, A.C. 2000.Macromolecular electron microscopy inthe era of structural genomics. TrendsBiochem. Sci. 25:624-631. doi: 10.1016/S0968-0004(00)01720-5.
Berger, I., Kang, C.H., Sinha, N., Wolters, M.,and Rich, A. 1996. A highly efficient 24-condition matrix for the crystallization of nu-cleic acid fragments. Acta Cryst. D 52:465-468.doi: 10.1107/S0907444995013564.
Berman, H.M., Olson, W.K., Beveridge, D.L.,Westbrook, J., Gelbin, A., Demeny, T., Hsieh,
BiophysicalAnalysis ofNucleic Acids
7.13.35
Current Protocols in Nucleic Acid Chemistry Supplement 65

S.-H., Srinivasan, A.R., and Schneider, B. 1992.The nucleic acid database: A comprehensive re-lational database of three-dimensional structuresof nucleic acids. Biophys. J. 63:751-759. doi:10.1016/S0006-3495(92)81649-1.
Berman, H.M., Westbrook, J., Feng, Z., Gilliland,G., Bhat, T.N., Weissig, H., Shindyalov, I.N.,and Bourne, P.E. 2000. The Protein DataBank. Nucleic Acids Res. 28:235-242. doi:10.1093/nar/28.1.235.
Binshtein, E. and Ohi, M.D. 2015. Cryo-electronmicroscopy and the amazing race to atomicresolution. Biochemistry 54:3133-3141. doi:10.1021/acs.biochem.5b00114.
Blakeley, M.P., Langan, P., Niimura, N., andPodjarny, A. 2008. Neutron crystallogra-phy: Opportunities, challenges and limitations.Curr. Opin. Struct. Biol. 18:593-600. doi:10.1016/j.sbi.2008.06.009.
Blundell, T.L. and Johnson, L.N. 1976. ProteinCrystallography. Academic Press, London.
Bragg, W.L. 1913. The diffraction of short electro-magnetic waves by a crystal. Proc. CambridgePhilos. Soc. 17:43-57.
Brunger, A.T. 1992. The free R value: A novelstatistical quantity for assessing the accuracyof crystal structures. Nature 355:472-474. doi:10.1038/355472a0.
Brunger, A.T. and Adams, P.D. 2002. Molecu-lar dynamics applied to X-ray structure re-finement. Acc. Chem. Res. 35:404-412. doi:10.1021/ar010034r.
Burke, J.E. and Butcher, S.E. 2012. Nucleicacid structure characterization by small an-gle X-ray scattering (SAXS). Curr. Pro-toc. Nucleic Acid Chem. 7.18.1-7.18.18. doi:10.1002/0471142700.nc0718s51.
Carlon, A., Ravera, E., Hennig, J., Parigi, G., andSattler, M. 2016. Improved accuracy from jointX-ray and NMR refinement of a protein-RNAcomplex structure. J. Am. Chem. Soc. 138:1601-1610. doi: 10.1021/jacs.5b11598.
Carter, C.W. Jr. and Sweet, R.M. (eds.) 1997a.Methods in Enzymology, MacromolecularCrystallography, Part A. Vol. 276. AcademicPress, San Diego.
Carter, C.W. Jr. and Sweet, R.M. (eds.)1997b. Methods in Enzymology, Macromolecu-lar Crystallography, Part B. Vol. 277. AcademicPress, San Diego.
Carter, C.W. Jr. and Sweet, R.M. (eds.)2003a. Methods in Enzymology, Macromolecu-lar Crystallography, Part C. Vol. 368. AcademicPress, San Diego.
Carter, C.W. Jr. and Sweet, R.M. (eds.)2003b. Methods in Enzymology, Macromolecu-lar Crystallography, Part D. Vol. 374. AcademicPress, San Diego.
Casadei, C.M., Gumiero, A., Metcalfe, C.L., Mur-phy, E.J., Basran, J., Concilio, M.G., Teix-eira, S.C., Schrader, T.E., Fielding, A.J., Os-termann, A., Blakeley, M.P., Raven, E.L., andMoody, P.C. 2014. Heme enzymes. Neutron
cryo-crystallography captures the protonationstate of ferryl heme in peroxidase. Science345:193-197. doi: 10.1126/science.1254398.
CCP4 (Collaborative Computational Project, Num-ber 4). 1994. The CCP4 suite: Programs for pro-tein crystallography. Acta Cryst. D 50:760-763.doi: 10.1107/S0907444994003112.
Chandonia, J.M. and Brenner, S.E. 2006. Theimpact of structural genomics: Expectationsand outcomes. Science 311:347-351. doi:10.1126/science.1121018.
Chandrasekaran, R. and Stubbs, G. 2012. Crystal-lography of biological macromolecules. In In-ternational Tables for Crystallography, Vol. F,2nd edition (E. Arnold, D.M. Himmel, and M.G.Rossmann, eds.) Part 19, Chapter 5, pp. 583-592. Wiley (commissioned by the InternationalUnion of Crystallography), Hoboken, N.J.
Chapman, H.N., Fromme, P., Barty, A., White,T.A., Kirian, R.A., Aquila, A., Hunter, M.S.,Schulz, J., DePonte, D.P., Weierstall, U., Doak,R.B., Maia, F.R.N.C., Martin, A.V., Schlicht-ing, I., Lomb, L., Coppola, N., Shoeman, R.L.,Epp, S.W., Hartmann, R., Rolles, D., Rudenko,A., Foucar, L., Kimmel, N., Weidenspointner,G., Holl, P., Liang, M., Barthelmess, M., Cale-man, C., Boutet, S., Bogan, M.J., Krzywinski,J., Bostedt, C., Bajt, S., Gumprecht, L., Rudek,B., Erk, B., Schmidt, C., Homke, A., Reich, C.,Pietschner, D., Struder, L., Hauser, G., Gorke,H., Ullrich, J., Herrmann, S., Schaller, G.,Schopper, F., Soltau, H., Kuhnel, K.U., Messer-schmidt, M., Bozek, J.D., Hau-Riege, S.P.,Frank, M., Hampton, C.Y., Sierra, R.G., Star-odub, D., Williams, G.J., Hajdu, J., Timneanu,N., Seibert, M.M., Andreasson, J., Rocker, A.,Jonsson, O., Svenda, M., Stern, S., Nass, K.,Andritschke, R., Schroter, C.D., Krasniqi, F.,Bott, M., Schmidt, K.E., Wang, X., Grotjohann,I., Holton, J.M., Barends, T.R.M., Neutze, R.,Marchesini, S., Fromme, R., Schorb, S., Rupp,D., Adolph, M., Gorkhover, T., Andersson, I.,Hirsemann, H., Potdevin, G., Graafsma, H.,Nilsson, B., and Spence, J.C.H. 2011. Femtosec-ond X-ray protein nanocrystallography. Nature470:73-77. doi: 10.1038/nature09750.
Chatake, T., Tanaka, I., Umino, H., Arai, S., and Ni-imura, N. 2005. The hydration structure of a Z-DNA hexameric duplex determined by a neutrondiffraction technique. Acta Cryst. D 61:1088-1098. doi: 10.1107/S0907444905015581.
Chiu, W., Burnett, R.M., and Garcea, R.L. (eds.)1997. Structural Biology of Viruses. OxfordUniversity Press, Oxford.
Coates, L., Stoica, A.D., Hoffmann, C., Richards,J., and Cooper, R. 2010. The macromolecularneutron diffractometer (MaNDi) at the Spalla-tion Neutron Source, Oak Ridge: Enhanced op-tics, high-resolution neutron detectors and sim-ulated diffraction. J. Appl. Cryst. 43:570-577.doi: 10.1107/S0021889810008587.
Collins, K.D. 2004. Ions from the Hofmeister se-ries and osmolytes: Effects on proteins in solu-tion and in the crystallization process. Methods34:300-311. doi: 10.1016/j.ymeth.2004.03.021.
DiffractionTechniques in
Structural Biology
7.13.36
Supplement 65 Current Protocols in Nucleic Acid Chemistry

Conn, G.L., Gittis, A.G., Lattman, E.E., Misra,V.K., and Draper, D.E. 2002. A compact RNAtertiary structure contains a buried backbone-K+ complex. J. Mol. Biol. 318:963-973. doi:10.1016/S0022-2836(02)00147-X.
Czepas, J., Devedjiev, Y., Krowarsch, D.,Derewenda, U., Otlewski, J., and Derewenda,Z.S. 2004. The impact of Lys→Arg surface mu-tations on the crystallization of the globular do-main of RhoGDI. Acta Cryst. D 60:275-280. doi:10.1107/S0907444903026271.
Dafforn, T.R. 2007. So how do you know you have amacromolecular complex? Acta Cryst. D 63:17-25. doi: 10.1107/S0907444906047044.
Dong, A., Xu, X., Edwards, A.M., Midwest Centerfor Structural Genomics, Chang, C., Chruszcz,M., Cuff, M., Cymborowski, M., Di Leo, R.,Egorova, O., Evdokimova, E., Filippova, E.,Gu, J., Guthrie, J., Ignatchenko, A., Joachimiak,A., Klostermann, N., Kim, Y., Korniyenko, Y.,Minor, W., Que, Q., Savchenko, A., Skarina,T., Tan, K., Yakunin, A., Yee, A., Yim, V.,Zhang, R., Zheng, H., Structural Genomics Con-sortium, Akutsu, M., Arrowsmith, C., Avvaku-mov, G.V., Bochkarev, A., Dahlgren, L.G., Dhe-Paganon, S., Dimov, S., Dombrovski, L., Fin-erty, P. Jr., Flodin, S., Flores, A., Graslund,S., Hammerstrom, M., Herman, M.D., Hong,B.S., Hui, R., Johansson, I., Liu, Y., Nilsson,M., Nedyalkova, L., Nordlund, P., Nyman, T.,Min, J., Ouyang, H., Park, H.W., Qi, C., Rabeh,W., Shen, L., Shen, Y., Sukumard, D., Tem-pel, W., Tong, Y., Tresagues, L., Vedadi, M.,Walker, J.R., Weigelt, J., Welin, M., Wu, H.,Xiao, T., Zeng, H., and Zhu, H. 2007. In situproteolysis for protein crystallization and struc-ture determination. Nat. Methods 4:1019-1021.doi: 10.1038/nmeth1118.
Doublie, S. 1997. Preparation of selenome-thionyl proteins for phase determina-tion. Methods Enzymol. 276:523-530. doi:10.1016/S0076-6879(97)76075-0.
Doublie, S. (ed.). 2007a. Methods in Molecular Bi-ology Book 363, Macromolecular Crystallog-raphy Protocols: Preparation and Crystalliza-tion of Macromolecules, Vol. 1. Humana Press,Totowa, N.J.
Doublie, S. (ed.). 2007b. Methods in Molecular Bi-ology Book 364, Macromolecular Crystallogra-phy Protocols: Structure Determination, Vol. 2.Humana Press, Totowa, N.J.
Doudna, J.A., Grosshans, C., Gooding, A., andKundrot, C.E. 1993. Crystallization of ri-bozymes and small RNA motifs by a sparsematrix approach. Proc. Natl. Acad. Sci. U.S.A.90:7829-7833. doi: 10.1073/pnas.90.16.7829.
Drenth, J. 2007. Principles of Protein X-Ray Crys-tallography, 3rd edition. Springer-Verlag, NewYork.
Ducruix, A. and Giege, R. (eds.) 1999. Crystalliza-tion of Nucleic Acids and Proteins: A PracticalApproach, 2nd edition. Oxford University Press,Oxford.
Egli, M. 2015. Structural and Biophysical Meth-ods to Analyze Clock Function and Mecha-
nism. In Methods in Enzymology, CircadianRhythms and Biological Clocks, Part A. Vol.551. (A. Seghal, ed.) pp. 223-266, Elsevier,New York.
Egli, M. and Johnson, C.H. 2015. Biochemistry thattimes the day. Biochemistry 54:104-109. doi:10.1021/bi5014968.
Emsley, P. and Cowtan, K. 2004. Coot:Model-building tools for molecular graph-ics. Acta Cryst. D 60:2126-2132. doi:10.1107/S0907444904019158.
Ennifar, E. (ed.). 2015. Methods in Molecular Bi-ology Book 1320, Methods and Protocols: Nu-cleic Acid Crystallography. Humana Press, NewYork.
Fenn, T.D., Schnieders, M.J., Mustyakimov, M.,Wu, C., Langan, P., Pande, V.S., and Brunger,A.T. 2011. Reintroducing electrostatics intomacromolecular crystallographic refinement:Application to neutron crystallography andDNA hydration. Structure 19:523-533. doi:10.1016/j.str.2011.01.015.
Ferre-D’Amare, A.R. and Doudna, J.A. 2000.Methods to crystallize RNA. Curr. Pro-toc. Nucleic Acid Chem. 7:6.1-7.6.13. doi:10.1002/0471142700.nc0706s00.
Ferre-D’Amare, A.R., Zhou, K., and Doudna,J.M. 1998a. A general module for RNA crys-tallization. J. Mol. Biol. 279:621-631. doi:10.1006/jmbi.1998.1789.
Ferre-D’Amare, A.R., Zhou, K., and Doudna,J.M. 1998b. Crystal structure of a hepati-tis delta virus ribozyme. Nature 395:567-574.doi:10.1038/26912.
Friedrich, W., Knipping, P., and von Laue, M. 1912.Interferenz-erscheinungen bei rontgenstrahlen[Interference phenomena at X-rays]. Sitzungs-ber. Kgl. Bayer. Akad. Wiss. 303-322.
Fromme, P. 2014. Leading-edge lasers. Nature505:620-621. doi: 10.1038/505620a.
Gabanyi, M.J., Adams, P.D., Arnold, K., Bor-doli, L., Carter, L.G., Flippen-Andersen, J., Gif-ford, L., Haas, J., Kouranov, A., McLaugh-lin, W.A., Micallef, D.I., Minor, W., Shah,R., Schwede, T., Tao, Y.P., Westbrook, J.D.,Zimmerman, M., and Berman, H.M. 2011.The structural biology knowledgebase: A por-tal to protein structures, sequences, func-tions, and methods. J. Struct. Funct. Ge-nomics 12:45-54. doi: 10.1007/s10969-011-9106-2.
Gait, M.J. (ed.) 1984. Oligonucleotide Synthesis: APractical Approach. IRL Press, Oxford.
Gallat, F.-X., Matsugaki, N., Coussens, N.P., Yagi,K.J., Boudes, M., Higashi, T., Tsuji, D., Tatano,Y., Suzuki, M., Mizohata, E., Tono, K., Joti,Y., Kameshima, T., Park, J., Song, C., Hatsui,T., Yabashi, M., Nango, E., Itoh, K., Coulibaly,F., Tobe, S., Ramaswamy, S., Stay, B., Iwata,S., and Chavas, L.M.G. 2014. In vivo crystal-lography at X-ray free-electron lasers: The nextgeneration of structural biology. Phil. Trans. R.Soc. B 369:20130497. doi: 10.1098/rstb.2013.0497.
BiophysicalAnalysis ofNucleic Acids
7.13.37
Current Protocols in Nucleic Acid Chemistry Supplement 65

Garman, E.F. and Murray, J.W. 2003. Heavy-atomderivatization. Acta Cryst. D 59:1903-1913. doi:10.1107/S0907444903012794.
Garman, E.F. and Owen, R.L. 2006. Cryocool-ing and radiation damage in macromolecularcrystallography. Acta Cryst. D 62:32-47. doi:10.1107/S0907444905034207.
Hajdu, J. 2000. Single-molecule X-ray diffrac-tion. Curr. Opin. Struct. Biol. 10:569-573. doi:10.1016/S0959-440X(00)00133-0.
Hanson, B.L., Langan, P., Katz, A., Li, X.,Harp, J.M., Glusker, J.P., Schoenborn, B.P., andBunick, G.J. 2004. A preliminary time-of-flightneutron diffraction study of S. rubiginosus D-xylose isomerase. Acta Cryst. D 60:241-249.doi: 10.1107/S0907444903025873.
Harp, J.M., Timm, D.E., and Bunick, G.J. 1998.Macromolecular crystal annealing: Overcomingincreased mosaicity associated with cryocrys-tallography. Acta Cryst. D 54:622-628. doi:10.1107/S0907444997019008.
Helliwell, J.R. 1992. Macromolecular Crystallog-raphy with Synchrotron Radiation. CambridgeUniversity Press, Cambridge, UK.
Hendrickson, W.A. 2000. Synchrotron crystallog-raphy. Trends Biochem. Sci. 25:637-643. doi:10.1016/S0968-0004(00)01721-7.
Hendrickson, W.A., Horton, J.R., and LeMaster,D.M. 1990. Selenomethionyl proteins producedfor analysis by multiwavelength anomalousdiffraction (MAD): A vehicle for direct deter-mination of three-dimensional structure. EMBOJ. 9:1665-1672.
Holbrook, S.R. and Kim, S.-H. 1985. Crystal-lization and heavy-atom derivatives of polynu-cleotides. Methods Enzymol. 114:167-176. doi:10.1016/0076-6879(85)14017-6.
Hura, G.L., Budworth, H., Dyer, K.N., Rambo,R.P., Hammel, M., McMurray, C.T., andTainer, J.A. 2013. Comprehensive macromolec-ular conformations mapped by quantitativeSAXS analyses. Nat. Methods 10:453-454. doi:10.1038/nmeth.2453.
Jancarik, J. and Kim, S.-H. 1991. Sparse matrixsampling: A screening method for crystalliza-tion of proteins. J. Appl. Cryst. 24:409-411. doi:10.1107/S0021889891004430.
Johnson, C.H., Egli, M., and Stewart, P.L.2008. Structural insights into a circadian os-cillator. Science 322:697-701. doi: 10.1126/science.1150451.
Kang, Y., Zhou, X.E., Gao, X., He, Y., Liu, W.,Ishchenko, A., Barty, A., White, T.A., Yefanov,O., Han, G.W., Xu, Q., de Waal, P.W., Ke, J.,Tan, M.H., Zhang, C., Moeller, A., West, G.M.,Pascal, B.D., Van Eps, N., Caro, L.N., Vishnivet-skiy, S.A., Lee, R.J., Suino-Powell, K.M., Gu,X., Pal, K., Ma, J., Zhi, X., Boutet, S,. Williams,G.J., Messerschmidt, M., Gati, C., Zatsepin,N.A., Wang, D., James, D., Basu, S., Roy-Chowdhury, S., Conrad, C.E., Coe, J., Liu, H.,Lisova, S., Kupitz, C., Grotjohann, I., Fromme,R., Jiang, Y., Tan, M., Yang, H., Li, J., Wang,M., Zheng, Z., Li, D., Howe, N., Zhao, Y., Stand-
fuss, J., Diederichs, K., Dong, Y., Potter, C.S.,Carragher, B., Caffrey, M., Jiang, H., Chapman,H.N., Spence, J.C., Fromme, P., Weierstall, U.,Ernst, O.P., Katritch, V., Gurevich, V.V., Grif-fin, P.R., Hubbell, W.L., Stevens, R.C., Chere-zov, V., Melcher, K., and Xu, H.E. 2015. Crystalstructure of rhodopsin bound to arrestin by fem-tosecond X-ray laser. Nature 523:561-567. doi:10.1038/nature14656.
Kato, T., Goodman, R.P., Erben, C.M., Turber-field, A.J., and Namba, K. 2009. High-resolutionstructural analysis of a DNA nanostructureby cryoEM. Nano Lett. 9:2747-2750. doi:10.1021/nl901265n.
Keel, A.Y., Rambo, R.P., Batey, R.T., and Kieft, J.S.2007. A general strategy to solve the phase prob-lem in RNA crystallography. Structure 15:761-772. doi: 10.1016/j.str.2007.06.003.
Keeler, J. 2011. Understanding NMR Spectroscopy,2nd edition. John Wiley & Sons, Hoboken, N.J.
Kemp, M. 2003. The Mona Lisa of modern science.Nature 421:416-420. doi: 10.1038/nature01403.
Kim, S.-H., Shin, W.-C., and Warrant, R.W.1985. Heavy metal ion-nucleic acid inter-action. Methods Enzymol. 114:156-167. doi:10.1016/0076-6879(85)14016-4.
Konermann, L., Pan, J., and Liu, Y.H. 2011. Hydro-gen exchange mass spectrometry for studyingprotein structure and dynamics. Chem. Soc. Rev.40:1224-1234. doi: 10.1039/C0CS00113A.
Leal, R.M.F., Callow, S., Callow, P., Blake-ley, M.P., Cardin, C.J., Denny, W.A., Teix-eira, S.C.M., Mitchell, E.P., and Forsyth, V.T.2010. Combined neutron and X-ray diffrac-tion studies of DNA in crystals and so-lution. Acta Cryst. D 66:1244-1248. doi:10.1107/S0907444910017713.
Lei, L. and Egli, M. 2016. In situ proteoly-sis for crystallization of membrane-bound cy-tochrome P450 17A1 and 17A2 proteins fromzebrafish. Curr. Protoc. Protein Sci. In press.doi: 10.1002/0471140864.ps2916s84.
Lilley, D.M.J. and Wilson, T.J. 2000. Fluorescenceresonance energy transfer as a structural tool fornucleic acids. Curr. Opin. Chem. Biol. 4:507-517. doi: 10.1016/S1367-5931(00)00124-1.
Liu, H., Jin, L., Koh, S.B., Atanasov, I., Schein, S.,and Zhou, Z.H. 2010. Atomic structure of hu-man adenovirus by cryo-EM reveals interactionsamong protein networks. Science 329:1038-1043. doi: 10.1126/science.1187433.
Lovell, S.C., Davis, I.W., Arendall, W.B. III,de Bakker, P.I.W., Word, J.M., Prisant, M.G.,Richardson, J.S., and Richardson, D.C. 2003.Structure validation by C alpha geometry:18 phi, psi and C beta deviation. Pro-teins Struct. Funct. Genet. 50:437-450. doi:10.1002/prot.10286.
Mchaourab, H.S., Steed, P.R., and Kazmier, K.2011. Toward the fourth dimension of mem-brane protein structure: Insight into dynamicsfrom spin-labeling EPR spectroscopy. Struc-ture 19:1549-1561. doi: 10.1016/j.str.2011.10.009.
DiffractionTechniques in
Structural Biology
7.13.38
Supplement 65 Current Protocols in Nucleic Acid Chemistry

McPherson, A. 1998. Crystallization of BiologicalMacromolecules. Cold Spring Harbor Labora-tory Press, Cold Spring Harbor, N.Y.
McRee, D.E. 1999. Practical Protein Crystallogra-phy, 2nd edition. Academic Press, San Diego.
McSweeney, S. 2014. Sophisticated synchrotrons.Nature 505:620-621. doi: 10.1038/505620a.
Milligan, J.F. and Uhlenbeck, O.C. 1989. Syn-thesis of small RNAs using T7 RNA-polymerase. Methods Enzymol. 180:51-62. doi:10.1016/0076-6879(89)80091-6.
Moffat, K. 2014. Time-resolved crystallographyand protein design: Signalling photorecep-tors and optogenetics. Phil. Trans. R. Soc. B369:20130568. doi: 10.1098/rstb.2013.0568.
Murshudov, G.N., Vagin, A.A., and Dod-son, E.J. 1999. Refinement of macromolec-ular structures by the maximum-likelihoodmethod. Acta Cryst. D 53:240-255. doi:10.1107/S0907444996012255.
Narayanan, B.C., Westbrook, J., Ghosh, S.,Petrov, A.I., Sweeney, B., Zirbel, C.L., Leon-tis, N.B., and Berman, H.M. 2013 The nu-cleic acid database: New features and capabil-ities. Nucleic Acids Res. 42: D114-D122. doi:10.1093/nar/gkt980.
Pallan, P.S. and Egli, M. 2007a. Selenium modi-fication of nucleic acids: preparation of phos-phoroselenoate derivatives for crystallographicphasing of nucleic acid structures. Nat. Proto-cols 2:640-646. doi: 10.1038/nprot.2007.74.
Pallan, P.S. and Egli, M. 2007b. Seleniummodification of nucleic acids: preparation ofoligonucleotides with incorporated 2′-SeMe-uridine for crystallographic phasing of nucleicacid structures. Nat. Protocols 2:647-651. doi:10.1038/nprot.2007.75.
Pallan, P.S., Wang, X., Lei, L., Yoshimoto, F.K.,Auchus, R.J., Waterman, M.R., Guengerich,F.P., and Egli, M. 2015. Human cytochromeP450 21A2, the major steroid 21-hydroxylase.Structure of the enzyme-progesterone substratecomplex and rate-limiting C-H bond cleav-age. J. Biol. Chem. 290:13128-13143. doi:10.1074/jbc.M115.646307.
Pattanayek, R. and Egli, M. 2015. Protein-protein interactions in the cyanobacterial circa-dian clock: Structure of KaiA dimer in com-plex with C-terminal KaiC peptides at 2.8 Aresolution. Biochemistry 54:4575-4578. doi:10.1021/acs.biochem.5b00694.
Pattanayek, R., Williams, D.R., Rossi, G., Weigand,S., Mori, T., Johnson, C.H., Stewart, P.L., andEgli, M. 2011. Combined SAXS/EM basedmodels of the S. elongatus post-translational cir-cadian oscillator and its interactions with theoutput His-kinase SasA. PLoS One 6:e23697.doi: 10.1371/journal.pone.0023697.
Petsko, G.A. 1985. Preparation of isomor-phous heavy-atom derivatives. MethodsEnzymol. 114:147-156. doi: 10.1016/0076-6879(85)14015-2.
Pitsch, S., Weiss, P.A., Jenny, L., Stutz, A.,and Wu, X. 2001. Reliable chemical syn-
thesis of oligoribonucleotides (RNA) with2′-O-[(triisopropylsilyl)oxy]methyl(2′-O-tom)-protected phosphoramidites. Helv. Chim.Acta 84:3773-3795. doi: 10.1002/1522-2675(20011219)84:12<3773::AID-HLCA3773>3.0.CO;2-E.
Potrzebowski, W. and Andre, I. 2015. Auto-mated determination of fibrillar structures bysimultaneous model building and fiber diffrac-tion refinement. Nat. Methods 12:697-684. doi:10.1038/nmeth.3399.
Putnam, C.D., Hammel, M., Hura, G.L., andTainer, J.A. 2007. X-ray solution scattering(SAXS) combined with crystallography andcomputation: Defining accurate macromolec-ular structures, conformations and assembliesin solution. Q. Rev. Biophys. 40:191-285. doi:10.1017/S0033583507004635.
Radaev, S. and Sun, P.D. 2002. Crystal-lization of protein-protein complexes. J.Appl. Cryst. 35:674-676. doi: 10.1107/S0021889802013973.
Rasmussen, S.G., Choi, H.J., Rosenbaum, D.M.,Kobilka, T.S., Thian, F.S., Edwards, P.C.,Burghammer, M., Ratnala, V.R., Sanishvili,R., Fischetti, R.F., Schertler, G.F., Weis, W.I.,and Kobilka, B.K. 2007. Crystal structure ofthe human β2 adrenergic G-protein-coupledreceptor. Nature 450:383-387. doi: 10.1038/nature06325.
Reddy, V.S., Natchiar, S.K., Stewart, P.L., andNemerov, G.R. 2010. Crystal structure of hu-man adenovirus at 3.5 A resolution. Sci-ence 329:1071-1075. doi: 10.1126/science.1187292.
Reddy, V.S. and Nemerow, G.R. 2014. Structuresand organization of adenovirus cement pro-teins provide insights into the role of capsidmaturation in virus entry and infection. Proc.Natl. Acad. Sci. U.S.A. 111:11715-11720. doi:10.1073/pnas.1408462111.
Rhodes, G. 2006. Crystallography Made CrystalClear: A Guide for Users of Macromolecu-lar Models, 3rd edition. Academic Press, SanDiego.
Ringe, D. and Petsko, G.A. 1996. A consumer’sguide to protein crystallography. In Protein En-gineering and Design (P.R. Carey, ed.) pp. 205-229. Academic Press, San Diego.
Rodriguez, J.A., Ivanova, M., Sawaya, M.R., Cas-cio, D., Reyes, F., Shi, D., Johnson, L., Guen-ther, E., Sangwan, S., Hattne, J., Nannenga, B.,Brewster, A.S., Messerschmidt, M., Boutet, S.,Sauter, N.K., Gonen, T., and Eisenberg, D.S.2015. Structure of the amyloid forming seg-ment, GAVVTGVTAVA, from the NAC do-main of Parkinson’s disease protein α-synuclein,residues 68-78, determined by electron diffrac-tion. Nature 525:486-490. doi: 10.1038/na-ture15368.
Romainczyk, O., Elduque, X., and Engels, J.W.2012. Attachment of nitroxide spin labelsto nucleic acids for EPR. Curr. Protoc.Nucleic Acid Chem. 49:7.17.1-7.17.40. doi:10.1002/0471142700.nc0717s49.
BiophysicalAnalysis ofNucleic Acids
7.13.39
Current Protocols in Nucleic Acid Chemistry Supplement 65

Rose, P.W., Prlic, A., Bi, C., Bluhm, W.F.,Christie, C.H., Dutta, S., Green, R.K., Good-sell, D.S., Westbrook, J.D., Woo, J., Young,J., Zardecki, C., Berman, H.M., Bourne, P.E.,and Burley, S.K. 2015. The RCSB Protein DataBank: Views of structural biology for basicand applied research and education. NucleicAcids Res. 43:D345-D356. doi: 10.1093/nar/gku1214.
Rould, M.A. 1997. Screening for heavy-atomderivatives and obtaining accurate isomorphousdifferences. Methods Enzymol. 276:461-472.doi: 10.1016/S0076-6879(97)76072-5.
Rupp, B. 2010. Biomolecular Crystallography, 1stEdition. Garland Science, New York.
Saibil, H.R. 2000. Macromolecular struc-ture determination by cryo-electron mi-croscopy. Acta Cryst. D 56:1215-1222. doi:10.1107/S0907444900010787.
Scaringe, S.A., Francklyn, C., and Usman,N. 1990. Chemical synthesis of biologi-cally active oligoribonucleotides using β-cyanoethyl protected ribonucleoside phospho-ramidites. Nucleic Acids Res. 18:5433-5441.doi: 10.1093/nar/18.18.5433.
Scaringe, S.A., Wincott, F.E., and Caruthers,M.H. 1998. Novel RNA synthesis methodusing 5′-silyl-2′-orthoester protecting groups.J. Am. Chem. Soc. 120:11820-11821. doi:10.1021/ja980730v.
Schneidman-Duhovny, D., Rossi, A., Avila-Sakar,A., Kim, S.J., Velazquez-Muriel, J., Strop, P.,Liang, H., Krukenberg, K.A., Liao, M., Kim,H.M., Sobhanifar, S., Dotsch, V., Rajpal, A.,Pons, J., Agard, D.A., Cheng, Y., and Sali,A. 2012. A method for integrative structuredetermination of protein-protein complexes.Bioinformatics 28:3282-3289. doi: 10.1093/bioinformatics/bts628.
Schuler, B. and Eaton, W.A. 2008. Proteinfolding studied by single-molecule FRET.Curr. Opin. Struct. Biol. 18:16-26. doi:10.1016/j.sbi.2007.12.003.
Scott, W.G., Finch, J.T., Grenfell, R., Fogg, J.,Smith, T., Gait, M.J., and Klug, A. 1995.Rapid crystallization of chemically synthesizedhammerhead RNAs using a double screen-ing procedure. J. Mol. Biol. 250:327-332. doi:10.1006/jmbi.1995.0380.
Sheldrick, G.M. 2010. Experimental phasing withSHELXC/D/E: Combining chain tracing withdensity modification. Acta Cryst. D 66:479-485.doi: 10.1107/S0907444909038360.
Smyth, D.R., Mrozkiewicz, M.K., McGrath, W.J.,Listwan, P., and Kobe, B. 2003. Crys-tal structures of fusion proteins with large-affinity tags. Protein Sci. 12:1313-1322. doi:10.1110/ps.0243403.
Southworth, D.R. and Agard, D.A. 2011. Client-loading conformation of the Hsp90 molecu-lar chaperone revealed in the cryo-EM struc-ture of the human Hsp90:Hop complex. Mol.Cell 42:771-781. doi: 10.1016/j.molcel.2011.04.023.
Spence, J.C.H. 2014. X-ray lasers andcrystallography. IUCrJ 1:151-152. doi:10.1107/S2052252514009567.
Szulik, M.W., Voehler, M., and Stone, M.P.2014. NMR analysis of base-pair open-ing kinetics in DNA. Curr. Protoc. Nu-cleic Acid. Chem. 59:7.20.1-7.20.18. doi:10.1002/0471142700.nc0720s59.
Structural Genomics Consortia. 2008. Protein pro-duction and purification. Nat. Methods 5:135-146. doi: 10.1038/nmeth.f.202.
Tereshko, V., Wilds, C.J., Minasov, G., Prakash,T.P., Maier, M.A., Howard, A., Wawrzak, Z.,Manoharan, M., and Egli, M. 2001. Detec-tion of alkali metal ions in DNA crystals us-ing state-of-the-art X-ray diffraction experi-ments. Nucleic Acids Res. 29:1208-1215. doi:10.1093/nar/29.5.1208.
Terwilliger, T.C. and Berendzen, J. 1999. Au-tomated MAD and MIR structure solution.Acta Cryst. D 55:849-861. doi: 10.1107/S0907444999000839.
Terwilliger, T.C., Stuart, D., and Yokoyama,S. 2009. Lessons from structural genomics.Annu. Rev. Biophys. 38:371-383. doi: 10.1146/annurev.biophys.050708.133740.
Tsuruta, H. and Irving, T.C. 2008. Experimental ap-proaches for solution X-ray scattering and fiberdiffraction. Curr. Opin. Struct. Biol. 18:601-608.doi: 10.1016/j.sbi.2008.08.002.
Weeks, C.M., Adams, P.D., Berendzen, J., Brunger,A.T., Dodson, E.J., Grosse-Kunstleve, R.W.,Schneider, T.R., Sheldrick, G.M., Terwilliger,T.C., Turkenburg, M.G., and Uson, I. 2003.Automatic solution of heavy-atom substruc-tures. Methods Enzymol. 374:37-83. doi:10.1016/S0076-6879(03)74003-8.
Wilds, C.J., Pattanayek, R., Pan, C., Wawrzak, Z.,and Egli, M. 2002. Selenium-assisted nucleicacid crystallography: Use of DNA phosphorose-lenoates for MAD phasing. J. Am. Chem. Soc.124:14910-14916. doi: 10.1021/ja021058b.
Wilkins, S.W. 2013. Celebrating 100 years of X-ray crystallography. Acta Cryst. A 69:1-4. doi:10.1107/S0108767312048490.
Wincott, F., DiRenzo, A., Shaffer, C., Grimm, S.,Tracz, D., Workman, C., Sweedler, D., Gon-zalez, C., Scaringe, S., and Usman, N. 1995.Synthesis, deprotection, analysis and purifica-tion of RNA and ribozymes. Nucleic Acids Res.23:2677-2684. doi: 10.1093/nar/23.14.2677.
Woolfson, M.M. 1997. An Introduction to X-rayCrystallography, 2nd edition. Cambridge Uni-versity Press, Cambridge, UK.
Wuthrich, K. 1986. NMR of Proteins and NucleicAcids, 1st edition. John Wiley & Sons, NewYork.
Wyatt, J.R., Chastain, M., and Puglisi, J.D. 1991.Synthesis and purification of large amounts ofRNA oligonucleotides. BioTechniques 11:764-769.
Zauberman, N., Mutsafi, Y., Ben Halevy, D.,Shimoni, E., Klein, E., Xiao, C., Sun, S.,
DiffractionTechniques in
Structural Biology
7.13.40
Supplement 65 Current Protocols in Nucleic Acid Chemistry

and Minsky, A. 2008. Distinct DNA exit andpackaging portals in the virus Acanthamoebapolyphaga mimivirus. PLoS Biol. 6:e114. doi:10.1371/journal.pbio.0060114.
Zhou, Z.H. 2008. Towards atomic resolution struc-tural determination by single-particle cryo-electron microscopy. Curr. Opin. Struct. Biol.18:218-228. doi: 10.1016/j.sbi.2008.03.004.
BiophysicalAnalysis ofNucleic Acids
7.13.41
Current Protocols in Nucleic Acid Chemistry Supplement 65
Related Documents