Current Patterns of Macroalgal Diversity and Biomass in Northern Hemisphere Rocky Shores Brenda Konar 1 *, Katrin Iken 1 , Juan Jose ´ Cruz-Motta 2 , Lisandro Benedetti-Cecchi 3 , Ann Knowlton 1 , Gerhard Pohle 4 , Patricia Miloslavich 3 , Matt Edwards 5 , Thomas Trott 6 , Edward Kimani 7 , Rafael Riosmena- Rodriguez 8 , Melisa Wong 9 , Stuart Jenkins 10 , Angelica Silva 9 , Isabel Sousa Pinto 11 , Yoshihisa Shirayama 12 1 School of Fisheries and Ocean Sciences, University of Alaska Fairbanks, Fairbanks, Alaska, United States of America, 2 Departamento de Estudios Ambientales, Centro de Biodiversidad Marina, Universidad Simon Bolivar, Caracas, Venezuela, 3 Department of Biology, University of Pisa, CoNISMa, Pisa, Italy, 4 Atlantic Reference Centre, Huntsman Marine Science Centre, St. Andrews, New Brunswick, Canada, 5 Biology Department, College of Sciences, San Diego State University, San Diego, California, United States of America, 6 Department of Biology, Suffolk University, Boston, Massachusetts, United States of America, 7 Kenya Marine and Fisheries Research Institute, Mombasa, Kenya, 8 Programa de Investigacio ´n en Bota ´nica Marina, Departamento de Biologia Marina, Universidad Auto ´noma de Baja California Sur, La Paz, Baja California Sur, Me ´xico, 9 Bedford Institute of Oceanography, Dartmouth, Nova Scotia, Canada, 10 School of Ocean Sciences, Bangor University, Anglesey, United Kingdom, 11 CIIMAR/CIMAR, Centre for Marine and Environmental Research, University of Porto, Porto, Portugal, 12 Seto Marine Biological Laboratory, Kyoto University, Wakayama, Japan Abstract Latitudinal gradients in species abundance and diversity have been postulated for nearshore taxa but few analyses have been done over sufficiently broad geographic scales incorporating various nearshore depth strata to empirically test these gradients. Typically, gradients are based on literature reviews and species lists and have focused on alpha diversity across the entire nearshore zone. No studies have used a standardized protocol in the field to examine species density among sites across a large spatial scale while also focusing on particular depth strata. The present research used field collected samples in the northern hemisphere to explore the relationships between macroalgal species density and biomass along intertidal heights and subtidal depths and latitude. Results indicated no overall correlations between either estimates of species density or biomass with latitude, although the highest numbers of both were found at mid-latitudes. However, when strata were examined separately, significant positive correlations were found for both species numbers and biomass at particular strata, namely the intertidal ones. While the data presented in this paper have some limitations, we show that latitudinal macroalgal trends in species density and biomass do exist for some strata in the northern hemisphere with more taxa and biomass at higher latitudes. Citation: Konar B, Iken K, Cruz-Motta JJ, Benedetti-Cecchi L, Knowlton A, et al. (2010) Current Patterns of Macroalgal Diversity and Biomass in Northern Hemisphere Rocky Shores. PLoS ONE 5(10): e13195. doi:10.1371/journal.pone.0013195 Editor: Simon Thrush, National Institute of Water & Atmospheric Research (NIWA), New Zealand Received May 25, 2010; Accepted September 10, 2010; Published October 7, 2010 Copyright: ß 2010 Konar et al. This is an open-access article distributed under the terms of the Creative Commons Attribution License, which permits unrestricted use, distribution, and reproduction in any medium, provided the original author and source are credited. Funding: Funding was provided by multiple sources, including the Alfred P. Sloan Foundation, the Exxon Valdez Oil Spill Gulf Ecosystem Monitoring Program, Alaska Sea Grant, the South African Environmental Observation Network (SAEON), the University of Pisa, the Italian Ministry of Education and Research, the History of Marine Populations (HMAP), the Nippon Foundation, the Marine Biodiversity and Ecosystem Functioning Program (MarBEF), the Coastal Biodiversity Lab (Cimar), the West Indian Ocean Marine Science Association (WIOMSA), the Department of Fisheries and Oceans Canada, Suffolk University, the History of the Near Shore (HNS) program, and the Gulf of Maine (GoMA) project. The funders had no role in study design, data collection and analysis, decision to publish, or preparation of the manuscript. Competing Interests: The authors have declared that no competing interests exist. * E-mail: [email protected] Introduction Terrestrial systems have generally shown an increase in species numbers from the poles to the tropics [1]. Likewise, early marine studies confirmed this trend [2,3] and discussed its ecological implications for the marine environment [4]. Since these early studies, others have examined various aspects of latitudinal biodiversity gradients in marine systems, although with varying results, suggesting that while such trends may be general they are not ubiquitous [5–14]. Similar to these general latitudinal studies, some studies have focused on macroalgal biodiversity patterns along latitudinal gradients [15–22]. Early studies on macroalgae suggested that there is no evidence of a latitudinal trend of increasing species numbers towards the tropics [15,18]. In fact, areas of both low and high species richness have been identified at sites throughout temperate and tropical waters. Studies since this early work have reported varying results such as increased species richness at mid latitudes and also towards the equator or decreasing species richness towards the equator [5,16,22,23]. A recent literature review covering 387 sites throughout the Atlantic, Indo-Pacific, and Southern Oceans, which spanned 140u of latitude found that in general, temperate oceans tended to have the highest numbers (350–450) of macroalgal genera, particularly between 110u and 160uE longitude [20]. Interestingly, Kerswell [20] also generally found that the number of algal genera had distinct hotspots, namely around Japan and southern Australia. Other studies have identified hotspots in the Mediterranean, the Philippines [18], the Pacific coast of North America [17], the Atlantic European coast [24], and the Caribbean [24]. The current belief is that while lower species richness occurs at the poles, macroalgae generally exhibit variable species richness patterns in different areas [22]. PLoS ONE | www.plosone.org 1 October 2010 | Volume 5 | Issue 10 | e13195

Welcome message from author
This document is posted to help you gain knowledge. Please leave a comment to let me know what you think about it! Share it to your friends and learn new things together.
Transcript
Current Patterns of Macroalgal Diversity and Biomass inNorthern Hemisphere Rocky ShoresBrenda Konar1*, Katrin Iken1, Juan Jose Cruz-Motta2, Lisandro Benedetti-Cecchi3, Ann Knowlton1,
Gerhard Pohle4, Patricia Miloslavich3, Matt Edwards5, Thomas Trott6, Edward Kimani7, Rafael Riosmena-
Rodriguez8, Melisa Wong9, Stuart Jenkins10, Angelica Silva9, Isabel Sousa Pinto11, Yoshihisa
Shirayama12
1 School of Fisheries and Ocean Sciences, University of Alaska Fairbanks, Fairbanks, Alaska, United States of America, 2 Departamento de Estudios Ambientales, Centro de
Biodiversidad Marina, Universidad Simon Bolivar, Caracas, Venezuela, 3 Department of Biology, University of Pisa, CoNISMa, Pisa, Italy, 4 Atlantic Reference Centre, Huntsman
Marine Science Centre, St. Andrews, New Brunswick, Canada, 5 Biology Department, College of Sciences, San Diego State University, San Diego, California, United States of
America, 6 Department of Biology, Suffolk University, Boston, Massachusetts, United States of America, 7 Kenya Marine and Fisheries Research Institute, Mombasa, Kenya,
8 Programa de Investigacion en Botanica Marina, Departamento de Biologia Marina, Universidad Autonoma de Baja California Sur, La Paz, Baja California Sur, Mexico,
9 Bedford Institute of Oceanography, Dartmouth, Nova Scotia, Canada, 10 School of Ocean Sciences, Bangor University, Anglesey, United Kingdom, 11 CIIMAR/CIMAR, Centre
for Marine and Environmental Research, University of Porto, Porto, Portugal, 12 Seto Marine Biological Laboratory, Kyoto University, Wakayama, Japan
Abstract
Latitudinal gradients in species abundance and diversity have been postulated for nearshore taxa but few analyses havebeen done over sufficiently broad geographic scales incorporating various nearshore depth strata to empirically test thesegradients. Typically, gradients are based on literature reviews and species lists and have focused on alpha diversity acrossthe entire nearshore zone. No studies have used a standardized protocol in the field to examine species density among sitesacross a large spatial scale while also focusing on particular depth strata. The present research used field collected samplesin the northern hemisphere to explore the relationships between macroalgal species density and biomass along intertidalheights and subtidal depths and latitude. Results indicated no overall correlations between either estimates of speciesdensity or biomass with latitude, although the highest numbers of both were found at mid-latitudes. However, when stratawere examined separately, significant positive correlations were found for both species numbers and biomass at particularstrata, namely the intertidal ones. While the data presented in this paper have some limitations, we show that latitudinalmacroalgal trends in species density and biomass do exist for some strata in the northern hemisphere with more taxa andbiomass at higher latitudes.
Citation: Konar B, Iken K, Cruz-Motta JJ, Benedetti-Cecchi L, Knowlton A, et al. (2010) Current Patterns of Macroalgal Diversity and Biomass in NorthernHemisphere Rocky Shores. PLoS ONE 5(10): e13195. doi:10.1371/journal.pone.0013195
Editor: Simon Thrush, National Institute of Water & Atmospheric Research (NIWA), New Zealand
Received May 25, 2010; Accepted September 10, 2010; Published October 7, 2010
Copyright: � 2010 Konar et al. This is an open-access article distributed under the terms of the Creative Commons Attribution License, which permitsunrestricted use, distribution, and reproduction in any medium, provided the original author and source are credited.
Funding: Funding was provided by multiple sources, including the Alfred P. Sloan Foundation, the Exxon Valdez Oil Spill Gulf Ecosystem Monitoring Program,Alaska Sea Grant, the South African Environmental Observation Network (SAEON), the University of Pisa, the Italian Ministry of Education and Research, the Historyof Marine Populations (HMAP), the Nippon Foundation, the Marine Biodiversity and Ecosystem Functioning Program (MarBEF), the Coastal Biodiversity Lab(Cimar), the West Indian Ocean Marine Science Association (WIOMSA), the Department of Fisheries and Oceans Canada, Suffolk University, the History of the NearShore (HNS) program, and the Gulf of Maine (GoMA) project. The funders had no role in study design, data collection and analysis, decision to publish, orpreparation of the manuscript.
Competing Interests: The authors have declared that no competing interests exist.
* E-mail: [email protected]
Introduction
Terrestrial systems have generally shown an increase in species
numbers from the poles to the tropics [1]. Likewise, early marine
studies confirmed this trend [2,3] and discussed its ecological
implications for the marine environment [4]. Since these early
studies, others have examined various aspects of latitudinal
biodiversity gradients in marine systems, although with varying
results, suggesting that while such trends may be general they are
not ubiquitous [5–14]. Similar to these general latitudinal studies,
some studies have focused on macroalgal biodiversity patterns
along latitudinal gradients [15–22].
Early studies on macroalgae suggested that there is no evidence
of a latitudinal trend of increasing species numbers towards the
tropics [15,18]. In fact, areas of both low and high species richness
have been identified at sites throughout temperate and tropical
waters. Studies since this early work have reported varying results
such as increased species richness at mid latitudes and also towards
the equator or decreasing species richness towards the equator
[5,16,22,23]. A recent literature review covering 387 sites
throughout the Atlantic, Indo-Pacific, and Southern Oceans,
which spanned 140u of latitude found that in general, temperate
oceans tended to have the highest numbers (350–450) of
macroalgal genera, particularly between 110u and 160uE longitude
[20]. Interestingly, Kerswell [20] also generally found that the
number of algal genera had distinct hotspots, namely around
Japan and southern Australia. Other studies have identified
hotspots in the Mediterranean, the Philippines [18], the Pacific
coast of North America [17], the Atlantic European coast [24],
and the Caribbean [24]. The current belief is that while lower
species richness occurs at the poles, macroalgae generally exhibit
variable species richness patterns in different areas [22].
PLoS ONE | www.plosone.org 1 October 2010 | Volume 5 | Issue 10 | e13195
Sometimes these patterns show an increase with latitude,
sometimes they decrease, or sometimes they peak at mid-latitudes.
Previous studies on macroalgae have focused on alpha diversity,
which examines macroalgal richness within the full extent of a
single community, typically homogenizing the various depth and/
or intertidal height strata. However, when examining nearshore
latitudinal gradients, it is important to consider the intertidal
height or water depth from where the samples are taken [25]. This
is particularly important for point diversity studies, which focus on
a predetermined subset of species from the total site [26]. Since
macroalgal species typically occupy particular locations (strata)
along a latitudinal gradient, point diversity studies must standard-
ize the strata and the sampling design from which the samples are
taken. For example, south-western Iceland, southern Alaska, and
the Magellanic region all have recognizable species depth
distribution patterns with species diversity increasing seaward in
the intertidal [27]. Hence, point diversity samples taken from the
high intertidal stratum in one region are not comparable to
samples from the low stratum of another region or even of the
same region. Similarly, across the Gulf of Alaska, both species
richness and abundance/biomass displayed depth strata-related
patterns depending on the taxon group being examined [25].
Because of this, it is important to keep intertidal heights and water
depths consistent during latitudinal gradient analyses for point
diversity.
Most of the previous work on spatial patterns of macroalgal
diversity mentioned above was based on non-structured meta-
analyses of the existing literature and available species lists. One of
the main problems with these previous types of studies is that
methodological problems may obscure or artificially impose spatial
trends. A potentially more powerful analysis to examine latitudinal
gradients would be based on standardized sampling protocols to
avoid any biases introduced by varying collection methods. This
also would improve diversity-biomass comparisons if data were
obtained from the same samples. Using a standardized protocol,
however, does introduce its own issues. This is because sites are
not similar as far as size of the dominant species or the overall
dispersion of the various species. Hence, it would be difficult if not
impossible to obtain a true measure of alpha diversity for a
number of sites using a standardized protocol. However, point
diversity lends itself very well to the use of a standardized protocol
because it is only examining a subset of the overall richness within
each site.
Another aspect of macroalgal community organization that is
sometimes explored is the relationship between different diversity-
related attributes. Specifically, the importance of biomass in
predicting species richness has been examined [28–31]. While the
Engelhardt and Ritchie study [30] found higher algal and
macrophyte biomass in mesocosms associated with a greater
macrophyte species richness, Gough et al. [28] showed that
environmental variables explained much more of the variation in
potential species richness than biomass. However, when sites
exposed to extreme environmental conditions were eliminated
from the analysis, biomass became the primary predictor of
realized richness. In Portugal, macroalgal species richness was
found to be significantly correlated with total biomass on intertidal
boulders [31]. An inverse relationship was found in South Africa
where high algal biomass and low species richness along the cool
and warm temperate region of the coastline was linked to
upwelling activity and wave action indices. This influence of
upwelling on macroalgal biomass has been described elsewhere
[32]. Conversely, low algal biomass and high species richness has
been attributed to warmer immersion and emersion temperatures
along the sub-tropical region of the coastline [29]. While these
latter studies have provided some regional knowledge, there have
been few larger scale studies on macroalgal community organi-
zation and diversity-related attributes to make any general
statements regarding diversity/biomass relationships.
In the current paper, we explore the relationships between
macroalgal taxon numbers and their respective biomass with
latitude by depth strata using a standardized sampling design. We
also determine if correlations exist between the number of
macroalgal taxa and biomass with all depths pooled together.
We hypothesize that similar to studies on alpha diversity
[5,16,18,20], species density [33], as a proxy for point diversity,
and macroalgal biomass will show latitudinal trends with higher
numbers in mid latitudes. We also hypothesize that using a
standardized protocol where species richness data are taken from
the same samples as biomass data, we will find that, similar to
others [28–31], macroalgal species richness will be correlated with
total biomass.
Methods
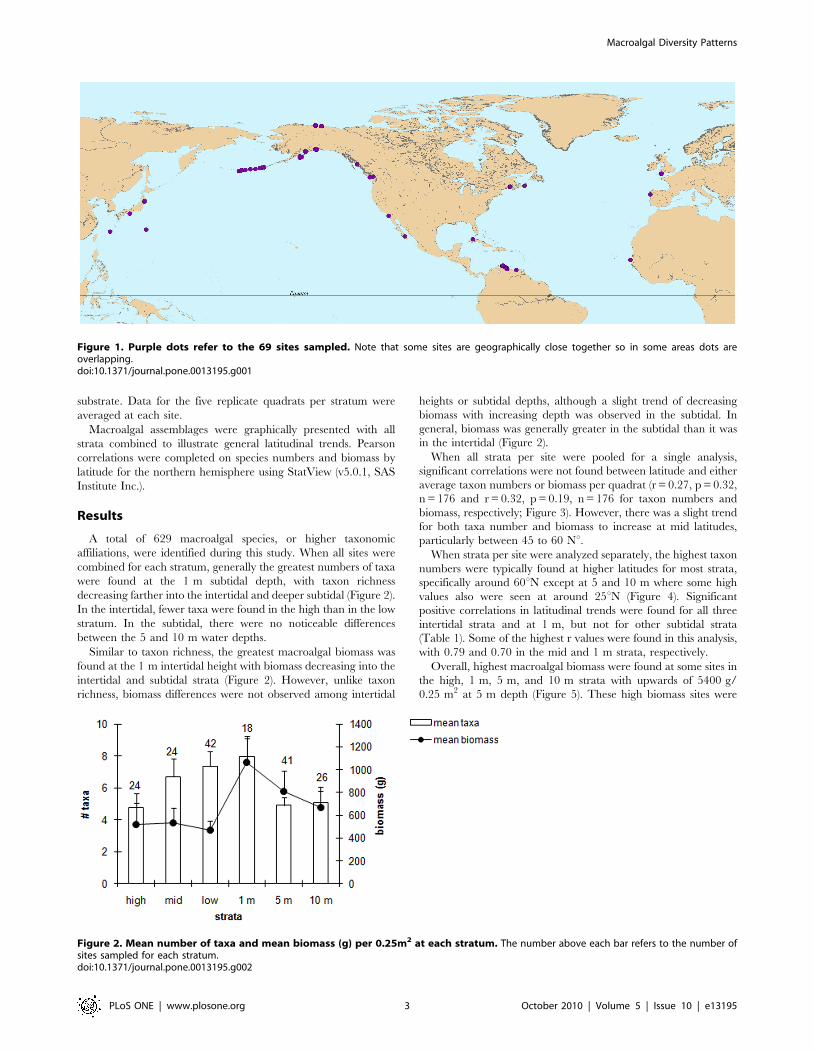
Macroalgal communities were sampled at 69 rocky substrate
sites from approximately 10uN to 60uN latitude (Figure 1,
Supplementary Table S1). Sites were primarily sampled between
2005 and 2009, except in Alaska, USA, where some sites were
sampled in 2003. Although a balanced distribution was attempted,
not all regions were sampled equally and in many regions sites
were spatially clumped. This was an artifact of the location where
researchers involved in this program were based. Several
important regions, such as Asia were not adequately sampled,
while others, such as Alaska were heavily sampled.
Species richness is defined in this paper as point diversity or
species density, where richness describes a subset of the
community [26]. The use of a standardized protocol is an
adequate tool for point diversity comparisons but does not collect
absolute site species richness (alpha diversity). For the purposes of
this study, we wanted sample numbers and sizes to be equal for
our comparisons. All sites were sampled when diversity was
thought to be highest for that site (i.e. when annual species were
present). Most sites had similar structure with a canopy and
understory cover accompanied by algal turf. The standardized
protocol used in this study was developed during a workshop for
the Natural Geography In Shore Areas (NaGISA) program within
the Census of Marine Life initiative [34]. The NaGISA protocol
uses a stratified random sampling design at each site in which five
replicate random samples are taken along a 30–50 m horizontal
transect at the high, mid, and low intertidal strata and 1 m, 5 m,
and 10 m below MLLW. Five samples were deemed the best
compromise between sufficient replication and practicality of
sampling multiple depth strata at each site, especially when the
focus of the comparison is point diversity and not alpha diversity.
Intertidal heights were determined based on prevailing biobands
for that region, such as barnacles, red algae, and brown algae that
often typify the high, mid, and low zone, respectively. Not all strata
were sampled at all sites because some sites did not have all strata.
For example, only the 5 m depth stratum was sampled in the
Arctic Beaufort Sea as this is the only depth with hard substrate for
macroalgal growth. At each stratum at every site, all macroalgae
were removed from within five 50650 cm quadrats along a
horizontal transect line following the stratum. Algae were sorted to
the lowest taxonomic level (usually species) and their wet weights
determined by taxon using an analytical scale with 1g precision.
Taxonomic affinities were verified using the AlgaeBase web site
(www.algaebase.org). All encrusting algae were excluded from this
study because they could not be completely cleared from the
Macroalgal Diversity Patterns
PLoS ONE | www.plosone.org 2 October 2010 | Volume 5 | Issue 10 | e13195
substrate. Data for the five replicate quadrats per stratum were
averaged at each site.
Macroalgal assemblages were graphically presented with all
strata combined to illustrate general latitudinal trends. Pearson
correlations were completed on species numbers and biomass by
latitude for the northern hemisphere using StatView (v5.0.1, SAS
Institute Inc.).
Results
A total of 629 macroalgal species, or higher taxonomic
affiliations, were identified during this study. When all sites were
combined for each stratum, generally the greatest numbers of taxa
were found at the 1 m subtidal depth, with taxon richness
decreasing farther into the intertidal and deeper subtidal (Figure 2).
In the intertidal, fewer taxa were found in the high than in the low
stratum. In the subtidal, there were no noticeable differences
between the 5 and 10 m water depths.
Similar to taxon richness, the greatest macroalgal biomass was
found at the 1 m intertidal height with biomass decreasing into the
intertidal and subtidal strata (Figure 2). However, unlike taxon
richness, biomass differences were not observed among intertidal
heights or subtidal depths, although a slight trend of decreasing
biomass with increasing depth was observed in the subtidal. In
general, biomass was generally greater in the subtidal than it was
in the intertidal (Figure 2).
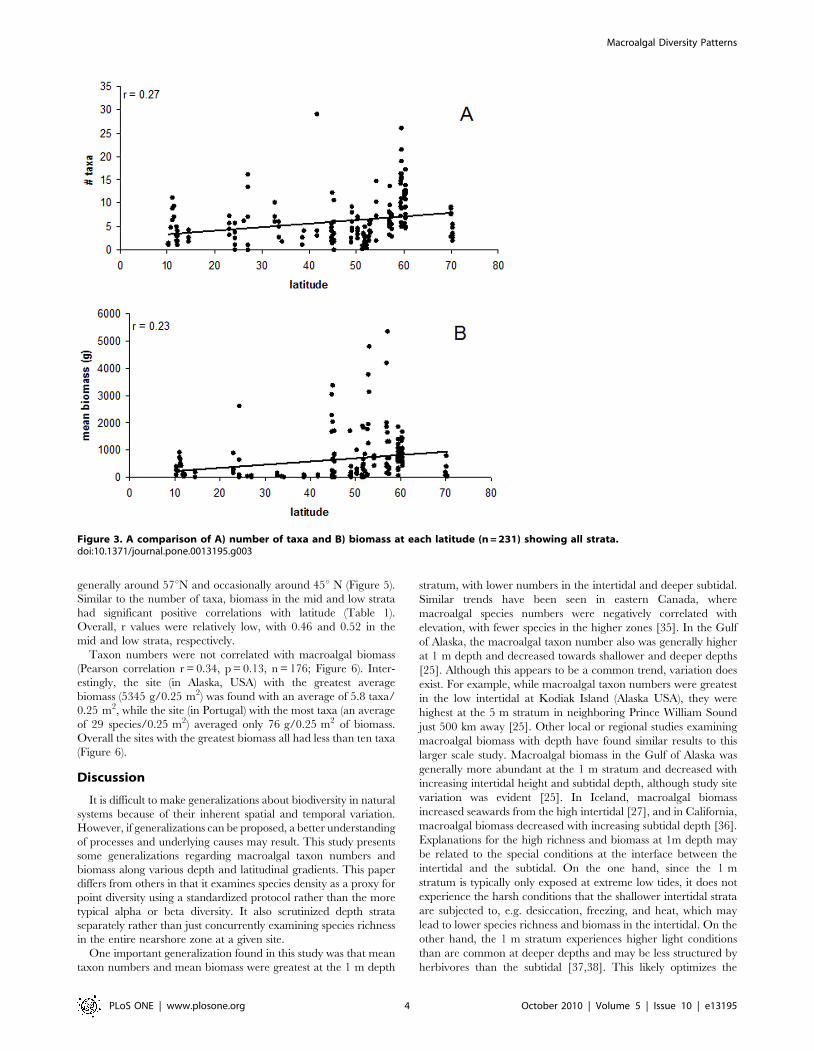
When all strata per site were pooled for a single analysis,
significant correlations were not found between latitude and either
average taxon numbers or biomass per quadrat (r = 0.27, p = 0.32,
n = 176 and r = 0.32, p = 0.19, n = 176 for taxon numbers and
biomass, respectively; Figure 3). However, there was a slight trend
for both taxa number and biomass to increase at mid latitudes,
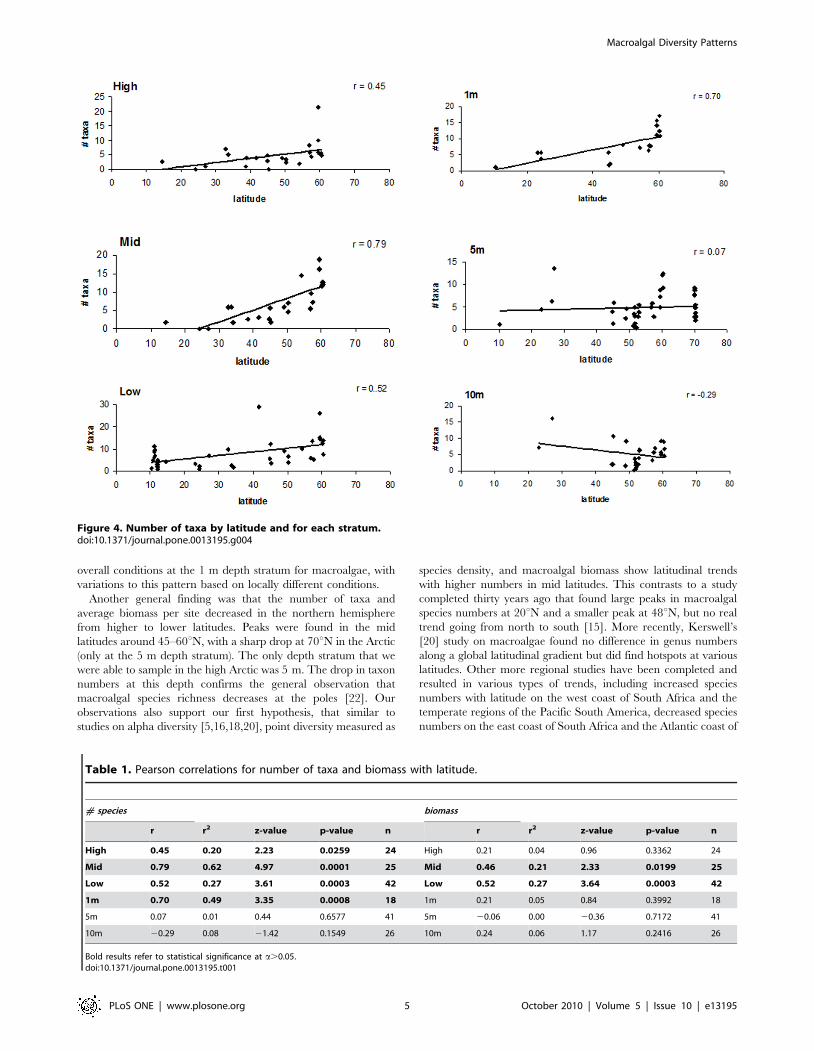
particularly between 45 to 60 Nu.When strata per site were analyzed separately, the highest taxon
numbers were typically found at higher latitudes for most strata,
specifically around 60uN except at 5 and 10 m where some high
values also were seen at around 25uN (Figure 4). Significant
positive correlations in latitudinal trends were found for all three
intertidal strata and at 1 m, but not for other subtidal strata
(Table 1). Some of the highest r values were found in this analysis,
with 0.79 and 0.70 in the mid and 1 m strata, respectively.
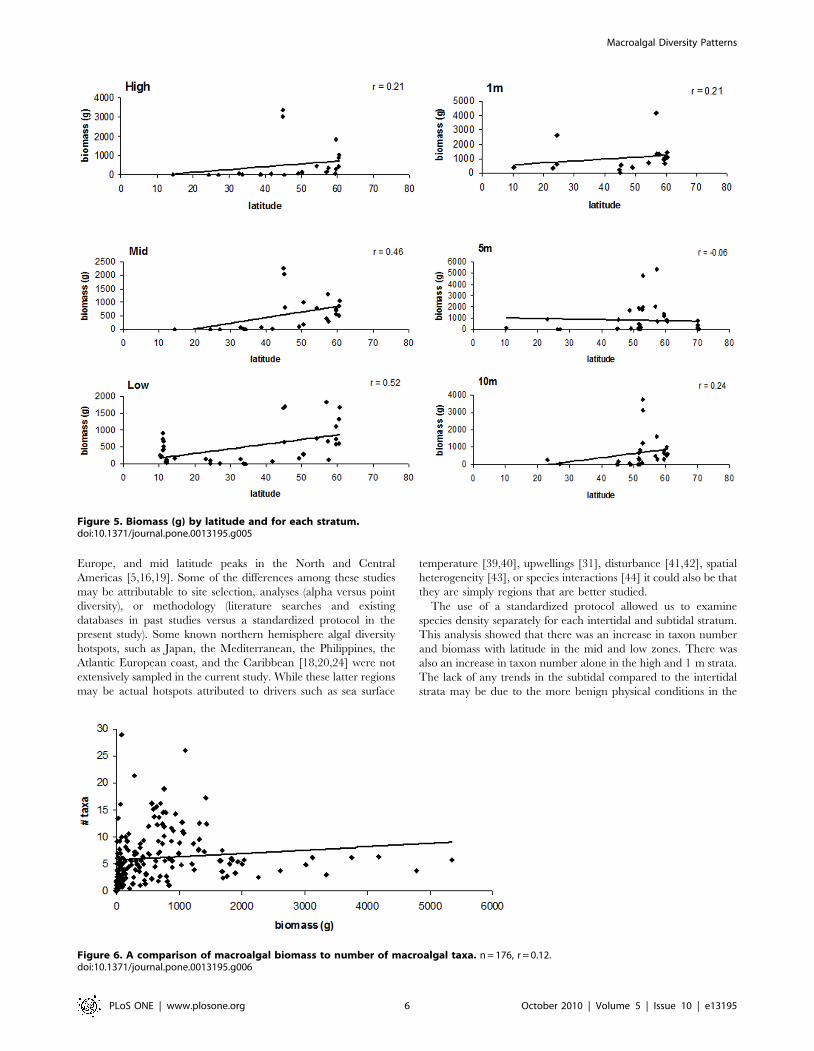
Overall, highest macroalgal biomass were found at some sites in
the high, 1 m, 5 m, and 10 m strata with upwards of 5400 g/
0.25 m2 at 5 m depth (Figure 5). These high biomass sites were
Figure 1. Purple dots refer to the 69 sites sampled. Note that some sites are geographically close together so in some areas dots areoverlapping.doi:10.1371/journal.pone.0013195.g001
Figure 2. Mean number of taxa and mean biomass (g) per 0.25m2 at each stratum. The number above each bar refers to the number ofsites sampled for each stratum.doi:10.1371/journal.pone.0013195.g002
Macroalgal Diversity Patterns
PLoS ONE | www.plosone.org 3 October 2010 | Volume 5 | Issue 10 | e13195
generally around 57uN and occasionally around 45u N (Figure 5).
Similar to the number of taxa, biomass in the mid and low strata
had significant positive correlations with latitude (Table 1).
Overall, r values were relatively low, with 0.46 and 0.52 in the
mid and low strata, respectively.
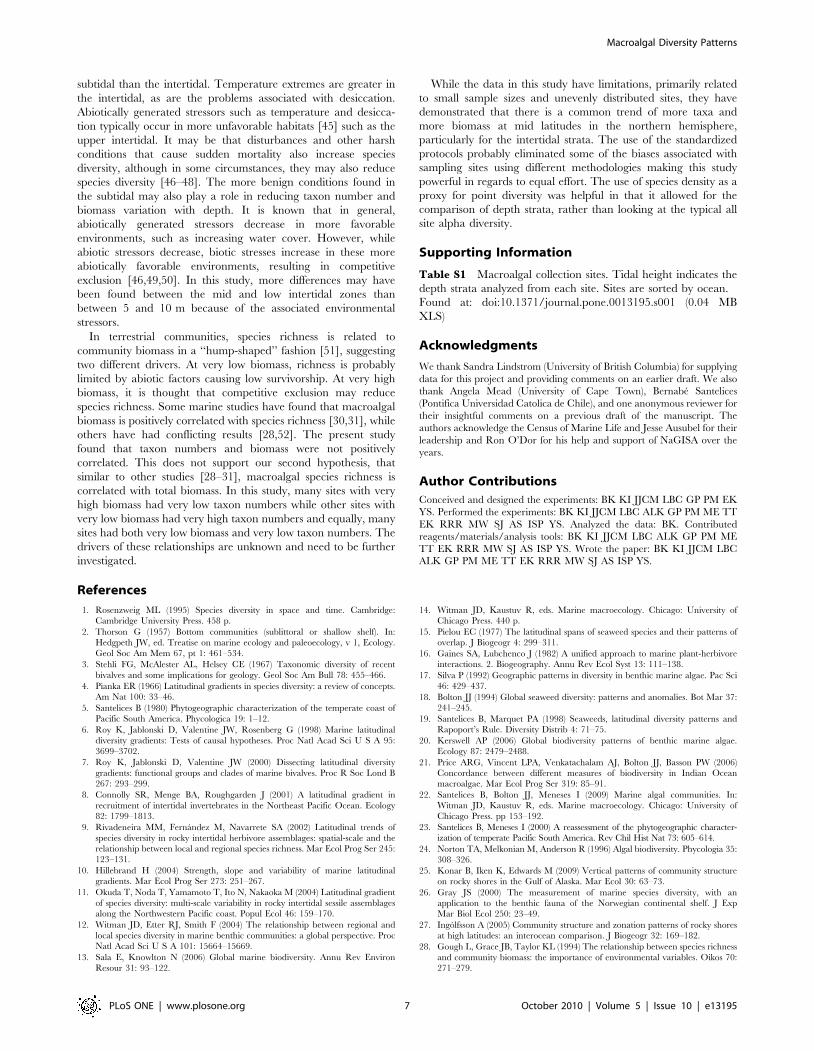
Taxon numbers were not correlated with macroalgal biomass
(Pearson correlation r = 0.34, p = 0.13, n = 176; Figure 6). Inter-
estingly, the site (in Alaska, USA) with the greatest average
biomass (5345 g/0.25 m2) was found with an average of 5.8 taxa/
0.25 m2, while the site (in Portugal) with the most taxa (an average
of 29 species/0.25 m2) averaged only 76 g/0.25 m2 of biomass.
Overall the sites with the greatest biomass all had less than ten taxa
(Figure 6).
Discussion
It is difficult to make generalizations about biodiversity in natural
systems because of their inherent spatial and temporal variation.
However, if generalizations can be proposed, a better understanding
of processes and underlying causes may result. This study presents
some generalizations regarding macroalgal taxon numbers and
biomass along various depth and latitudinal gradients. This paper
differs from others in that it examines species density as a proxy for
point diversity using a standardized protocol rather than the more
typical alpha or beta diversity. It also scrutinized depth strata
separately rather than just concurrently examining species richness
in the entire nearshore zone at a given site.
One important generalization found in this study was that mean
taxon numbers and mean biomass were greatest at the 1 m depth
stratum, with lower numbers in the intertidal and deeper subtidal.
Similar trends have been seen in eastern Canada, where
macroalgal species numbers were negatively correlated with
elevation, with fewer species in the higher zones [35]. In the Gulf
of Alaska, the macroalgal taxon number also was generally higher
at 1 m depth and decreased towards shallower and deeper depths
[25]. Although this appears to be a common trend, variation does
exist. For example, while macroalgal taxon numbers were greatest
in the low intertidal at Kodiak Island (Alaska USA), they were
highest at the 5 m stratum in neighboring Prince William Sound
just 500 km away [25]. Other local or regional studies examining
macroalgal biomass with depth have found similar results to this
larger scale study. Macroalgal biomass in the Gulf of Alaska was
generally more abundant at the 1 m stratum and decreased with
increasing intertidal height and subtidal depth, although study site
variation was evident [25]. In Iceland, macroalgal biomass
increased seawards from the high intertidal [27], and in California,
macroalgal biomass decreased with increasing subtidal depth [36].
Explanations for the high richness and biomass at 1m depth may
be related to the special conditions at the interface between the
intertidal and the subtidal. On the one hand, since the 1 m
stratum is typically only exposed at extreme low tides, it does not
experience the harsh conditions that the shallower intertidal strata
are subjected to, e.g. desiccation, freezing, and heat, which may
lead to lower species richness and biomass in the intertidal. On the
other hand, the 1 m stratum experiences higher light conditions
than are common at deeper depths and may be less structured by
herbivores than the subtidal [37,38]. This likely optimizes the
Figure 3. A comparison of A) number of taxa and B) biomass at each latitude (n = 231) showing all strata.doi:10.1371/journal.pone.0013195.g003
Macroalgal Diversity Patterns
PLoS ONE | www.plosone.org 4 October 2010 | Volume 5 | Issue 10 | e13195
overall conditions at the 1 m depth stratum for macroalgae, with
variations to this pattern based on locally different conditions.
Another general finding was that the number of taxa and
average biomass per site decreased in the northern hemisphere
from higher to lower latitudes. Peaks were found in the mid
latitudes around 45–60uN, with a sharp drop at 70uN in the Arctic
(only at the 5 m depth stratum). The only depth stratum that we
were able to sample in the high Arctic was 5 m. The drop in taxon
numbers at this depth confirms the general observation that
macroalgal species richness decreases at the poles [22]. Our
observations also support our first hypothesis, that similar to
studies on alpha diversity [5,16,18,20], point diversity measured as
species density, and macroalgal biomass show latitudinal trends
with higher numbers in mid latitudes. This contrasts to a study
completed thirty years ago that found large peaks in macroalgal
species numbers at 20uN and a smaller peak at 48uN, but no real
trend going from north to south [15]. More recently, Kerswell’s
[20] study on macroalgae found no difference in genus numbers
along a global latitudinal gradient but did find hotspots at various
latitudes. Other more regional studies have been completed and
resulted in various types of trends, including increased species
numbers with latitude on the west coast of South Africa and the
temperate regions of the Pacific South America, decreased species
numbers on the east coast of South Africa and the Atlantic coast of
Table 1. Pearson correlations for number of taxa and biomass with latitude.
# species biomass
r r2 z-value p-value n r r2 z-value p-value n
High 0.45 0.20 2.23 0.0259 24 High 0.21 0.04 0.96 0.3362 24
Mid 0.79 0.62 4.97 0.0001 25 Mid 0.46 0.21 2.33 0.0199 25
Low 0.52 0.27 3.61 0.0003 42 Low 0.52 0.27 3.64 0.0003 42
1m 0.70 0.49 3.35 0.0008 18 1m 0.21 0.05 0.84 0.3992 18
5m 0.07 0.01 0.44 0.6577 41 5m 20.06 0.00 20.36 0.7172 41
10m 20.29 0.08 21.42 0.1549 26 10m 0.24 0.06 1.17 0.2416 26
Bold results refer to statistical significance at a.0.05.doi:10.1371/journal.pone.0013195.t001
Figure 4. Number of taxa by latitude and for each stratum.doi:10.1371/journal.pone.0013195.g004
Macroalgal Diversity Patterns
PLoS ONE | www.plosone.org 5 October 2010 | Volume 5 | Issue 10 | e13195
Europe, and mid latitude peaks in the North and Central
Americas [5,16,19]. Some of the differences among these studies
may be attributable to site selection, analyses (alpha versus point
diversity), or methodology (literature searches and existing
databases in past studies versus a standardized protocol in the
present study). Some known northern hemisphere algal diversity
hotspots, such as Japan, the Mediterranean, the Philippines, the
Atlantic European coast, and the Caribbean [18,20,24] were not
extensively sampled in the current study. While these latter regions
may be actual hotspots attributed to drivers such as sea surface
temperature [39,40], upwellings [31], disturbance [41,42], spatial
heterogeneity [43], or species interactions [44] it could also be that
they are simply regions that are better studied.
The use of a standardized protocol allowed us to examine
species density separately for each intertidal and subtidal stratum.
This analysis showed that there was an increase in taxon number
and biomass with latitude in the mid and low zones. There was
also an increase in taxon number alone in the high and 1 m strata.
The lack of any trends in the subtidal compared to the intertidal
strata may be due to the more benign physical conditions in the
Figure 5. Biomass (g) by latitude and for each stratum.doi:10.1371/journal.pone.0013195.g005
Figure 6. A comparison of macroalgal biomass to number of macroalgal taxa. n = 176, r = 0.12.doi:10.1371/journal.pone.0013195.g006
Macroalgal Diversity Patterns
PLoS ONE | www.plosone.org 6 October 2010 | Volume 5 | Issue 10 | e13195
subtidal than the intertidal. Temperature extremes are greater in
the intertidal, as are the problems associated with desiccation.
Abiotically generated stressors such as temperature and desicca-
tion typically occur in more unfavorable habitats [45] such as the
upper intertidal. It may be that disturbances and other harsh
conditions that cause sudden mortality also increase species
diversity, although in some circumstances, they may also reduce
species diversity [46–48]. The more benign conditions found in
the subtidal may also play a role in reducing taxon number and
biomass variation with depth. It is known that in general,
abiotically generated stressors decrease in more favorable
environments, such as increasing water cover. However, while
abiotic stressors decrease, biotic stresses increase in these more
abiotically favorable environments, resulting in competitive
exclusion [46,49,50]. In this study, more differences may have
been found between the mid and low intertidal zones than
between 5 and 10 m because of the associated environmental
stressors.
In terrestrial communities, species richness is related to
community biomass in a ‘‘hump-shaped’’ fashion [51], suggesting
two different drivers. At very low biomass, richness is probably
limited by abiotic factors causing low survivorship. At very high
biomass, it is thought that competitive exclusion may reduce
species richness. Some marine studies have found that macroalgal
biomass is positively correlated with species richness [30,31], while
others have had conflicting results [28,52]. The present study
found that taxon numbers and biomass were not positively
correlated. This does not support our second hypothesis, that
similar to other studies [28–31], macroalgal species richness is
correlated with total biomass. In this study, many sites with very
high biomass had very low taxon numbers while other sites with
very low biomass had very high taxon numbers and equally, many
sites had both very low biomass and very low taxon numbers. The
drivers of these relationships are unknown and need to be further
investigated.
While the data in this study have limitations, primarily related
to small sample sizes and unevenly distributed sites, they have
demonstrated that there is a common trend of more taxa and
more biomass at mid latitudes in the northern hemisphere,
particularly for the intertidal strata. The use of the standardized
protocols probably eliminated some of the biases associated with
sampling sites using different methodologies making this study
powerful in regards to equal effort. The use of species density as a
proxy for point diversity was helpful in that it allowed for the
comparison of depth strata, rather than looking at the typical all
site alpha diversity.
Supporting Information
Table S1 Macroalgal collection sites. Tidal height indicates the
depth strata analyzed from each site. Sites are sorted by ocean.
Found at: doi:10.1371/journal.pone.0013195.s001 (0.04 MB
XLS)
Acknowledgments
We thank Sandra Lindstrom (University of British Columbia) for supplying
data for this project and providing comments on an earlier draft. We also
thank Angela Mead (University of Cape Town), Bernabe Santelices
(Pontifica Universidad Catolica de Chile), and one anonymous reviewer for
their insightful comments on a previous draft of the manuscript. The
authors acknowledge the Census of Marine Life and Jesse Ausubel for their
leadership and Ron O’Dor for his help and support of NaGISA over the
years.
Author Contributions
Conceived and designed the experiments: BK KI JJCM LBC GP PM EK
YS. Performed the experiments: BK KI JJCM LBC ALK GP PM ME TT
EK RRR MW SJ AS ISP YS. Analyzed the data: BK. Contributed
reagents/materials/analysis tools: BK KI JJCM LBC ALK GP PM ME
TT EK RRR MW SJ AS ISP YS. Wrote the paper: BK KI JJCM LBC
ALK GP PM ME TT EK RRR MW SJ AS ISP YS.
References
1. Rosenzweig ML (1995) Species diversity in space and time. Cambridge:
Cambridge University Press. 458 p.
2. Thorson G (1957) Bottom communities (sublittoral or shallow shelf). In:
Hedgpeth JW, ed. Treatise on marine ecology and paleoecology, v 1, Ecology.
Geol Soc Am Mem 67, pt 1: 461–534.
3. Stehli FG, McAlester AL, Helsey CE (1967) Taxonomic diversity of recent
bivalves and some implications for geology. Geol Soc Am Bull 78: 455–466.
4. Pianka ER (1966) Latitudinal gradients in species diversity: a review of concepts.
Am Nat 100: 33–46.
5. Santelices B (1980) Phytogeographic characterization of the temperate coast of
Pacific South America. Phycologica 19: 1–12.
6. Roy K, Jablonski D, Valentine JW, Rosenberg G (1998) Marine latitudinal
diversity gradients: Tests of causal hypotheses. Proc Natl Acad Sci U S A 95:
3699–3702.
7. Roy K, Jablonski D, Valentine JW (2000) Dissecting latitudinal diversity
gradients: functional groups and clades of marine bivalves. Proc R Soc Lond B
267: 293–299.
8. Connolly SR, Menge BA, Roughgarden J (2001) A latitudinal gradient in
recruitment of intertidal invertebrates in the Northeast Pacific Ocean. Ecology
82: 1799–1813.
9. Rivadeneira MM, Fernandez M, Navarrete SA (2002) Latitudinal trends of
species diversity in rocky intertidal herbivore assemblages: spatial-scale and the
relationship between local and regional species richness. Mar Ecol Prog Ser 245:
123–131.
10. Hillebrand H (2004) Strength, slope and variability of marine latitudinal
gradients. Mar Ecol Prog Ser 273: 251–267.
11. Okuda T, Noda T, Yamamoto T, Ito N, Nakaoka M (2004) Latitudinal gradient
of species diversity: multi-scale variability in rocky intertidal sessile assemblages
along the Northwestern Pacific coast. Popul Ecol 46: 159–170.
12. Witman JD, Etter RJ, Smith F (2004) The relationship between regional and
local species diversity in marine benthic communities: a global perspective. Proc
Natl Acad Sci U S A 101: 15664–15669.
13. Sala E, Knowlton N (2006) Global marine biodiversity. Annu Rev Environ
Resour 31: 93–122.
14. Witman JD, Kaustuv R, eds. Marine macroecology. Chicago: University of
Chicago Press. 440 p.
15. Pielou EC (1977) The latitudinal spans of seaweed species and their patterns of
overlap. J Biogeogr 4: 299–311.
16. Gaines SA, Lubchenco J (1982) A unified approach to marine plant-herbivore
interactions. 2. Biogeography. Annu Rev Ecol Syst 13: 111–138.
17. Silva P (1992) Geographic patterns in diversity in benthic marine algae. Pac Sci
46: 429–437.
18. Bolton JJ (1994) Global seaweed diversity: patterns and anomalies. Bot Mar 37:
241–245.
19. Santelices B, Marquet PA (1998) Seaweeds, latitudinal diversity patterns and
Rapoport’s Rule. Diversity Distrib 4: 71–75.
20. Kerswell AP (2006) Global biodiversity patterns of benthic marine algae.
Ecology 87: 2479–2488.
21. Price ARG, Vincent LPA, Venkatachalam AJ, Bolton JJ, Basson PW (2006)
Concordance between different measures of biodiversity in Indian Ocean
macroalgae. Mar Ecol Prog Ser 319: 85–91.
22. Santelices B, Bolton JJ, Meneses I (2009) Marine algal communities. In:
Witman JD, Kaustuv R, eds. Marine macroecology. Chicago: University of
Chicago Press. pp 153–192.
23. Santelices B, Meneses I (2000) A reassessment of the phytogeographic character-
ization of temperate Pacific South America. Rev Chil Hist Nat 73: 605–614.
24. Norton TA, Melkonian M, Anderson R (1996) Algal biodiversity. Phycologia 35:
308–326.
25. Konar B, Iken K, Edwards M (2009) Vertical patterns of community structure
on rocky shores in the Gulf of Alaska. Mar Ecol 30: 63–73.
26. Gray JS (2000) The measurement of marine species diversity, with an
application to the benthic fauna of the Norwegian continental shelf. J Exp
Mar Biol Ecol 250: 23–49.
27. Ingolfsson A (2005) Community structure and zonation patterns of rocky shores
at high latitudes: an interocean comparison. J Biogeogr 32: 169–182.
28. Gough L, Grace JB, Taylor KL (1994) The relationship between species richness
and community biomass: the importance of environmental variables. Oikos 70:
271–279.
Macroalgal Diversity Patterns
PLoS ONE | www.plosone.org 7 October 2010 | Volume 5 | Issue 10 | e13195
29. Bustamante RH, Branch GM, Eekhout S (1997) The influence of physical
factors on the distribution and zonation patterns of South African rocky-shorecommunities. S Afr J Mar Sci 18: 119–136.
30. Engelhardt KAM, Ritchie ME (2001) Effects of macrophyte species richness on
wetland ecosystem functioning and services. Nature 411: 687–689.31. Arenas F, Rey F, Sousa Pinto I (2009) Diversity effects beyond species richness:
evidence from intertidal macroalgal assemblages. Mar Ecol Prog Ser 381:99–108.
32. Santelices B (1991) Littoral and sublittoral communtieis of continental Chile.
Chapter 14. In: Mathieson AC, Nienhuis PH, eds. Intertidal and littoralecosystem of the world, Vol 24 in the series ‘‘Ecosystems of the World’’. New
York: Elsevier Scientific Publishing. pp 347–369.33. Gotelli NJ, Colwell RK (2001) Quantifying biodiversity: procedures and pitfalls
in the measurement and comparison of species richness. Ecol Lett 4: 379–391.34. Rigby PR, Iken K, Shirayama Y (2007) Sampling diversity in coastal
communities: NaGISA protocols for seagrass and macroalgal habitats. , Japan:
Kyoto University Press. 145 p.35. Scrosati R, Heaven C (2007) Spatial trends in community richness, diversity,
and evenness across rocky intertidal environmental stress gradients in easternCanada. Mar Ecol Prog Ser 342: 1–14.
36. Aleem AA (1973) Ecology of a kelp bed in southern California. Bot Mar 16:
83–95.37. Markager S, Sand-Jensen K (1992) Light requirements and depth zonation of
marine macroalgae. Mar Ecol Prog Ser 88: 83–92.38. Crain CM, Bertness MD (2006) Ecosystem engineering across environmental
gradients: implications for conservation and management. Bioscience 56:211–218.
39. VanDenHoek C (1982) The distribution of benthic marine algae in relation to
the temperature regulation of their life histories. Biol J Linn Soc 18: 81–144.
40. Blanchette CA, Miner CM, Raimondi PT, Lohse D, Heady KEK, et al. (2008)
Biogeographical patterns of rocky intertidal communities along the Pacific coastof North America. J Biogeogr 35: 1593–1607.
41. Sanders HL (1968) Marine benthic diversity: a comparative study. Am Nat 102:
253–282.42. Connell JH (1978) Diversity in tropical rain forests and coral reefs. Science 199:
1302–1310.43. Valentine JW (2009) Overview of marine biodiversity. In: Witman JD,
Kaustuv R, eds. Marine macroecology. Chicago: University Press. pp 3–28.
44. Sanford E, Bertness MD (2009) Latitudinal gradients in species interactions. In:Witman JD, Kaustuv R, eds. Marine macroecology. Chicago: University of
Chicago Press. pp 357–391.45. Huston MS (2004) Management strategies for plant invasions: manipulating
productivity, disturbance, and competition. Diversity Distrib 10: 167–178.46. Huston MA (1979) A general hypothesis of species diversity. Am Nat 113:
81–101.
47. Huston MA (1994) Biological diversity: the coexistence of species on changinglandscapes. Cambridge: Cambridge University Press. 681 p.
48. Sousa WP (1979) Disturbances in marine intertidal boulder fields, the non-equilibrium maintenance of species diversity. Ecology 60: 1225–1239.
49. Grime JP (1973a) Competitive exclusion in herbaceous vegetation. Nature 242:
344–347.50. Grime JP (1973b) Control of species density in herbaceous vegetation. J Environ
Manage 1: 151–167.51. Grime JP (1979) Plant strategies and vegetation processes. London: Wiley.
222 p.52. Wheeler BD, Giller KE (1982) Species richness of herbaceous fen vegetation in
Broadland Norfolk in relation to the quantity of above-ground plant material.
J Ecol 70: 179–200.
Macroalgal Diversity Patterns
PLoS ONE | www.plosone.org 8 October 2010 | Volume 5 | Issue 10 | e13195
Related Documents